Exhibit 99.3
Management’s Discussion and Analysis
The following Management’s Discussion and Analysis (“MD&A”), dated March 8, 2007, should be read in conjunction with Baytex Energy Trust’s (the “Trust” or “Baytex”) audited consolidated financial statements for the fiscal years ended December 31, 2006 and 2005. Per barrel of oil equivalent (“boe”) amounts have been calculated using a conversion rate of six thousand cubic feet of natural gas to one barrel of oil.
The Trust evaluates performance based on net income and cash flow from operations. Cash flow from operations and cash flow per unit are not measurements based on generally accepted accounting principles (“GAAP”), but are financial terms commonly used in the oil and gas industry. Cash flow represents cash generated from operating activities before changes in non-cash working capital, deferred charges and other assets and deferred credits. The Trust’s determination of cash flow may not be comparable with the calculation of similar measures for other entities. The Trust considers cash flow from operations a key measure of performance as it demonstrates the ability of the Trust to generate the cash flow necessary to fund future distributions to unitholders and capital investments. The most directly comparable measure calculated in accordance with GAAP is cash flow from operating activities, and net income per unit. A reconciliation of net income to cash flow from operations and cash flow from operating activities is shown under Quarterly Information.
The Trust also uses certain key performance indicators and industry benchmarks such as operating netback ("netback"), finding, development and acquisition costs ("FD&A"), recycle ratio and total capitalization to analyze financial and operating performance. These key performance indicators and benchmarks as presented do not have any standardized meaning prescribed by Canadian GAAP and therefore may not be comparable with the calculation of similar measures for other entities.
This MD&A contains forward-looking statements relating to future events or future performance. In some cases, forward-looking statements can be identified by terminology such as "may", "will", "should", "expects", "projects", "plans", "anticipates" and similar expressions. These statements represent management's expectations or beliefs concerning, among other things, future operating results and various components thereof or the economic performance of the Trust. The projections, estimates and beliefs contained in such forward-looking statements necessarily involve known and unknown risks and uncertainties, including the business risks discussed in the MD&A as at and for the years ended December 31, 2006 and 2005, which may cause actual performance and financial results in future periods to differ materially from any projections of future performance or results expressed or implied by such forward-looking statements. Readers should not place undue reliance on any such forward-looking statements, which speak only as of the date they were made. Except where required by securities legislation, the Trust is not obligated to publicly update or revise the forward-looking statements relating to future events or future performance to reflect any change in management’s expectations or events.
Baytex Energy Trust was established on September 2, 2003 under a Plan of Arrangement. The Trust is an open-ended investment trust created pursuant to a trust indenture. Subsequent to the Plan of Arrangement, Baytex Energy Ltd. (the “Company”) is a subsidiary of the Trust.
Prior to the Plan of Arrangement, the consolidated financial statements included the accounts of the Company and its subsidiaries and partnership. After giving effect to the Plan of Arrangement, the consolidated financial statements have been prepared on a continuity of interests basis which recognizes the Trust as the successor to the Company. The consolidated financial statements include the accounts of the Trust and its subsidiaries and have been prepared by management in accordance with Canadian generally accepted accounting principles.
2006 OVERVIEW
The Trust strives to self-sustaining from an operational and financial perspective, relying primarily on internal property development to provide production and reserves replacement. The Trust plans to fund its program along with distributions substantially from internally generated cash flow. During 2006 the Trust executed a successful capital program, replacing 145 percent of production (on a proved plus probable basis) by spending less than 50 percent of cash flow from operations. The Trust also increased its monthly distributions from $0.15 per unit to $0.18 per unit beginning in January 2006.
On March 27, 2006, Baytex commenced trading on the New York Stock Exchange. The NYSE listing is being maintained in conjunction with our listing on the Toronto Stock Exchange, and contributes to providing enhanced liquidity to our unitholders.
On October 31, 2006, the Minister of Finance of Canada announced the “Tax Fairness Plan For Canadians” which included a proposal to tax the distributions made by certain income trusts commencing 2011. This proposal is not yet enacted, and as such, no provision for this new tax has been incorporated in the financial statements and discussion presented herein.
PROPERTY REVIEW
Oil and Natural Gas Properties
The following is a description of our principal oil and natural gas properties on production or under development as at December 31, 2006. Unless otherwise specified, gross and net acres and well count information are as at December 31, 2006. Well counts indicate gross wells, except where otherwise indicated. Production information represents average working interest production, for the year ended December 31, 2006, except where otherwise indicated.
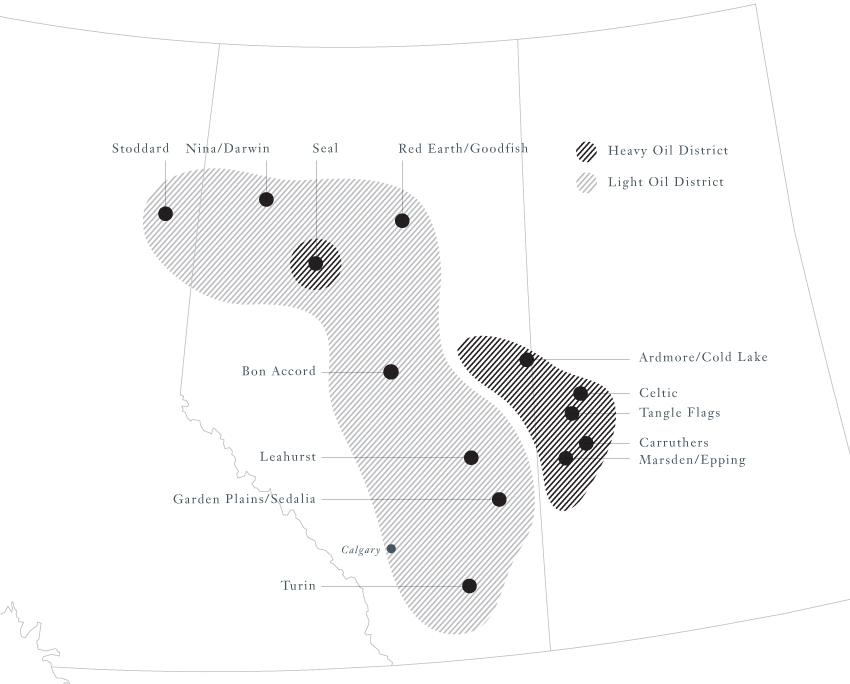
Baytex’s crude oil and natural gas operations are organized into two operating districts: the Heavy Oil District and the Light Oil and Natural Gas District. Each district has an extensive portfolio of operated properties and development prospects with considerable upside potential. Within these districts, Baytex has established a total of nine geographically-organized teams with a full complement of technical professionals (engineers, geoscientists and landmen) within each team. This comprehensive technical approach results in thorough identification and evaluation of exploration, development and acquisition investment opportunities, and cost-efficient execution of those opportunities.
Heavy Oil District
The Heavy Oil District accounts for approximately 60 percent of current production, three-quarters of oil-equivalent reserves and over half of Baytex’s cash flow from operations. Baytex's heavy oil operations consist predominantly of cold primary production, without the assistance of steam injection. In some cases, Baytex's heavy oil reservoirs containing lower-than-average viscosity crudes are waterflooded, occasionally with hot water. Baytex's heavy oil fields often have multiple productive zones, some of which can be commingled within the same producing wellbore. Production is generated from vertical, slant and horizontal wells using progressive cavity pumps capable of handling large volumes of heavy oil combined with gas, water and sand. Initial production from these wells usually averages between 40 and 100 Bbl/d of crude with gravities ranging from 11º to 18º API. Once produced, the oil is trucked or pipelined to markets in both Canada and the United States. Heavy crude is usually blended with a light-hydrocarbon diluent (such as condensate) prior to being introduced into a sales pipeline. The blended crude oil is then sold by Baytex and may be upgraded into lighter grades of crude or refined into petroleum products such as fuel oil, lubricants and asphalt by the crude purchasers. All production rates reported are for heavy crude only, before the addition of diluent.
In 2006, production in the Heavy Oil District averaged approximately 21,300 Bbl/d of heavy oil and 8.8 MMcf/d of natural gas (22,800 Boe/d). Baytex drilled 88 gross (84.2 net) wells in the Heavy Oil District resulting in 79 (75.2 net) oil wells, four (4.0 net) gas wells, three (3.0 net) stratigraphic test wells, and two (2.0 net) dry and abandoned wells, for a success rate of 97.7 percent (97.6 percent net).
The Heavy Oil District possesses a large inventory of development projects within the west-central Saskatchewan, Cold Lake/Ardmore, and Peace River areas. Baytex's ability to generate relatively low-cost replacement production through conventional cold production methods is key to maintaining the Trust's overall production rate. Because of Baytex's large inventory of heavy oil investment projects, the Trust is able to select between a wide range of investments to maintain heavy oil production rates.
Baytex will continue to build value through internal heavy oil property development and selective acquisitions. Future heavy oil development will focus both on the Peace River Oil Sands area and Baytex’s area of historical emphasis around Lloydminster in southwest Sakatchewan and southeast Alberta. Our net undeveloped lands in the Heavy Oil District totaled approximately 294,492 acres at year-end 2006.
Ardmore, Alberta: Acquired in 2002 at a production rate of 2,200 Bbl/d, this property has since been extensively developed in the Sparky, McLaren and Colony formations. Average production during 2006 was approximately 3,100 Bbl/d of oil and 500 Mcf/d of natural gas (3,200 Boe/d). Eleven successful oil wells and no dry holes were drilled in the area during 2006. Baytex anticipates drilling two wells in this area in 2007. In addition, new production techniques, such as cold horizontal well production and cyclic steam injection are being evaluated for the large hydrocarbon resource in this area. Due to extensive Baytex infrastructure in this area, operating expenses in 2006 remained relatively low at approximately $6 per boe. Net undeveloped lands were 41,800 acres at year-end 2006.
Carruthers, Saskatchewan: The Carruthers property was acquired by Baytex in 1997. This property consists of separate "North" and "South" oil pools in the Cummings formation. During 2006, average production was approximately 2,400 Bbl/d of heavy oil and 900 Mcf/d of natural gas (2,500 Boe/d). Although no new wells were drilled in this area in 2006, a significant hot waterflood expansion (up-grading battery treating capacity, conversion of six wells to injection and re-starting 11 producing wells) was completed. Net undeveloped lands were 9,700 acres at year-end 2006.
Celtic, Saskatchewan: This producing property was acquired in October 2005, in a transaction which included approximately 2,000 Bbl/d of Steam Assisted Gravity Drainage (SAGD) production. The SAGD production was divested at the end of 2005, leaving Baytex with purchased cold heavy oil production of 1,600 Bbl/d and 0.9 MMcf/d. As a result of Baytex’s well re-completion and drilling activities, cold production increased to an average of 3,800 Bbl/d of heavy oil and 1.9 MMcf/d of natural gas (4,100 Boe/d) during 2006. (This production number includes Baytex production in the area held prior to the Celtic acquisition). Celtic is a key asset for Baytex because, like the adjacent Tangleflags property, it contains a large resource base within multiple prospective horizons. As a result, the Celtic property provides a multi-year inventory of drilling locations and re-completion opportunities. Also like Tangleflags, the heavy oil at Celtic is relatively highly gas-saturated and the existing infrastructure allows for efficient capture and marketing of co-produced solution gas. In 2007 Baytex expects to drill 20 new wells and re-complete up to 60 existing wells. Net undeveloped lands were 8,700 acres at year-end 2006.
Cold Lake, Alberta: Located on Cold Lake First Nations lands, this heavy oil property was acquired by Baytex in 2001. Production is primarily from the Colony formation. Average oil production during 2006 was approximately 600 Bbl/d, during which time Baytex drilled four oil wells. In 2006, Baytex acquired additional mineral rights to capture deeper producing horizons on 7,680 acres of land on which it already held shallow leases. These new rights are anticipated to ultimately generate up to 15 new drilling locations, and three new wells are planned for 2007. Net undeveloped lands were 15,300 acres at year-end 2006.
Marsden/Epping/Macklin/Silverdale, Saskatchewan: This area of Saskatchewan is characterized by low access costs and generally higher quality crude oil that ranges up to 18 API. Initial per well production rates are typically 40 to 70 Bbl/d. Primary recovery factors can be as high as 30 percent of the original oil in-place because of the relatively high oil gravity and the existence of strong water drive in many of the oil pools in this area. Average oil production in this area during 2006 was approximately 4,200 Bbl/d and 950 Mcf/d (4,400 Boe/d). Eleven oil wells were drilled in 2006. During 2007, nine new wells are planned for this area, as well as an expansion of the solution gas sales facility at Macklin. Net undeveloped lands were 19,300 acres at year-end 2006.
Seal, Alberta: Seal is a highly prospective property located in the Peace River Oil Sands area of northern Alberta. Baytex holds a 100 percent working interest in over 100 sections of long-term oil sands leases. In certain parts of this land base, heavy oil can be produced through primary methods using horizontal wells at initial rates of approximately 150 Bbl/d per well, without employing more capital-intensive methods such as steam injection. During 2006, Baytex drilled three new stratigraphic test wells to identify extensions to our current development area located on the western block of these land holdings. In this area, Baytex also drilled two new horizontal producing wells, bringing the total number of producing wells to eight. Average production rate during 2006 was 550 Bbl/d of heavy oil. Baytex plans to drill four additional stratigraphic test wells and up to 18 horizontal producing wells at Seal during 2007. Baytex is also core-testing and conducting numerical reservoir simulation of both waterflood and cyclic steam recovery methods for Seal. Both of these processes have the potential to greatly increase ultimate recovery factor beyond what is achievable with primary recovery. We anticipate conducting a steam injection field test by 2008 or earlier. Operators of adjoining lands are also pursuing aggressive development programs that will contribute to vital infrastructure and allow enhanced marketing solutions for the region. As the region continues to develop, the Seal property will take an increasingly more prominent role in the Trust's production profile. Net undeveloped lands in this area were 66,200 acres at year-end 2006.
Tangleflags, Saskatchewan: Baytex acquired the Tangleflags property in 2000. Tangleflags is characterized by multiple-zone reservoirs with production from the Colony, McLaren, Waseca, Sparky, General Petroleum and Lloydminster formations. Accordingly, this property supplies long-term development potential through a considerable number of uphole re-completion opportunities. In 2006, 24 wells were either re-started or re-completed. Average production during 2006 was approximately 2,200 Bbl/d of heavy oil and 1.0 MMcf/d of natural gas (2,300 Boe/d). In 2007, Baytex plans to drill two new wells and re-complete about 30 existing wells in Tangleflags. Net undeveloped lands were 8,300 acres at year-end 2006.
Light Oil and Natural Gas District
Although Baytex is best known as a "heavy oil" energy trust, we also possess a growing array of light oil and natural gas properties that generate nearly half of our cash flow. In addition to Baytex’s historical light oil and natural gas properties in northern and southeastern Alberta, the geographic scope of our light oil and gas operations has expanded to southwest Alberta and northeast British Columbia, providing exposure to some of the most prospective areas in Western Canada.
The Light Oil and Natural Gas District produces light and medium gravity crude oil, natural gas and natural gas liquids from various fields in Alberta and British Columbia. During 2006, production from this district averaged 47 MMcf/d of natural gas sales and 3,700 Bbl/d of light oil and NGLs for annual average oil equivalent production of 11,500 Boe/d. In 2006, the Light Oil and Natural Gas District drilled 40 (33.4 net) wells resulting in 17 (14.1 net) gas wells, 19 (16.1 net) oil wells, and four (3.2 net) dry wells for a success rate of 90 percent (90.4 percent net). Our net undeveloped lands in this business unit were approximately 323,643 acres at year-end 2006.
Bon Accord, Alberta: This multi-zone property was acquired by Baytex in 1997. Production, which is from the Belly River, Viking and Mannville formations, averaged approximately 4.3 MMcf/d of sales gas and 300 Boe/d of light oil (1,000 Boe/d) during 2006. Natural gas is processed at two Company-operated plants and oil is treated at three Company-operated batteries. During 2006, Baytex drilled three gas wells and two oil wells in this area. At year-end 2006, Baytex had 21,400 net undeveloped acres in this area.
Darwin/Nina, Alberta: Both properties in this winter-access area produce natural gas from the Bluesky formation. Natural gas production is processed at two Company-operated gas plants. Production during 2006 averaged approximately 3.5 MMcf/d (600 Boe/d). During 2006, Baytex drilled three gas wells in this area. Baytex plans to install an amine facility at Darwin during 2007 to remove carbon dioxide from sales gas and improve operating capability and product netback for the area. At year-end 2006, Baytex had 44,700 net undeveloped acres in this area.
Leahurst, Alberta: Production averaged approximately 3.7 MMcf/d (600 Boe/d) sales gas in 2006 from this multi-zone, year-round access area. Natural gas from the Edmonton, Belly River, Viking and Mannville formations is processed at several plants, one of which is Company-operated. During 2006, Baytex drilled one gas well and one abandoned well in this area. During 2007, Baytex plans to drill up to six wells in this area. At year-end 2006, Baytex had 15,600 net undeveloped acres in this area.
Richdale/Sedalia, Alberta: In 2001, Baytex acquired its initial position in this area and significantly increased its presence with a 2004 acquisition of a private company. During 2006, production averaged approximately 7.7 MMcf/d of gas (1,300 Boe/d). This area has advantages of year-round access and multi-zone potential in the Second White Specks, Viking and Mannville formations. Most of the gas production from this area is processed at two Company-operated gas plants. During 2006, Baytex drilled four gas wells in this area and plans to drill four to seven additional wells during 2007. At year-end 2006, Baytex had 41,800 net undeveloped acres in this area.
Red Earth/Goodfish, Alberta: This primarily winter-access, multi-zone property was acquired by Baytex in 1997. Oil production from Granite Wash and Slave Point pools is treated at two Company-operated sweet oil batteries. Natural gas production from the Bluesky formation is handled at two gas plants, one of which is Company-operated. Production from this area during 2006 averaged approximately 5.3 MMcf/d sales gas and 700 Bbl/d of hydrocarbon liquids (1,500 Boe/d). During 2006, Baytex drilled two gas wells and one abandoned well in this area. At year-end 2006, Baytex had 33,900 net undeveloped acres in this area.
Turin, Alberta: This multi-zone, year-round access property was acquired in 2004 with the acquisition of a private company. Production during 2006 averaged approximately 700 Bbl/d of oil and NGLs and 1.8 MMcf/d sales gas (1,000 Boe/d). Production is from the Second White Specks, Milk River, Bow Island, Mannville, Sawtooth and Livingstone formations. Oil production is treated at three Company-operated batteries and gas is processed at two outside-operated gas plants. During 2006, Baytex drilled two gas wells and five oil wells in this area. Baytex plans to drill three to six wells in the Turin area during 2007. At year-end 2006, Baytex had 14,600 net undeveloped acres in this area.
Stoddart, British Columbia: The Stoddart asset acquisition was completed in December 2004. Oil and liquids rich gas production from this largely year-round-access area comes from the Doig, Halfway, Baldonnel, Coplin and Bluesky formations. Oil is treated at two Company-operated batteries and natural gas is compressed at four Company-operated sites and sent for further processing at the outside-operated West Stoddart and Taylor Younger plants. Production from this area during 2006 averaged approximately 12.5 MMcf/d sales gas and 1,900 Bbl/d of oil and NGLs (3,900 Boe/d). Baytex drilled nine wells in 2006 resulting in two gas wells, six oil wells and one abandoned well. Baytex plans to drill up to eight wells and re-complete several wells in 2007. At year-end 2006, Baytex had 31,400 net undeveloped acres in this area.
MARKETING
Crude Oil
World crude oil prices rose again in 2006 as moderate demand growth combined with OPEC production cuts, supply disruptions and geopolitical uncertainty drove prices higher. World demand for oil and products grew by a modest 1.1 percent in 2006 compared to 1.4 percent in 2005, reflecting slower growth in North American and European demand offset by renewed strength in Asian demand. Ample crude oil supply was available during the period, but the threat of supply disruptions due to weather, operating problems and geopolitical events resulted in a fear price premium. When it became apparent that the 2006 hurricane season would not be a repeat of the disastrous events of 2005 and inventories of crude oil and products grew, prices which peaked in August began to drift lower.
The decline in prices subsided in October after OPEC’s unexpected announcement that they planned to cut production by 1.2 million barrels per day effective November 1. Geopolitical events again played a role throughout the year as the ongoing conflict in Iraq, unrest in Nigeria, war in Lebanon, politics in Russia and the Iranian nuclear stand-off have left market participants very nervous.
Benchmark West Texas Intermediate (WTI) prices began the year around US$60 per bbl, climbed to an all-time high of US$77.03 in August, and ended the year over US$61. The average price for 2006 was US$66.22 compared to US$56.56 in 2005, an increase of 17 percent. The five-year WTI average is US$44.26 per bbl.
Canadian crude oil prices, while enjoying the strength in world prices, were tempered by the rising Canadian dollar against its U.S. counterpart. Canadian Par crude at Edmonton averaged $72.77 per bbl in 2006, up six percent from $68.75 in 2005. The five-year Canadian par average price is Cdn$55.41 per bbl.
With OPEC cutting oil output late in 2006 to meet their pricing targets, the first volumes shut-in were the lower value medium and heavy sour grades. In addition the huge Cantarell field which supplies most of Mexico’s benchmark Maya export blend is on a steep decline at 10.3 percent through the first half of 2006. This has resulted in reduction in supplies of heavy and medium sour crude oil to the world market, tightening differentials in the latter part of 2006. Canadian heavy oil prices mirrored this trend as the differential between WTI and Lloydminster Blend prices averaged US$22.66 per bbl in 2006 (34 percent of WTI) compared to US$21.82 per bbl in 2005 (39 percent of WTI). The five-year averages are US$14.79 and 32 percent. Our heavy oil prices averaged $43.57 per barrel in 2006, an increase of 17 percent compared to $37.38 in 2005.
Not withstanding all the volatility in underlying index basis and quality price differentials, Baytex’s conventional crude oil and natural gas liquids prices averaged $53.84 per bbl in both 2006 and 2005.
In October 2002, Baytex signed a five-year crude oil supply agreement with Frontier Oil and Refining Company (“Frontier”) of Houston, Texas. The agreement calls for Baytex to deliver 20,000 barrels per day of Lloydminster Blend (“LLB”) quality crude at Hardisty, Alberta for delivery to Guernsey, Wyoming. The blended crude supplied is comprised of approximately 16,000 barrels per day of Baytex raw heavy crude oil and 4,000 barrels per day of purchased condensate used as diluent. Prices are fixed at 71 percent of WTI translating into a LLB quality differential at 29 percent of WTI. This mirrored the long-term average differential dated back to 1986. This contract significantly reduces the volatility of Baytex’s cash flows from heavy crude oil sales.
Baytex has entered into a series of costless collar derivative contracts which will provide significant downside protection on oil price while still allowing us to participate in market upside potential. Contracts have been put in place for 2007 on 8,000 barrels per day at a weighted average price between US$56.88 per bbl to US$82.48 per bbl. No collars have yet been implemented for 2008.
The market and infrastructure solutions for our Seal area remain a work in progress. Management is confident that long term solutions will be developed to allow full-scale field development commencing in 2007.
Natural Gas
Natural gas prices in North America weakened in 2006, reflecting strong supply availability. High oil prices sustained gas values at levels that might have been much lower in a lower alternative energy price environment. U.S. inventories were at historically high levels throughout the year due to low demand and the lack of any supply disruptions as suffered during the 2005 hurricane season. U.S. gas prices, represented by the NYMEX futures contract, averaged US$7.27 per thousand cubic feet (mcf) in 2006, a decrease of 15 percent from US$8.55 in 2005. Daily prices for Alberta gas delivered to the AECO “C” trading hub averaged $6.51/mcf in 2006, down 25 percent from $8.71 in 2005.
The five-year averages are US$6.12 per Mcf for the NYMEX contract, and $6.49 for Alberta daily prices. Baytex received an average of $7.13 per mcf for 2006 natural gas sales compared to $8.22 in 2005.
For 2007 Baytex has entered into several physical forward sales contracts with price collars. Contracted volumes totaled 14.2 MMcf /d during the first quarter of 2007 with an average floor price of $8.44 per Mcf and an average ceiling price of $10.23 per Mcf. Contracts totaling 16.1 MMcf/d for the period of April to October 2007 are also in place with an average floor price of $7.02 per Mcf and an average ceiling price of $9.39 per Mcf.
OPERATIONS
Production The Trust’s average production for fiscal 2006 was 34,292 boe/d compared to 35,177 boe/d for fiscal 2005.
Light oil & NGL production decreased by three percent to 3,735 bbl/d from 3,842 bbl/d for last year. Heavy oil production for 2006 was essentially unchanged at 21,326 bbl/d compared to 21,265 bbl/d in 2005. Natural gas production decreased by eight percent to average 55.4 MMcf/d for 2006 compared to 60.4 MMcf/d for 2005. The decrease in light oil, NGL and natural gas volumes was largely due to delayed timing of certain natural gas tie-ins and natural declines. Heavy oil production increased slightly due to development activities and full-year ownership of the properties at Celtic, offset by the sale of the thermal production at year-end 2005.
Production by Area | Light Oil and NGLs | Heavy Oil | Natural Gas | Oil Equivalent |
| | (bbl/d) | (bbl/d) | (MMcf/d) | (boe/d) |
2006 | | | | |
| Heavy Oil District | - | 21,325 | 8.8 | 22,791 |
| Light Oil and Natural Gas District | 3,735 | - | 46.6 | 11,501 |
Total Production | 3,735 | 21,325 | 55.4 | 34,292 |
| | | | | |
2005 | | | | |
| Heavy Oil District | - | 21,265 | 7.5 | 22,515 |
| Light Oil and Natural Gas District | 3,842 | - | 52.9 | 12,662 |
Total Production | 3,842 | 21,265 | 60.4 | 35,177 |
Revenue Petroleum and natural gas sales for 2006 increased by two percent to $556.7 million from $546.9 million for fiscal 2005. Benchmark WTI crude oil averaged US$66.22 per bbl for 2006, representing a 17 percent increase over the US$56.56 per bbl for 2005. However, the Trust’s realized wellhead prices were reduced by a strengthening Canadian dollar, which averaged US$0.8817 in 2006 compared to US$0.8253 in 2005. The Trust’s light oil and NGLs price remained consistent from prior year at $53.84 per bbl. The heavy oil price increased 17 percent to $43.57 per bbl in 2006 from $37.38 per bbl in 2005. Natural gas prices were 13 percent lower in 2006, averaging $7.13 per Mcf compared to $8.22 per Mcf during the previous year. Overall, after accounting for $2.5 million of realized gain on financial derivative contracts, the Trust averaged $44.68 per boe for 2006, a 15 percent increase from $38.82 per boe received in the prior year.
For 2006, light oil and NGL revenue decreased three percent from the same period last year due to a three percent decrease in production. Revenue from heavy oil increased 17 percent due to increase in wellhead prices. Revenue from natural gas decreased 20 percent compared to 2005, as production decreased eight percent combined with a price decrease of 13 percent.
Gross Revenue Analysis | 2006 | | 2005 |
| | $ thousands | $/Unit (1) | | $ thousands | $/Unit (1) |
| Oil revenue (bbls) | | | | | |
| Light oil & NGL | 73,387 | 53.84 | | 75,507 | 53.84 |
| Heavy oil | 339,066 | 43.57 | | 290,163 | 37.38 |
| Derivative contract gain (loss) | 2,529 | 0.32 | | (48,462) | (6.24) |
| Total oil revenue | 414,982 | 45.38 | | 317,208 | 34.61 |
| Natural gas revenue (Mcf) | 144,236 | 7.13 | | 181,270 | 8.22 |
| Total revenue (boe) | 559,218 | 44.68 | | 498,478 | 38.82 |
(1) Per-unit oil revenue is in $/bbl; per unit natural gas revenue is in $/Mcf.
Royalties For the year ended December 31, 2006, royalties increased to $85.0 million from $81.9 million for last year. Total royalties in 2006 were 15.3 percent of sales, compared to 15.0 percent of sales for 2005. For 2006, royalties were 14.6 percent of sales for light oil and NGL, 14.6 percent for heavy oil and 17.2 percent for natural gas. These rates compared to 15.1 percent, 12.4 percent and 19.0 percent, respectively, for 2005. Royalties are generally based on market index prices realized by the industry in the period, with increasing rates as price and volume escalate. Baytex’s increased effective royalty rate for heavy oil in 2006 was reflective of the higher market price.
Operating Expenses Operating expenses for the year 2006 increased to $112.4 million from $110.6 million in 2005. Operating expenses were $8.98 per boe for 2006 compared to $8.62 per boe for the prior year. In 2006, operating expenses were $11.17 per bbl of light oil and NGL, $9.23 per bbl of heavy oil and $1.25 per Mcf of natural gas compared to $9.06, $9.56 and $1.08, respectively, for the year earlier.
Transportation Expenses Transportation expenses for the year ended December 31, 2006 were $24.3 million compared to $22.4 million for 2005. These expenses were $1.95 per boe in 2006 compared to $1.74 in 2005. Transportation expenses were $2.38 per bbl of oil and $0.13 per Mcf of natural gas in 2006, and $2.11 per bbl of oil and $0.14 per Mcf of natural gas in 2005.
Net Revenue
| | Light oil & NGLs ($/bbl) | Heavy Oil ($/bbl) | Total Oil & NGL ($/bbl) | Natural Gas ($/Mcf) | BOE ($/boe) |
| | 2006 | 2005 | 2006 | 2005 | 2006 | 2005 | 2006 | 2005 | 2006 | 2005 |
Sales price (1) | 53.84 | 53.84 | 43.57 | 37.38 | 45.10 | 39.90 | 7.13 | 8.22 | 44.48 | 42.60 |
| Royalties | (7.84) | (8.13) | (6.37) | (4.63) | (6.59) | (5.17) | (1.23) | (1.57) | (6.80) | (6.38) |
| Operating costs | (11.17) | (9.06) | (9.23) | (9.56) | (9.52) | (9.48) | (1.25) | (1.08) | (8.98) | (8.62) |
| Transportation | (1.16) | (1.16) | (2.60) | (2.28) | (2.38) | (2.11) | (0.13) | (0.14) | (1.95) | (1.74) |
| Net revenue | 33.67 | 35.49 | 25.37 | 20.91 | 26.61 | 23.14 | 4.52 | 5.43 | 26.75 | 25.86 |
(1) Sales price is before realized loss/gain recognized on financial derivative contracts.
General and Administrative Expenses General and administrative expenses for the year were $20.8 million compared to $16.0 million for the prior year. On a per sales unit basis, these expenses were $1.67 per boe in 2006 and $1.25 per boe in 2005. The increase is attributable to escalating costs in the labour market, additional expenses associated with the New York Stock Exchange listing and costs relating to compliance requirements under the Sarbanes-Oxley Act. In accordance with our full cost accounting policy, no expenses were capitalized in either 2006 or 2005.
| ($ thousands) | 2006 | 2005 |
| Gross corporate expense | 28,538 | 22,568 |
| Operator’s recoveries | (7,695) | (6,558) |
| Net expenses | 20,843 | 16,010 |
Unit Based Compensation Expense Compensation expense related to the Trust’s unit rights incentive plan was $7.5 million for 2006 compared to $5.3 million for 2005.
Compensation expense associated with rights granted under the plan is recognized in income over the vesting period of the plan with a corresponding increase in contributed surplus. The exercise of trust unit rights are recorded as an increase in trust units with a corresponding reduction in contributed surplus.
Until July 1, 2005, the Trust accounted for stock-based compensation based on the intrinsic value of the awards at each reporting date. Effective July 1, 2005, on a prospective basis, the trust began valuing options using the fair value based method. In the fourth quarter of 2005, the trust determined that the fair value methodology should have been applied to all grants since CICA 3870 was adopted, and the financial statements of prior periods have been restated accordingly.
Interest Expense In 2006, interest expense was $35.0 million compared to $33.1 million for last year. The increase is attributable to a gradual increase in interest rates partially offset by the decrease in outstanding convertible debentures and the effect of a stronger Canadian dollar on U.S. dollar denominated interest expense.
Foreign Exchange The foreign exchange gain for 2006 was $0.1 million compared to $6.8 million in the prior year. The 2006 gain is based on the translation of the U.S. dollar denominated long-term debt at 0.8581 at December 31, 2006 compared to 0.8577 at December 31, 2005. The 2005 gain is based on translation at 0.8577 at December 31, 2005 compared to 0.8308 at December 31, 2004.
Depletion, Depreciation and Accretion Depletion, depreciation and accretion decreased to $152.6 million for 2006 compared to $167.1 million for last year. This decrease is due to a lower depletion rate resulting from the full year impact of low-cost proved reserves added from the Celtic acquisition in the fourth quarter of 2005 and development activities during 2006. On a sales-unit basis, the provision for the current year was $12.19 per boe compared to $13.02 per boe for 2005.
Taxes Current tax expenses were $8.4 million for 2006 compared to $8.7 million last year. The current tax expense is comprised of $8.2 million of Saskatchewan Capital Tax, a recovery of $0.4 million of Large Corporation Tax and $0.6 million prior period adjustment compared to $6.9 million of Saskatchewan Capital Tax and $1.8 million of Large Corporation Tax in 2005.
The fiscal 2006 provision for future income taxes was a recovery of $41.1 million compared to a recovery of $7.1 million for the prior year. The future income tax recovery for 2006 reflected federal legislation introduced decreasing the taxation rates on resource income.
Canadian Tax Pools
| ($thousands) | 2006 | 2005 |
| Cumulative Canadian Exploration Expense | 9,803 | 4,953 |
| Cumulative Canadian Development Expense | 124,111 | 129,596 |
| Cumulative Canadian Oil and Gas Property Expense | 164,781 | 162,974 |
| Undepreciated Capital Cost | 199,504 | 179,009 |
| Other | 28,633 | 31,087 |
| Total tax pools | 526,832 | 507,619 |
Cash Flow from Operations Cash flow from operations in 2006 increased 21 percent to $274.7 million from $227.5 million for the previous year. On a barrel of oil equivalent basis, cash flow from operations was $21.94 for 2006 compared to $17.72 for 2005. The increase is due to higher sales revenue and a lower realized loss from financial derivative contracts in 2005.
Cash Flow Netbacks | 2006 | 2005 |
| | $/boe | Percent | $/boe | Percent |
| Production revenue | 44.48 | 100 | 42.60 | 100 |
| Derivative contract loss | 0.20 | - | (3.77) | (9) |
| Royalties | (6.79) | (15) | (6.38) | (15) |
| Operating expenses | (8.98) | (20) | (8.62) | (20) |
| Transportation | (1.95) | (4) | (1.74) | (4) |
| Operating netback | 26.96 | 61 | 22.09 | 52 |
| General and administrative expenses | (1.67) | (4) | (1.25) | (3) |
| Interest expense | (2.68) | (6) | (2.44) | (6) |
| Current income taxes | (0.67) | (2) | (0.68) | (1) |
| Cash flow netback | 21.94 | 49 | 17.72 | 42 |
Net Income Net income for 2006 was $147.1 million compared to $79.9 million for 2005. The increase was attributable to the elimination of realized loss from financial derivatives, lower depletion and depreciation, and a higher future income tax recovery.
Capital Expenditures Capital expenditures during 2006 totaled $133.1 million, with $132.4 million spent on exploration and development activities and $0.7 million spent on acquisitions net of dispositions of assets.
For the year ended December 31, 2006, the Trust participated in the drilling of 128 (117.6 net) wells, resulting in 98 (91.3 net) oil wells, 21 (18.1 net) gas wells, three (3.0 net) stratigraphic test wells and six (5.2 net) dry holes compared to prior year activities of 118 (107.3 net) wells, including 64 (60.4 net) oil wells, 41 (34.4 net) gas wells, four (4.0 net) stratigraphic test wells and nine (8.5 net) dry holes.
| | Year Ended December 31 |
| ($ thousands) | 2006 | | 2005 |
| Land | 11,118 | | 7,126 |
| Seismic | 2,202 | | 4,949 |
| Drilling and completion | 97,273 | | 90,180 |
| Equipment | 19,240 | | 23,611 |
| Other | 2,548 | | 4,626 |
| Total exploration and development | 132,381 | | 130,492 |
| Property acquisitions | 1,530 | | 70,986 |
| Property dispositions | (828) | | (49,029) |
| Total capital expenditures | 133,083 | | 152,449 |
In October 2005, Baytex purchased 3,500 boe/d of mainly heavy oil production at Celtic for $69 million. In December, a portion of the properties acquired with production through thermal operations was sold for $45.3 million.
Liquidity and Capital Resources At December 31, 2006, total net debt (including working capital, but excluding notional mark-to-market assets and liabilities) was $366.8 million compared to $423.7 million at December 31, 2005. The decrease in total debt at year-end 2006 is primarily due to a total of $57.5 million of convertible debentures having been tendered for conversion during the year. As at December 31, 2006, $80.4 million principal amount of the original $100 million of convertible debentures have been tendered for conversion into trust units.
The Company has a credit agreement with a syndicate of chartered banks. The credit facilities consist of an operating loan and a 364-day revolving loan. Advances under the credit facilities or letters of credit can be drawn in either Canadian or U.S. funds and bear interest at the agent bank’s prime lending rate, bankers’ acceptance rates plus applicable margins or LIBOR rates plus applicable margins. The facilities aggregating $300 million are subject to semi-annual review and are secured by a floating charge over all of the Company’s assets. At December 31, 2006 a total of $127.5 million had been drawn under the credit facilities.
The Company has US$179.7 million of 9.625 percent senior subordinated notes due July 15, 2010. These notes are unsecured and are subordinate to the Company’s bank credit facilities. The Company has entered into an interest rate swap contract converting the fixed rate to a floating rate reset quarterly at the three month LIBOR rate plus 5.2 percent until the maturity of these notes.
Pursuant to various agreements with Baytex's creditors, we are restricted from making distributions to Unitholders where the distribution would or could have a material adverse effect on the Trust or its subsidiaries' ability to fulfill its obligations under Baytex's credit facilities. The Trust believes that cash flow generated from operations, together with the existing bank facilities, will be sufficient to finance current operations, distributions to the unitholders and planned capital expenditures for the ensuing year. The timing of most of the capital expenditures is discretionary and there are no material long-term capital expenditure commitments.
Unitholders’ Equity The Trust is authorized to issue an unlimited number of trust units. On October 18, 2004, the Trust implemented a Distribution Reinvestment Plan (“DRIP”). Under the DRIP, Canadian unitholders are entitled to reinvest monthly cash distributions in additional trust units of the Trust. At the discretion of the Trust, these additional units may be issued at 95 percent of the “weighted average closing price” from treasury, or acquired on the market at prevailing market prices. For the purposes of the units issued from treasury, the “weighted average closing price” is calculated as the weighted average trading price of trust units for the period commencing on the second business day after the distribution record date and ending on the second business day immediately prior to the distribution payment date, such period not to exceed 20 trading days. The Trust can also acquire trust units to be issued under the DRIP at prevailing market prices.
Non-controlling Interest The Company is authorized to issue an unlimited number of exchangeable shares. Exchangeable shares can be exchanged (at the option of the holder) into trust units at any time up to September 2, 2013. Up to 1.9 million exchangeable shares may be redeemed annually by the Company for either cash or the issue of trust units. At December 31, 2006, there were 1.6 million exchangeable shares outstanding. During 2006, 24,000 exchangeable shares were exchanged for trust units. The number of trust units issuable upon exchange is based upon the exchange ratio in effect at the exchange date. The exchange ratio is calculated monthly based on the cash distribution paid divided by the weighted average trust unit price of the five-day trading period ending on the record date. The exchange ratio at December 31, 2006 was 1.51072 trust units per exchangeable share (December 31, 2005 - 1.37201 trust units per exchangeable share). Cash distributions are not paid on the exchangeable shares. The exchangeable shares are not publicly traded, although they may be transferred by the holder without first being exchanged to trust units.
The exchangeable shares of the Company are presented as a non-controlling interest on the consolidated balance sheet because they fail to meet the non-transferability criteria necessary for them to be classified as equity. Net income has been reduced by an amount equivalent to the non-controlling interest proportionate share of the Trust’s consolidated net income with a corresponding increase to the non-controlling interest on the balance sheet.
Cash Distributions During 2006 total cash distributions of $2.16 per unit were declared. The monthly cash distribution in 2006 was increased to $0.18 from $0.15 per unit, an amount maintained since the inception of the Trust in September 2003. The 2007 monthly distribution continues at $0.18 per unit.
Off Balance Sheet Arrangements and Contractual Obligations The Trust has assumed various contractual obligations and commitments, as detailed in the table below, in the normal course of operations and financing activities. These obligations and commitments have been considered when assessing the cash requirements in the above discussion of future liquidity.
Contractual Obligations at December 31, 2006 |
| ($thousands) | | Payments Due |
| | Total | Within 1 year | 1-3 years | 4-5 years |
Long term debt | 209,691 | - | - | 209,691 |
Interest payable on long-term debt | 91,662 | 20,185 | 40,371 | 31,106 |
Convertible debentures | 18,906 | - | - | 18,906 |
Interest payable on convertible debentures | 5,100 | 1,275 | 2,550 | 1,275 |
Operating leases | 6,891 | 1,761 | 4,398 | 732 |
Transportation agreements | 3,177 | 2,015 | 1,130 | 32 |
Processing obligations | 9,089 | 4,903 | 4,186 | - |
Total contractual obligations | 344,516 | 30,139 | 52,635 | 261,742 |
Future interest payments related to our bank loan have not been included since future debt levels and interest rates are not known at this time.
The Trust also has ongoing obligations related to the abandonment and reclamation of well sites and facilities which have reached the end of their economic lives. Programs to abandon and reclaim them are undertaken regularly in accordance with applicable legislative requirements.
Risk and Risk Management The exploration for and the development, production and marketing of petroleum and natural gas involves a wide range of business and financial risks, some of which are beyond the Trust’s control. Included in these risks are the uncertainty of finding new reserves, the fluctuations of commodity prices, the volatile nature of interest and foreign exchange rates, and the possibility of changes to royalty, tax and environmental regulations. The petroleum industry is highly competitive and the Trust competes with a number of other entities, many of which have greater financial and operating resources.
The business risks facing the Trust are mitigated in a number of ways. Geological, geophysical, engineering, environmental and financial analyses are performed on new exploration prospects, development projects and potential acquisitions to ensure a balance between risk and reward. The Trust’s ability to increase its production, revenues and cash flow depends on its success in not only developing its existing properties but also in acquiring, exploring for and developing new reserves and production and managing those assets in an efficient manner.
Despite best practice analysis being conducted on all projects, there are numerous uncertainties inherent in estimating quantities of petroleum and natural gas reserves, including future oil and natural gas prices, engineering data, projected future rates of production and the timing of future expenditures. The process of estimating petroleum and natural gas reserves requires substantial judgment, resulting in imprecise determinations, particularly for new discoveries. An independent engineering firm evaluates the Trust’s properties annually to determine a fair estimate of reserves. The Reserves Committee, consisting of qualified members of the Company’s Board of Directors, assists the Board in their annual review of the reserve estimates.
The provision for depletion and depreciation in the financial statements and the ceiling test are based on proved reserves estimates. Any future significant revisions could result in a full cost accounting write-down or material changes to the annual rate of depletion and depreciation.
The financial risks that the Trust is exposed to as part of the normal course of its business are managed, in part, with various financial derivative instruments, in addition to fixed-price physical delivery contracts. The use of derivative instruments is governed under formal internal policies and subject to limits established by the Board of Directors. Derivative instruments are not used for speculative or trading purposes.
The Trust’s financial results can be significantly affected by the prices received for petroleum and natural gas production as commodity prices fluctuate in response to changing market forces. This pricing volatility is expected to continue. As a result, The Trust has a risk management program that may be used to protect the prices of oil and natural gas on a portion of the total expected production. The objective is to decrease exposure to market volatility and ensure the Trust’s ability to finance its distributions and capital program.
The Trust’s financial results are also impacted by fluctuations in the exchange rate between the Canadian dollar and the U.S. dollar. Crude oil and, to a large extent, natural gas prices are based on reference prices denominated in U.S. dollars, while the majority of expenses are denominated in Canadian dollars. The exchange rate also impacts the valuation of the U.S. dollar denominated long-term notes. The related foreign exchange gains and losses are included in net income. There is no plan at this time to fix the exchange rate on any of the Trust’s long-term borrowings.
The Trust is exposed to changes in interest rates as the Company’s banking facilities are based on our lenders’ prime lending rate and short-term Bankers’ Acceptance rates. Changes in interest rates also impact the Company’s interest rate swap contract which converts the fixed interest rate of 9.625 percent on the US$179.7 million notes to a floating rate reset quarterly at the three month LIBOR rate plus 5.2 percent until the maturity of these notes.
The Trust’s current position with respect to its financial derivative contracts is detailed in note 15 of the consolidated financial statements.
A summary of certain risk factors relating to our business is included in our Annual Information Form under the Risk Factors section.
CRITICAL ACCOUNTING POLICIES
A summary of Baytex’s significant accounting policies can be found in Notes 1 and 2 to the Consolidated Financial Statements. The preparation of the consolidated financial statements in accordance with generally accepted accounting principles requires management to make judgments and estimates that affect the financial results of the Trust. These critical estimates are discussed below.
Oil And Gas Accounting The Trust follows the full-cost accounting guideline to account for its petroleum and natural gas operations. Under this method, all costs associated with the exploration for and development of petroleum and natural gas reserves are capitalized in one Canadian cost centre. These capitalized costs, along with estimated future development costs, are depleted and depreciated on a unit-of-production basis using estimated proved petroleum and natural gas reserves. By their inclusion in the unit-of-production calculation, reserves estimates are a significant component of the calculation of depletion and depreciation and site restoration expense.
Independent engineers engaged by the Trust use all available geological, reservoir, and production performance data to prepare the reserves estimates. These estimates are reviewed and revised, either upward or downward, as new information becomes available. Revisions are necessary due to changes in assumptions based on reservoir performance, prices, economic conditions, government restrictions and other relevant factors. If reserves estimates are revised downward, net income could be affected by increased depletion and depreciation.
Impairment of Petroleum and Natural Gas Assets Companies that use the full-cost method of accounting for oil and natural gas operations are required to perform a ceiling test each quarter that calculates a limit for the net carrying cost of petroleum and natural gas assets. The net amount at which petroleum and natural gas properties are carried is subject to a cost recovery test (the “ceiling test”). The ceiling test is a two-stage process which is to be performed at least annually. The first stage of the test is a recovery test which compares the undiscounted future cash flow from proved reserves at forecast prices plus the cost less impairment of unproved properties to the net book value of the petroleum and natural gas assets to determine if the assets are impaired. An impairment loss exists when the net book value of the petroleum and natural gas assets exceeds such undiscounted cash flow. The second stage determines the amount of the impairment loss to be recorded. The impairment is measured as the amount by which the net book value of the petroleum and natural gas assets exceeds the future discounted cash flow from proved plus probable reserves at forecast prices. If reserves estimates are revised downward, net income could be affected by any additional depletion and deprecation recorded under the ceiling test calculation and could result in a significant accounting loss for a particular period.
Goodwill As the result of an acquisition in 2004, goodwill of $37.8 million was recorded based on the excess of total consideration paid less the value assigned to the identifiable assets and liabilities acquired. The goodwill balance is assessed for impairment annually at year-end or more frequently if events or changes in circumstances indicate that the asset may be impaired. Impairment is charged to income in the period in which it occurs. The Trust has determined that there was no goodwill impairment as of December 31, 2006.
Asset Retirement Obligations The amounts recorded for asset retirement obligations were estimated based on the Trust’s net ownership interest in all wells and facilities, estimated costs to abandon and reclaim the wells and the facilities and the estimated time period during which these costs will be incurred in the future. Any changes to these estimates could change the amount recorded for asset retirement obligations and may materially impact the consolidated financial statements of future periods.
Future Income Taxes The Trust is a unit trust for income tax purposes, and is taxable on taxable income not allocated to the unitholders. From inception on September 2, 2003, the Trust has allocated all of its taxable income to the unitholders, and accordingly, no provision for income taxes is required at the Trust level.
The Company is subject to corporate income taxes and follows the liability method of accounting for income taxes. Under this method, future income taxes are recorded for the effect of any difference between the accounting and income tax basis of an asset or liability, using substantially enacted income tax rates. Future tax balances are adjusted for any changes in the tax rate and the adjustment is recognized in income in the period that the rate change occurs.
Unit-based Compensation The Trust Unit Rights Incentive Plan is described in note 10 to the Consolidated Financial Statements. The exercise price of the rights granted under the Plan may be reduced in future periods in accordance with the terms of the Plan. The Trust uses the binomial-lattice model to calculate the estimated fair value of the outstanding rights.
Compensation expense associated with rights granted under the plan is recognized in income over the vesting period of the plan with a corresponding increase in contributed surplus. The exercise of trust unit rights are recorded as an increase in trust units with a corresponding reduction in contributed surplus.
NEW ACCOUNTING PRONOUNCEMENTS
Financial Instruments Effective January 1, 2007, the Trust will be required to adopt the Canadian Institute of Chartered Accountants (“CICA”) Section 1530 “Comprehensive Income”, Section 3251 “Equity”, and Section 3855 “Financial Instruments - Recognition and Measurement”. It is also the Trust’s intention to early adopt Section 3862 “Financial Instruments - disclosure” and Section 3863 “Financial Instruments - presentation” in place of Section 3861 “Financial Instruments - disclosure and presentation”. Under the new standards a new financial statement, Consolidated Statement of Other Comprehensive Income, has been introduced that will provide for certain gains and losses, such as changes in fair value of hedging instruments, to be temporarily recorded outside the income statement. All financial instruments including derivatives, are to be included on a company’s balance sheet and measured, either at their fair values or, in limited circumstances when fair value may not be considered most relevant, at cost or amortized costs. The standards also provide guidance on when gains and losses as a result of changes in fair values are to be recognized in the income statement. In addition, the requirements for hedge accounting have been clarified under the new standards. The Company is assessing the impact on its Consolidated Financial Statements.
A new location for recognizing certain gains and losses - other comprehensive income - has been introduced with the issuance of Section 1530, “Comprehensive Income”. An integral part of the accounting standards on recognition and measurement of financial instruments is the ability to present certain gains and losses outside net income, in other Comprehensive Income. This standard requires that a company should present comprehensive income and its components in a financial statement displayed with the same prominence as other financial statements that constitute a complete set of financial statements, in both annual and interim financial statements. Exchange gains and losses arising from the translation of the financial statements of a self-sustaining foreign operation, previously recognized in a separate component of shareholders’ equity, in accordance with Section 1650, “Foreign Currency Translation”, will now be recognized in a separate component of other comprehensive income.
These three new Handbook Sections are effective date for annual and interim periods in fiscal years beginning on or after October 1, 2006. The Trust is evaluating the impact the adoption of these new standards will have on its consolidated financial statements.
Capital Disclosures In December 2006, the CICA issued Section 1535 “Capital Disclosures”. Under the new standard, which is effective for fiscal years beginning on or after October 1, 2007, an entity is required to provide additional disclosure about its objectives, policies and process for managing capital. The Trust does not expect application of this new standard to have a material impact on its consolidated financial statements.
Accounting Changes Effective January 1, 2007, the Trust will be required to adopt the CICA Section 1506 “Accounting Changes”. The new standard provides clarification on the criteria for changes in accounting policies as well as the accounting treatment and disclosure of changes in accounting policies, changes in estimates and corrections of errors. The application of this new standard will not have a material impact on the Trust’s consolidated financial statements.
FOURTH QUARTER 2006
The following discussion reviews the Trust’s results of operations for the fourth quarter of 2006.
Production Light oil and NGL production for the fourth quarter of 2006 decreased by nine percent to 3,643 bbl/d from 4,022 bbl/d a year earlier. Heavy oil production decreased seven percent to 22,416 bbl/d for the fourth quarter of 2006 compared to 24,051 bbl/d a year ago. Natural gas production decreased by 13 percent to 51.4 MMcf/d for the fourth quarter of 2005 compared to 58.9 MMcf/d for the same period last year. The decrease in light oil, NGL and natural gas volumes was largely due to delayed timing of certain natural gas tie-ins and natural decline. The decrease in heavy oil production is attributable to the sale of approximately 2,100 bbls/d of SAGD production at year-end 2005.
Revenue Petroleum and natural gas sales decreased 17 percent to $134.5 million for the fourth quarter of 2006 from $162.4 million for the same period in 2005. Revenue from light oil and NGL for the fourth quarter of 2006 decreased 21 percent from the same period a year ago due to a nine percent decrease in production and a 13 percent decrease in wellhead prices. Revenue from heavy oil increased one percent due to a nine percent increase in wellhead prices offset by a seven percent decrease in production. Revenue from natural gas decreased 43 percent as the result of a 34 percent decrease in wellhead prices and a 13 percent decrease in production. Total royalties decreased to $18.5 million for the fourth quarter of 2006 from $27.3 million in 2005. This decrease is reflective of the decrease in total revenue.
Royalties Total royalties for the fourth quarter of 2006 were 13.8 percent of sales compared to 16.8 percent of sales for the same period in 2005. For the fourth quarter of 2006, royalties were 14.7 percent of sales for light oil and NGL, 12.1 percent for heavy oil and 17.5 percent for natural gas. These rates compared to 16.2 percent, 11.7percent and 24.3 percent, respectively, for the same period last year.
Operating Expenses Operating expenses for the fourth quarter of 2006 decreased to $29.8 million from $33.3 million in the corresponding quarter last year. Operating expenses were $9.36 per boe for the fourth quarter of 2006 compared to $9.55 per boe for the fourth quarter of 2005. For the fourth quarter of 2006, operating expenses were $12.25 per bbl of light oil and NGL, $9.47 per bbl of heavy oil and $1.31 per mcf of natural gas. The operating expenses for the same period a year ago were $6.28, $11.00 and $1.22, respectively.
Transportation Expenses Transportation expenses for the fourth quarter of 2006 were $6.4 million compared to $6.0 million for the fourth quarter of 2005. These expenses were $2.00 per boe for the fourth quarter of 2006 compared to $1.71 for the same period in 2005. Transportation expenses were $2.41 per bbl of oil and $0.12 per mcf of natural gas. The corresponding amounts for 2005 were $2.02 and $0.14, respectively.
General and Administrative Expenses General and administrative expenses for the fourth quarter of 2005 increased to $5.9 million from $4.6 million in 2005. On a per sales unit basis, these expenses were $1.84 per boe for the fourth quarter of 2006 compared to $1.32 per boe for the same period in 2005. The increased costs are due to escalating costs in the labour market, additional expenses associated with the New York Stock Exchange listing and costs relating to compliance requirements under the Sarbanes-Oxley Act. In accordance with our full cost accounting policy, no expenses were capitalized in either the fourth quarter of 2006 or 2005.
Unit Based Compensation Expense Compensation expense related to the Trust’s unit rights incentive plan was $2.2 million for the fourth quarter of 2006 compared to $1.8 million for the fourth quarter of 2005.
Interest Expense Interest expense decreased to $8.8 million for the fourth quarter of 2006 from $9.7 million for the same quarter last year, primarily due to the decreased outstanding balance in convertible debentures and the lower foreign exchange conversion rates.
Foreign Exchange Foreign exchange in the fourth quarter of 2006 was a loss of $9.0 million compared to a loss of $0.9 million in the prior year. The loss is based on the translation of the U.S. dollar denominated long-term debt at 0.8581 at December 31, 2006 compared to 0.8966 at September 30, 2006. The 2005 gain is based on translation at 0.8577 at December 31, 2005 compared to 0.8613 at September 30, 2005.
Depletion, Depreciation and Accretion The provision for depletion, depreciation and accretion at $39.5 million for the fourth quarter of 2006 decreased from $41.6 from the same quarter in 2005. This decrease is due to lower production. On a sales-unit basis, the provision for the current quarter was $12.38 per boe compared to $11.91 per boe for the same quarter in 2005.
Net Income Net income for the fourth quarter of 2006 was $20.0 million compared to $35.2 million for the fourth quarter in 2005. The variance was the result of lower production, lower sales prices, and losses due to foreign exchange which was partially offset by a recovery of future income tax.
Trust Unit Information
At February 28, 2007, the Trust had 75,646,323 units outstanding and the Company had 1,572,153 exchangeable shares outstanding. The exchange ratio at February 28, 2007 was 1.53664 trust units per exchangeable share.
At February 28, 2007, the Trust had $18.5 million convertible unsecured subordinated debentures outstanding which are convertible at the option of the holder at any time into fully paid trust units at a conversion price of $14.75 per unit.
Selected Annual Information
Financial | |
($ thousands, except per unit amounts) | 2006 | 2005 | 2004 |
Revenue | 556,689 | 546,940 | 420,400 |
Net income (1) | 147,069 | 79,876 | 16,764 |
Per unit basic (1) | 2.02 | 1.19 | 0.27 |
Per unit diluted (1) | 1.91 | 1.15 | 0.26 |
Total assets | 1,079,629 | 1,105,567 | 1,104,136 |
Total long-term financial liabilities | 228,597 | 283,565 | 216,583 |
Cash distributions declared per unit | 2.16 | 1.80 | 1.80 |
(1) Net income and net income per unit is after non-controlling interest related to exchangeable shares.
Overall production for 2006 was 34,292 boe per day which represented a three percent decrease from 35,177 boe per day in 2005. Average wellhead prices received during 2006 were $44.48 per boe compared to $42.60 during 2005. Production in 2004 was 34,022 boe per day. Average wellhead prices received in 2004 were $33.75 per boe.
Quarterly Information
| | 2006 | 2005 |
($ thousands, except per unit amounts) | Q4 | Q3 | Q2 | Q1 | Q4 | Q3 | Q2 | Q1 |
| Revenue | 134,541 | 145,754 | 140,163 | 136,231 | 162,356 | 154,930 | 118,379 | 111,275 |
Cash distributions declared per unit | 0.54 | 0.54 | 0.54 | 0.54 | 0.45 | 0.45 | 0.45 | 0.45 |
Reconciliation of Net income to Cash flow from operations: | |
Financial | | | | | |
($ thousands, except per unit amounts) | |
| | | | |
| | | 2006 | 2005 |
| | | Q4 | | | Q3 | | | Q2 | | | Q1 | | | Q4 | | | Q3 | | | Q2 | | | Q1 | |
| | | | | | | | | | | | | | | | | | | | | | | | | | |
Net income (loss) (1) | | $ | 19,988 | | $ | 42,040 | | $ | 56,162 | | $ | 28,879 | | $ | 35,184 | | $ | 39,524 | | $ | 16,779 | | $ | (11,611 | ) |
| | | | | | | | | | | | | | | | | | | | | | | | | | |
| Items not affecting cash: | | | | | | | | | | | | | | | | | | | | | | | | | |
| Unit based compensation | | | 2,168 | | | 1,740 | | | 1,821 | | | 1,731 | | | 1,809 | | | 1,197 | | | 1,048 | | | 1,292 | |
| Amortization of deferred charges | | | 304 | | | 314 | | | 200 | | | 449 | | | 459 | | | 459 | | | 314 | | | 261 | |
Unrealized foreign exchange loss (gain) | | | 8,997 | | | 54 | | | (9,375 | ) | | 216 | | | 864 | | | (11,607 | ) | | 2,879 | | | 1,080 | |
Depletion, depreciation and Accretion | | | 39,488 | | | 38,285 | | | 36,639 | | | 38,167 | | | 41,587 | | | 40,772 | | | 41,497 | | | 43,279 | |
| Accretion on debentures | | | 33 | | | 42 | | | 31 | | | 83 | | | 120 | | | 155 | | | 46 | | | - | |
Unrealized loss (gain) on financial derivatives | | | 408 | | | (11,762 | ) | | 7,527 | | | 6,617 | | | (26,409 | ) | | (9,535 | ) | | (11,066 | ) | | 32,313 | |
| Future income taxes (recovery) | | | (10,167 | ) | | 332 | | | (24,742 | ) | | (6,592 | ) | | 11,088 | | | 5,602 | | | (2,007 | ) | | (21,757 | ) |
| Non-controlling interest | | | 2,300 | | | 885 | | | 1,202 | | | 198 | | | 785 | | | 934 | | | 447 | | | (317 | ) |
Cash flow from operations (2) | | $ | 63,519 | | $ | 71,930 | | $ | 69,465 | | $ | 69,748 | | $ | 65,487 | | $ | 67,501 | | $ | 49,937 | | $ | 44,540 | |
| | | | | | | | | | | | | | | | | | | | | | | | | | |
| Change in non-cash working capital | | | (1,913 | ) | | 7,608 | | | (15,667 | ) | | 914 | | | 3,393 | | | (6,392 | ) | | (208 | ) | | (17,005 | ) |
| Asset retirement expenditures | | | (233 | ) | | (361 | ) | | (746 | ) | | (407 | ) | | (382 | ) | | (233 | ) | | (50 | ) | | (972 | ) |
| Decrease in deferred charges and other assets | | | (409 | ) | | (488 | ) | | (489 | ) | | (489 | ) | | (1,134 | ) | | 401 | | | 228 | | | (472 | ) |
| Cash flow from operating activities | | $ | 60,964 | | $ | 78,689 | | $ | 52,563 | | $ | 69,766 | | $ | 67,364 | | $ | 61,277 | | $ | 49,907 | | $ | 26,091 | |
| | | | | | | | | | | | | | | | | | | | | | | | | | |
Net income (loss)(1) per unit | | | | | | | | | | | | | | | | | | | | | | | | | |
| Basic | | | 0.27 | | | 0.57 | | | 0.77 | | | 0.41 | | | 0.51 | | | 0.59 | | | 0.25 | | | (0.17 | ) |
| Diluted | | | 0.26 | | | 0.54 | | | 0.73 | | | 0.39 | | | 0.47 | | | 0.54 | | | 0.25 | | | (0.17 | ) |
| | | | | | | | | | | | | | | | | | | | | | | | | | |
Cash flow from operations per unit(2) | | | | | | | | | | | | | | | | | | | | | | | | | |
| Basic | | | 0.85 | | | 0.98 | | | 0.96 | | | 0.99 | | | 0.95 | | | 1.00 | | | 0.75 | | | 0.67 | |
| Diluted | | | 1.79 | | | 0.90 | | | 0.88 | | | 0.90 | | | 0.86 | | | 0.89 | | | 0.71 | | | 0.64 | |
| | | | | | | | | | | | | | | | | | | | | | | | | | |
| Cash flow from operating activities per unit | | | | | | | | | | | | | | | | | | | | | |
| Basic | | | 0.81 | | | 1.07 | | | 0.72 | | | 0.99 | | | 0.95 | | | 0.91 | | | 0.75 | | | 0.39 | |
| Diluted | | | 0.78 | | | 0.98 | | | 0.66 | | | 0.90 | | | 0.84 | | | 0.80 | | | 0.69 | | | 0.37 | |
(1) Net income and net income per unit is after non-controlling interest related to exchangeable shares.
(2) The Trust evaluates performance based on net income and cash flow from operations. Cash flow from operations and cash flow per unit are not measurements based on generally accepted accounting principles (“GAAP”), but are financial terms commonly used in the oil and gas industry. Cash flow represents cash generated from operating activities before changes in non-cash working capital, deferred charges and other assets and deferred credits. The Trust’s determination of cash flow may not be comparable with the calculation of similar measures for other entities. The Trust considers it a key measure of performance as it demonstrates the ability of the Trust to generate the cash flow necessary to fund future distributions to unitholders and capital investments.
| | 2006 | | 2005 |
Production | Q4 | Q3 | Q2 | Q1 | | Q4 | Q3 | Q2 | Q1 |
| Light oil and NGLs (bbls/d) | 3,643 | 3,594 | 3,619 | 4,089 | | 4,022 | 4,063 | 3,404 | 3,876 |
| Heavy oil (bbls/d) | 22,416 | 21,325 | 20,413 | 21,134 | | 24,051 | 20,061 | 19,653 | 21,279 |
| Total oil and NGLs (bbls/d) | 26,059 | 24,919 | 24,032 | 25,223 | | 28,073 | 24,124 | 23,058 | 25,155 |
| Natural gas (MMcf/d) | 51.4 | 54.9 | 54.7 | 60.6 | | 58.9 | 63.9 | 59.3 | 59.5 |
| Oil equivalent (boe/d) | 34,631 | 34,074 | 33,154 | 35,319 | | 37,895 | 34,780 | 32,937 | 35,068 |
| | 2006 | | 2005 |
Average Prices | Q4 | Q3 | Q2 | Q1 | | Q4 | Q3 | Q2 | Q1 |
| WTI oil (US$/bbl) | 60.21 | 70.48 | 70.70 | 63.48 | | 60.02 | 63.19 | 53.17 | 49.84 |
| Edmonton par oil ($/bbl) | 64.49 | 79.17 | 78.61 | 68.99 | | 71.18 | 76.51 | 65.76 | 61.44 |
| BTE light oil ($/bbl) | 48.62 | 57.94 | 57.83 | 51.33 | | 55.78 | 59.24 | 53.06 | 46.69 |
| BTE heavy oil ($/bbl) | 41.15 | 48.28 | 47.10 | 37.87 | | 37.75 | 45.39 | 35.71 | 30.83 |
| BTE total oil ($/bbl) | 42.19 | 49.68 | 48.71 | 40.05 | | 40.33 | 47.74 | 38.27 | 33.27 |
| BTE natural gas ($Mcf) | 7.03 | 6.35 | 6.68 | 8.36 | | 10.69 | 8.39 | 7.08 | 6.69 |
| BTE oil equivalent ($/boe) | 42.19 | 46.57 | 46.35 | 42.94 | | 46.48 | 48.54 | 39.53 | 35.21 |
2007 Guidance
Baytex has set a 2007 capital budget of $140 million designed to maintain our production at the same level as 2006, which is expected to average approximately 34,400 boe/d. Sixty percent of this budget has been allocated to our heavy oil operations, with the planned drilling of 78 gross wells including 18 primary horizontal producers in our Seal area in the Peace River oil sands region. Forty percent of this budget has been allocated to our conventional oil and gas operations, with the planned drilling of 41 gross wells. Approximately 35-40 percent of the $140 million capital budget for the year is being incurred in the first quarter, including the drilling of nine horizontal production wells and four stratigraphic test wells at Seal.
Based on the current outlook of commodity prices, cash flow from operations in 2007 is expected to be sufficient to essentially fund the above capital budget and the $0.18 per unit monthly distributions to our unitholders. Baytex will continue to have a strong balance sheet, with total debt of approximately $365 million and over 50 percent of our $300 million secured bank facilities undrawn.
Baytex has entered into the following contracts to provide downside protection to 2007 cash flow while allowing for participation in a high commodity price environment. Baytex will continue to monitor market developments and may enter into additional similar contracts if deemed desirable.
Financial Derivative Contracts
OIL | | | | |
| | Period | Volume | Price | Index |
| Price collar | Calendar 2007 | 2,000 bbl/d | US$55.00 - $83.60 | WTI |
| Price collar | Calendar 2007 | 3,000 bbl/d | US$55.00 - $83.75 | WTI |
| Price collar | Calendar 2007 | 2,000 bbl/d | US$60.00 - $80.40 | WTI |
| Price collar | Calendar 2007 | 1,000 bbl/d | US$60.00 - $80.60 | WTI |
FOREIGN CURRENCY | | |
| | Period | Amount | Floor | Cap |
| Collar | Calendar 2007 | 5,000,000 per month | CAD/US$1.0835 | CAD/US$1.1600 |
INTEREST RATE | | |
| | Period | Principal | Rate |
| Swap | November 2003 to July 2010 | US$179,699,000 | 3-month LIBOR plus 5.2 percent |
Physical Sale Contract
GAS | | | |
| | Period | Volume | Price |
| Price collar | November 1, 2006 to March 31, 2007 | 5,000 GJ/d | $8.00 - $9.45 |
| Price collar | November 1, 2006 to March 31, 2007 | 5,000 GJ/d | $8.00 - $9.50 |
| Price collar | November 1, 2006 to March 31, 2007 | 5,000 GJ/d | $8.00 - $10.15 |
| Price collar | April 1, 2007 to October 31, 2007 | 5,000 GJ/d | $6.65 - $9.15 |
| Price collar | April 1, 2007 to October 31, 2007 | 5,000 GJ/d | $6.65 - $9.30 |
| Price collar | April 1, 2007 to October 31, 2007 | 2,500 GJ/d | $6.65 - $8.25 |
| Price collar | April 1, 2007 to October 31, 2007 | 2,000 GJ/d | $6.65 - $8.30 |
| Price collar | April 1, 2007 to October 31, 2007 | 2,500 GJ/d | $6.65 - $8.73 |
The Trust is exposed to credit-related losses in the event of non-performance by counter-parties to these contracts. See note 15 to the December 31, 2006 consolidated financial statements for description of accounting treatment of these derivative contracts.
Evaluation of Disclosure Controls and Procedures
Raymond Chan, the President and Chief Executive Officer, and Derek Aylesworth, the Chief Financial Officer of Baytex (together the “Disclosure Officers”), are responsible for establishing and maintaining disclosure controls and procedures for Baytex. For the year ended December 31, 2006, the Disclosure Officers evaluated the effectiveness of the disclosure controls and procedures. As a result of this evaluation, the Disclosure Officers have concluded that the disclosure controls and procedures are effective to provide reasonable assurance that all material or potentially material information about the activities of the Trust is made known to them by others within Baytex.
It should be noted that while our Disclosure Officers believe that Baytex's disclosure controls and procedures provide a reasonable level of assurance that they are effective, they do not expect that the disclosure controls and procedures or internal controls over financial reporting will prevent all errors and fraud. A control system, no matter how well conceived or operated, can provide only reasonable, not absolute, assurance that the objectives of the control system are met.
There were no changes in our internal control over financial reporting during the fourth quarter ended December 31, 2006 that materially affected, or are reasonably likely to materially affect, our internal control over financial reporting.
ADDITIONAL INFORMATION
Additional information relating to the Trust, including the Annual Information Form, may be found on SEDAR at www.sedar.com.