Exhibit 99.1
ANNUAL INFORMATION FORM
2020
March 1, 2021
TABLE OF CONTENTS
| Page | |||||
| SELECTED TERMS | |||||
| ABBREVIATIONS | |||||
| CONVERSIONS AND CONVENTIONS | |||||
| SPECIAL NOTES TO READER | |||||
| CORPORATE STRUCTURE | |||||
| DEVELOPMENT OF OUR BUSINESS | |||||
| DESCRIPTION OF OUR BUSINESS | |||||
| PRINCIPAL PROPERTIES | |||||
| STATEMENT OF RESERVES DATA | |||||
| RISK FACTORS | |||||
| INDUSTRY CONDITIONS | |||||
| DIVIDENDS | |||||
| DESCRIPTION OF CAPITAL STRUCTURE | |||||
| RATINGS | |||||
| MARKET FOR SECURITIES | |||||
| DIRECTORS AND OFFICERS | |||||
| AUDIT COMMITTEE INFORMATION | |||||
| LEGAL PROCEEDINGS AND REGULATORY ACTIONS | |||||
| INTEREST OF INSIDERS AND OTHER MATERIAL TRANSACTIONS | |||||
| TRANSFER AGENT AND REGISTRAR | |||||
| MATERIAL CONTRACTS | |||||
| INTERESTS OF EXPERTS | |||||
| ADDITIONAL INFORMATION | |||||
APPENDICES:
APPENDIX A REPORT OF MANAGEMENT AND DIRECTORS ON OIL AND GAS DISCLOSURE
APPENDIX B REPORT ON RESERVES DATA BY INDEPENDENT QUALIFIED RESERVES EVALUATOR
APPENDIX C AUDIT COMMITTEE MANDATE AND TERMS OF REFERENCE
SELECTED TERMS
Capitalized terms in this document have the meanings set forth below:
Entities
Baytex or the Corporation means Baytex Energy Corp., a corporation incorporated under the ABCA.
Baytex Energy means Baytex Energy Ltd., a corporation amalgamated under the ABCA.
Baytex Partnership means Baytex Energy Limited Partnership, a limited partnership, the partners of which are Baytex Energy and Baytex Energy (LP) Ltd.
Baytex USA means Baytex Energy USA, Inc., a corporation organized under the laws of the State of Delaware.
Board or Board of Directors means the board of directors of Baytex.
NYSE means New York Stock Exchange.
OPEC means the Organization of the Petroleum Exporting Countries.
OPEC+ means OPEC plus a number of other oil exporting countries, including Russia.
Raging River means Raging River Exploration Inc.
SEC means the United States Securities and Exchange Commission.
Shareholders mean the holders from time to time of Common Shares.
subsidiary has the meaning ascribed thereto in the Securities Act (Ontario) and, for greater certainty, includes all corporations, partnerships and trusts owned, controlled or directed, directly or indirectly, by us.
TSX means the Toronto Stock Exchange.
we, us and our means Baytex and all its subsidiaries on a consolidated basis unless the context requires otherwise.
Securities and Other Terms
2014 Debt Indenture means the indenture, as amended, among Baytex, as issuer, certain of its subsidiaries, as guarantors, and Computershare Trust Company, N.A., as indenture trustee, dated June 6, 2014.
2020 Debt Indenture means the indenture among Baytex, as issuer, certain of its subsidiaries, as guarantors, and Computershare Trust Company, N.A., as indenture trustee, dated February 5, 2020.
2021 Debentures means the 6.75% series B senior unsecured debentures due February 17, 2021 which were redeemed as of September 13, 2019.
2022 Debentures means the 6.625% series C senior unsecured debentures due July 19, 2022 which were redeemed as of March 5, 2020.
2021 Notes means the 5.125% senior unsecured notes due June 1, 2021 issued by Baytex pursuant to the 2014 Debt Indenture which were redeemed as of February 20, 2020.
 | 1 | |||||||
2024 Notes means the 5.625% senior unsecured notes due June 1, 2024 issued by Baytex pursuant to the 2014 Debt Indenture.
2027 Notes means the 8.750% senior unsecured notes due April 1, 2027 issued by Baytex pursuant to the 2020 Debt Indenture.
ABCA means the Business Corporations Act (Alberta), R.S.A. 2000, c. B-9, as amended, including the regulations promulgated thereunder.
AIF means this annual information form of the Corporation dated March 1, 2021 for the year ended December 31, 2020.
Canadian GAAP means generally accepted accounting principles in Canada, which are consistent with International Financial Reporting Standards as issued by the International Accounting Standards Board.
Common Shares means the common shares of Baytex.
Credit Facilities means our Revolving Credit Facilities and our Term Loan.
CSS means cyclic steam stimulation.
GHG means greenhouse gas.
MD&A means management's discussion and analysis of operating and financial results.
Revolving Credit Facilities means our US$575 million secured covenant-based credit facilities with a syndicate of financial institutions.
SAGD means steam-assisted gravity drainage.
Senior Notes means the 2024 Notes and the 2027 Notes.
Tax Act means the Income Tax Act (Canada), R.S.C. 1985, c. 1 (5th Supp.), as amended, including the regulations promulgated thereunder, as amended from time to time.
Term Loan means our $300 million secured term loan with a syndicate of financial institutions.
Independent Engineering
Baytex Reserves Report means the report of McDaniel dated February 4, 2021 entitled ‘‘Baytex Energy Corp., Evaluation of Petroleum Reserves, Based on Forecast Prices and Costs, As of December 31, 2020’’.
COGE Handbook means the Canadian Oil and Gas Evaluation Handbook maintained by the Society of Petroleum Evaluation Engineers (Calgary Chapter), as amended from time to time.
McDaniel means McDaniel & Associates Consultants Ltd., independent petroleum consultants.
NI 51-101 means National Instrument 51-101 "Standards of Disclosure for Oil and Gas Activities" of the Canadian Securities Administrators.
| 2 | |||||||
Reserves Definitions
Gross means:
(a)in relation to our interest in production and reserves, our interest (operating and non-operating) share before deduction of royalties and without including any of our royalty interests;
(b)in relation to wells, the total number of wells in which we have an interest; and
(c)in relation to properties, the total area of properties in which we have an interest.
Net means:
(a)in relation to our interest in production and reserves, our interest (operating and non-operating) share after deduction of royalty obligations, plus our royalty interest in production or reserves;
(b)in relation to wells, the number of wells obtained by aggregating our working interest in each of our gross wells; and
(c)in relation to our interest in a property, the total area in which we have an interest multiplied by our working interest.
Forecast Prices and Costs are prices and costs that are:
(a)generally acceptable as being a reasonable outlook of the future; and
(b)if, and only to the extent that, there are fixed or presently determinable future prices or costs to which Baytex is legally bound by a contractual or other obligation to supply a physical product, including those for an extension period of a contract that is likely to be extended, those prices or costs rather than the prices and costs referred to in paragraph (a).
Reserves and Reserve Categories
Reserves are estimated remaining quantities of oil and natural gas and related substances anticipated to be recoverable from known accumulations, from a given date forward, based on:
(a)analysis of drilling, geological, geophysical and engineering data;
(b)the use of established technology; and
(c)specified economic conditions (being the Forecast Prices and Costs used in the estimate).
Proved reserves are those reserves that can be estimated with a high degree of certainty to be recoverable. It is likely that the actual remaining quantities recovered will exceed the estimated proved reserves.
Probable reserves are those additional reserves that are less certain to be recovered than proved reserves. It is equally likely that the actual remaining quantities recovered will be greater or less than the sum of the estimated proved plus probable reserves.
The qualitative certainty levels referred to in the definitions above are applicable to individual reserves entities (which refers to the lowest level at which reserves calculations are performed) and to reported reserves (which refers to the highest level sum of individual entity estimates for which reserves are presented). Reported reserves should target the following levels of certainty under a specific set of economic conditions:
(i)at least a 90 percent probability that the quantities actually recovered will equal or exceed the estimated proved reserves; and
| 3 | |||||||
(ii)at least a 50 percent probability that the quantities actually recovered will equal or exceed the sum of the estimated proved plus probable reserves.
A qualitative measure of the certainty levels pertaining to estimates prepared for the various reserves categories is desirable to provide a clearer understanding of the associated risks and uncertainties. However, the majority of reserves estimates will be prepared using deterministic methods that do not provide a mathematically derived quantitative measure of probability. In principle, there should be no difference between estimates prepared using probabilistic or deterministic methods.
Development and Production Status
Each of the reserves categories (proved and probable) may be divided into developed and undeveloped categories:
(a)Developed reserves are those reserves that are expected to be recovered from existing wells and installed facilities or, if facilities have not been installed, that would involve a low expenditure (for example, when compared to the cost of drilling a well) to put the reserves on production. The developed category may be subdivided into the following categories:
i.Developed producing reserves are those reserves that are expected to be recovered from completion intervals open at the time of the estimate. These reserves may be currently producing or, if shut-in, they must have previously been on production, and the date of resumption of production must be known with reasonable certainty.
ii.Developed non-producing reserves are those reserves that either have not been on production, or have previously been on production, but are shut-in, and the date of resumption of production is unknown.
(b)Undeveloped reserves are those reserves expected to be recovered from known accumulations where a significant expenditure (for example, when compared to the cost of drilling a well) is required to render them capable of production. They must fully meet the requirements of the reserves classification (proved or probable) to which they are assigned.
ABBREVIATIONS
| Oil and Natural Gas Liquids | Natural Gas | |||||||||||||
| bbl | barrel | Mcf | thousand cubic feet | |||||||||||
| Mbbl | thousand barrels | MMcf | million cubic feet | |||||||||||
| MMbbl | million barrels | Bcf | billion cubic feet | |||||||||||
| NGL | natural gas liquids | Mcf/d | thousand cubic feet per day | |||||||||||
| bbl/d | barrels per day | MMcf/d | million cubic feet per day | |||||||||||
m3 | cubic metres | |||||||||||||
| MMbtu | million British Thermal Units | |||||||||||||
| 4 | |||||||
| Other | ||||||||||||||
| API | the measure of the density or gravity of liquid petroleum products as compared to water | |||||||||||||
| BOE or boe | barrel of oil equivalent, using the conversion factor of six Mcf of natural gas being equivalent to one bbl of oil. BOEs may be misleading, particularly if used in isolation. A BOE conversion ratio of 6 Mcf: 1 bbl is based on an energy equivalency conversion method primarily applicable at the burner tip and does not represent a value equivalency at the wellhead. | |||||||||||||
| boe/d | barrels of oil equivalent per day | MEH | Magellan East Houston | |||||||||||
| Mboe | thousand barrels of oil equivalent | MSW | Mixed Sweet Blend | |||||||||||
| MMboe | million barrels of oil equivalent | WTI | West Texas Intermediate | |||||||||||
| NYMEX | the New York Mercantile Exchange | WCS | Western Canadian Select | |||||||||||
| AECO | the natural gas storage facility located at Suffield, Alberta | $ Million | millions of dollars | |||||||||||
| $000s | thousands of dollars | |||||||||||||
CONVERSIONS AND CONVENTIONS
The following table sets forth certain conversions between Standard Imperial Units and the International System of Units (or metric units).
| To Convert From | To | Multiply By | ||||||
| Mcf | Cubic metres | 28.174 | ||||||
| Cubic metres | Cubic feet | 35.494 | ||||||
| Bbl | Cubic metres | 0.159 | ||||||
| Cubic metres | Bbl | 6.293 | ||||||
| Feet | Metres | 0.305 | ||||||
| Metres | Feet | 3.281 | ||||||
| Miles | Kilometres | 1.609 | ||||||
| Kilometres | Miles | 0.621 | ||||||
| Acres | Hectares | 0.400 | ||||||
| Hectares | Acres | 2.500 | ||||||
Certain terms used herein are defined in NI 51-101 and, unless the context otherwise requires, shall have the same meanings in this AIF as in NI 51-101. Unless otherwise indicated, references in this AIF to "$" or "dollars" are to Canadian dollars and references to "US$" are to United States dollars. All financial information contained in this AIF has been presented in Canadian dollars in accordance with Canadian GAAP. All operational information contained in this AIF relates to our consolidated operations unless the context otherwise requires.
SPECIAL NOTES TO READER
Forward-Looking Statements
In the interest of providing our Shareholders and potential investors with information about us, including management's assessment of our future plans and operations, certain statements in this AIF are "forward-looking statements" within the meaning of the United States Private Securities Litigation Reform Act of 1995 and "forward-looking information" within the meaning of applicable Canadian securities legislation (collectively, "forward-looking statements"). In some cases, forward-looking statements can be identified by terminology such as "anticipate", "believe", "continue", "could", "estimate", "expect", "forecast", "intend", "may", "objective", "ongoing", "outlook", "potential", "project", "plan", "should", "target", "would", "will" or similar words suggesting future outcomes, events or performance. The forward-looking statements contained in this AIF speak only as of the date hereof and are expressly qualified by this cautionary statement.
| 5 | |||||||
Specifically, this AIF contains forward-looking statements relating to, but not limited to: our business strategies, plans and objectives; our 2021 capital budget; our goal of building value by developing our assets and completing selective acquisitions; development plans for our properties; undeveloped lease expiries; the payment of cash income taxes; our working interest production volume for 2021 based on the future net revenue disclosed in our reserves; that we market our production with attention to maximizing value and counterparty performance; the development plans for our undeveloped reserves; our future abandonment and reclamation liabilities; our funding sources for development capital expenditures; the impact of existing and proposed governmental and environmental regulation; and our assessment of our tax filing position for the years 2011 through 2015.
In addition, there are forward-looking statements in this AIF under the headings "General Description of Our Business" and "Statement of Reserves Data" as to our reserves, including with respect thereto, the future net revenues from our reserves, pricing and inflation rates, future development costs, the development of our proved undeveloped reserves and probable undeveloped reserves, future development costs, reclamation and abandonment obligations, tax horizon, exploration and development activities and production estimates.
These forward-looking statements are based on certain key assumptions regarding, among other things: oil and natural gas prices and differentials between light, medium and heavy oil prices; well production rates and reserve volumes; our ability to add production and reserves through our exploration and development activities; capital expenditure levels; our ability to borrow under our credit agreements; the receipt, in a timely manner, of regulatory and other required approvals for our operating activities; the availability and cost of labour and other industry services; interest and foreign exchange rates; the continuance of existing and, in certain circumstances, proposed tax and royalty regimes; our ability to develop our crude oil and natural gas properties in the manner currently contemplated; and current industry conditions, laws and regulations continuing in effect (or, where changes are proposed, such changes being adopted as anticipated). Readers are cautioned that such assumptions, although considered reasonable by Baytex at the time of preparation, may prove to be incorrect.
Actual results achieved will vary from the information provided herein as a result of numerous known and unknown risks and uncertainties and other factors. Such factors include, but are not limited to: the volatility of oil and natural gas prices and price differentials (including the impacts of Covid-19); the availability and cost of capital or borrowing; risks associated with our ability to exploit our properties and add reserves; availability and cost of gathering, processing and pipeline systems; that our credit facilities may not provide sufficient liquidity or may not be renewed; failure to comply with the covenants in our debt agreements; risks associated with a third-party operating our Eagle Ford properties; public perception and its influence on the regulatory regime; restrictions or costs imposed by climate change initiatives and the physical risks of climate change; new regulations on hydraulic fracturing; restrictions on or access to water or other fluids; changes in government regulations that affect the oil and gas industry; regulations regarding the disposal of fluids; changes in environmental, health and safety regulations; costs to develop and operate our properties; variations in interest rates and foreign exchange rates; risks associated with our hedging activities; retaining or replacing our leadership and key personnel; changes in income tax or other laws or government incentive programs; uncertainties associated with estimating oil and natural gas reserves; our inability to fully insure against all risks; risks of counterparty default; risks related to our thermal heavy oil projects; alternatives to and changing demand for petroleum products; risks associated with our use of information technology systems; results of litigation; risks associated with large projects; risks associated with the ownership of our securities, including changes in market-based factors; risks for United States and other non-resident shareholders, including the ability to enforce civil remedies, differing practices for reporting reserves and production, additional taxation applicable to non-residents and foreign exchange risk; and other factors, many of which are beyond our control.
Readers are cautioned that the foregoing list of risk factors is not exhaustive. New risk factors emerge from time to time, and it is not possible for management to predict all of such factors and to assess in advance the impact of each such factor on our business or the extent to which any factor, or combination of factors, may cause actual results to differ materially from those contained in any forward-looking
| 6 | |||||||
statements. Readers should also carefully consider the matters discussed under the heading "Risk Factors" in this AIF.
The above summary of assumptions and risks related to forward-looking statements in this AIF has been provided in order to provide Shareholders and potential investors with a more complete perspective on our current and future operations and such information may not be appropriate for other purposes. There is no representation by us that actual results achieved will be the same in whole or in part as those referenced in the forward-looking statements and we do not undertake any obligation to update publicly or to revise any of the included forward-looking statements, whether as a result of new information, future events or otherwise, except as may be required by applicable securities law. The forward-looking statements contained in this AIF are expressly qualified by this cautionary statement.
Access to Documents
Any document referred to in this AIF and described as being accessible on the SEDAR website at www.sedar.com or on EDGAR at www.sec.gov (including those documents referred to as being incorporated by reference in this AIF) may be obtained free of charge from us at Suite 2800, Centennial Place, East Tower, 520 - 3rd Avenue S.W., Calgary, Alberta, Canada, T2P 0R3.
CORPORATE STRUCTURE
General
Baytex Energy Corp. was incorporated on October 22, 2010 pursuant to the provisions of the ABCA. Baytex is the successor to the business of Baytex Energy Trust, which was transitioned to Baytex on December 31, 2010.
Our head and principal office is located at Suite 2800, Centennial Place, East Tower, 520 – 3rd Avenue S.W., Calgary, Alberta, Canada, T2P 0R3. Our registered office is located at 2400, 525 – 8th Avenue S.W., Calgary, Alberta, Canada, T2P 1G1.
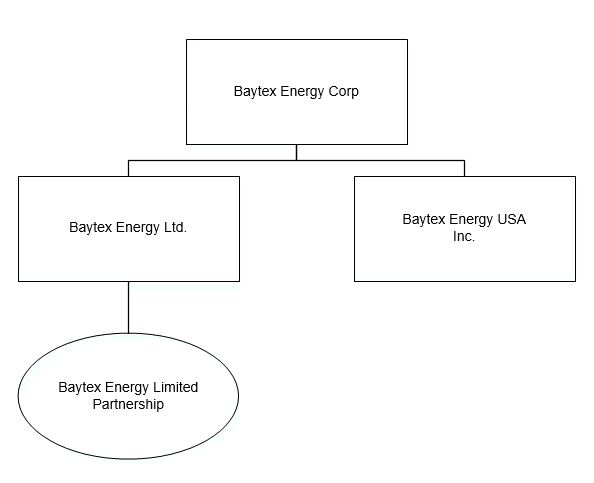
Inter-Corporate Relationships
The following table provides the name, the percentage of voting securities owned by us and the jurisdiction of incorporation, continuance, formation or organization of our material subsidiaries either, direct and indirect, as at the date hereof.
| Percentage of voting securities (directly or indirectly) | Jurisdiction of Incorporation/ Formation | ||||||||||
| Baytex Energy Ltd. | 100% | Alberta | |||||||||
| Baytex Energy USA, Inc. | 100% | Delaware | |||||||||
| Baytex Energy Limited Partnership | 100% | Alberta | |||||||||
| 7 | |||||||
Our Organizational Structure
The following simplified diagram shows the inter-corporate relationships among us and our material subsidiaries as of the date hereof.
DEVELOPMENT OF OUR BUSINESS
Developments in the Past Three Years
2018
In 2018 commodity prices improved relative to the prior year, but remained volatile. The price for WTI increased from Q1 through to Q3 and then dropped in Q4 to average US$64.77 for the year. The decrease in WTI during Q4 coincided with a widening of differentials for Canadian crude oil, which impacted our Canadian operations.
On June 18, Baytex and Raging River announced a strategic combination. The merger closed on August 22 and was effected by way of a plan of arrangement under the ABCA, whereby holders of Raging River common shares received, directly or indirectly, 1.36 Common Shares of Baytex for each Raging River share held. Upon closing of the strategic combination, holders of Baytex shares held 43% and holders of Raging River shares held 57% of the issued and outstanding shares of the combined company.
The transaction added approximately 23,000 boe/d of production from the Viking play in Saskatchewan and Alberta and 284,000 net acres of land in the emerging East Duvernay Shale play in Alberta. At closing, a combined leadership team from both companies was appointed.
Concurrent with closing, we announced an updated 2018 capital budget range of $450-$500 million and assumed the $300 million Term Loan from Raging River that is secured by the assets of Raging River.
Our production averaged 80,458 boe/d for the year and 98,890 boe/d in Q4, an increase from 2017, due to strong well performance and contributions from the Raging River combination.
On December 17, we announced a 2019 capital budget range of $550-$650 million designed to generate average annual production of 93,000-97,000 boe/d.
| 8 | |||||||
2019
In 2019 commodity prices decreased relative to 2018, with the WTI price averaging US$57.03/bbl for the year. The decrease in WTI was partially offset by a narrowing of differentials in Canada, with the WCS differential averaging US$12.75/bbl in 2019 as compared to US$26.31/bbl in 2018, which positively impacted our Canadian operations.
Our production averaged 97,680 boe/d in 2019, above our guidance range and an increase from 2018, due to the contribution from the Raging River assets and strong well performance, while exploration and development expenditures were at the low end of our budget range for the year at $552 million. In September 2019 we early redeemed US$150 million principal amount of senior unsecured notes due February 2021.
On December 4, we announced a 2020 capital budget range of $500-$575 million designed to generate average annual production of 93,000-97,000 boe/d and the appointment of Mark R. Bly as Chair of the Board.
2020
2020 was an extremely challenging year. The spread of Covid-19 and the associated decrease in demand for crude oil combined with a decision by the members of OPEC to increase the supply of crude oil resulted in a significant reduction in commodity prices. Commodity prices increased from their lows following a production curtailment agreement between members of the OPEC+ group to limit supply, but remained below their previous levels as a result of decreased demand associated with continued efforts to limit the spread of Covid-19. The price for WTI averaged US$39.40/bbl for the year.
Prior to the market dislocations caused by the spread of Covid-19 we entered into a series of transactions to extend the maturity dates of our outstanding indebtedness. On February 5, we issued US$500 million principal amount of 2027 Notes. The proceeds of this issuance, along with available cash and liquidity available under our Credit Facilities, were used to redeem our US$400 million principal amount 2021 Notes on February 2020 and our $300 million principal amount 2022 Debentures on March 5, 2020. In addition, on March 2, 2020 we extended the maturity of our Credit Facilities to April 2, 2024. Following these transactions the nearest maturity date of our senior unsecured debt and Credit Facilities was extended from 2021 to 2024.
In response to decreased commodity prices, we took decisive steps to adjust our business model. We reduced our capital budget by 50% and shut-in approximately 25,000 boe/d of production for a portion of the year. As a result, production for the year averaged 79,781 boe/d, while exploration and development expenditures were $280 million.
On December 2 we announced a 2021 capital budget range of $220-275 million designed to generate average annual production of 73,000-77,000 boe/d, which reflects the re-set of our business that occurred in 2020.
NYSE Delisting
On March 24, 2020, we received a continued listing standards notice from the NYSE as the average closing price for our Common Shares was less than US$1.00 per share over a period of 30 consecutive trading days. Subsequently, on December 3, 2020, our Common Shares were delisted from the NYSE. Baytex’s Common Shares continue to trade on the TSX.
| 9 | |||||||
DESCRIPTION OF OUR BUSINESS
Overview
We are engaged in the acquisition, development and production of crude oil and natural gas in the Western Canadian Sedimentary Basin and the Eagle Ford in the United States. Approximately 82% of our production is weighted toward crude oil and NGLs. The Company and its predecessors have been in business for more than 25 years and our operating teams are well established with a track record of technical proficiency and operational success. Throughout our history we have endeavoured to add value by developing our assets and completing selective acquisitions.
Competitive Conditions
Baytex is a member of the oil and natural gas industry, which is highly competitive. Baytex competes with other companies for all of its business inputs, including exploitation and development prospects, access to commodity markets, acquisition opportunities, available capital and staffing. We believe our competitive position is, on the whole, similar to that of other oil and natural gas producers of a similar size and production profile. See Industry Conditions and Risk Factors.
Reorganizations
On July 15, 2018, we dissolved our general partnership, Baytex Energy Partnership, which had previously held a beneficial interest in the majority of our producing properties in Canada. The beneficial interest is now held by Baytex Energy. In addition, on August 22, 2018, in conjunction with the Raging River merger, all of the oil and gas properties of Raging River were transferred to the newly formed Baytex Partnership.
Environmental and Social Policies
We have an active program to monitor and comply with all environmental laws, rules and regulations applicable to our operations. Our policies require that all employees and contractors report all breaches or potential breaches of environmental laws, rules and regulations to our senior management and all applicable governmental authorities. Any material breaches of environmental law, rules and regulations must be reported to the Board of Directors. Our Health, Safety and Environment policy is available on our website at www.baytexenergy.com.
We have published a Corporate Responsibility Report every second year since 2012. This report details our efforts and performance with respect to people, the environment, our community and stakeholders, and responsible business practices. For example, our 2019 report announced our intention to reduce our corporate emission intensity (tonnes of CO2e per boe) by 30% by 2021, relative to our 2018 baseline. We exceeded this target in scope and timing, achieving a 46% reduction in our GHG emissions intensity through year-end 2020 and have now established a new target with an objective to reduce our corporate GHG emission intensity by a further 33% from current levels by 2025. This equates to an approximate 65% reduction by 2025, relative to our 2018 baseline. Our sustainability reports along with an annual update showing our 2019 metrics can be viewed on our website at www.baytexenergy.com/sustainability/sustainability-home.cfm.
In recognition of the importance of our health, safety and environment policy and targets, including our GHG reduction target, the reserves and sustainability committee of our board of directors has been given specific responsibility for the "oversight and monitoring of the Corporation’s performance related to health, safety, environment, climate and other sustainability matters." This change was recognized by amending the committee's mandate and terms of reference in July of 2020. In addition, Baytex was recognized by Corporate Knights as one of the Future 40 Responsible Corporate Leaders in Canada for 2018. See Industry Conditions and Risk Factors.
| 10 | |||||||
Cyclical and Seasonal Factors
Our operational results and financial condition are dependent on the prices received for our oil and natural gas production. Oil and natural gas prices have fluctuated widely during recent years. Such prices are determined by supply and demand factors, including weather and general economic conditions, as well as conditions in other oil and natural gas regions. Any decline in oil and natural gas prices could have an adverse effect on our financial condition. We mitigate such price risk by closely monitoring commodity markets, implementing our risk management programs and by maintaining financial liquidity. Additionally, we continually review our capital program and implement initiatives to adapt to such price changes. See Industry Conditions and Risk Factors.
The level of activity in the oil and gas industry is dependent on access to areas where operations are conducted. In Canada, seasonal weather variations, including spring break-up which occurs annually, affects access in certain circumstances. In Canada and the United States, unexpected adverse weather conditions, such as flooding, extreme cold weather, heavy snowfall, heavy rainfall and forest fires may restrict the Corporation's ability to access its properties. See Industry Conditions and Risk Factors.
Renegotiation or Termination of Contracts
As at the date hereof, we do not anticipate that any aspects of our business will be materially affected during the remainder of 2021 by the renegotiation or termination of contracts.
Personnel
As at December 31, 2020, we had 139 employees in our head office and 67 employees in our field operations.
PRINCIPAL PROPERTIES
The following is a description of our principal oil and natural gas properties on production or under development as at December 31, 2020. Unless otherwise specified, gross and net acres and well count information are as at December 31, 2020 and production information represents average working interest production for the year ended December 31, 2020.
Eagle Ford - Texas
Our Eagle Ford assets are located in the core of the liquids-rich Eagle Ford shale in South Texas. Our assets include non-operated working interests in approximately 78,212 (19,931 net) acres, comprised of four areas of mutual interest (Sugarloaf, Longhorn, Ipanema and Excelsior) with an average working interest of approximately 25%, together with field infrastructure and related assets. Our entire acreage position in the Eagle Ford is held by production and the assets are operated by an operating subsidiary of Marathon Oil Corporation (NYSE: MRO), pursuant to the terms of industry-standard joint operating agreements. Production in the area occurs from the hydraulic fracturing of horizontal wells.
During 2020, production from the Eagle Ford assets averaged approximately 31,179 boe/d, comprised of 24,069 bbl/d of light oil, condensate and NGL and 42,665 Mcf/d of shale gas. During this period, Baytex participated in the completion of 62 (14.1 net) wells, resulting in 52 (11.5 net) oil wells and 10 (2.6 net) natural gas wells. As at December 31, 2020, our proved plus probable reserves were 215 million boe (153 proved; 62 probable).
Viking - Alberta and Saskatchewan
Our Viking assets are located in the greater Dodsland area in southwest Saskatchewan and in the Esther area of southeastern Alberta. These assets were acquired through a business combination with Raging River and produce light oil from the Viking formation. Production in the area occurs primarily from the hydraulic fracturing of horizontal wells. In some areas, reservoirs are placed under waterflood. In 2020,
| 11 | |||||||
the Viking assets produced 19,614 boe/d, comprised of 17,771 bbl/d of light oil and NGL and 11,058 Mcf/d of natural gas. These assets are characterized by shallow wells with short cycle times and a manufacturing approach to development. In 2020, Baytex completed 120 (115.5 net) oil wells. As at December 31, 2020 we had proved plus probable reserves of 85 million boe (57 proved; 28 probable).
The undeveloped land base associated with the Viking assets consisted of 213,430 net acres at year-end 2020.
Peace River - Alberta
In the Peace River area of northwest Alberta we produce heavy gravity crude oil and natural gas from the Bluesky formation. Production in the area occurs through primary and polymer flooding recovery methods. During 2020, production from the area averaged approximately 11,810 boe/d, comprised of 9,853 bbl/d of heavy oil, 19 bbl/d of NGL and 11,630 Mcf/d of natural gas. In 2020, Baytex drilled 4 (4.0 net) horizontal multi-lateral wells in this area. As at December 31, 2020, we had proved plus probable reserves of 39 million boe (19 proved; 21 probable).
Baytex held approximately 271,463 net undeveloped acres in this area at year-end 2020.
Lloydminster - Alberta and Saskatchewan
Our Lloydminster assets consist of several geographically dispersed heavy oil operations that include primary and thermal production. In some cases, Baytex's heavy oil reservoirs are water flooded and polymer flooded. In 2020, production averaged approximately 11,525 boe/d, which was comprised of 8,776 bbl/d of heavy oil, 2,513 bbl/d of bitumen, 12 bbl/d of light oil, and 1,346 Mcf/d of natural gas. In 2020, Baytex drilled 29 (29.0 net) oil wells and 6 (6.0 net) stratigraphic wells in this area. As at December 31, 2020, we had proved plus probable reserves of 83 million boe (25 proved; 58 probable).
We held approximately 191,930 net undeveloped acres in this area at year-end 2020.
Duvernay - Alberta
On August 22, 2018, as a result of the the merger with Raging River, Baytex acquired a land position in the emerging East Duvernay resource play in central Alberta. Production in the area occurs from the hydraulic fracturing of horizontal wells. In 2020, the Duvernay assets produced 1,507 boe/d, comprised of 1,235 bbl/d of light oil and NGL and 1,634 Mcf/d of natural gas. During 2020, Baytex drilled 2 (2.0 net) oil wells. As at December 31, 2020, our proved plus probable reserves are 17 million boe (8 proved; 9 probable) and our net undeveloped lands totaled approximately 249,613 net acres.
| 12 | |||||||
Average Production
The following table indicates our average daily production from our principal properties for the year ended December 31, 2020.
| Heavy Oil (bbl/d) | Bitumen (bbl/d) | Light and Medium Oil (bbl/d) | Tight Oil (bbl/d) | NGL(1) (bbl/d) | Shale Gas (Mcf/d) | Natural Gas (Mcf/d) | Oil Equivalent (boe/d) | |||||||||||||||||||||||||||||||||||||||||||
| Canada - Heavy | ||||||||||||||||||||||||||||||||||||||||||||||||||
| Peace River | 9,853 | — | — | — | 19 | — | 11,630 | 11,810 | ||||||||||||||||||||||||||||||||||||||||||
| Lloydminster | 8,776 | 2,513 | 12 | — | — | — | 1,346 | 11,525 | ||||||||||||||||||||||||||||||||||||||||||
| Total | 18,629 | 2,513 | 12 | — | 19 | — | 12,976 | 23,335 | ||||||||||||||||||||||||||||||||||||||||||
| Canada - Light | ||||||||||||||||||||||||||||||||||||||||||||||||||
| Viking | — | — | 17,603 | — | 168 | — | 11,058 | 19,614 | ||||||||||||||||||||||||||||||||||||||||||
| Duvernay | — | — | — | 797 | 438 | 1,634 | — | 1,507 | ||||||||||||||||||||||||||||||||||||||||||
| Remaining properties | — | — | 528 | — | 762 | — | 17,131 | 4,146 | ||||||||||||||||||||||||||||||||||||||||||
| Total | — | — | 18,131 | 797 | 1,368 | 1,634 | 28,189 | 25,267 | ||||||||||||||||||||||||||||||||||||||||||
| United States | ||||||||||||||||||||||||||||||||||||||||||||||||||
| Eagle Ford | — | — | — | 13,001 | 11,068 | 42,665 | — | 31,179 | ||||||||||||||||||||||||||||||||||||||||||
| Grand Total | 18,629 | 2,513 | 18,143 | 13,798 | 12,455 | 44,299 | 41,165 | 79,781 | ||||||||||||||||||||||||||||||||||||||||||
Note:
(1)Includes condensate.
Costs Incurred
The following table summarizes the property acquisition, exploration and development costs by country for the year ended December 31, 2020.
| ($000s) | Canada | United States | Total | |||||||||||||||||
| Property acquisition costs | ||||||||||||||||||||
| Proved properties | — | — | — | |||||||||||||||||
| Unproved properties | — | — | — | |||||||||||||||||
| Property disposition | (182) | — | (182) | |||||||||||||||||
| Total Property acquisition costs, net | (182) | — | (182) | |||||||||||||||||
Development Costs (1) | 170,462 | 105,388 | 275,850 | |||||||||||||||||
Exploration Costs (2) | 4,490 | — | 4,490 | |||||||||||||||||
| Total | 174,770 | 105,388 | 280,158 | |||||||||||||||||
Notes:
(1)Development and facilities expenditures.
(2)Cost of land, geological and geophysical capital expenditures.
| 13 | |||||||
Oil and Gas Wells
The following table sets forth the number and status of wells in which we have a working interest as at December 31, 2020.
| Oil Wells | Natural Gas Wells | ||||||||||||||||||||||||||||||||||||||||||||||
| Producing | Non-Producing | Producing | Non-Producing | ||||||||||||||||||||||||||||||||||||||||||||
| Gross | Net | Gross | Net | Gross | Net | Gross | Net | ||||||||||||||||||||||||||||||||||||||||
| Alberta | 812 | 674.7 | 1,268 | 837.4 | 346 | 256.1 | 726 | 572.4 | |||||||||||||||||||||||||||||||||||||||
| BC | — | — | 1 | 0.5 | — | — | 2 | 0.9 | |||||||||||||||||||||||||||||||||||||||
| Saskatchewan | 2,815 | 2,552.1 | 1,984 | 1,904.6 | 450 | 361.2 | 398 | 358.1 | |||||||||||||||||||||||||||||||||||||||
| Texas | 831 | 186.1 | 59 | 13.4 | 370 | 103.4 | 26 | 5.7 | |||||||||||||||||||||||||||||||||||||||
| Total | 4,458 | 3,412.9 | 3,312 | 2,755.9 | 1,166 | 720.7 | 1,152 | 937.1 | |||||||||||||||||||||||||||||||||||||||
Properties with No Attributed Reserves
The following table sets forth our undeveloped land holdings as at December 31, 2020.
| Undeveloped Acres | |||||||||||
| Gross | Net | ||||||||||
| Alberta | 837,774 | 753,776 | |||||||||
| Saskatchewan | 354,654 | 321,665 | |||||||||
| Total | 1,192,428 | 1,075,441 | |||||||||
Undeveloped land holdings are lands that have not been assigned reserves as at December 31, 2020. None of these undeveloped properties have high expected development or operating costs or contractual sales obligations to produce and sell at substantially lower prices than could be realized under normal market conditions.
We estimate the value of our net undeveloped land holdings at December 31, 2020 to be approximately $129.7 million, as compared to $161.6 million as at December 31, 2019. This internal evaluation generally represents the estimated replacement cost of our undeveloped land and excludes approximately 82,533 net acres of our undeveloped land that we expect to expire on or before December 31, 2021. In determining replacement cost, we analyzed land sale prices paid at provincial crown land sales for properties in the vicinity of our undeveloped land holdings over the preceding three years.
Tax Horizon
Baytex does not expect to pay any material cash income taxes prior to 2029. This estimate and any amount of income tax we may be required to pay in the future is highly sensitive to assumptions regarding commodity prices, production, cash flow, capital expenditure levels and changes in governing tax laws. For additional information, see Note 15 of our audited consolidated financial statements for the year ended December 31, 2020 and the information under the heading "Income Taxes" in our MD&A for the year ended December 31, 2020.
| 14 | |||||||
Exploration and Development Activities
The following table sets forth the gross and net exploratory and development wells in which we participated during the year ended December 31, 2020.
| Exploratory Wells | Development Wells | Total Wells | |||||||||||||||||||||||||||||||||
| Gross | Net | Gross | Net | Gross | Net | ||||||||||||||||||||||||||||||
| Oil | — | — | 193 | 147.6 | 193 | 147.6 | |||||||||||||||||||||||||||||
| Natural Gas | — | — | 11 | 4.9 | 11 | 4.9 | |||||||||||||||||||||||||||||
| Stratigraphic | 6 | 6.0 | — | — | 6 | 6.0 | |||||||||||||||||||||||||||||
| Service | — | — | — | — | — | — | |||||||||||||||||||||||||||||
| Dry | — | — | — | — | — | — | |||||||||||||||||||||||||||||
| Total | 6 | 6.0 | 204 | 152.5 | 210 | 158.5 | |||||||||||||||||||||||||||||
Production Estimates
The following table sets out the volumes of our working interest production estimated for the year ending December 31, 2021, which is reflected in the estimate of future net revenue disclosed in the forecast price tables contained under "Statement of Reserves Data - Disclosure of Reserves Data".
| Heavy Oil (bbl/d) | Bitumen (bbl/d) | Light and Medium Oil (bbl/d) | Tight Oil (bbl/d) | NGL (bbl/d)(1) | Shale Gas (Mcf/d) | Natural Gas (Mcf/d) | Oil Equivalent (boe/d) | ||||||||||||||||||||||||||||||||||||||||
| CANADA | |||||||||||||||||||||||||||||||||||||||||||||||
| Total Proved | 18,099 | 1,562 | 14,628 | 1,054 | 1,540 | 2,066 | 42,734 | 44,349 | |||||||||||||||||||||||||||||||||||||||
| Total Proved plus Probable | 19,228 | 1,738 | 16,198 | 1,180 | 1,758 | 2,291 | 45,699 | 48,100 | |||||||||||||||||||||||||||||||||||||||
| UNITED STATES | |||||||||||||||||||||||||||||||||||||||||||||||
| Total Proved | — | — | — | 11,621 | 12,587 | 39,630 | — | 30,813 | |||||||||||||||||||||||||||||||||||||||
| Total Proved plus Probable | — | — | — | 11,914 | 12,855 | 40,393 | — | 31,500 | |||||||||||||||||||||||||||||||||||||||
| TOTAL | |||||||||||||||||||||||||||||||||||||||||||||||
| Total Proved | 18,099 | 1,562 | 14,628 | 12,674 | 14,127 | 41,696 | 42,734 | 75,162 | |||||||||||||||||||||||||||||||||||||||
| Total Proved plus Probable | 19,228 | 1,738 | 16,198 | 13,094 | 14,612 | 42,684 | 45,699 | 79,600 | |||||||||||||||||||||||||||||||||||||||
Note:
(1)Includes condensate.
The two properties that account for 20% or more of the estimated 2021 production volumes are the Eagle Ford and the Viking. Estimated 2021 production volumes for the Eagle Ford is 30,813 boe/d on a total proved basis and 31,500 boe/d on a total proved plus probable basis. Estimated 2021 production volumes for the Viking is 15,873 boe/d on a total proved basis and 17,611 boe/d on a total proved plus probable basis.
| 15 | |||||||
Production History
The following table summarizes certain information in respect of the production, product prices received, royalties paid, production costs and resulting netback associated with our reserves data for the periods indicated below.
| Three Months Ended | Year Ended | ||||||||||||||||||||||||||||
| Dec. 31, 2020 | Sep. 30, 2020 | Jun. 30, 2020 | Mar. 31, 2020 | Dec. 31, 2020 | |||||||||||||||||||||||||
Average Sales Volume (1) | |||||||||||||||||||||||||||||
| CANADA | |||||||||||||||||||||||||||||
| Light Oil (bbl/d) | 13,947 | 17,396 | 18,165 | 23,115 | 18,143 | ||||||||||||||||||||||||
| Heavy Oil (bbl/d) | 19,553 | 19,676 | 9,555 | 25,710 | 18,629 | ||||||||||||||||||||||||
| Bitumen (bbl/d) | 2,172 | 2,462 | 2,277 | 3,144 | 2,513 | ||||||||||||||||||||||||
| Tight Oil (bbl/d) | 1,134 | 704 | 428 | 921 | 797 | ||||||||||||||||||||||||
NGL (bbl/d) (2) | 1,495 | 1,429 | 1,102 | 1,522 | 1,387 | ||||||||||||||||||||||||
| Total liquids (bbl/d) | 38,301 | 41,667 | 31,527 | 54,412 | 41,469 | ||||||||||||||||||||||||
| Shale Gas (Mcf/d) | 1,929 | 1,839 | 670 | 2,094 | 1,634 | ||||||||||||||||||||||||
| Natural Gas (Mcf/d) | 40,188 | 43,141 | 36,312 | 45,006 | 41,165 | ||||||||||||||||||||||||
| Total (boe/d) | 45,321 | 49,164 | 37,691 | 62,262 | 48,602 | ||||||||||||||||||||||||
| UNITED STATES | |||||||||||||||||||||||||||||
| Tight Oil (bbl/d) | 10,484 | 11,717 | 14,440 | 15,406 | 13,001 | ||||||||||||||||||||||||
NGL (bbl/d) (2) | 9,003 | 10,272 | 12,450 | 12,575 | 11,068 | ||||||||||||||||||||||||
| Total liquids (bbl/d) | 19,487 | 21,989 | 26,890 | 27,981 | 24,069 | ||||||||||||||||||||||||
| Shale Gas (Mcf/d) | 33,999 | 39,965 | 47,564 | 49,256 | 42,665 | ||||||||||||||||||||||||
| Total (boe/d) | 25,154 | 28,650 | 34,817 | 36,190 | 31,179 | ||||||||||||||||||||||||
| TOTAL | |||||||||||||||||||||||||||||
| Light Oil (bbl/d) | 13,947 | 17,396 | 18,165 | 23,115 | 18,143 | ||||||||||||||||||||||||
| Heavy Oil (bbl/d) | 19,553 | 19,676 | 9,555 | 25,710 | 18,629 | ||||||||||||||||||||||||
| Bitumen (bbl/d) | 2,172 | 2,462 | 2,277 | 3,144 | 2,513 | ||||||||||||||||||||||||
| Tight Oil (bbl/d) | 11,618 | 12,421 | 14,868 | 16,327 | 13,798 | ||||||||||||||||||||||||
NGL (bbl/d) (2) | 10,498 | 11,701 | 13,552 | 14,097 | 12,455 | ||||||||||||||||||||||||
| Total liquids (bbl/d) | 57,788 | 63,656 | 58,417 | 82,393 | 65,538 | ||||||||||||||||||||||||
| Shale Gas (Mcf/d) | 35,928 | 41,804 | 48,234 | 51,350 | 44,299 | ||||||||||||||||||||||||
| Natural Gas (Mcf/d) | 40,188 | 43,141 | 36,312 | 45,006 | 41,165 | ||||||||||||||||||||||||
| Total (boe/d) | 70,475 | 77,814 | 72,508 | 98,452 | 79,781 | ||||||||||||||||||||||||
| 16 | |||||||
| Three Months Ended | Year Ended | ||||||||||||||||||||||||||||
| Dec. 31, 2020 | Sep. 30, 2020 | Jun. 30, 2020 | Mar. 31, 2020 | Dec. 31, 2020 | |||||||||||||||||||||||||
| CANADA | |||||||||||||||||||||||||||||
Average Net Production Prices (3) | |||||||||||||||||||||||||||||
| Light Oil ($/bbl) | 47.16 | 46.70 | 24.01 | 49.18 | 41.93 | ||||||||||||||||||||||||
| Heavy Oil ($/bbl) | 26.94 | 28.24 | 16.92 | 20.64 | 23.85 | ||||||||||||||||||||||||
| Bitumen ($/bbl) | 36.22 | 35.31 | 18.49 | 21.64 | 27.47 | ||||||||||||||||||||||||
| Tight Oil ($/bbl) | 50.48 | 48.02 | 56.94 | 55.41 | 52.21 | ||||||||||||||||||||||||
NGL ($/bbl) (2) | 19.48 | 17.79 | 11.65 | 16.90 | 16.79 | ||||||||||||||||||||||||
| Shale Gas ($/Mcf) | 2.70 | 2.27 | 1.94 | 1.96 | 2.27 | ||||||||||||||||||||||||
| Natural Gas ($/Mcf) | 2.49 | 2.13 | 1.85 | 2.00 | 2.12 | ||||||||||||||||||||||||
| Total ($/boe) | 32.10 | 32.76 | 19.79 | 30.62 | 29.42 | ||||||||||||||||||||||||
| Royalties | |||||||||||||||||||||||||||||
Light Oil and NGL ($/bbl) (2)(4) | 3.92 | 3.15 | 1.90 | 3.39 | 3.07 | ||||||||||||||||||||||||
| Heavy Oil ($/bbl) | 2.51 | 2.91 | 2.07 | 2.91 | 2.70 | ||||||||||||||||||||||||
| Bitumen ($/bbl) | 3.13 | 3.45 | 1.69 | 1.85 | 2.49 | ||||||||||||||||||||||||
| Tight Oil ($/bbl) | 8.12 | 5.38 | 6.72 | 2.30 | 5.65 | ||||||||||||||||||||||||
| Shale Gas ($/Mcf) | 0.14 | 0.04 | 0.10 | 0.08 | 0.09 | ||||||||||||||||||||||||
| Natural Gas ($/Mcf) | 0.14 | 0.11 | 0.13 | 0.09 | 0.12 | ||||||||||||||||||||||||
| Total ($/boe) | 2.90 | 2.72 | 1.80 | 2.74 | 2.59 | ||||||||||||||||||||||||
Operating Expenses (5) | |||||||||||||||||||||||||||||
Light Oil and NGL ($/bbl) (2)(4) | 13.23 | 11.66 | 12.18 | 11.99 | 12.21 | ||||||||||||||||||||||||
| Heavy Oil ($/bbl) | 16.44 | 14.36 | 20.34 | 16.34 | 16.35 | ||||||||||||||||||||||||
| Bitumen ($/bbl) | 14.84 | 11.76 | 10.71 | 10.32 | 11.75 | ||||||||||||||||||||||||
| Tight Oil ($/bbl) | 9.43 | 8.50 | 10.76 | 11.23 | 9.89 | ||||||||||||||||||||||||
| Shale Gas ($/Mcf) | 1.57 | 1.42 | 1.79 | 1.87 | 1.65 | ||||||||||||||||||||||||
| Natural Gas ($/Mcf) | 2.38 | 1.99 | 2.23 | 2.34 | 2.23 | ||||||||||||||||||||||||
| Total ($/boe) | 14.73 | 12.73 | 14.33 | 13.93 | 13.89 | ||||||||||||||||||||||||
| Transportation Expenses | |||||||||||||||||||||||||||||
Light Oil and NGL ($/bbl) (2)(4) | 0.69 | 0.65 | 0.94 | 1.06 | 0.86 | ||||||||||||||||||||||||
| Heavy Oil ($/bbl) | 2.33 | 2.22 | 2.68 | 2.74 | 2.48 | ||||||||||||||||||||||||
| Bitumen ($/bbl) | 2.12 | 1.52 | 1.71 | 1.51 | 1.69 | ||||||||||||||||||||||||
| Tight Oil ($/bbl) | 1.18 | 1.07 | 1.31 | 1.18 | 1.17 | ||||||||||||||||||||||||
| Shale Gas ($/Mcf) | 0.20 | 0.18 | 0.22 | 0.20 | 0.19 | ||||||||||||||||||||||||
| Natural Gas ($/Mcf) | 0.25 | 0.20 | 0.19 | 0.24 | 0.22 | ||||||||||||||||||||||||
| Total ($/boe) | 1.60 | 1.41 | 1.47 | 1.83 | 1.60 | ||||||||||||||||||||||||
Netback Received (3)(6) | |||||||||||||||||||||||||||||
Light Oil and NGL ($/bbl) (2)(4) | 26.64 | 29.05 | 8.29 | 30.75 | 24.00 | ||||||||||||||||||||||||
| Heavy Oil ($/bbl) | 5.66 | 8.75 | (8.17) | (1.35) | 2.32 | ||||||||||||||||||||||||
| Bitumen ($/bbl) | 16.13 | 18.58 | 4.38 | 7.96 | 11.54 | ||||||||||||||||||||||||
| Tight Oil ($/bbl) | 31.75 | 33.07 | 38.15 | 40.70 | 35.50 | ||||||||||||||||||||||||
| Shale Gas ($/Mcf) | 0.79 | 0.63 | (0.17) | (0.19) | 0.34 | ||||||||||||||||||||||||
| Natural Gas ($/Mcf) | (0.28) | (0.17) | (0.70) | (0.67) | (0.45) | ||||||||||||||||||||||||
| Total ($/boe) | 12.87 | 15.90 | 2.19 | 12.12 | 11.34 | ||||||||||||||||||||||||
| 17 | |||||||
| Three Months Ended | Year Ended | ||||||||||||||||||||||||||||
| Dec. 31, 2020 | Sep. 30, 2020 | Jun. 30, 2020 | Mar. 31, 2020 | Dec. 31, 2020 | |||||||||||||||||||||||||
| UNITED STATES | |||||||||||||||||||||||||||||
Average Net Production Prices (3) | |||||||||||||||||||||||||||||
| Tight Oil ($/bbl) | 53.37 | 51.82 | 32.97 | 62.76 | 50.15 | ||||||||||||||||||||||||
NGL ($/bbl) (2) | 32.87 | 30.34 | 22.73 | 36.71 | 30.53 | ||||||||||||||||||||||||
| Shale Gas ($/Mcf) | 3.26 | 2.50 | 2.38 | 2.63 | 2.65 | ||||||||||||||||||||||||
| Total ($/boe) | 38.41 | 35.55 | 25.05 | 43.05 | 35.38 | ||||||||||||||||||||||||
| Royalties | |||||||||||||||||||||||||||||
| Tight Oil ($/bbl) | 16.75 | 16.48 | 10.53 | 19.47 | 15.77 | ||||||||||||||||||||||||
NGL ($/bbl) (2) | 8.42 | 7.85 | 5.78 | 9.51 | 7.86 | ||||||||||||||||||||||||
| Shale Gas ($/Mcf) | 0.83 | 0.70 | 0.60 | 0.68 | 0.69 | ||||||||||||||||||||||||
| Total ($/boe) | 11.11 | 10.53 | 7.26 | 12.51 | 10.31 | ||||||||||||||||||||||||
Operating Expenses (5)(7) | |||||||||||||||||||||||||||||
| Tight Oil ($/bbl) | 7.92 | 6.03 | 7.74 | 7.76 | 7.39 | ||||||||||||||||||||||||
NGL ($/bbl) (2) | 7.92 | 6.03 | 7.74 | 7.76 | 7.39 | ||||||||||||||||||||||||
| Shale Gas ($/Mcf) | 1.32 | 1.00 | 1.29 | 1.29 | 1.23 | ||||||||||||||||||||||||
| Total ($/boe) | 7.92 | 6.03 | 7.74 | 7.76 | 7.39 | ||||||||||||||||||||||||
Netback Received (3)(6) | |||||||||||||||||||||||||||||
| Tight Oil ($/bbl) | 28.70 | 29.31 | 14.70 | 35.53 | 26.99 | ||||||||||||||||||||||||
NGL ($/bbl) (2) | 16.53 | 16.46 | 9.21 | 19.44 | 15.28 | ||||||||||||||||||||||||
| Shale Gas ($/Mcf) | 1.11 | 0.80 | 0.49 | 0.66 | 0.73 | ||||||||||||||||||||||||
| Total ($/boe) | 19.38 | 18.99 | 10.05 | 22.78 | 17.68 | ||||||||||||||||||||||||
Notes:
(1)Before deduction of royalties.
(2)NGL includes condensate.
(3)Before the effects of commodity derivative instruments.
(4)In Canada, NGL volumes are grouped with light oil volumes for reporting purposes.
(5)Operating expenses are composed of direct costs incurred to operate both oil and gas wells. A number of assumptions are required to allocate these costs between oil, natural gas and NGL production.
(6)Netback is calculated by subtracting royalties, operating and transportation expenses from revenues.
(7)In the U.S., transportation expense is included in operating expenses for reporting purposes.
| 18 | |||||||
Marketing Arrangements and Forward Contracts
In Canada, we market our oil and natural gas production with attention to maximizing value and counterparty performance. We have a portfolio of sales contracts with a variety of pricing mechanisms, term commitments and customers. For our heavy oil volumes, this includes rail commitments. In the United States, production from our assets is marketed by the operator.
The Corporation also has a risk management policy pursuant to which we utilize various derivative financial instruments and physical sales contracts to manage our exposure to fluctuations in commodity prices, foreign exchange and interest rates. We also use derivative instruments in various operational markets to optimize our supply or production chain.
When marketing and hedging we engage a number of reputable counterparties to ensure competitiveness, while also managing counterparty credit exposure. For details on our contractual commitments to sell natural gas and crude oil which were outstanding at February 24, 2021, see Note 18 to our audited consolidated financial statements for the year ended December 31, 2020. See Risk Factors.
STATEMENT OF RESERVES DATA
The Baytex Reserves Report has been prepared in accordance with the standards contained in the COGE Handbook and the reserves definitions contained in NI 51‑101. The statement of reserves data and other oil and natural gas information set forth below is dated December 31, 2020. The effective date of the Baytex Reserves Report is December 31, 2020 and the preparation date of the statement is February 4, 2021. The Baytex Reserves Report was prepared using the average commodity price forecasts and inflation rates of McDaniel, GLJ Petroleum Consultants Ltd. and Sproule Associates Limited as of January 1, 2021.
Disclosure of Reserves Data
The tables below are a combined summary as at December 31, 2020 of our proved and probable heavy oil, bitumen, light and medium oil, tight oil, NGL, conventional natural gas and shale gas reserves and the net present value of the future net revenue attributable to such reserves evaluated in the Baytex Reserves Report. Our reserves are located in Canada (Alberta and Saskatchewan) and the United States (Texas).
All evaluations of future net revenue are after the deduction of future income tax expenses (unless otherwise noted in the tables), royalties, development costs, production costs and well abandonment costs but before consideration of indirect costs such as administrative, overhead and other miscellaneous expenses. The estimated future net revenue contained in the following tables does not necessarily represent the fair market value of our reserves. There is no assurance that the forecast price and cost assumptions contained in the Baytex Reserves Report will be attained and variations could be material. The tables summarize the data contained in the Baytex Reserves Report and, as a result, may contain slightly different numbers and columns in the tables may not add due to rounding. Other assumptions and qualifications relating to costs and other matters are summarized in the notes to or following the tables below.
The recovery and reserves estimates described herein are estimates only and there is no guarantee that the estimated reserves will be recovered. Readers should review the definitions and information contained in "Selected Terms - Reserves Definitions", "- Reserves and Reserve Categories" and "- Development and Production Status" in conjunction with the following tables and notes. For more information as to the risks involved, see "Risk Factors".
| 19 | |||||||
| SUMMARY OF OIL AND NATURAL GAS RESERVES AS OF DECEMBER 31, 2020 FORECAST PRICES AND COSTS | ||||||||||||||||||||||||||||||||||||||
| CANADA | ||||||||||||||||||||||||||||||||||||||
| TIGHT OIL | LIGHT AND MEDIUM OIL | HEAVY OIL | ||||||||||||||||||||||||||||||||||||
| RESERVES CATEGORY | Gross (Mbbl) | Net (Mbbl) | Gross (Mbbl) | Net (Mbbl) | Gross (Mbbl) | Net (Mbbl) | ||||||||||||||||||||||||||||||||
| PROVED: | ||||||||||||||||||||||||||||||||||||||
| Developed Producing | 1,268 | 1,154 | 20,404 | 19,106 | 19,917 | 18,404 | ||||||||||||||||||||||||||||||||
| Developed Non‑Producing | — | — | 61 | 59 | 1,997 | 1,895 | ||||||||||||||||||||||||||||||||
| Undeveloped | 3,112 | 2,810 | 31,601 | 29,630 | 13,499 | 12,385 | ||||||||||||||||||||||||||||||||
| TOTAL PROVED | 4,380 | 3,963 | 52,067 | 48,795 | 35,412 | 32,684 | ||||||||||||||||||||||||||||||||
| PROBABLE | 4,748 | 4,188 | 25,688 | 23,461 | 30,544 | 27,640 | ||||||||||||||||||||||||||||||||
| TOTAL PROVED PLUS PROBABLE | 9,128 | 8,151 | 77,755 | 72,256 | 65,956 | 60,324 | ||||||||||||||||||||||||||||||||
| CANADA | ||||||||||||||||||||||||||||||||||||||
| BITUMEN | SHALE GAS | CONVENTIONAL NATURAL GAS (1) | ||||||||||||||||||||||||||||||||||||
| RESERVES CATEGORY | Gross (Mbbl) | Net (Mbbl) | Gross (MMcf) | Net (MMcf) | Gross (MMcf) | Net (MMcf) | ||||||||||||||||||||||||||||||||
| PROVED: | ||||||||||||||||||||||||||||||||||||||
| Developed Producing | 1,144 | 1,027 | 3,041 | 2,790 | 43,384 | 40,568 | ||||||||||||||||||||||||||||||||
| Developed Non‑Producing | 160 | 152 | — | — | 15,072 | 13,080 | ||||||||||||||||||||||||||||||||
| Undeveloped | 4,433 | 4,213 | 6,203 | 5,754 | 29,438 | 26,071 | ||||||||||||||||||||||||||||||||
| TOTAL PROVED | 5,737 | 5,393 | 9,244 | 8,544 | 87,894 | 79,720 | ||||||||||||||||||||||||||||||||
| PROBABLE | 46,093 | 40,064 | 9,497 | 8,825 | 86,778 | 80,679 | ||||||||||||||||||||||||||||||||
| TOTAL PROVED PLUS PROBABLE | 51,830 | 45,456 | 18,741 | 17,369 | 174,671 | 160,398 | ||||||||||||||||||||||||||||||||
| CANADA | ||||||||||||||||||||||||||||||||||||||
NATURAL GAS LIQUIDS (2) | TOTAL RESERVES | |||||||||||||||||||||||||||||||||||||
| RESERVES CATEGORY | Gross (Mbbl) | Net (Mbbl) | Gross (Mboe) | Net (Mboe) | ||||||||||||||||||||||||||||||||||
| PROVED: | ||||||||||||||||||||||||||||||||||||||
| Developed Producing | 1,739 | 1,515 | 52,210 | 48,432 | ||||||||||||||||||||||||||||||||||
| Developed Non‑Producing | 485 | 389 | 5,214 | 4,676 | ||||||||||||||||||||||||||||||||||
| Undeveloped | 2,244 | 1,992 | 60,829 | 56,334 | ||||||||||||||||||||||||||||||||||
| TOTAL PROVED | 4,468 | 3,896 | 118,254 | 109,442 | ||||||||||||||||||||||||||||||||||
| PROBABLE | 4,841 | 4,309 | 127,959 | 114,578 | ||||||||||||||||||||||||||||||||||
| TOTAL PROVED PLUS PROBABLE | 9,309 | 8,205 | 246,212 | 224,020 | ||||||||||||||||||||||||||||||||||
| 20 | |||||||
| UNITED STATES | ||||||||||||||||||||||||||||||||||||||
| TIGHT OIL | SHALE GAS | NATURAL GAS LIQUIDS (2) | ||||||||||||||||||||||||||||||||||||
| RESERVES CATEGORY | Gross (Mbbl) | Net (Mbbl) | Gross (MMcf) | Net (MMcf) | Gross (Mbbl) | Net (Mbbl) | ||||||||||||||||||||||||||||||||
| PROVED: | ||||||||||||||||||||||||||||||||||||||
| Developed Producing | 22,204 | 16,292 | 94,280 | 69,651 | 29,930 | 22,120 | ||||||||||||||||||||||||||||||||
| Developed Non‑Producing | 38 | 28 | 473 | 350 | 154 | 114 | ||||||||||||||||||||||||||||||||
| Undeveloped | 26,694 | 19,561 | 122,338 | 89,885 | 37,923 | 27,873 | ||||||||||||||||||||||||||||||||
| TOTAL PROVED | 48,936 | 35,881 | 217,090 | 159,886 | 68,007 | 50,107 | ||||||||||||||||||||||||||||||||
| PROBABLE | 19,894 | 14,589 | 87,355 | 64,235 | 27,920 | 20,544 | ||||||||||||||||||||||||||||||||
| TOTAL PROVED PLUS PROBABLE | 68,830 | 50,470 | 304,445 | 224,121 | 95,927 | 70,651 | ||||||||||||||||||||||||||||||||
| UNITED STATES | ||||||||||||||||||||||||||||||||||||||
| TOTAL RESERVES | ||||||||||||||||||||||||||||||||||||||
| RESERVES CATEGORY | Gross (Mboe) | Net (Mboe) | ||||||||||||||||||||||||||||||||||||
| PROVED: | ||||||||||||||||||||||||||||||||||||||
| Developed Producing | 67,847 | 50,020 | ||||||||||||||||||||||||||||||||||||
| Developed Non‑Producing | 271 | 201 | ||||||||||||||||||||||||||||||||||||
| Undeveloped | 85,006 | 62,414 | ||||||||||||||||||||||||||||||||||||
| TOTAL PROVED | 153,125 | 112,636 | ||||||||||||||||||||||||||||||||||||
| PROBABLE | 62,373 | 45,839 | ||||||||||||||||||||||||||||||||||||
| TOTAL PROVED PLUS PROBABLE | 215,497 | 158,475 | ||||||||||||||||||||||||||||||||||||
| TOTAL | ||||||||||||||||||||||||||||||||||||||
| TIGHT OIL | LIGHT AND MEDIUM OIL | HEAVY OIL | ||||||||||||||||||||||||||||||||||||
| RESERVES CATEGORY | Gross (Mbbl) | Net (Mbbl) | Gross (Mbbl) | Net (Mbbl) | Gross (Mbbl) | Net (Mbbl) | ||||||||||||||||||||||||||||||||
| PROVED: | ||||||||||||||||||||||||||||||||||||||
| Developed Producing | 23,473 | 17,445 | 20,404 | 19,106 | 19,917 | 18,404 | ||||||||||||||||||||||||||||||||
| Developed Non‑Producing | 38 | 28 | 61 | 59 | 1,997 | 1,895 | ||||||||||||||||||||||||||||||||
| Undeveloped | 29,805 | 22,371 | 31,601 | 29,630 | 13,499 | 12,385 | ||||||||||||||||||||||||||||||||
| TOTAL PROVED | 53,316 | 39,844 | 52,067 | 48,795 | 35,412 | 32,684 | ||||||||||||||||||||||||||||||||
| PROBABLE | 24,642 | 18,777 | 25,688 | 23,461 | 30,544 | 27,640 | ||||||||||||||||||||||||||||||||
| TOTAL PROVED PLUS PROBABLE | 77,958 | 58,621 | 77,755 | 72,256 | 65,956 | 60,324 | ||||||||||||||||||||||||||||||||
| 21 | |||||||
| TOTAL | ||||||||||||||||||||||||||||||||||||||
| BITUMEN | SHALE GAS | CONVENTIONAL NATURAL GAS (1) | ||||||||||||||||||||||||||||||||||||
| RESERVES CATEGORY | Gross (Mbbl) | Net (Mbbl) | Gross (MMcf) | Net (MMcf) | Gross (MMcf) | Net (MMcf) | ||||||||||||||||||||||||||||||||
| PROVED: | ||||||||||||||||||||||||||||||||||||||
| Developed Producing | 1,144 | 1,027 | 97,321 | 72,440 | 43,384 | 40,568 | ||||||||||||||||||||||||||||||||
| Developed Non‑Producing | 160 | 152 | 473 | 350 | 15,072 | 13,080 | ||||||||||||||||||||||||||||||||
| Undeveloped | 4,433 | 4,213 | 128,541 | 95,639 | 29,438 | 26,071 | ||||||||||||||||||||||||||||||||
| TOTAL PROVED | 5,737 | 5,393 | 226,334 | 168,429 | 87,894 | 79,720 | ||||||||||||||||||||||||||||||||
| PROBABLE | 46,093 | 40,064 | 96,852 | 73,061 | 86,778 | 80,679 | ||||||||||||||||||||||||||||||||
| TOTAL PROVED PLUS PROBABLE | 51,830 | 45,456 | 323,186 | 241,490 | 174,671 | 160,398 | ||||||||||||||||||||||||||||||||
| TOTAL | ||||||||||||||||||||||||||||||||||||||
NATURAL GAS LIQUIDS (2) | TOTAL RESERVES | |||||||||||||||||||||||||||||||||||||
| RESERVES CATEGORY | Gross (Mbbl) | Net (Mbbl) | Gross (Mboe) | Net (Mboe) | ||||||||||||||||||||||||||||||||||
| PROVED: | ||||||||||||||||||||||||||||||||||||||
| Developed Producing | 31,669 | 23,635 | 120,057 | 98,452 | ||||||||||||||||||||||||||||||||||
| Developed Non‑Producing | 639 | 504 | 5,485 | 4,877 | ||||||||||||||||||||||||||||||||||
| Undeveloped | 40,167 | 29,865 | 145,835 | 118,748 | ||||||||||||||||||||||||||||||||||
| TOTAL PROVED | 72,475 | 54,003 | 271,378 | 222,077 | ||||||||||||||||||||||||||||||||||
| PROBABLE | 32,760 | 24,853 | 190,332 | 160,417 | ||||||||||||||||||||||||||||||||||
| TOTAL PROVED PLUS PROBABLE | 105,235 | 78,856 | 461,710 | 382,495 | ||||||||||||||||||||||||||||||||||
Notes:
(1)Conventional natural gas includes associated, non-associated and solution gas.
(2)Natural gas liquids includes condensate.
| 22 | |||||||
| SUMMARY OF NET PRESENT VALUES OF FUTURE NET REVENUE AS OF DECEMBER 31, 2020 FORECAST PRICES AND COSTS | ||||||||||||||||||||||||||||||||||||||
| CANADA | BEFORE INCOME TAXES DISCOUNTED AT (%/year) | UNIT VALUE BEFORE TAX | ||||||||||||||||||||||||||||||||||||
| RESERVES CATEGORY | 0% ($000s) | 5% ($000s) | 10% ($000s) | 15% ($000s) | 20% ($000s) | 10% $/boe | ||||||||||||||||||||||||||||||||
| PROVED: | ||||||||||||||||||||||||||||||||||||||
| Developed Producing | (212,944) | 225,006 | 347,308 | 377,104 | 376,315 | 7.17 | ||||||||||||||||||||||||||||||||
| Developed Non‑Producing | 63,367 | 54,775 | 48,227 | 43,104 | 38,998 | 10.31 | ||||||||||||||||||||||||||||||||
| Undeveloped | 772,595 | 504,623 | 322,020 | 198,702 | 114,400 | 5.72 | ||||||||||||||||||||||||||||||||
| TOTAL PROVED | 623,019 | 784,404 | 717,555 | 618,910 | 529,712 | 6.56 | ||||||||||||||||||||||||||||||||
| PROBABLE | 2,063,798 | 1,193,123 | 771,076 | 538,642 | 398,195 | 6.73 | ||||||||||||||||||||||||||||||||
| TOTAL PROVED PLUS PROBABLE | 2,686,817 | 1,977,527 | 1,488,630 | 1,157,552 | 927,907 | 6.65 | ||||||||||||||||||||||||||||||||
| UNITED STATES | BEFORE INCOME TAXES DISCOUNTED AT (%/year) | UNIT VALUE BEFORE TAX | ||||||||||||||||||||||||||||||||||||
| RESERVES CATEGORY | 0% ($000s) | 5% ($000s) | 10% ($000s) | 15% ($000s) | 20% ($000s) | 10% $/boe | ||||||||||||||||||||||||||||||||
| PROVED: | ||||||||||||||||||||||||||||||||||||||
| Developed Producing | 1,302,148 | 977,768 | 770,723 | 640,474 | 552,298 | 15.41 | ||||||||||||||||||||||||||||||||
| Developed Non‑Producing | 5,416 | 3,925 | 3,062 | 2,512 | 2,134 | 15.23 | ||||||||||||||||||||||||||||||||
| Undeveloped | 1,448,365 | 938,293 | 649,814 | 472,772 | 356,197 | 10.41 | ||||||||||||||||||||||||||||||||
| TOTAL PROVED | 2,755,929 | 1,919,986 | 1,423,599 | 1,115,758 | 910,629 | 12.64 | ||||||||||||||||||||||||||||||||
| PROBABLE | 1,310,312 | 643,996 | 366,587 | 231,987 | 158,347 | 8.00 | ||||||||||||||||||||||||||||||||
| TOTAL PROVED PLUS PROBABLE | 4,066,241 | 2,563,981 | 1,790,186 | 1,347,746 | 1,068,976 | 11.30 | ||||||||||||||||||||||||||||||||
| TOTAL | BEFORE INCOME TAXES DISCOUNTED AT (%/year) | UNIT VALUE BEFORE TAX | ||||||||||||||||||||||||||||||||||||
| RESERVES CATEGORY | 0% ($000s) | 5% ($000s) | 10% ($000s) | 15% ($000s) | 20% ($000s) | 10% $/boe | ||||||||||||||||||||||||||||||||
| PROVED: | ||||||||||||||||||||||||||||||||||||||
| Developed Producing | 1,089,204 | 1,202,774 | 1,118,031 | 1,017,579 | 928,612 | 11.36 | ||||||||||||||||||||||||||||||||
| Developed Non‑Producing | 68,783 | 58,700 | 51,289 | 45,616 | 41,132 | 10.52 | ||||||||||||||||||||||||||||||||
| Undeveloped | 2,220,960 | 1,442,916 | 971,834 | 671,474 | 470,597 | 8.18 | ||||||||||||||||||||||||||||||||
| TOTAL PROVED | 3,378,948 | 2,704,390 | 2,141,154 | 1,734,669 | 1,440,342 | 9.64 | ||||||||||||||||||||||||||||||||
| PROBABLE | 3,374,110 | 1,837,118 | 1,137,663 | 770,629 | 556,542 | 7.09 | ||||||||||||||||||||||||||||||||
| TOTAL PROVED PLUS PROBABLE | 6,753,057 | 4,541,509 | 3,278,817 | 2,505,298 | 1,996,884 | 8.57 | ||||||||||||||||||||||||||||||||
| 23 | |||||||
| SUMMARY OF NET PRESENT VALUES OF FUTURE NET REVENUE AS OF DECEMBER 31, 2020 FORECAST PRICES AND COSTS | ||||||||||||||||||||||||||||||||
| CANADA | AFTER INCOME TAXES DISCOUNTED AT (%/year)(1) | |||||||||||||||||||||||||||||||
| RESERVES CATEGORY | 0% ($000s) | 5% ($000s) | 10% ($000s) | 15% ($000s) | 20% ($000s) | |||||||||||||||||||||||||||
| PROVED: | ||||||||||||||||||||||||||||||||
| Developed Producing | (212,944) | 225,006 | 347,308 | 377,104 | 376,315 | |||||||||||||||||||||||||||
| Developed Non‑Producing | 63,367 | 54,775 | 48,227 | 43,104 | 38,998 | |||||||||||||||||||||||||||
| Undeveloped | 772,595 | 504,623 | 322,020 | 198,702 | 114,400 | |||||||||||||||||||||||||||
| TOTAL PROVED | 623,019 | 784,404 | 717,555 | 618,910 | 529,712 | |||||||||||||||||||||||||||
| PROBABLE | 1,933,722 | 1,115,340 | 722,951 | 507,973 | 378,137 | |||||||||||||||||||||||||||
| TOTAL PROVED PLUS PROBABLE | 2,556,741 | 1,899,744 | 1,440,506 | 1,126,884 | 907,849 | |||||||||||||||||||||||||||
| UNITED STATES | AFTER INCOME TAXES DISCOUNTED AT (%/year)(1) | |||||||||||||||||||||||||||||||
| RESERVES CATEGORY | 0% ($000s) | 5% ($000s) | 10% ($000s) | 15% ($000s) | 20% ($000s) | |||||||||||||||||||||||||||
| PROVED: | ||||||||||||||||||||||||||||||||
| Developed Producing | 1,271,733 | 965,689 | 764,223 | 635,897 | 548,406 | |||||||||||||||||||||||||||
| Developed Non‑Producing | 5,050 | 3,802 | 3,011 | 2,485 | 2,117 | |||||||||||||||||||||||||||
| Undeveloped | 1,192,125 | 800,643 | 570,465 | 424,685 | 326,074 | |||||||||||||||||||||||||||
| TOTAL PROVED | 2,468,908 | 1,770,134 | 1,337,699 | 1,063,067 | 876,596 | |||||||||||||||||||||||||||
| PROBABLE | 1,025,337 | 503,878 | 287,133 | 182,589 | 125,724 | |||||||||||||||||||||||||||
| TOTAL PROVED PLUS PROBABLE | 3,494,246 | 2,274,012 | 1,624,832 | 1,245,655 | 1,002,321 | |||||||||||||||||||||||||||
| TOTAL | AFTER INCOME TAXES DISCOUNTED AT (%/year)(1) | |||||||||||||||||||||||||||||||
| RESERVES CATEGORY | 0% ($000s) | 5% ($000s) | 10% ($000s) | 15% ($000s) | 20% ($000s) | |||||||||||||||||||||||||||
| PROVED: | ||||||||||||||||||||||||||||||||
| Developed Producing | 1,058,789 | 1,190,696 | 1,111,530 | 1,013,001 | 924,720 | |||||||||||||||||||||||||||
| Developed Non‑Producing | 68,417 | 58,577 | 51,238 | 45,589 | 41,114 | |||||||||||||||||||||||||||
| Undeveloped | 1,964,720 | 1,305,266 | 892,485 | 623,387 | 440,474 | |||||||||||||||||||||||||||
| TOTAL PROVED | 3,091,927 | 2,554,539 | 2,055,253 | 1,681,977 | 1,406,309 | |||||||||||||||||||||||||||
| PROBABLE | 2,959,059 | 1,619,217 | 1,010,084 | 690,562 | 503,861 | |||||||||||||||||||||||||||
| TOTAL PROVED PLUS PROBABLE | 6,050,986 | 4,173,756 | 3,065,338 | 2,372,539 | 1,910,170 | |||||||||||||||||||||||||||
Note:
(1)The after-tax net present value of future net revenue from our oil and gas properties reflects the tax burden on the properties on a theoretical stand-alone basis. It does not consider our corporate structure or any tax planning and therefore does not provide an estimate of the cumulative after-tax value of our consolidated business entities, which may be significantly different.
| 24 | |||||||
| TOTAL FUTURE NET REVENUE (UNDISCOUNTED) AS OF DECEMBER 31, 2020 FORECAST PRICES AND COSTS | |||||||||||||||||||||||||||||||||||||||||||||||
| ($000s) | REVENUE | ROYALTIES | OPERAT-ING COSTS | DEVELOP-MENT COSTS | WELL ABANDON-MENT COSTS(1) | FUTURE NET REVENUE BEFORE INCOME TAXES | INCOME TAXES | FUTURE NET REVENUE AFTER INCOME TAXES | |||||||||||||||||||||||||||||||||||||||
| TOTAL PROVED RESERVES | |||||||||||||||||||||||||||||||||||||||||||||||
| Canada | 5,567,569 | 455,145 | 2,144,427 | 1,299,523 | 1,045,456 | 623,019 | — | 623,019 | |||||||||||||||||||||||||||||||||||||||
| United States | 8,479,630 | 2,632,828 | 2,174,258 | 794,061 | 122,555 | 2,755,929 | 287,021 | 2,468,908 | |||||||||||||||||||||||||||||||||||||||
| Total | 14,047,199 | 3,087,972 | 4,318,684 | 2,093,584 | 1,168,011 | 3,378,948 | 287,021 | 3,091,927 | |||||||||||||||||||||||||||||||||||||||
| TOTAL PROVED PLUS PROBABLE RESERVES | |||||||||||||||||||||||||||||||||||||||||||||||
| Canada | 11,956,297 | 1,194,711 | 4,551,586 | 2,412,068 | 1,111,116 | 2,686,817 | 130,076 | 2,556,741 | |||||||||||||||||||||||||||||||||||||||
| United States | 12,670,305 | 3,938,602 | 3,327,708 | 1,193,818 | 143,936 | 4,066,241 | 571,995 | 3,494,246 | |||||||||||||||||||||||||||||||||||||||
| Total | 24,626,602 | 5,133,313 | 7,879,294 | 3,605,886 | 1,255,052 | 6,753,057 | 702,071 | 6,050,986 | |||||||||||||||||||||||||||||||||||||||
Note:
(1)Includes well abandonment, decommissioning and reclamation costs for all producing and non-producing wells and facilities and to be incurred as a result of future development activity.
| FUTURE NET REVENUE BY PRODUCT TYPE AS OF DECEMBER 31, 2020 FORECAST PRICES AND COSTS | |||||||||||
| RESERVES CATEGORY | PRODUCT TYPE | FUTURE NET REVENUE BEFORE INCOME TAXES (discounted at 10%/year) ($000s) | UNIT VALUE (1) ($/bbl; $/Mcf) | ||||||||
| Proved | Light and Medium Crude Oil (including solution gas and associated byproducts) | 536,996 | 11.01 | ||||||||
| Heavy Crude Oil (including solution gas and associated byproducts) | 73,802 | 2.26 | |||||||||
| Bitumen (including solution gas and associated byproducts) | 37,270 | 6.91 | |||||||||
| Tight Oil (including solution gas and associated byproducts) | 914,305 | 22.95 | |||||||||
| Natural Gas (associated and non-associated) (including associated byproducts) | 34,057 | 0.84 | |||||||||
| Shale Gas (including associated byproducts) | 544,724 | 4.89 | |||||||||
| Total | 2,141,154 | ||||||||||
| Proved plus Probable | Light and Medium Crude Oil (including solution gas and associated byproducts) | 971,298 | 13.44 | ||||||||
| Heavy Crude Oil (including solution gas and associated byproducts) | 247,365 | 4.10 | |||||||||
| Bitumen (including solution gas and associated byproducts) | 132,290 | 2.91 | |||||||||
| Tight Oil (including solution gas and associated byproducts) | 1,184,743 | 20.21 | |||||||||
| Natural Gas (associated and non-associated) (including associated byproducts) | 53,856 | 0.58 | |||||||||
| Shale Gas (including associated byproducts) | 689,264 | 4.45 | |||||||||
| Total | 3,278,817 | ||||||||||
Note:
(1)Unit values are based on major product type net reserves volumes.
| 25 | |||||||
Pricing Assumptions
The forecast cost and price assumptions include increases in actual wellhead selling prices and take into account inflation with respect to future operating and capital costs. The reference pricing used in the Baytex Reserves Report is as follows:
SUMMARY OF PRICING AND INFLATION RATE ASSUMPTIONS FORECAST PRICES AND COSTS AS AT DECEMBER 31, 2020 (1) | ||||||||||||||||||||||||||||||||||||||||||||
| Year | Oil | Natural Gas | Inflation Rate (7) (%/Yr) | Exchange Rate (8) ($US/$Cdn) | ||||||||||||||||||||||||||||||||||||||||
WTI Crude Oil (2) ($US/bbl) | Edmonton Light Crude Oil (3) ($Cdn/bbl) | Western Canadian Select(4) ($Cdn/bbl) | Henry Hub (5) ($US/MMbtu) | AECO Spot (6) ($Cdn/MMbtu) | ||||||||||||||||||||||||||||||||||||||||
| Historical | ||||||||||||||||||||||||||||||||||||||||||||
| 2016 | 43.30 | 53.90 | 39.15 | 2.50 | 2.10 | 1.4 | 0.755 | |||||||||||||||||||||||||||||||||||||
| 2017 | 50.90 | 62.85 | 50.70 | 3.00 | 2.40 | 1.6 | 0.770 | |||||||||||||||||||||||||||||||||||||
| 2018 | 64.95 | 69.65 | 49.95 | 3.05 | 1.55 | 2.2 | 0.770 | |||||||||||||||||||||||||||||||||||||
| 2019 | 57.00 | 69.00 | 58.70 | 2.55 | 1.60 | 2.0 | 0.755 | |||||||||||||||||||||||||||||||||||||
| 2020 | 39.20 | 45.00 | 35.35 | 2.05 | 2.25 | 0.2 | 0.745 | |||||||||||||||||||||||||||||||||||||
Forecast (9) | ||||||||||||||||||||||||||||||||||||||||||||
| 2021 | 47.17 | 55.76 | 44.63 | 2.83 | 2.78 | — | 0.768 | |||||||||||||||||||||||||||||||||||||
| 2022 | 50.17 | 59.89 | 48.18 | 2.87 | 2.70 | 1.3 | 0.765 | |||||||||||||||||||||||||||||||||||||
| 2023 | 53.17 | 63.48 | 52.10 | 2.90 | 2.61 | 2.0 | 0.763 | |||||||||||||||||||||||||||||||||||||
| 2024 | 54.97 | 65.76 | 54.10 | 2.96 | 2.65 | 2.0 | 0.763 | |||||||||||||||||||||||||||||||||||||
| 2025 | 56.07 | 67.13 | 55.19 | 3.02 | 2.70 | 2.0 | 0.763 | |||||||||||||||||||||||||||||||||||||
| 2026 | 57.19 | 68.53 | 56.29 | 3.08 | 2.76 | 2.0 | 0.763 | |||||||||||||||||||||||||||||||||||||
| 2027 | 58.34 | 69.95 | 57.42 | 3.14 | 2.81 | 2.0 | 0.763 | |||||||||||||||||||||||||||||||||||||
| 2028 | 59.50 | 71.40 | 58.57 | 3.20 | 2.87 | 2.0 | 0.763 | |||||||||||||||||||||||||||||||||||||
| 2029 | 60.69 | 72.88 | 59.74 | 3.26 | 2.92 | 2.0 | 0.763 | |||||||||||||||||||||||||||||||||||||
| 2030 | 61.91 | 74.34 | 60.93 | 3.33 | 2.98 | 2.0 | 0.763 | |||||||||||||||||||||||||||||||||||||
Notes:
(1)Each price from the forecast was adjusted for quality differentials and transportation costs applicable to the specified product and evaluation area.
(2)Price used in the preparation of tight oil, condensate, and natural gas liquids reserves in the United States.
(3)Price used in the preparation of light and medium crude oil and natural gas liquids reserves in Canada.
(4)Price used in the preparation of heavy oil and bitumen reserves in Canada.
(5)Price used in the preparation of shale gas reserves in the United States.
(6)Price used in the preparation of natural gas reserves in Canada.
(7)Inflation rates for forecasting prices and costs.
(8)Exchange rate used to generate the benchmark reference prices in this table.
(9)After 2030 prices and costs escalate at 2.0% annually and the exchange rate remains 0.763.
Weighted average prices realized by us for the year ended December 31, 2020, excluding hedging activities, were $23.85/bbl for heavy oil, $27.47/bbl for bitumen, $41.93/bbl for light oil, $52.21/bbl for tight oil, $16.79/bbl for NGL, $2.27/Mcf for shale gas and $2.12/Mcf for natural gas.
| 26 | |||||||
| RECONCILIATION OF | ||||||||||||||||||||||||||||||||||||||
| GROSS RESERVES | ||||||||||||||||||||||||||||||||||||||
| BY PRINCIPAL PRODUCT TYPE | ||||||||||||||||||||||||||||||||||||||
| FORECAST PRICES AND COSTS | ||||||||||||||||||||||||||||||||||||||
| CANADA | HEAVY OIL | BITUMEN | ||||||||||||||||||||||||||||||||||||
| Proved (Mbbl) | Probable (Mbbl) | Proved Plus Probable (Mbbl) | Proved (Mbbl) | Probable (Mbbl) | Proved Plus Probable (Mbbl) | |||||||||||||||||||||||||||||||||
| December 31, 2019 | 51,311 | 37,805 | 89,116 | 11,799 | 53,743 | 65,542 | ||||||||||||||||||||||||||||||||
| Extensions | 160 | 244 | 404 | 3,027 | 696 | 3,723 | ||||||||||||||||||||||||||||||||
| Infill Drilling | — | — | — | — | — | — | ||||||||||||||||||||||||||||||||
| Improved Recovery | — | — | — | — | — | — | ||||||||||||||||||||||||||||||||
Technical Revisions (1) | 2,462 | (1,634) | 827 | (1,224) | (366) | (1,590) | ||||||||||||||||||||||||||||||||
| Discoveries | — | — | — | — | — | — | ||||||||||||||||||||||||||||||||
| Acquisitions | — | — | — | — | — | — | ||||||||||||||||||||||||||||||||
| Dispositions | (5) | (4) | (8) | — | — | — | ||||||||||||||||||||||||||||||||
Economic Factors (2) | (11,698) | (5,867) | (17,565) | (6,945) | (7,980) | (14,925) | ||||||||||||||||||||||||||||||||
| Production | (6,818) | — | (6,818) | (920) | — | (920) | ||||||||||||||||||||||||||||||||
| December 31, 2020 | 35,412 | 30,544 | 65,956 | 5,737 | 46,093 | 51,830 | ||||||||||||||||||||||||||||||||
| CANADA | LIGHT AND MEDIUM OIL | TIGHT OIL | ||||||||||||||||||||||||||||||||||||
| Proved (Mbbl) | Probable (Mbbl) | Proved Plus Probable (Mbbl) | Proved (Mbbl) | Probable (Mbbl) | Proved Plus Probable (Mbbl) | |||||||||||||||||||||||||||||||||
| December 31, 2019 | 60,619 | 31,218 | 91,837 | 3,753 | 4,099 | 7,853 | ||||||||||||||||||||||||||||||||
| Extensions | 2,840 | (1,937) | 903 | 944 | 828 | 1,772 | ||||||||||||||||||||||||||||||||
| Infill Drilling | — | — | — | — | — | — | ||||||||||||||||||||||||||||||||
| Improved Recovery | — | — | — | — | — | — | ||||||||||||||||||||||||||||||||
Technical Revisions (1) | (1,275) | (3,643) | (4,917) | 82 | (118) | (35) | ||||||||||||||||||||||||||||||||
| Discoveries | — | — | — | — | — | — | ||||||||||||||||||||||||||||||||
| Acquisitions | 16 | 3 | 19 | — | — | — | ||||||||||||||||||||||||||||||||
| Dispositions | (15) | (92) | (107) | — | — | — | ||||||||||||||||||||||||||||||||
Economic Factors (2) | (3,421) | 139 | (3,282) | (106) | (62) | (168) | ||||||||||||||||||||||||||||||||
| Production | (6,698) | — | (6,698) | (294) | — | (294) | ||||||||||||||||||||||||||||||||
| December 31, 2020 | 52,067 | 25,688 | 77,755 | 4,380 | 4,748 | 9,128 | ||||||||||||||||||||||||||||||||
| CANADA | NATURAL GAS LIQUIDS (3) | SHALE GAS | ||||||||||||||||||||||||||||||||||||
| Proved (Mbbl) | Probable (Mbbl) | Proved Plus Probable (Mbbl) | Proved (MMcf) | Probable (MMcf) | Proved Plus Probable (MMcf) | |||||||||||||||||||||||||||||||||
| December 31, 2019 | 4,393 | 4,986 | 9,380 | 7,490 | 8,019 | 15,508 | ||||||||||||||||||||||||||||||||
| Extensions | 921 | 7 | 928 | 1,879 | 1,607 | 3,486 | ||||||||||||||||||||||||||||||||
| Infill Drilling | — | — | — | — | — | — | ||||||||||||||||||||||||||||||||
| Improved Recovery | — | — | — | — | — | — | ||||||||||||||||||||||||||||||||
Technical Revisions (1) | 356 | (628) | (272) | 708 | (16) | 693 | ||||||||||||||||||||||||||||||||
| Discoveries | — | — | — | — | — | — | ||||||||||||||||||||||||||||||||
| Acquisitions | 1 | — | 1 | — | — | — | ||||||||||||||||||||||||||||||||
| Dispositions | — | (4) | (4) | — | — | — | ||||||||||||||||||||||||||||||||
Economic Factors (2) | (754) | 479 | (275) | (235) | (113) | (348) | ||||||||||||||||||||||||||||||||
| Production | (448) | — | (448) | (598) | — | (598) | ||||||||||||||||||||||||||||||||
| December 31, 2020 | 4,468 | 4,840 | 9,309 | 9,244 | 9,497 | 18,741 | ||||||||||||||||||||||||||||||||
| 27 | |||||||
| CANADA | CONVENTIONAL NATURAL GAS (4) | OIL EQUIVALENT | ||||||||||||||||||||||||||||||||||||
| Proved (MMcf) | Probable (MMcf) | Proved Plus Probable (MMcf) | Proved (Mboe) | Probable (Mboe) | Proved Plus Probable (Mboe) | |||||||||||||||||||||||||||||||||
| December 31, 2019 | 104,506 | 99,816 | 204,323 | 150,542 | 149,824 | 300,366 | ||||||||||||||||||||||||||||||||
| Extensions | 12,937 | (11,371) | 1,565 | 10,361 | (1,789) | 8,571 | ||||||||||||||||||||||||||||||||
| Infill Drilling | — | — | — | — | — | — | ||||||||||||||||||||||||||||||||
| Improved Recovery | — | — | — | — | — | — | ||||||||||||||||||||||||||||||||
Technical Revisions (1) | 9,360 | (10,854) | (1,494) | 2,079 | (8,200) | (6,121) | ||||||||||||||||||||||||||||||||
| Discoveries | — | — | — | — | — | — | ||||||||||||||||||||||||||||||||
| Acquisitions | 19 | 3 | 22 | 20 | 4 | 24 | ||||||||||||||||||||||||||||||||
| Dispositions | (38) | (348) | (386) | (26) | (158) | (184) | ||||||||||||||||||||||||||||||||
Economic Factors (2) | (23,824) | 9,531 | (14,293) | (26,933) | (11,721) | (38,654) | ||||||||||||||||||||||||||||||||
| Production | (15,066) | — | (15,066) | (17,788) | — | (17,788) | ||||||||||||||||||||||||||||||||
| December 31, 2020 | 87,894 | 86,778 | 174,671 | 118,254 | 127,959 | 246,212 | ||||||||||||||||||||||||||||||||
| UNITED STATES | TIGHT OIL | NATURAL GAS LIQUIDS (3) | ||||||||||||||||||||||||||||||||||||
| Proved (Mbbl) | Probable (Mbbl) | Proved Plus Probable (Mbbl) | Proved (Mbbl) | Probable (Mbbl) | Proved Plus Probable (Mbbl) | |||||||||||||||||||||||||||||||||
| December 31, 2019 | 51,809 | 20,040 | 71,849 | 73,545 | 30,667 | 104,213 | ||||||||||||||||||||||||||||||||
| Extensions | 675 | 463 | 1,138 | 620 | 901 | 1,521 | ||||||||||||||||||||||||||||||||
| Infill Drilling | — | — | — | — | — | — | ||||||||||||||||||||||||||||||||
| Improved Recovery | — | — | — | — | — | — | ||||||||||||||||||||||||||||||||
Technical Revisions (1) | 1,697 | (530) | 1,167 | (1,114) | (3,326) | (4,440) | ||||||||||||||||||||||||||||||||
| Discoveries | — | — | — | — | — | — | ||||||||||||||||||||||||||||||||
Acquisitions | — | — | — | — | — | — | ||||||||||||||||||||||||||||||||
| Dispositions | — | — | — | — | — | — | ||||||||||||||||||||||||||||||||
Economic Factors (2) | (486) | (79) | (565) | (994) | (323) | (1,317) | ||||||||||||||||||||||||||||||||
| Production | (4,758) | — | (4,758) | (4,051) | — | (4,051) | ||||||||||||||||||||||||||||||||
| December 31, 2020 | 48,936 | 19,894 | 68,830 | 68,007 | 27,920 | 95,927 | ||||||||||||||||||||||||||||||||
| UNITED STATES | SHALE GAS | OIL EQUIVALENT | ||||||||||||||||||||||||||||||||||||
| Proved (MMcf) | Probable (MMcf) | Proved Plus Probable (MMcf) | Proved (Mboe) | Probable (Mboe) | Proved Plus Probable (Mboe) | |||||||||||||||||||||||||||||||||
| December 31, 2019 | 226,672 | 91,720 | 318,393 | 163,133 | 65,994 | 229,127 | ||||||||||||||||||||||||||||||||
| Extensions | 2,159 | 3,675 | 5,835 | 1,655 | 1,976 | 3,631 | ||||||||||||||||||||||||||||||||
| Infill Drilling | — | — | — | — | — | — | ||||||||||||||||||||||||||||||||
| Improved Recovery | — | — | — | — | — | — | ||||||||||||||||||||||||||||||||
Technical Revisions (1) | 6,517 | (6,913) | (396) | 1,670 | (5,008) | (3,339) | ||||||||||||||||||||||||||||||||
| Discoveries | — | — | — | — | — | — | ||||||||||||||||||||||||||||||||
| Acquisitions | — | — | — | — | — | — | ||||||||||||||||||||||||||||||||
| Dispositions | — | — | — | — | — | — | ||||||||||||||||||||||||||||||||
Economic Factors (2) | (2,643) | (1,127) | (3,770) | (1,921) | (590) | (2,510) | ||||||||||||||||||||||||||||||||
| Production | (15,615) | — | (15,615) | (11,412) | — | (11,412) | ||||||||||||||||||||||||||||||||
| December 31, 2020 | 217,090 | 87,355 | 304,445 | 153,125 | 62,373 | 215,497 | ||||||||||||||||||||||||||||||||
| 28 | |||||||
| TOTAL | HEAVY OIL | BITUMEN | ||||||||||||||||||||||||||||||||||||
| Proved (Mbbl) | Probable (Mbbl) | Proved Plus Probable (Mbbl) | Proved (Mbbl) | Probable (Mbbl) | Proved Plus Probable (Mbbl) | |||||||||||||||||||||||||||||||||
| December 31, 2019 | 51,311 | 37,805 | 89,116 | 11,799 | 53,743 | 65,542 | ||||||||||||||||||||||||||||||||
| Extensions | 160 | 244 | 404 | 3,027 | 696 | 3,723 | ||||||||||||||||||||||||||||||||
| Infill Drilling | — | — | — | — | — | — | ||||||||||||||||||||||||||||||||
| Improved Recovery | — | — | — | — | — | — | ||||||||||||||||||||||||||||||||
Technical Revisions (1) | 2,462 | (1,634) | 827 | (1,224) | (366) | (1,590) | ||||||||||||||||||||||||||||||||
| Discoveries | — | — | — | — | — | — | ||||||||||||||||||||||||||||||||
| Acquisitions | — | — | — | — | — | — | ||||||||||||||||||||||||||||||||
| Dispositions | (5) | (4) | (8) | — | — | — | ||||||||||||||||||||||||||||||||
Economic Factors (2) | (11,698) | (5,867) | (17,565) | (6,945) | (7,980) | (14,925) | ||||||||||||||||||||||||||||||||
| Production | (6,818) | — | (6,818) | (920) | — | (920) | ||||||||||||||||||||||||||||||||
| December 31, 2020 | 35,412 | 30,544 | 65,956 | 5,737 | 46,093 | 51,830 | ||||||||||||||||||||||||||||||||
| TOTAL | LIGHT AND MEDIUM OIL | TIGHT OIL | ||||||||||||||||||||||||||||||||||||
| Proved (Mbbl) | Probable (Mbbl) | Proved Plus Probable (Mbbl) | Proved (Mbbl) | Probable (Mbbl) | Proved Plus Probable (Mbbl) | |||||||||||||||||||||||||||||||||
| December 31, 2019 | 60,619 | 31,218 | 91,837 | 55,562 | 24,139 | 79,701 | ||||||||||||||||||||||||||||||||
| Extensions | 2,840 | (1,937) | 903 | 1,618 | 1,291 | 2,909 | ||||||||||||||||||||||||||||||||
| Infill Drilling | — | — | — | — | — | — | ||||||||||||||||||||||||||||||||
| Improved Recovery | — | — | — | — | — | — | ||||||||||||||||||||||||||||||||
Technical Revisions (1) | (1,275) | (3,643) | (4,917) | 1,780 | (648) | 1,132 | ||||||||||||||||||||||||||||||||
| Discoveries | — | — | — | — | — | — | ||||||||||||||||||||||||||||||||
| Acquisitions | 16 | 3 | 19 | — | — | — | ||||||||||||||||||||||||||||||||
| Dispositions | (15) | (92) | (107) | — | — | — | ||||||||||||||||||||||||||||||||
Economic Factors (2) | (3,421) | 139 | (3,282) | (592) | (141) | (733) | ||||||||||||||||||||||||||||||||
| Production | (6,698) | — | (6,698) | (5,052) | — | (5,052) | ||||||||||||||||||||||||||||||||
| December 31, 2020 | 52,067 | 25,688 | 77,755 | 53,316 | 24,642 | 77,958 | ||||||||||||||||||||||||||||||||
| TOTAL | NATURAL GAS LIQUIDS (3) | SHALE GAS | ||||||||||||||||||||||||||||||||||||
| Proved (Mbbl) | Probable (Mbbl) | Proved Plus Probable (Mbbl) | Proved (MMcf) | Probable (MMcf) | Proved Plus Probable (MMcf) | |||||||||||||||||||||||||||||||||
| December 31, 2019 | 77,939 | 35,654 | 113,592 | 234,162 | 99,739 | 333,901 | ||||||||||||||||||||||||||||||||
| Extensions | 1,541 | 908 | 2,449 | 4,038 | 5,283 | 9,320 | ||||||||||||||||||||||||||||||||
| Infill Drilling | — | — | — | — | — | — | ||||||||||||||||||||||||||||||||
| Improved Recovery | — | — | — | — | — | — | ||||||||||||||||||||||||||||||||
Technical Revisions (1) | (758) | (3,954) | (4,712) | 7,225 | (6,929) | 296 | ||||||||||||||||||||||||||||||||
| Discoveries | — | — | — | — | — | — | ||||||||||||||||||||||||||||||||
| Acquisitions | 1 | — | 1 | — | — | — | ||||||||||||||||||||||||||||||||
| Dispositions | — | (4) | (4) | — | — | — | ||||||||||||||||||||||||||||||||
Economic Factors (2) | (1,748) | 157 | (1,592) | (2,877) | (1,240) | (4,118) | ||||||||||||||||||||||||||||||||
| Production | (4,499) | — | (4,499) | (16,213) | — | (16,213) | ||||||||||||||||||||||||||||||||
| December 31, 2020 | 72,475 | 32,760 | 105,235 | 226,334 | 96,852 | 323,186 | ||||||||||||||||||||||||||||||||
| 29 | |||||||
| TOTAL | CONVENTIONAL NATURAL GAS (4) | OIL EQUIVALENT | ||||||||||||||||||||||||||||||||||||
| Proved (MMcf) | Probable (MMcf) | Proved Plus Probable (MMcf) | Proved (Mboe) | Probable (Mboe) | Proved Plus Probable (Mboe) | |||||||||||||||||||||||||||||||||
| December 31, 2019 | 104,506 | 99,816 | 204,323 | 313,674 | 215,818 | 529,492 | ||||||||||||||||||||||||||||||||
| Extensions | 12,937 | (11,371) | 1,565 | 12,015 | 187 | 12,202 | ||||||||||||||||||||||||||||||||
| Infill Drilling | — | — | — | — | — | — | ||||||||||||||||||||||||||||||||
| Improved Recovery | — | — | — | — | — | — | ||||||||||||||||||||||||||||||||
Technical Revisions (1) | 9,360 | (10,854) | (1,494) | 3,749 | (13,208) | (9,460) | ||||||||||||||||||||||||||||||||
| Discoveries | — | — | — | — | — | — | ||||||||||||||||||||||||||||||||
| Acquisitions | 19 | 3 | 22 | 20 | 4 | 24 | ||||||||||||||||||||||||||||||||
| Dispositions | (38) | (348) | (386) | (26) | (158) | (184) | ||||||||||||||||||||||||||||||||
Economic Factors (2) | (23,824) | 9,531 | (14,293) | (28,854) | (12,311) | (41,165) | ||||||||||||||||||||||||||||||||
| Production | (15,066) | — | (15,066) | (29,200) | — | (29,200) | ||||||||||||||||||||||||||||||||
| December 31, 2020 | 87,894 | 86,778 | 174,671 | 271,378 | 190,332 | 461,710 | ||||||||||||||||||||||||||||||||
Notes:
(1)Positive and negative revisions in heavy oil, bitumen, light and medium oil and tight oil are due to variations in performance versus previous forecasts in our Viking, Eagle Ford, Peace River and Lloydminster assets. Technical revisions for conventional natural gas are a combination of performance revisions in our Deep Basin assets and performance revisions for solution gas (classified as conventional natural gas) from our light and heavy oil properties. Positive revisions for shale gas are attributed to improved performance in the Duvernay and Eagle Ford assets.
(2)The forecast price assumptions used by the reserves evaluator at year-end 2020 were substantially lower than those used at year-end 2019, resulting in significant negative revisions under the Economic Factors category.
(3)Natural gas liquids includes condensate.
(4)Conventional natural gas includes associated, non-associated and solution gas.
Additional Information Relating to Reserves Data
Undeveloped Reserves
Undeveloped reserves are attributed in accordance with standards and procedures contained in the COGE Handbook. Proved undeveloped reserves are those reserves that can be estimated with a high degree of certainty and are expected to be recovered from known accumulations where a significant expenditure is required to render them capable of production. Probable undeveloped reserves are those reserves that are less certain to be recovered than proved reserves and are expected to be recovered from known accumulations where a significant expenditure is required to render them capable of production.
We allocate development capital to our assets annually. We reduce risk by technically assessing the prior year's results from our development programs before committing additional capital. Furthermore, planned activity levels vary each year due to factors such as prevailing commodity prices, capital availability, operational spacing considerations, timing of infrastructure construction and regulatory processes. This approach means that in most cases it will take longer than three years to develop our proved undeveloped reserves and longer than five years to develop our proved plus probable undeveloped reserves. With the exception of our Gemini SAGD project, we plan to develop the majority of our proved undeveloped reserves over the next five years and our probable undeveloped reserves over the next seven years.
At our Gemini SAGD project, steam generation represents a large proportion of the capital and operating costs. Therefore, our development plans anticipate that, in order to make the most efficient use of our steam generating and oil treating facilities, the drilling and steaming of wells would take place over approximately the next 32 years. We have booked 44.5 MMbbls of probable undeveloped reserves to the Gemini SAGD project.
| 30 | |||||||
Proved Undeveloped Reserves
The following table discloses, for each product type, the volumes of proved undeveloped reserves that were attributed during, and the volume booked at year-end for, the three most recently completed financial years.
| Light and Medium Oil Gross (Mbbl) | Tight Oil Gross (Mbbl) | Heavy Oil Gross (Mbbl) | Bitumen Gross (Mbbl) | |||||||||||||||||||||||||||||||||||||||||||||||
| Year | First Attributed | Booked at Year End | First Attributed | Booked at Year End | First Attributed | Booked at Year End | First Attributed | Booked at Year End | ||||||||||||||||||||||||||||||||||||||||||
| 2018 | 40,127 | 40,296 | 1,640 | 33,694 | 2,646 | 23,530 | — | 3,126 | ||||||||||||||||||||||||||||||||||||||||||
| 2019 | 6,136 | 33,322 | 5,373 | 32,250 | 2,322 | 22,691 | — | 1,892 | ||||||||||||||||||||||||||||||||||||||||||
| 2020 | 2,039 | 31,601 | 1,152 | 29,805 | 82 | 13,499 | 3,027 | 4,434 | ||||||||||||||||||||||||||||||||||||||||||
| Conventional Natural Gas Gross (MMcf) | Shale Gas Gross (MMcf) | Natural Gas Liquids Gross (Mbbl) | ||||||||||||||||||||||||||||||||||||
| Year | First Attributed | Booked at Year End | First Attributed | Booked at Year End | First Attributed | Booked at Year End | ||||||||||||||||||||||||||||||||
| 2018 | 17,728 | 85,134 | 1,905 | 82,257 | 600 | 41,484 | ||||||||||||||||||||||||||||||||
| 2019 | 3,116 | 45,272 | 20,951 | 133,516 | 6,758 | 43,333 | ||||||||||||||||||||||||||||||||
| 2020 | 12,306 | 29,438 | 2,676 | 128,541 | 1,140 | 40,167 | ||||||||||||||||||||||||||||||||
Probable Undeveloped Reserves
The following table discloses, for each product type, the volumes of probable undeveloped reserves that were attributed during, and the volume booked at year-end for, the three most recently completed financial years.
Light and Medium Oil Gross (Mbbl) | Tight Oil Gross (Mbbl) | Heavy Oil Gross (Mbbl) | Bitumen Gross (Mbbl) | |||||||||||||||||||||||||||||||||||||||||||||||
| Year | First Attributed | Booked at Year End | First Attributed | Booked at Year End | First Attributed | Booked at Year End | First Attributed | Booked at Year End | ||||||||||||||||||||||||||||||||||||||||||
| 2018 | 12,120 | 12,524 | 3,060 | 16,145 | 1,984 | 31,295 | — | 46,535 | ||||||||||||||||||||||||||||||||||||||||||
| 2019 | 8,613 | 22,643 | 2,879 | 18,895 | 767 | 28,409 | — | 44,954 | ||||||||||||||||||||||||||||||||||||||||||
| 2020 | (2,038) | 19,315 | 1,174 | 19,619 | 226 | 22,844 | 696 | 45,588 | ||||||||||||||||||||||||||||||||||||||||||
Conventional Natural Gas Gross (MMcf) | Shale Gas Gross (MMcf) | Natural Gas Liquids Gross (Mbbl) | ||||||||||||||||||||||||||||||||||||
| Year | First Attributed | Booked at Year End | First Attributed | Booked at Year End | First Attributed | Booked at Year End | ||||||||||||||||||||||||||||||||
| 2018 | 9,681 | 97,183 | 4,866 | 51,670 | 1,252 | 29,398 | ||||||||||||||||||||||||||||||||
| 2019 | 1,260 | 80,635 | 2,421 | 76,884 | 47 | 27,737 | ||||||||||||||||||||||||||||||||
| 2020 | (11,386) | 70,042 | 5,499 | 76,050 | 1,006 | 25,715 | ||||||||||||||||||||||||||||||||
Significant Factors or Uncertainties
The process of estimating reserves is complex. It requires significant judgments and decisions based on available geological, geophysical, engineering, and economic data. These estimates may change substantially as additional data from ongoing development activities and production performance becomes available and as economic conditions impacting oil and gas prices and costs change.
The reserve estimates contained herein are based on current production forecasts, prices and economic conditions. As circumstances change and additional data becomes available, reserve estimates also change. Estimates made are reviewed and revised, either upward or downward, as warranted by the new information. Revisions are often required due to changes in well performance, commodity prices, economic conditions and governmental restrictions.
| 31 | |||||||
Although every reasonable effort is made to ensure that reserve estimates are accurate, reserve estimation is an inferential science. As a result, subjective decisions, new geological or production information and a changing environment may impact these estimates. Revisions to reserve estimates can arise from changes in year-end oil and gas prices and reservoir performance. Such revisions can be either positive or negative.
In the event that prices for oil and gas are not consistent with those used to prepare the Baytex Reserves Report, the volume of our reserves, their net present value and our expected revenues will differ, perhaps materially so, from those stated in the Baytex Reserves Report.
In connection with our operations, we will be liable for our share of ongoing environmental obligations and for the ultimate reclamation of our surface leases, wells and facilities. The total liability associated with these existing surface leases, wells and facilities, inflated at 2% per year, is estimated to be $1,050 million undiscounted ($223 million discounted at 10 percent). This is comprised of $391 million undiscounted ($60 million discounted at 10 percent) associated with active properties, $432 million undiscounted ($129 million discounted at 10 percent) associated with inactive properties, and $227 million undiscounted ($34 million discounted at 10 percent) associated with facilities.
Future Development Costs
The following table sets forth development costs deducted in the estimation of the future net revenue attributable to the reserve categories noted below (using forecast prices and costs).
FUTURE DEVELOPMENT COSTS
AS OF DECEMBER 31, 2020
FORECAST PRICES AND COSTS
($000s)
| CANADA | UNITED STATES | TOTAL | ||||||||||||||||||||||||||||||||||||||||||
| Proved Reserves | Proved plus Probable Reserves | Proved Reserves | Proved plus Probable Reserves | Proved Reserves | Proved plus Probable Reserves | |||||||||||||||||||||||||||||||||||||||
| 2021 | 172,718 | 180,468 | 103,005 | 103,005 | 275,723 | 283,473 | ||||||||||||||||||||||||||||||||||||||
| 2022 | 240,989 | 293,488 | 197,874 | 197,874 | 438,863 | 491,362 | ||||||||||||||||||||||||||||||||||||||
| 2023 | 303,704 | 386,188 | 173,647 | 173,647 | 477,351 | 559,835 | ||||||||||||||||||||||||||||||||||||||
| 2024 | 255,258 | 360,567 | 176,567 | 177,881 | 431,825 | 538,448 | ||||||||||||||||||||||||||||||||||||||
| 2025 | 277,201 | 402,725 | 142,968 | 176,972 | 420,168 | 579,697 | ||||||||||||||||||||||||||||||||||||||
| Remaining | 49,653 | 788,632 | — | 364,439 | 49,653 | 1,153,071 | ||||||||||||||||||||||||||||||||||||||
| Total (undiscounted) | 1,299,523 | 2,412,068 | 794,061 | 1,193,818 | 2,093,584 | 3,605,886 | ||||||||||||||||||||||||||||||||||||||
We expect to fund the development costs of our reserves through a combination of internally generated cash flow, debt and equity financing. Planned activity levels vary each year due to factors such as capital availability, prevailing commodity prices and regulatory processes.
There can be no guarantee that funds will be available or that our Board of Directors will allocate funding to develop all of the reserves attributed in the Baytex Reserves Report. Failure to develop those reserves could have a negative impact on our future cash flow.
The interest or other costs of external funding are not included in the reserves and future net revenue estimates set forth herein and would reduce reserves and future net revenue to some degree depending upon the funding sources utilized and the costs thereof. We do not anticipate that interest or other funding costs would make development of any of these properties uneconomic.
| 32 | |||||||
RISK FACTORS
You should carefully consider the following risk factors, as well as the other information contained in this AIF and our other public filings before making an investment decision. If any of the risks described below materialize, our business, reputation, financial condition, results of operations and cash flow could be materially and adversely affected, which may materially affect the market price of our securities. Additional risks and uncertainties not currently known to us that we currently view as immaterial may also materially and adversely affect us. Residents of the United States and other non-residents of Canada should have additional regard to the risk factors under the heading "Certain Risks for United States and other non-resident Shareholders".
The information set forth below contains forward-looking statements, which are qualified by the information contained in the section of this AIF entitled "Special Notes to Reader - Forward-Looking Statements".
Risks Relating to Our Business and Operations
Volatility of oil and natural gas prices and price differentials
Our financial condition is substantially dependent on, and highly sensitive to, the prevailing prices of crude oil and natural gas. Low prices for crude oil and natural gas produced by us could have a material adverse effect on our operations, financial condition and the value and amount of our reserves.
Prices for crude oil and natural gas fluctuate in response to changes in the supply of, and demand for, crude oil and natural gas, market uncertainty and a variety of additional factors beyond our control. Crude oil prices are primarily determined by international supply and demand. Factors which affect crude oil prices include the actions of OPEC, OPEC+, the condition of the Canadian, United States, European and Asian economies (including conditions resulting from the impact of the Covid-19), government regulation, political stability in the Middle East and elsewhere, the supply of crude oil in North America and internationally, the ability to secure adequate transportation for products, the availability of alternate fuel sources and weather conditions. Natural gas prices realized by us are affected primarily in North America by supply and demand, weather conditions, industrial demand, prices of alternate sources of energy and developments related to the market for liquefied natural gas. All of these factors are beyond our control and can result in a high degree of price volatility. Fluctuations in currency exchange rates further compound this volatility when commodity prices, which are generally set in U.S. dollars, are stated in Canadian dollars.
Our financial performance also depends on revenues from the sale of commodities which differ in quality and location from underlying commodity prices quoted on financial exchanges. Of particular importance are the price differentials between our light/medium oil and heavy oil (in particular the light/heavy differential) and quoted market prices. Not only are these discounts influenced by regional supply and demand factors, they are also influenced by other factors such as transportation costs, capacity and interruptions, refining demand, storage capacity, the availability and cost of diluents used to blend and transport product and the quality of the oil produced, all of which are beyond our control. In addition, there is not sufficient pipeline capacity for Canadian crude oil to access the American refinery complex or tidewater to access world markets and the availability of additional transport capacity via rail is more expensive and variable, therefore, the price for Canadian crude oil is very sensitive to pipeline and refinery outages, which contributes to this volatility.
Decreases to or prolonged periods of low commodity prices, particularly for oil, may negatively impact our ability to meet guidance targets, maintain our business and meet all of our financial obligations as they come due. It could also result in the shut-in of currently producing wells without an equivalent decrease in expenses due to fixed costs, a delay or cancellation of existing or future drilling, development or construction programs, un-utilized long-term transportation commitments and a reduction in the value and amount of our reserves.
| 33 | |||||||
We conduct assessments of the carrying value of our assets in accordance with Canadian GAAP. If crude oil and natural gas forecast prices change, the carrying value of our assets could be subject to revision and our net earnings could be adversely affected.
Availability and cost of capital or borrowing to maintain and/or fund future development and acquisitions
The future development of our business may be dependent on our ability to obtain additional capital including, but not limited to, debt and equity financing. Unpredictable financial markets and the associated credit impacts may impede our ability to secure and maintain cost effective financing and limit our ability to achieve timely access to capital on acceptable terms and conditions. If external sources of capital become limited or unavailable, our ability to make capital investments, continue our business plan, meet all of our financial obligations as they come due and maintain existing properties may be impaired.
Our ability to obtain additional capital is dependent on, among other things, a general interest in energy industry investments and, in particular, interest in our securities along with our ability to maintain our credit ratings. If we are unable to maintain our indebtedness and financial ratios at levels acceptable to our credit rating agencies, or should our business prospects deteriorate, our credit ratings could be downgraded. This would adversely affect the value of our outstanding securities and existing debt and our ability to obtain new financing, and may increase our borrowing costs.
From time to time we may enter into transactions which may be financed in whole or in part with debt or equity. The level of our indebtedness from time to time, could impair our ability to obtain additional financing on a timely basis to take advantage of business opportunities that may arise. Additionally, from time to time, we may issue securities from treasury in order to reduce debt, complete acquisitions and/or optimize our capital structure.
Our success is highly dependent on our ability to exploit existing properties and add to our oil and natural gas reserves
Our oil and natural gas reserves are a depleting resource and decline as such reserves are produced, as a result, our long-term commercial success depends on our ability to find, acquire, develop and commercially produce oil and natural gas reserves. The business of exploring for, developing or acquiring reserves is capital intensive. If external sources of capital become limited or unavailable on commercially reasonable terms, our ability to make the necessary capital investments to maintain or expand our oil and natural gas reserves may be impaired. Future oil and natural gas exploration may involve unprofitable efforts, not only from unsuccessful wells, but also from wells that are productive but do not produce sufficient petroleum substances to return a profit. Completion of a well does not assure a profit on the investment. Drilling hazards or environmental liabilities or damages could greatly increase the cost of operations, and various field operating conditions may adversely affect the production from successful wells. These conditions include delays or failure in obtaining governmental approvals or consents, shut-ins of connected wells resulting from extreme weather conditions, insufficient storage or transportation capacity or other geological and mechanical conditions. While diligent well supervision and effective maintenance operations can contribute to maximizing production rates over time, production delays and declines from normal field operating conditions cannot be eliminated and can be expected to adversely affect revenue and cash flow from operating activities to varying degrees.
There is no assurance we will be successful in developing our reserves or acquiring additional reserves at acceptable costs. Without these reserves additions, our reserves will deplete and as a consequence production from and the average reserve life of our properties will decline, which may adversely affect our business, financial condition, results of operations and prospects.
| 34 | |||||||
The amount of oil and natural gas that we can produce and sell is subject to the availability and cost of gathering, processing and pipeline systems
We deliver our products through gathering, processing and pipeline systems which we do not own and purchasers of our products rely on third party infrastructure to deliver our products to market. The lack of access to capacity in any of the gathering, processing and pipeline systems could result in our inability to realize the full economic potential of our production or in a reduction of the price offered for our production. Alternately, a substantial decrease in the use of such systems can increase the cost we incur to use them. Any significant change in market factors or other conditions affecting these infrastructure systems and facilities, as well as any delays in constructing new infrastructure systems and facilities, could harm our business and, in turn, our financial condition. A significant change may result from the conversion of most of the capacity on the Enbridge mainline from the common carrier model, which will end on July 1, 2021, to a contracted service model, where only shippers who sign long term transportation agreements will have access.
Access to the pipeline capacity for the export of crude oil from Canada has, at times, been inadequate for the amount of Canadian production being exported. This has resulted in significantly lower prices being realized by Canadian producers compared with the WTI price and the Brent price for crude oil. Although pipeline expansions are ongoing, the lack of pipeline capacity continues to affect the oil and natural gas industry in Canada and limit the ability to produce and obtain global benchmark pricing for oil and natural gas production. In addition, the pro-rationing of capacity on inter-provincial pipeline systems also continues to affect the ability to export oil and natural gas from Canada. There can be no certainty that investment in pipelines, which would result in additional long-term take-away capacity, will be made by applicable third party pipeline providers or that any requisite applications will receive regulatory approval. There is also no certainty that short-term operational constraints on pipeline systems, arising from pipeline interruption and/or increased supply of crude oil, will not occur.
There is no certainty that crude-by-rail transportation and other alternative types of transportation for our production will be sufficient to address any gaps caused by operational constraints on pipeline systems. In addition, our crude-by-rail shipments may be impacted by service delays, inclement weather, derailment or blockades and could adversely impact our crude oil sales volumes or the price received for our product. Crude oil produced and sold by us may be involved in a derailment or incident that results in legal liability or reputational harm.
A portion of our production may be processed through facilities controlled by third parties. From time to time these facilities may discontinue or decrease operations either as a result of normal servicing requirements or as a result of unexpected events. A discontinuance or decrease of operations could materially adversely affect our ability to process our production and to deliver the same for sale.
Our Credit Facilities may not provide sufficient liquidity and a failure to renew our Credit Facilities at maturity could adversely affect our financial condition
Our Credit Facilities and any replacement credit facilities may not provide sufficient liquidity. The amounts available under our Credit Facilities may not be sufficient for future operations, or we may not be able to obtain additional financing on economic terms, if at all. There can be no assurance that the amount of our Credit Facilities will be adequate for our future financial obligations, including future capital expenditures, or that we will be able to obtain additional funds. In the event we are unable to refinance our debt obligations, it may impact our ability to fund ongoing operations. In the event that the Credit Facilities are not extended before April 2, 2024, indebtedness under the Credit Facilities will be repayable at that time. There is also a risk that the Credit Facilities will not be renewed for the same amount or on the same terms. See "Description of Capital Structure".
| 35 | |||||||
Failure to comply with the covenants in the agreements governing our debt, including our obligation to repay the Senior Notes at maturity, could adversely affect our financial condition
We are required to comply with the covenants in our Credit Facilities and the Senior Notes. If we fail to comply with such covenants, are unable to repay or refinance amounts owned at maturity or pay the debt service charges or otherwise commit an event of default, such as bankruptcy, it could result in the seizure and/or sale of our assets by our creditors. The proceeds from any sale of our assets would be applied to satisfy amounts owed to the secured creditors and then unsecured creditors. Only after the proceeds of that sale were applied towards our debt would the remainder, if any, be available for the benefit of our Shareholders.
We are not the operator of our drilling locations in our Eagle Ford acreage and, therefore, we will not be able to control the timing of development, associated costs or the rate of production of that acreage
Marathon Oil is the operator of our Eagle Ford acreage and we are reliant upon Marathon Oil to operate successfully. Marathon Oil will make decisions based on its own best interest and the collective best interest of all of the working interest owners of this acreage, which may not be in our best interest. We have a limited ability to exercise influence over the operational decisions of Marathon Oil, including the setting of capital expenditure budgets and determination of drilling locations and schedules. The success and timing of development activities, operated by Marathon Oil, will depend on a number of factors that will largely be outside of our control, including:
•the timing and amount of capital expenditures;
•Marathon Oil's expertise and financial resources;
•approval of other participants in drilling wells;
•selection of technology; and
•the rate of production of reserves, if any.
To the extent that the capital expenditure requirements related to our Eagle Ford acreage exceeds our budgeted amounts, it may reduce the amount of capital we have available to invest in our other assets. We have the ability to elect whether or not to participate in well locations proposed by Marathon Oil on an individual basis. If we elect to not participate in a well location, we forgo any revenue from such well until Marathon Oil has recouped, from our working interest share of production from such well, 300% to 500% of our working interest share of the cost of such well.
Public perception and its influence on the regulatory regime
Concern over the impact of oil and gas development on the environment and climate change has received considerable attention in the media and recent public commentary, and the social value proposition of resource development is being challenged. Additionally, certain pipeline leaks, rail car derailments, major weather events and induced seismicity events have gained media, environmental and other stakeholder attention. Future laws and regulation may be impacted by such incidents, which could have a material adverse effect on our financial condition, results of operations or prospects.
Restrictions and/or costs associated with regulatory initiatives to combat climate change and the physical risks of climate change may have a material adverse affect on our business
Regulatory and Policy Initiatives
Our exploration and production facilities and other operational activities emit GHGs. As such, it is highly likely that GHG emissions regulation (including carbon taxes) enacted in jurisdictions where we operate will impact us.
| 36 | |||||||
Negative consequences which could result from new GHG emissions regulation include, but are not limited to: increased operating costs, increased construction and development costs, additional monitoring and compliance costs, a requirement to redesign or retrofit current facilities, permitting delays, additional costs associated with the purchase of emission credits or allowances and reduced demand for crude oil. Additionally, if GHG emissions regulation differs by region or type of production, all or part of our production could be subject to costs which are disproportionately higher than those of other producers.
The direct or indirect costs of compliance with GHG emissions regulation may have a material adverse affect on our business, financial condition, results of operations and prospects. At this time, it is not possible to predict whether compliance costs will have a material adverse affect our financial condition, results of operations or prospects.
Although we provide for the necessary amounts in our annual capital budget to fund our currently estimated obligations, there can be no assurance that we will be able to satisfy our actual future obligations associated with GHG emissions from such funds. For more information on the evolution and status of climate change and related environmental legislation, see "Industry Conditions - Climate Change Regulation".
Physical Risk
Climate change has been linked to extreme weather conditions. Extreme hot and cold weather, heavy snowfall, heavy rain fall, hurricanes and wildfires may restrict our ability to access our properties, cause operational difficulties including damage to machinery and facilities. Extreme weather also increases the risk of personnel injury as a result of dangerous working conditions. Certain of our assets are located where they are exposed to forest fires, floods, heavy rains, hurricanes and other extreme weather conditions which can lead to significant downtime, damage to such assets and/or increased costs of construction and maintenance. Moreover, extreme weather conditions may lead to disruptions in our ability to transport produced oil and natural gas as well as goods and services in our supply chain.
New regulations on hydraulic fracturing may lead to operational delays, increased costs and/or decreased production volumes
Hydraulic fracturing involves the injection of water, sand and small amounts of additives under pressure into rock formations to stimulate the production of oil and natural gas. Specifically, hydraulic fracturing enables the production of commercial quantities of oil and natural gas from reservoirs that were previously unproductive. Hydraulic fracturing has featured prominently in recent political, media and activist commentary on the subject of water usage, induced seismicity events and environmental damage. Any new laws, regulations or permitting requirements regarding hydraulic fracturing could lead to operational delays, increased operating costs, third party or governmental claims, and could increase the Corporation's costs of compliance and doing business as well as delay the development of oil and natural gas resources from shale formations, which are not commercial without the use of hydraulic fracturing. Restrictions on hydraulic fracturing could also reduce the amount of oil and natural gas that we are ultimately able to produce from our reserves.
Regulatory water use restrictions and/or limited access to water or other fluids may impact the Corporation's ability to fracture its wells or carry out waterflood operations
The Corporation undertakes or intends to undertake certain hydraulic fracturing, SAGD, CCS and waterflooding programs. To undertake such operations the Corporation needs to have access to sufficient volumes of water, or other liquids. There is no certainty that the Corporation will have access to the required volumes of water. In addition, in certain areas there may be restrictions on water use for activities such as hydraulic fracturing, SAGD, CCS and waterflooding. If the Corporation is unable to access such water it may not be able to undertake hydraulic fracturing, SAGD, CCS or waterflooding activities, which may reduce the amount of oil and natural gas that the Corporation is ultimately able to produce from its reserves.
| 37 | |||||||
Changes in government controls, legislation or regulations that affect the oil and gas industry, or failing to comply with such controls, legislation or regulations, could adversely affect us
The oil and gas industry is subject to extensive controls and regulations governing its operations (including land tenure, exploration, development, production, refining, transportation, and marketing) imposed by legislation enacted by various levels of government and, with respect to pricing and taxation of oil and natural gas, by agreements among the governments of Canada, Alberta, Saskatchewan, the United States and Texas, all of which should be carefully considered by investors in the oil and gas industry. All such controls, regulations and legislation are subject to revocation, amendment or administrative change, some of which have historically been material and in some cases materially adverse and there can be no assurance that there will not be further revocation, amendment or administrative change which will be materially adverse to our assets, reserves, financial condition, results of operations or prospects. See "Industry Conditions".
The oil and gas industry is also subject to regulation by governments in such matters as the awarding or acquisition of exploration and production rights, oil sands or other interests, the imposition of specific drilling obligations, environmental protection controls, control over the development and abandonment of fields (including restrictions on production) and possibly expropriation or cancellation of contract rights.
Other government controls, legislation or regulations may change from time to time in response to economic or political conditions. The exercise of discretion by governmental authorities under existing controls, legislation or regulations, the implementation of new controls, legislation or regulations or the modification of existing controls, legislation or regulations affecting the oil and gas industry could reduce demand for crude oil and natural gas, increase our costs, or delay or restrict our operations, all of which would have a material adverse effect on us. In addition, failure to comply with government controls, legislation or regulations may result in the suspension, curtailment or termination of operations and subject us to liabilities and administrative, civil and criminal penalties. Compliance costs can be significant.
In addition to regulatory requirements pertaining to the production, marketing and sale of oil and natural gas mentioned above, our business and financial condition could be influenced by federal legislation affecting, in particular, foreign investment, through legislation such as the Competition Act (Canada) and the Investment Canada Act (Canada) and the Hart-Scott-Rodino Antitrust Improvements Act in the United States.
Regulations regarding the disposal of fluids used in the Corporation's operations may increase its costs of compliance or subject it to regulatory penalties or litigation
The safe disposal of hydraulic fracturing fluids (including the additives) and water recovered from oil and natural gas wells is subject to ongoing regulatory review by the federal, provincial and state governments, including its effect on fresh water supplies and the ability of such water to be recycled, amongst other things. While it is difficult to predict the impact of any regulations that may be enacted in response to such review, the implementation of stricter regulations may increase the Corporation's costs of compliance.
The oil and gas industry is highly regulated and changes in environmental, health and safety controls, legislation or regulations may impose restrictions, costs or other liabilities
All phases of our operations are subject to environmental, health and safety regulation pursuant to a variety of Canadian, U.S. and other federal, provincial, state and municipal laws and regulations (collectively, "environmental regulations") governing occupational health and safety aspects of our operations, the spill, release or emission of materials into the environment or otherwise relating to environmental protection. Environmental regulations require that wells, facility sites and other properties associated with our operations be constructed, operated, maintained, abandoned and reclaimed to the satisfaction of applicable regulatory authorities. In addition, certain types of operations, including exploration and development projects and changes to certain existing projects, may require the
| 38 | |||||||
submission and approval of environmental impact assessments or permit applications. Environmental regulations impose, among other things, restrictions, liabilities and obligations in connection with the generation, handling, use, storage, transportation, treatment and disposal of hazardous substances and waste and in connection with spills, releases and emissions of various substances to the environment. It also imposes restrictions, liabilities and obligations in connection with the management of fresh or potable water sources that are being used, or whose use is contemplated, in connection with oil and gas operations. The jurisdictions where we operate have developed liability management programs designed to prevent taxpayers from incurring costs associated with suspension, abandonment, remediation and reclamation of wells, facilities and pipelines in the event that a licensee or permit holder becomes defunct. Changes to the requirements of liability management programs may result in significant increases to the security that must be posted, the timing of our abandonment and reclamation operations and the costs associated with such operations.
Compliance with environmental regulations can require significant expenditures, including expenditures for clean-up costs and damages arising out of contaminated properties. Failure to comply with environmental regulations may result in the imposition of administrative, civil and criminal penalties or issuance of clean up orders in respect of us or our properties, some of which may be material. We may also be exposed to civil liability for environmental matters or for the conduct of third parties, including private parties commencing actions and new theories of liability, regardless of negligence or fault. Although it is not expected that the costs of complying with environmental regulations will have a material adverse effect on our financial condition or results of operations, no assurance can be made that the costs of complying with environmental regulations in the future will not have such an effect. The implementation of new environmental regulations or the modification of existing environmental regulations affecting the oil and gas industry generally could reduce demand for crude oil and natural gas, resulting in stricter standards and enforcement, larger penalties and liability and increased capital expenditures and operating costs, which could have a material adverse effect on our financial condition, results of operations or prospects. See "Industry Conditions - Environmental and Occupational Safety and Health Regulation".
Our financial performance is significantly affected by the cost of developing and operating our assets
Our development and operating costs are affected by a number of factors including, but not limited to: price inflation, scheduling delays, trucking and fuel costs, failure to maintain quality construction standards, the cost of new technologies, supply chain disruptions and access to skilled labour. Natural gas, electricity, water, diluent, chemicals, supplies, reclamation, abandonment and labour costs are examples of operating and other costs that are susceptible to significant fluctuation. Increases to development and operating costs could have a material adverse effect on our financial condition, results of operations or prospects.
Variations in interest rates and foreign exchange rates could adversely affect our financial condition
There is a risk that interest rates will increase given the current historical low level of interest rates. An increase in interest rates could result in a significant increase in the amount we pay to service debt and could have an adverse effect on our financial condition, results of operations and prospects.
World oil prices are quoted in United States dollars and the price received by Canadian producers is therefore affected by the Canada/U.S. foreign exchange rate that may fluctuate over time. A material increase in the value of the Canadian dollar may negatively impact our revenues. A substantial portion of our operations and production are in the United States and, as such, we are exposed to foreign currency risk on both revenues and costs to the extent the value of the Canadian dollar decreases relative to the U.S. dollar. In addition, we are exposed to foreign currency risk as a large portion of our indebtedness is denominated in U.S. dollars and the interest payable thereon is payable in U.S. dollars. Future Canada/
| 39 | |||||||
U.S. foreign exchange rates could also impact the future value of our reserves as determined by our independent evaluator.
A decline in the value of the Canadian dollar relative to the United States dollar provides a competitive advantage to United States companies acquiring Canadian oil and gas properties and may make it more difficult for us to replace reserves through acquisitions.
Our hedging activities may negatively impact our income and our financial condition
In response to fluctuations in commodity prices, foreign exchange and interest rates, we may utilize various derivative financial instruments and physical sales contracts to manage our exposure under a hedging program. The terms of these arrangements may limit the benefit to us of favourable changes in these factors, including receiving less than the market price for our production, and may also result in us paying royalties at a reference price which is higher than the hedged price. We may also suffer financial loss due to hedging arrangements if we are unable to produce oil or natural gas to fulfill our delivery obligations. There is also increased exposure to counterparty credit risk. To the extent that our current hedging agreements are beneficial to us, these benefits will only be realized for the period and for the commodity quantities in those contracts. In addition, there is no certainty that we will be able to obtain additional hedges at prices that have an equivalent benefit to us, which may adversely impact our revenues in future periods. For more information about our commodity hedging program, see "General Description of our Business - Marketing Arrangements and Forward Contracts".
Failure to retain or replace our leadership and key personnel may have an adverse affect on our business
Our success is dependent upon our management, our leadership capabilities and the quality and competency of our talent. If we are unable to retain key personnel and critical talent or to attract and retain new talent with the necessary leadership, professional and technical competencies, it could have a material adverse effect on our financial condition, results of operations and prospects.
Income tax laws or other laws or government incentive programs or regulations relating to our industry may in the future be changed or interpreted in a manner that adversely affects us and our Shareholders
We file all required income tax returns and believe that we are in full compliance with the applicable tax legislation. However, such returns are subject to audit and reassessment by the applicable taxation authority. Any such reassessment may have an impact on current and future taxes payable. At present, the Canadian tax authorities have reassessed the returns of certain of our subsidiaries. For further details, see "Legal Proceedings and Regulatory Actions".
Tax authorities having jurisdiction over us or our Shareholders may disagree with the manner in which we calculate our income for tax purposes or could change their administrative practices to our detriment or the detriment of our Shareholders. In addition, income tax laws and government incentive programs relating to the oil and gas industry may change in a manner that adversely affects our financial condition, results of operations and prospects.
| 40 | |||||||
There are numerous uncertainties inherent in estimating quantities of recoverable oil and natural gas reserves, including many factors beyond our control
The reserves estimates included in this AIF are estimates only. There are numerous uncertainties inherent in estimating quantities of reserves, including many factors beyond our control. In general, estimates of economically recoverable oil and natural gas reserves and the future net revenues therefrom are based upon a number of factors and assumptions made as of the date on which the reserves estimates were determined, such as geological and engineering estimates which have inherent uncertainties, the assumed effects of regulation by governmental agencies, historical production from the properties, initial production rates, production decline rates, the availability, proximity and capacity of oil and gas gathering systems, pipelines and processing facilities and estimates of future commodity prices and capital costs, all of which may vary considerably from actual results.
All such estimates are, to some degree, uncertain and classifications of reserves are only attempts to define the degree of uncertainty involved. For these reasons, estimates of the economically recoverable oil and natural gas reserves attributable to any particular group of properties, the classification of such reserves based on risk of recovery and estimates of future net revenues expected therefrom, prepared by different engineers or by the same engineers at different times, may vary substantially. Our reserves as at December 31, 2020 are estimated using forecast prices and costs as set forth under "Statement of Reserves Data - Pricing Assumptions". If we realize lower prices for crude oil, natural gas liquids and natural gas and they are substituted for the estimated price assumptions, the present value of estimated future net revenues for our reserves and net asset value would be reduced and the reduction could be significant. Our actual production, revenues, royalties, taxes and development, abandonment and operating expenditures with respect to our reserves will likely vary from such estimates, and such variances could be material.
Estimates of reserves that may be developed and produced in the future are often based upon volumetric calculations and upon analogy to similar types of reserves, rather than upon actual production history. Subsequent evaluation of the same reserves based upon production history will result in variations in the previously estimated reserves and such variances could be material.
Acquiring, developing and exploring for oil and natural gas involves many physical hazards. We have not insured and cannot fully insure against all risks related to our operations
Our crude oil and natural gas operations are subject to all of the risks normally incidental to the: (i) storing, transporting, processing, refining and marketing of crude oil, natural gas and other related products; (ii) drilling and completion of crude oil and natural gas wells; and (iii) operation and development of crude oil and natural gas properties, including, but not limited to: encountering unexpected formations or pressures, premature declines of reservoir pressure or productivity, blowouts, fires, explosions, equipment failures and other accidents, gaseous leaks, uncontrollable or unauthorized flows of crude oil, natural gas or well fluids, migration of harmful substances, oil spills, corrosion, adverse weather conditions, pollution, acts of vandalism, theft and terrorism and other adverse risks to the environment.
Although we maintain insurance in accordance with customary industry practice, we are not fully insured against all of these risks nor are all such risks insurable and in certain circumstances we may elect not to obtain insurance to deal with specific risks due to the high premiums associated with such insurance or other reasons. In addition, the nature of these risks is such that liabilities could exceed policy limits, in which event we could incur significant costs that could have a material adverse effect on our business, financial condition, results of operations and prospects.
| 41 | |||||||
We are subject to risk of default by the counterparties to our contracts and our counterparties may deem us to be a default risk
We are subject to the risk that counterparties to our risk management contracts, marketing arrangements and operating agreements and other suppliers of products and services may default on their obligations under such agreements or arrangements, including as a result of liquidity requirements or insolvency. Furthermore, low oil and natural gas prices increase the risk of bad debts related to our joint venture and industry partners. A failure by such counterparties to make payments or perform their operational or other obligations to us may adversely affect our results of operations, cash flow from operating activities and financial position. Conversely, our counterparties may deem us to be at risk of defaulting on our contractual obligations. These counterparties may require that we provide additional credit assurances by prepaying anticipated expenses or posting letters of credit, which would decrease our available liquidity and increase our costs.
Our thermal heavy oil projects face additional risks compared to conventional oil and gas production
Our thermal heavy oil projects are capital intensive projects which rely on specialized production technologies. Certain current technologies for the recovery of heavy oil, such as CSS and SAGD, are energy intensive, requiring significant consumption of natural gas and other fuels in the production of steam that is used in the recovery process. The amount of steam required in the production process varies and therefore impacts costs. The performance of the reservoir can also affect the timing and levels of production using new technologies. A large increase in recovery costs could cause certain projects that rely on CSS, SAGD or other new technologies to become uneconomic, which could have an adverse effect on our financial condition and our reserves. There are risks associated with growth and other capital projects that rely largely or partly on new technologies and the incorporation of such technologies into new or existing operations. The success of projects incorporating new technologies cannot be assured.
Project economics and our earnings may be reduced if increases in operating costs are incurred. Factors which could affect operating costs include, without limitation: labour costs; the cost of catalysts and chemicals; the cost of natural gas and electricity; water handling and availability; power outages; produced sand causing issues of erosion, hot spots and corrosion; reliability of facilities; maintenance costs; the cost to transport sales products; and the cost to dispose of certain by-products.
An energy transition that lessens demand for petroleum products may have an adverse affect on our business
A transition away from the use of petroleum products, which may include conservation measures, alternative fuel requirements, increasing consumer demand for alternatives to oil and natural gas and technological advances in fuel economy and renewable energy, could reduce demand for oil and natural gas. Certain jurisdictions have implemented policies or incentives to decrease the use of fossil fuels and encourage the use of renewable fuel alternatives, which may lessen demand for petroleum products and put downward pressure on commodity prices. In addition, advancements in energy efficient products have a similar effect on the demand for oil and gas products. The Corporation cannot predict the impact of changing demand for oil and natural gas products, and any major changes may have a material adverse effect on the Corporation's business and financial condition by decreasing its cash flow from operating activities and the value of its assets.
Our information technology systems are subject to certain risks
We utilize a number of information technology systems for the administration and management of our business. If our ability to access and use these systems is interrupted and cannot be quickly and easily restored then such event could have a material adverse effect on us. Furthermore, although our information technology systems are considered to be secure, if an unauthorized party is able to access the systems then such unauthorized access may compromise our business in a materially adverse manner.
| 42 | |||||||
Adverse results from litigation may have an adverse affect on our business
In the normal course of our operations, we may become involved in, named as a party to, or be the subject of, various legal proceedings, including regulatory proceedings, tax proceedings and legal actions. Potential litigation may develop in relation to personal injuries, property damage, royalties, taxes, land and access rights, environmental issues, natural resource damages and contract disputes. The outcome with respect to outstanding, pending or future proceedings cannot be predicted with certainty and may be determined adversely to us and could have a material adverse effect on our assets, liabilities, business, financial condition and results of operations. Even if we prevail in any such legal proceedings, the proceedings could be costly and time-consuming and may divert the attention of management and key personnel from business operations, which could have an adverse affect on our financial condition.
We may participate in larger projects and may have more concentrated risk in certain areas of our operations
We have a variety of exploration, development and construction projects underway at any given time. Project delays may result in delayed revenue receipts and cost overruns may result in projects being uneconomic. Our ability to complete projects is dependent on general business and market conditions as well as other factors beyond our control, including the availability of skilled labour and manpower, the availability and proximity of pipeline capacity and rail terminals, weather, environmental and regulatory matters, ability to access lands, availability of drilling and other equipment and supplies, and availability of processing capacity.
Risks Related to Ownership of our Securities
Changes in market-based factors may adversely affect the trading price of the Common Shares
The market price of our Common Shares is sensitive to a variety of market-based factors including, but not limited to, commodity prices, interest rates, foreign exchange rates, the decision of certain indices to include our Common Shares and the comparability of the Common Shares to other securities. Any changes in these market-based factors may adversely affect the trading price of the Common Shares.
Forward-Looking Information rely upon assumptions which may not prove correct
Shareholders and prospective investors are cautioned not to place undue reliance on our forward-looking information. By its nature, forward-looking information involves numerous assumptions, known and unknown risks and uncertainties, of both a general and specific nature, that could cause actual results to differ materially from those suggested by the forward-looking information or contribute to the possibility that predictions, forecasts or projections will prove to be materially inaccurate.
Additional information on the risks, assumption and uncertainties are found under the heading “Notice to Reader – Special Note Regarding Forward-Looking Statements” of this AIF.
Certain Risks for United States and other non-resident Shareholders
The ability of investors resident in the United States to enforce civil remedies is limited
We are a corporation incorporated under the laws of the Province of Alberta, Canada, our principal office is located in Calgary, Alberta and a substantial portion of our assets are located outside the United States. Most of our directors and officers and the representatives of the experts who provide services to us (such as our auditors and our independent qualified reserves evaluators), and all or a substantial portion of their assets are located outside the United States. As a result, it may be difficult for investors in the United States to effect service of process within the United States upon such directors, officers and representatives of experts who are not residents of the United States or to enforce against them judgments of the United States courts based upon civil liability under the United States federal securities laws or the securities laws of any state within the United States. There is doubt as to the enforceability in Canada against us or any of our directors, officers or representatives of experts who are not residents of
| 43 | |||||||
the United States, in original actions or in actions for enforcement of judgments of United States courts of liabilities based solely upon the United States federal securities laws or securities laws of any state within the United States.
Canadian and United States practices differ in reporting reserves and production and our estimates may not be comparable to those of companies in the United States
We report our production and reserves quantities in accordance with Canadian practices and specifically in accordance with NI 51-101. These practices are different from the practices used to report production and to estimate reserves in reports and other materials filed with the SEC by companies in the United States.
We incorporate additional information with respect to production and reserves which is either not required to be included or prohibited under rules of the SEC and practices in the United States. We follow the Canadian practice of reporting gross production and reserve volumes (before deduction of Crown and other royalties). We also follow the Canadian practice of using forecast prices and costs when we estimate our reserves, whereas the SEC rules require that a 12-month average price, calculated as the unweighted arithmetic average of the first-day-of-the-month price for each month within the 12-month period prior to the end of the reporting period, be utilized.
We have included in this AIF estimates of proved reserves and proved plus probable reserves. Probable reserves have a lower certainty of recovery than proved reserves. The SEC requires oil and gas issuers in their filings with the SEC to disclose only proved reserves but permits the optional disclosure of probable reserves. The SEC definitions of proved reserves and probable reserves are different than NI 51-101; therefore, proved, probable and proved plus probable reserves disclosed in this AIF may not be comparable to United States standards.
As a consequence of the foregoing, our reserves estimates and production volumes in this AIF may not be comparable to those made by companies utilizing United States reporting and disclosure standards.
There is additional taxation applicable to non-residents
Tax legislation in Canada may impose withholding or other taxes on the cash dividends, stock dividends or other property transferred by us to non-resident shareholders. These taxes may be reduced pursuant to tax treaties between Canada and the non-resident shareholder's jurisdiction of residence. Evidence of eligibility for a reduced withholding rate must be filed by the non-resident shareholder in prescribed form with their broker (or in the case of registered shareholders, with the transfer agent). In addition, the country in which the non-resident shareholder is resident may impose additional taxes on such dividends. Any of these taxes may change from time to time.
INDUSTRY CONDITIONS
Companies operating in the oil and natural gas industry are subject to extensive controls and regulation in respect of operations (including land tenure, exploration, development, production, refining and upgrading, transportation, and marketing) as a result of legislation enacted by various levels of government. The oil and gas industry is also subject to agreements among the governments of Canada, Alberta, Saskatchewan, the United States and Texas with respect to pricing and taxation of oil and natural gas. All current legislation is a matter of public record and we are unable to predict what additional legislation or amendments may be enacted. Outlined below are some of the principal aspects of legislation, regulations and agreements governing the oil and gas industry in western Canada and the United States.
| 44 | |||||||
Pricing and Marketing
Oil
In Canada and the United States, producers of oil are entitled to negotiate sales contracts directly with oil purchasers. Worldwide supply and demand factors primarily determine oil prices; however, prices are also influenced by regional markets and transportation issues. The specific price depends in part on oil quality, prices of competing fuels, distance to market, availability of transportation, value of refined products, the supply/demand balance and contractual terms of sale.
Oil can be exported from Canada provided that an order approving such export has been obtained from the National Energy Board of Canada (the "NEB") and the term of the export contract does not exceed one year in the case of light crude oil and two years in the case of heavy crude oil. Any Canadian oil export to be made pursuant to a contract of longer duration (to a maximum of 25 years) requires an exporter to obtain an export license from the NEB. Oil exports from the United States are controlled by the United States Department of Commerce. However, since December, 2015, only exports to embargoed or sanctioned countries require authorization from the U.S. Department of Commerce.
In an effort to increase the price for crude oil and bitumen produced in Alberta, the Government of Alberta announced production curtailments which came into effect on January 1, 2019. As implemented, each producer was provided a production allocation determined in part based upon each producer's prior year production measured over a one month or six month period. Production curtailments were removed as of December 2020 and the Government of Alberta has stated that it will monitor market conditions and may reintroduce the curtailments if storage levels approach capacity.
Natural Gas
In Canada and the United States, producers of natural gas are entitled to negotiate sales contracts directly with purchasers. Supply and demand determine the price of natural gas, which is calculated at the sale point, being the wellhead, the outlet of a gas processing plant, on a gas transmission system, at a storage facility, at the inlet to a utility system or at the point of receipt by the consumer. Accordingly, the price for natural gas is dependent upon such producer's own arrangements (whether long or short-term contracts and the specific point of sale). As natural gas is also traded on trading platforms such as the Natural Gas Exchange (NGX), Intercontinental Exchange or the New York Mercantile Exchange (NYMEX) in the United States, spot and future prices can also be influenced by supply and demand fundamentals on these platforms.
Natural gas exported from Canada is subject to regulation by the NEB and the Government of Canada. Exporters are free to negotiate prices and other terms with purchasers, provided that the export contracts must continue to meet certain other criteria prescribed by the NEB and the Government of Canada. Natural gas (other than propane, butane and ethane) exports for a term of less than two years or for a term of two to 20 years (in quantities of not more than 30,000 m3/day) must be made pursuant to an NEB order. Any natural gas export to be made pursuant to a contract of longer duration (to a maximum of 25 years) or for a larger quantity requires an export license from the NEB.
Natural gas exported from the United States is regulated principally by the Federal Energy Regulatory Commission ("FERC") and the United States Department of Energy ("DOE"). U.S. law provides for very limited regulation of exports to and imports from any country that has entered into a free trade agreement with the United States that provides for national treatment of trade in natural gas; however, the DOE regulation of imports and exports from and to countries without such free trade agreements is more comprehensive.
The FERC regulates rates and service conditions for the transportation of natural gas in interstate commerce. The prices and terms of access to intrastate pipeline transportation are subject to state regulation. In Texas, the primary regulator is the Railroad Commission of Texas ("RRC"). Facilities used in the production or gathering of natural gas in interstate commerce are generally exempt from FERC
| 45 | |||||||
jurisdiction. However, the distinction between FERC-regulated transmission pipelines and unregulated gathering systems is made by the FERC on a case-by-case basis and has been subject to extensive litigation.
North American Free Trade
The North American Free Trade Agreement among the governments of Canada, the United States and Mexico came into force on January 1, 1994. On July 1, 2020 this agreement was updated and replaced by the United States Mexico Canada Agreement "USMCA". In the context of energy resources, Canada continues to remain free to determine whether exports of energy resources to the United States or Mexico will be allowed, provided that any export restrictions do not: (i) reduce the proportion of energy resources exported relative to the total supply of goods of the party maintaining the restriction as compared to the proportion prevailing in the most recent 36-month period; (ii) impose an export price higher than the domestic price (subject to an exception with respect to certain measures which only restrict the volume of exports); and (iii) disrupt normal channels of supply.
All three signatory countries are prohibited from imposing a minimum or maximum export price requirement in any circumstance where any other form of quantitative restriction is prohibited. The signatory countries are also prohibited from imposing a minimum or maximum import price requirement, except as permitted in enforcement of countervailing and anti-dumping orders and undertakings. USMCA requires energy regulators to ensure the orderly and equitable implementation of any regulatory changes and to ensure that the application of those changes will cause minimal disruption to contractual arrangements and avoid undue interference with pricing, marketing and distribution arrangements, all of which are important for Canadian oil and natural gas exports.
Royalties and Incentives
In addition to federal regulation, each province in Canada and each state in the United States has legislation and regulations that govern royalties, production rates and other matters. The royalty regime is a significant factor in the profitability of hydrocarbon production. Royalties payable on production from lands other than Crown lands in Canada and federal and state lands in the United States are determined by negotiation between the mineral freehold owner and the lessee, although production from such lands is subject to certain taxes and royalties. Royalties from production on Crown lands in Canada and federal and state lands in the United States are determined by governmental regulation and are generally calculated as a percentage of the value of gross production. The rate of royalties payable generally depends in part on prescribed reference prices, well productivity, geographical location, field discovery date, method of recovery and the type or quality of the petroleum product produced.
From time to time the federal and provincial governments in Canada and the federal and state governments in the United States create incentive programs for exploration and development. Such programs often provide for royalty rate reductions, royalty holidays or royalty tax credits and are generally introduced to encourage specific types of exploration and development activity.
Land Tenure
In the Provinces of Alberta and Saskatchewan, the rights to crude oil and natural gas are predominantly owned by the provincial government. Provincial governments grant rights to explore for and produce oil and natural gas pursuant to leases, licenses, and permits for varying terms, and on conditions set forth in provincial legislation, including requirements to perform specific work or make payments. In the United States, private ownership of the rights to crude oil and natural gas is predominant. Where mineral rights are privately owned, the rights to explore for and produce such oil and natural gas are granted by lease on such terms and conditions as may be negotiated. Private ownership of oil and natural gas also exists in western Canada. Government and private leases are generally granted for an initial fixed term but may generally be continued provided certain minimum levels of drilling operations or production have been achieved and all lease rentals have been timely paid, subject to certain exceptions.
| 46 | |||||||
To develop minerals, including oil and gas, it is necessary for the mineral estate owner(s) to have access to the surface estate. Under common law in Canada and the United States, the mineral estate is considered the "dominant" estate with the right to extract minerals subject to reasonable use of the surface. Each province and state has developed and adopted their own statutes that operators must follow both prior to drilling and following drilling, including notification requirements and the provision of compensation for lost land use and surface damages. The surface rights required for pipelines and facilities are generally governed by leases, easements, rights-of-way, permits or licenses granted by landowners or governmental authorities.
Liability Management Rating Programs
The provinces of Alberta and Saskatchewan have each implemented similar liability management programs in respect of most conventional upstream oil and gas wells, facilities and pipelines. These programs require a licensee whose deemed liabilities equal or exceed its deemed assets within the jurisdiction to provide a security deposit. In response to a number of insolvencies, Alberta and Saskatchewan have made their liability management programs more stringent in recent years. In particular, a licensee is held to a higher standard when accepting the transfer of licensees from a third party. This has reduced the number of parties which can acquire assets. Alberta and Saskatchewan have both announced plans to overhaul their liability management programs.
In Texas, each operator of a well must file a bond, letter of credit, or cash deposit with the RRC. The amount of the bond, letter of credit or deposit varies by number and type of wells, but is not dependent upon the financial capacity of the operator.
Environmental and Occupational Safety and Health Regulation
The oil and natural gas industry is currently subject to stringent environmental, health and safety regulation pursuant to a variety of municipal, provincial, state and federal controls, laws, and regulations governing occupational health and safety aspects of our operations, the spill, release or emission of materials into the environment, or otherwise relating to environmental protection, all of which is subject to governmental review and revision from time to time. Such controls, laws and regulations, among other things, require the acquisition of permits or other approvals to conduct drilling and other regulated activities; restrict the types, quantities and concentration of various substances that can be released into the environment or injected into formations in connection with oil and natural gas drilling and production activities; limit or prohibit drilling activities on certain lands lying within wilderness, wetlands and other protected areas; require remedial measures to mitigate pollution from former and ongoing operations, such as requirements to close pits and plug abandoned wells; impose specific safety and health criteria addressing worker protection; and impose substantial liabilities for pollution resulting from drilling and production operations. In addition, controls, laws and regulations set out the requirements with respect to oilfield waste handling and storage, habitat protection and the satisfactory operation, maintenance, abandonment and reclamation of well and facility sites. Compliance with such controls, laws and regulations can require significant expenditures and a breach of such requirements may result in suspension or revocation of necessary licenses and authorizations, remedial obligations, civil liability and the imposition of material administrative, civil and criminal penalties.
Environmental legislation in the Province of Alberta is, for the most part, set out in the Environmental Protection and Enhancement Act and the Oil and Gas Conservation Act, which impose strict environmental standards with respect to releases of effluents and emissions, including monitoring and reporting obligations, and impose significant penalties for non-compliance. Environmental legislation in the Province of Saskatchewan is, for the most part, set out in the Environmental Management and Protection Act, 2002 and the Oil and Gas Conservation Act, which regulate harmful or potentially harmful activities and substances, any release of such substances, and remediation obligations.
In the United States, occupational safety and health, environmental conservation, cultural and natural resources protection are administered by numerous agencies under multiple statutes, as amended from
| 47 | |||||||
time to time. The environmental and occupational health and safety agencies that most significantly affect our operations include the Federal Occupational Safety and Health Administration ("OSHA"), Federal Environmental Protection Agency ("EPA"), Texas Commission on Environmental Quality ("TCEQ") and the RRC.
The OSHA regulates working conditions by setting and enforcing safety and health standards through multiple federal Acts of Congress, most notably the Occupational Safety and Health Act of 1970. OSHA frequently amends/updates regulations, and has recently increased its attention given to the oil and gas industry. The EPA regulates activities that could affect human health and the environment. It derives its authority from a long list of Acts of Congress, including the Clean Water Act, the Clean Air Act, the Oil Pollution Act of 1990, the Comprehensive Environmental Response, Compensation and Liability Act of 1980 and the Resource Conservation and Recovery Act. The EPA establishes and strictly enforces standards for environmental pollution. At the state level in Texas, the TCEQ regulates public health and natural resources, including air, water and waste, and the RRC regulates the stewardship of oil and natural gas resources, along with some aspects of environmental protection and safety related to extraction of those resources. The RRC regulations establish environmental remediation and reporting criteria for the cleanup of oil and produced water spills.
Climate Change Regulation and Litigation
Canada and the United States are signatories to the United Nations Framework Convention on Climate Change (the "UNFCCC") and are participants in the Copenhagen Accord (a non-binding agreement created by the UNFCCC which represents a broad political consensus and reinforces commitments to reducing GHG emissions). Both governments also signed the Paris Agreement in December 2015, which included a commitment to keep any increase in global temperatures below two degrees Celsius. Additionally, Canada pledged to reduce GHG emissions by 30% by 2030 from 2005 levels. In 2017, the United States announced that it would withdraw from the Paris Agreement at its first opportunity in 2020 and would, in the meantime, cease implementing the pledges made in connection with the Paris Agreement.
The Government of Canada implemented a carbon tax in 2019 starting at $20/tonne rising by $10/tonne a year to $50/tonne in 2022. This federal carbon tax is intended to be implemented in concert with the provinces and territories and will only be implemented in those provinces and territories that do not have their own equivalent carbon tax. The Provinces of Saskatchewan and Alberta have not implemented an equivalent carbon tax and are therefore currently subject to the Government of Canada carbon tax. The Provinces of Alberta and Saskatchewan continue to regulate large industrial emitters and their programs for pricing carbon have been accepted by the federal government. In Alberta and Saskatchewan the aggregation of emissions from multiple small wells and facilities into larger aggregate facilities is allowed. These aggregate facilities can then be registered into the large emitter programs (output-based performance standard (OBPS) in Saskatchewan and The Technology Innovation and Emissions Reduction (TIER) Regulation in Alberta). The result of the aggregate facility submissions is likely to lessen the impact of the federal carbon tax on upstream oil & gas operations. Federal and provincial laws and regulations in this area that are applicable to oil and gas companies in western Canada continue to evolve.
In addition, certain municipal entities and advocacy organizations have sued oil companies in the United States and threatened to sue oil companies in Canada for damage caused by climate change. Certain large oil companies have also been sued in the United States under securities laws for failing to disclose the risks associated with climate change. At this time we cannot anticipate if we will be included in any such litigation, whether the legal theories advanced in such lawsuits will be accepted by the courts or the potential impact of any such lawsuits.
| 48 | |||||||
General
Implementation of more stringent environmental regulations on our operations could affect the capital and operating expenditures and plans for our operations. In addition to the agencies that directly regulate oil and gas operations, there are other state and local conservation and environmental protection agencies that regulate air quality, water quality, fish, wildlife, visual quality, transportation, noise, spills, incidents and transportation.
We believe that, in all material respects, we are in compliance with, and have complied with, all applicable environmental laws and regulations. We have made and will continue to make expenditures in our efforts to comply with all environmental regulations and requirements. We consider these a normal, recurring cost of our ongoing operations and not an extraordinary cost of compliance with governmental regulations. We believe that our continued compliance with existing requirements has been accounted for and will not have a material and adverse impact on our financial condition, results of operations and operating cash flows. However, we cannot predict the passage of or quantify the potential impact of any more stringent future laws and regulations at this time.
DIVIDENDS
We do not currently pay a dividend and have not paid a dividend in any of the last three years. Any dividends declared in the future will be subject to review by the Board of Directors taking into account our prevailing financial circumstances at the relevant time and any amount distributed in the future will depend on numerous factors, including profitability, fluctuations in working capital, the timing and amount of capital expenditures, applicable law and other factors that the Board may deem relevant. In addition, we may be restricted from paying dividends by the provisions of the agreements governing our current indebtedness and any indebtedness we may incur in the future.
DESCRIPTION OF CAPITAL STRUCTURE
Share Capital
Baytex is authorized to issue an unlimited number of Common Shares without nominal or par value and 10,000,000 preferred shares, without nominal or par value, issuable in series. As at the date of this AIF, there were no preferred shares outstanding.
The following is a summary of certain provisions of the share capital of Baytex. For a complete description of the share provisions, reference should be made to the Articles of Incorporation of Baytex, a copy of which is accessible on the SEDAR website at www.sedar.com (filed on January 10, 2011).
Common Shares
Holders of Common Shares are entitled to notice of meetings of the holders of Common Shares and to attend the meetings and to one vote per share at such meetings (other than for meetings of a class or series of shares of the Corporation other than the Common Shares).
Holders of Common Shares will be entitled to receive dividends as and when declared by the Board, subject to prior satisfaction of all preferential rights to dividends attached to shares of other classes of shares of the Corporation ranking in priority to the Common Shares in respect of dividends.
Holders of Common Shares will be entitled in the event of any liquidation, dissolution or winding-up of the Corporation, whether voluntary or involuntary, or any other distribution of the assets of the Corporation among its shareholders for the purpose of winding-up its affairs, and subject to prior satisfaction of all preferential rights to return of capital on dissolution attached to all shares of other classes of shares of the Corporation ranking in priority to the Common Shares in respect of return of capital on dissolution, to share rateably, together with the holders of shares of any other class of shares of the Corporation ranking equally with the Common Shares in respect of return of capital on dissolution, in such assets of the
| 49 | |||||||
Corporation as are available for distribution.
Preferred Shares
Preferred Shares may be issued from time to time in one or more series, each series to consist of such number of shares as a may be authorized by the Board, and subject to the provisions of the ABCA, the Board may fix the rights, restrictions, privileges, conditions and designations attached to each series of Preferred Shares. The Preferred Shares shall be entitled to preference over the Common Shares and any other shares of the Corporation ranking junior to the Preferred Shares with respect to payment of dividends and the distribution of assets in the event of liquidation, dissolution or winding-up of the Corporation, whether voluntary or involuntary, to the extent fixed in the case of each respective series, and may also be given such other preferences over the Common Shares and any other shares of the Corporation ranking junior to the Preferred Shares as may be fixed in the case of each such series.
Senior Notes
On June 6, 2014 we issued US$400 million of 5.625% notes due June 1, 2024. The 2024 Notes pay interest semi-annually and are redeemable at the Company's option, in whole or in part, commencing on June 1, 2019 at the redemption prices specified in the 2014 Debt Indenture.
On February 5, 2020 we issued US$500 million of 8.75% senior unsecured notes due April 1, 2027. The 2027 Notes pay interest semi-annually and are redeemable at the Company's option, in whole or in part, commencing on June 1, 2023 at the redemption prices specified in the 2020 Debt Indenture.
For a complete description of the Senior Notes, reference should be made to the applicable debt indenture, copies of which are accessible on www.sedar.com. See "Material Contracts".
Credit Facilities
Our Credit Facilities consist of the Revolving Facilities and the Term Loan. The Revolving Facilities total US$575 million and consist of: (i) a US$50 million operating loan and a US$325 million syndicated revolving loan for Baytex and (ii) a US$200 million syndicated revolving loan for Baytex USA. The Revolving Facilities are secured and have an extendible four-year term that, unless extended by the lenders, will mature on April 2, 2024. The Term Loan is a $300 million syndicated loan for Baytex Energy Limited Partnership. The Term Loan is with the same syndicate of lenders as the Revolving Facilities and also matures on April 2, 2024
For additional details regarding the covenants in our Credit Facilities and our compliance therewith, see our MD&A for the year ended December 31, 2020. Also see "Material Contracts".
RATINGS
The following information relating to our credit ratings is provided as it relates to our financing costs, liquidity and operations. Specifically, credit ratings affect our ability to obtain short-term and long-term financing and the cost of such financing. A reduction in our current credit ratings by the rating agencies, particularly a downgrade below the current ratings or a negative change in the ratings outlook, could adversely affect our cost of financing and our access to sources of liquidity and capital. In addition, changes in credit ratings may affect our ability and the associated costs to (i) enter into ordinary course derivative or hedging transactions and may require us to post additional collateral under certain of our contracts, and (ii) enter into and maintain ordinary course contracts with customers and suppliers on acceptable terms.
| 50 | |||||||
| Credit Ratings Received as at the date of this AIF | |||||||||||||||||
S&P Global Ratings ("S&P") | Moody's Investors Service ("Moody's") | Fitch Ratings ("Fitch") | |||||||||||||||
| Issuer Credit Rating | B | B2 | B | ||||||||||||||
| Senior Unsecured Debt (Senior Notes) | B+ | B3 | B | ||||||||||||||
S&P's credit ratings are on a long-term debt rating scale that ranges from AAA to D, which represents the range from highest to lowest quality of such securities rated. According to the S&P rating system, debt rated ''B'' is more vulnerable to nonpayment than obligations rated 'BB', but the obligor currently has the capacity to meet its financial commitments on the obligation. Adverse business, financial, or economic conditions will likely impair the obligor's capacity or willingness to meet its financial commitments on the obligation. The ratings from AA to CCC may be modified by the addition of a plus (+) or a minus (-) sign to show relative standing within the major rating categories. In addition, S&P may add a rating outlook of "positive", "negative" or "stable" which assesses the potential direction of a long-term credit rating over the intermediate term (typically six months to two years).
Moody's credit ratings are on a long-term debt rating scale that ranges from Aaa to C, which represents the range from highest to lowest quality of such securities rated. According to the Moody's rating system, securities rated ''B'' are considered speculative and are subject to high credit risk. Moody's appends numerical modifiers 1, 2 and 3 to each generic rating classification from Aa through C. The modifier 1 indicates that the security ranks in the higher end of its generic rating category; the modifier 2 indicates a mid-range ranking; and the modifier 3 indicates a ranking in the lower end of its generic rating category. In addition, Moody's may add a rating outlook of "positive", "negative", "stable" or "developing" which assess the likely direction of an issuers rating over the medium term.
Fitch’s issuer credit ratings are on a rating scale that ranges from AAA to D which represents the range from highest to lowest quality. The ratings from AA to CCC may be modified by the addition of a plus (+) or minus (-) sign to show the relative standing within the major rating categories. An issuer credit rating of "B" by Fitch is within the sixth highest of eleven categories and indicates that material default risk is present, but a limited margin of safety remains. Financial commitments are currently being met; however, capacity for continued payment is vulnerable to deterioration in the business and economic environment. Fitch’s "stable" outlook indicates a low likelihood of a rating change over a one to two year period. Fitch’s ratings of individual securities are on a rating scale that ranges from AAA to C, which represents the highest to lowest quality of such securities rated. The ratings from AA to CCC may be modified by the addition of a plus (+) or minus (-) sign to show the relative standing within the major rating categories.
The credit ratings accorded to Baytex by S&P, Moody's and Fitch are not recommendations to purchase, hold or sell any of our securities inasmuch as such ratings do not comment as to market price or suitability for a particular investor. There is no assurance that any rating will remain in effect for any given period of time or that any rating will not be revised or withdrawn entirely by a rating agency in the future if in its judgment circumstances so warrant.
We have made payments to S&P, Moody's and Fitch in connection with the assignment of ratings to our long-term debt and may make payments to S&P, Moody's and Fitch in the future in connection with the confirmation of such ratings for purposes of the offering of debt securities.
| 51 | |||||||
MARKET FOR SECURITIES
The Common Shares are listed and trade on the TSX under the symbol "BTE". The Common Shares were listed and traded on the NYSE until December 3, 2020. See "Development of our Business". The following tables set forth the price range and trading volume of the Common Shares on the TSX and NYSE for the periods indicated.
| Canada Composite Trading | United States Composite Trading | ||||||||||||||||||||||||||||||||||
| Price Range | Price Range | ||||||||||||||||||||||||||||||||||
| High ($) | Low ($) | Volume Traded | High (US$) | Low (US$) | Volume Traded | ||||||||||||||||||||||||||||||
| 2020 | |||||||||||||||||||||||||||||||||||
| January | 2.10 | 1.44 | 236,063,904 | 1.62 | 1.09 | 45,214,954 | |||||||||||||||||||||||||||||
| February | 1.54 | 1.11 | 172,680,609 | 1.17 | 0.82 | 42,780,567 | |||||||||||||||||||||||||||||
| March | 1.29 | 0.27 | 338,665,370 | 0.98 | 0.19 | 56,736,812 | |||||||||||||||||||||||||||||
| April | 0.50 | 0.29 | 367,718,746 | 0.35 | 0.21 | 105,648,365 | |||||||||||||||||||||||||||||
| May | 0.48 | 0.34 | 208,958,243 | 0.34 | 0.24 | 67,319,280 | |||||||||||||||||||||||||||||
| June | 1.04 | 0.42 | 441,919,143 | 0.75 | 0.30 | 113,526,956 | |||||||||||||||||||||||||||||
| July | 0.74 | 0.60 | 144,743,233 | 0.55 | 0.45 | 45,899,738 | |||||||||||||||||||||||||||||
| August | 0.78 | 0.63 | 153,585,335 | 0.60 | 0.46 | 37,766,139 | |||||||||||||||||||||||||||||
| September | 0.68 | 0.43 | 190,935,732 | 0.53 | 0.32 | 50,579,742 | |||||||||||||||||||||||||||||
| October | 0.51 | 0.39 | 98,617,463 | 0.39 | 0.29 | 22,979,327 | |||||||||||||||||||||||||||||
| November | 0.76 | 0.39 | 155,945,598 | 0.59 | 0.29 | 33,226,501 | |||||||||||||||||||||||||||||
| December | 0.87 | 0.66 | 178,456,384 | 0.55 | 0.51 | 6,058,156 | |||||||||||||||||||||||||||||
DIRECTORS AND OFFICERS
Directors of the Corporation
The following table sets forth the name, municipality of residence, age as at December 31, 2020, year of appointment as a director of the Corporation and principal occupation for each of the directors of the Corporation.
| Name and Municipality of Residence | Age | Director Since | Principal Occupation for Past Five Years | |||||||||||||||||
Mark R. Bly (1) Incline Village, Nevada | 61 | November 2017 | Independent businessman. Formerly served in senior leadership roles with BP until 2013, including leading its North American onshore unit, Group Vice President for approximately 25% of global production and Executive Vice President of Group Safety and Operational Risk. | |||||||||||||||||
Trudy M. Curran (2)(4) Calgary, Alberta | 58 | July 2016 | Independent businesswoman. Formerly an officer of Canadian Oil Sands Limited from September 2002 until February 2016 including as Senior Vice President, General Counsel & Corporate Secretary and interim CEO and managing director of Riversdale Resources from February 2019 to June 2019. | |||||||||||||||||
Naveen Dargan (3)(5) Calgary, Alberta | 63 | September 2003 | Independent businessman. | |||||||||||||||||
| 52 | |||||||
| Name and Municipality of Residence | Age | Director Since | Principal Occupation for Past Five Years | |||||||||||||||||
Don G. Hrap (2)(3) Houston, Texas | 61 | March 2020 | Independent businessman. Formerly served in senior leadership roles with Conoco Phillips from 2009-2018, most recently as President, Lower 48 and, prior to that, President Lower 48 and Latin America and Senior Vice President of Western Canada Gas. | |||||||||||||||||
Edward D. LaFehr Calgary, Alberta | 61 | May 2017 | President and Chief Executive Officer of the Corporation since May 2017, previously President of the Corporation since July 2016. Formerly Chief Operating Officer of the Abu Dhabi National Energy Company until June 2016. | |||||||||||||||||
Jennifer A. Maki (2)(5) North York, Ontario | 50 | September 2019 | Independent businesswoman. Formerly CEO of Vale Canada and Executive Director of Vale-SA-Base Metals from November 2014 until December 2017. | |||||||||||||||||
Greg Melchin (4)(5) Calgary, Alberta | 67 | May 2008 | Independent businessman. | |||||||||||||||||
David L. Pearce (3)(4) Calgary, Alberta | 66 | August 2018 | Deputy Managing Partner, Azimuth Capital Management. | |||||||||||||||||
Stephen D.L. Reynish (3)(4) Calgary, Alberta | 62 | November 2020 | President and Chief Executive Officer of Enlighten Innovations. Formerly Executive Vice President at Suncor Energy Inc. since 2012. | |||||||||||||||||
Notes:
(1)Chair of the Board and ex officio member of all board committees to which he is not appointed.
(2)Member of our Human Resources and Compensation Committee.
(3)Member of our Reserves and Sustainability Committee.
(4)Member of our Nominating and Governance Committee.
(5)Member of our Audit Committee.
Officers of the Corporation
The following table sets forth the name, municipality of residence, age as at December 31, 2020, position held with the Corporation and principal occupation of each of the officers of the Corporation.
| Name and Municipality of Residence | Age | Office | Principal Occupation for Past Five Years | |||||||||||||||||
Edward D. LaFehr Calgary, Alberta | 61 | President and Chief Executive Officer | President, Chief Executive Officer and a Director of the Corporation since May 2017 and President of the Corporation since July 2016. Formerly Chief Operating Officer of the Abu Dhabi National Energy Company until June 2016. | |||||||||||||||||
Rodney D. Gray Calgary, Alberta | 49 | Executive Vice President and Chief Financial Officer | Executive Vice President and Chief Financial Officer of the Corporation since August 2018. Prior thereto, Chief Financial Officer of the Corporation since April 2014. | |||||||||||||||||
| 53 | |||||||
| Name and Municipality of Residence | Age | Office | Principal Occupation for Past Five Years | |||||||||||||||||
Kendall D. Arthur Calgary, Alberta | 40 | Vice President, Heavy Oil | Vice President, Heavy Oil of the Corporation since December 2018. Prior thereto, a business unit Vice President with the Corporation since January 2012. | |||||||||||||||||
Brian G. Ector Calgary, Alberta | 52 | Vice President, Capital Markets | Vice President, Capital Markets of the Corporation since August 2018. Prior thereto, an officer of the Corporation since June 2011. | |||||||||||||||||
Chad L. Kalmakoff Calgary, Alberta | 44 | Vice President, Finance | Vice President, Finance of the Corporation since September 2015. | |||||||||||||||||
Chad E. Lundberg Calgary, Alberta | 39 | Vice President, Light Oil | Vice President, Light Oil since December 2018. Prior thereto Vice President, Viking Business unit of the Corporation since August 2018, Vice President, Operations of Raging River Exploration Inc. from October 2016 until August 2018 and various management and technical positions with Crescent Point from 2008 until September 2016. | |||||||||||||||||
M. Scott Lovett Calgary, Alberta | 47 | Vice President, Corporate Development | Vice President, Corporate Development of the Corporation since September 2017. Prior thereto, Executive Vice President, Business Development with Eagle Energy Inc. from September 2014 until August 2017. | |||||||||||||||||
Ownership of Securities by Management
As at March 1, 2021, the directors and officers of Baytex, as a group, beneficially owned, or controlled or directed, directly or indirectly, 3,554,866 Common Shares.
Corporate Cease Trade Orders or Bankruptcies
Other than as disclosed below, to the Corporation's knowledge, no director or executive officer of Baytex (nor any personal holding company of any of such persons) is, as of the date of this AIF, or was within ten years before the date of this AIF, a director, chief executive officer or chief financial officer of any company (including Baytex), that was subject to a cease trade order (including a management cease trade order), an order similar to a cease trade order or an order that denied the relevant company access to any exemption under securities legislation, in each case that was in effect for a period of more than 30 consecutive days (collectively, an "Order") that was issued while the director or executive officer was acting in the capacity as director, chief executive officer or chief financial officer or was subject to an order that was issued after the director or executive officer ceased to be a director, chief executive officer or chief financial officer and which resulted from an event that occurred while that person was acting in the capacity as director, chief executive officer or chief financial officer.
Other than as disclosed below, to the Corporation's knowledge, no director or executive officer of Baytex (nor any personal holding company of any of such persons), or shareholder holding a sufficient number of our securities to materially affect control of us, is, as of the date of this AIF, or has been within the ten years before the date of this AIF, a director or executive officer of any company (including Baytex) that, while that person was acting in that capacity, or within a year of that person ceasing to act in that capacity, became bankrupt, made a proposal under any legislation relating to bankruptcy or insolvency or was subject to or instituted any proceedings, arrangement or compromise with creditors or had a receiver, receiver-manager or trustee appointed to hold its assets or has, within the ten years before the date of this AIF, become bankrupt, made a proposal under any legislation relating to bankruptcy or insolvency, or
| 54 | |||||||
become subject to or instituted any proceedings, arrangement or compromise with creditors, or had a receiver, receiver-manager or trustee appointed to hold the assets of the director, executive officer or shareholder.
Mr. Dargan, a director of Baytex, was formerly a director of Tervita Corporation (a private environmental solutions company). Tervita made a proposal under the Canada Business Corporations Act on September 14, 2016 and a voluntary filing under Chapter 15 of the United States Bankruptcy Code on October 20, 2016, which resulted in a plan of arrangement under the Canada Business Corporations Act. Mr. Dargan resigned as a director of Tervita on December 13, 2016.
Penalties or Sanctions
To the Corporation's knowledge, no director or executive officer of Baytex (nor any personal holding company of any of such persons), or shareholder holding a sufficient number of our securities to materially affect control of us, has been subject to any penalties or sanctions imposed by a court relating to securities legislation or by a securities regulatory authority or has entered into a settlement agreement with a securities regulatory authority or any other penalties or sanctions imposed by a court or regulatory body that would likely be considered important to a reasonable investor in making an investment decision.
Conflicts
There are potential conflicts of interest to which the directors and officers of Baytex will be subject in connection with the operations of Baytex. In particular, certain of the directors and officers of Baytex are involved in managerial or director positions with other oil and gas companies whose operations may, from time to time, be in direct competition with those of Baytex or with entities which may, from time to time, provide financing to, or make equity investments in, competitors of Baytex. Conflicts, if any, will be subject to the procedures and remedies available under the ABCA. The ABCA provides that in the event that a director has an interest in a contract or proposed contract or agreement, the director will disclose his interest in such contract or agreement and will refrain from voting on any matter in respect of such contract or agreement unless otherwise provided in the ABCA.
AUDIT COMMITTEE INFORMATION
Audit Committee Mandate and Terms of Reference
The text of the Audit Committee’s Mandate and Terms of Reference is attached as Appendix C.
| 55 | |||||||
Composition of the Audit Committee
The members of our Audit Committee are Naveen Dargan, Gregory K. Melchin and Jennifer A. Maki, each of whom is independent and financially literate within the meaning of National Instrument 52-110. The relevant education and experience of each Audit Committee member is outlined below:
| Name | Relevant Education and Experience | |||||||
| Naveen Dargan | Bachelor of Arts (Honours) degree in Mathematics and Economics, Master of Business Administration degree and Chartered Business Valuator designation. Independent businessman since June 2003; prior thereto Senior Managing Director and Head of Energy Investment Banking of Raymond James Ltd. | |||||||
| Gregory K. Melchin | Bachelor of Science degree (major in accounting) and a Fellow Chartered Accountant designation from the Institute of Chartered Accountants of Alberta. Also completed the Directors Education Program with the Institute of Corporate Directors. Member of the Legislative Assembly of Alberta from March 1997 to March 2008. Prior to being elected to the Legislative Assembly of Alberta, served in various management positions for 20 years in the Calgary business community. | |||||||
| Jennifer A. Maki | Bachelor of Commerce degree from Queen's University and a postgraduate diploma from the Institute of Chartered Accountants of Ontario. Formerly served as CEO of Vale Canada and Executive Director of Vale-SA-Base Metals. Prior thereto, CFO and Executive Vice President, of Vale-SA-Base Metals. Before joining Vale/Inco, worked at PricewaterhouseCoopers LLP for 10 years. | |||||||
Pre-Approval of Policies and Procedures
Although the Audit Committee has not adopted specific policies and procedures for the engagement of non-audit services by our auditors, it does pre-approve all non-audit services to be provided to us and our subsidiaries by the external auditors. The pre-approval for recurring services, such as preliminary work on the integrated audit, securities filings, translation of our financial statements and related MD&A into the French language and tax and tax-related services, is provided on an annual basis and other services are subject to pre-approval as required.
External Auditor Service Fees
The following table provides information about the fees billed to us and our subsidiaries for professional services rendered by our external auditors, during fiscal 2020 and 2019:
| Year | Audit Fees (1) | Audit-Related Fees (2) | Tax Fees (3) | All Other Fees (4) | Total | |||||||||||||||||||||||||||
| 2020 | $ | 1,083 | $ | — | $ | — | $ | — | $ | 1,083 | ||||||||||||||||||||||
| 2019 | $ | 952 | $ | — | $ | — | $ | — | $ | 952 | ||||||||||||||||||||||
Notes:
(1)Audit fees consist of fees for the audit of our annual financial statements or services that are normally provided in connection with statutory and regulatory filings or engagements. In addition to the fees for annual audits of financial statements and review of quarterly financial statements, services in this category for fiscal 2020 and 2019 also include amounts for audit work performed in relation to the requirements of Section 404 of the Sarbanes-Oxley Act of 2002 relating to internal control over financial reporting.
(2)Audit-related fees consist of fees for assurance and related services that are reasonably related to the performance of the audit or review of our financial statements and are not reported as Audit Fees.
(3)Tax fees include fees for tax compliance, tax advice and tax planning.
(4)Other fees include all other non-audit services.
| 56 | |||||||
LEGAL PROCEEDINGS AND REGULATORY ACTIONS
In June 2016, certain indirect subsidiary entities received reassessments from the Canada Revenue Agency (CRA) that deny non-capital loss deductions relevant to the calculation of income taxes for the years 2011 through 2015. These reassessments follow the previously disclosed letter which we received in November 2014 from the CRA, proposing to issue such reassessments.
We remain confident that the tax filings of the affected entities are correct and are vigorously defending our tax filing positions. The reassessments do not require us to pay any amounts in order to participate in the appeals process.
In September 2016, we filed a notice of objection for each notice of reassessment received which will be reviewed by the Appeals Division of the CRA. An Appeals Officer was assigned to our file in July 2018, we estimate the remaining Appeals Division process could take another year. If the Appeals Division upholds the notices of reassessment, we have the right to appeal to the Tax Court of Canada; a process that we estimate could take a further two years. Should we be unsuccessful at the Tax Court of Canada, additional appeals are available; a process that we estimate could take another two years and potentially longer.
By way of background, we acquired several privately held commercial trusts in 2010 with accumulated non-capital losses of $591 million (the "Losses"). The Losses were subsequently used to reduce the taxable income of those trusts. The reassessments disallow the deduction of the Losses under the general anti-avoidance rule of the Income Tax Act (Canada). If, after exhausting available appeals, the deduction of Losses continues to be disallowed, we will owe cash taxes for the years 2012 through 2015 and an additional amount for late payment interest. The amount of cash taxes owing and the late payment interest are dependent upon the amount of unused tax shelter available to offset the reassessed income, including tax shelter from future years that may be applied to the years 2012 through 2015.
Other than the foregoing, there are no legal proceedings that we are or were a party to, or that any of our property is or was the subject of, during our most recently completed financial year, that were or are material to us, and there are no such material legal proceedings that we are currently aware of that are contemplated.
There were no: (i) penalties or sanctions imposed against us by a court relating to securities legislation or by a securities regulatory authority during our most recently completed financial year; (ii) other penalties or sanctions imposed by a court or regulatory body against us that would likely be considered important to a reasonable investor in making an investment decision; or (iii) settlement agreements we entered into with a court relating to securities legislation or with a securities regulatory authority during our most recently completed financial year.
INTEREST OF INSIDERS AND OTHERS IN MATERIAL TRANSACTIONS
Other than in connection with the Raging River merger as disclosed in the joint information circular of Baytex and Raging River filed on SEDAR on July 20, 2018, there were no material interests, direct or indirect, of our directors and executive officers, any holder of Common Shares who beneficially owns or controls or directs, directly of indirectly, more than 10 percent of the outstanding Common Shares, or any known associate or affiliate of such persons, in any transactions within the three most recently completed financial years or since the beginning of our last completed financial year which has materially affected or is reasonably expected to materially affect us.
| 57 | |||||||
TRANSFER AGENT AND REGISTRAR
Odyssey Trust Company, at its principal offices in Calgary, Alberta, Vancouver, British Columbia and Toronto, Ontario, is the transfer agent and registrar for the Common Shares in Canada. Odyssey Transfer US Inc., at its principal office in Denver, Colorado is the transfer agent and registrar for the Common Shares in the United States. Computershare Trust Company, N.A., at its principal office in Canton, Massachusetts, is the transfer agent and registrar for the 2024 Notes and the 2027 Notes.
MATERIAL CONTRACTS
Except for contracts entered into in the ordinary course of business, the only material contracts entered into by us within the most recently completed financial year, or before the most recently completed financial year but are still material and are still in effect, are the following:
a.the credit agreement in respect of the Revolving Credit Facilities (filed on April 13, 2016), the first amendment thereof (filed on May 2, 2018), the second amendment thereof (filed on October 12, 2018), the third amendment thereof (filed May 16, 2019) and the fourth amendment thereof (filed March 9, 2020);
b.the credit agreement in respect of the Term Facility (filed on October 12, 2018), the first amendment thereof (filed May 16, 2019) and the second amendment thereof (filed March 9, 2020);
c.2014 Debt Indenture (filed on June 20, 2014) and supplemental indentures thereto (filed on August 13, 2014, September 9, 2014, February 20, 2018 and October 12, 2018)
d.2020 Debt Indenture (filed on February 10, 2020); and
e.our share award incentive plan (filed on April 18, 2016) and our amended share award incentive plan (filed on January 28, 2018).
Copies of each of these contracts are accessible on the SEDAR website at www.sedar.com.
INTERESTS OF EXPERTS
There is no person or company whose profession or business gives authority to a statement made by such person or company and who is named as having prepared or certified a report, valuation, statement or opinion described or included in a filing, or referred to in a filing, made under National Instrument 51-102 "Continuous Disclosure Obligations" by us during, or related to, our most recently completed financial year other than McDaniel, our independent qualified reserves evaluator. None of the designated professionals of McDaniel have any registered or beneficial interests, direct or indirect, in any of our securities or other property or of our associates or affiliates either at the time they prepared a report, valuation, statement or opinion, at any time thereafter or to be received by them.
KPMG LLP are the auditors of the Corporation and have confirmed with respect to the Corporation, that they are independent within the meaning of the relevant rules and related interpretations prescribed by the relevant professional bodies in Canada and any applicable legislation or regulations, and also that they are independent accountants with respect to the Corporation under all relevant US professional and regulatory standards.
In addition, none of the aforementioned persons or companies, nor any director, officer or employee of any of the aforementioned persons or companies, is or is expected to be elected, appointed or employed as a director, officer or employee of Baytex or of any associate or affiliate of Baytex.
| 58 | |||||||
ADDITIONAL INFORMATION
Additional information relating to us can be found on our website and on the SEDAR website at www.sedar.com. Further information, including directors' and officers' remuneration and indebtedness, principal holders of our securities and securities issued and authorized for issuance under our equity compensation plans will be contained in our Information Circular - Proxy Statement for the annual meeting of Shareholders to be held April 29, 2021. Additional financial information is contained in our consolidated financial statements for the year ended December 31, 2020 and the related MD&A which are accessible on the SEDAR website at www.sedar.com.
For additional copies of this AIF and the materials listed in the preceding paragraph, please contact:
Baytex Energy Corp.
Suite 2800, Centennial Place, East Tower
Suite 2800, Centennial Place, East Tower
520 – 3rd Avenue S.W.
Calgary, Alberta T2P 0R3
Phone: (587) 952-3000
Fax: (587) 952-3029
Website: www.baytexenergy.com
| 59 | |||||||
APPENDIX A
REPORT OF MANAGEMENT AND DIRECTORS ON OIL AND GAS DISCLOSURE
Form 51‑101F3
Management of Baytex Energy Corp. ("Baytex") is responsible for the preparation and disclosure of information with respect to Baytex's oil and natural gas activities in accordance with securities regulatory requirements. This information includes reserves data.
Independent qualified reserves evaluators have evaluated Baytex's reserves data. The report of the independent qualified reserves evaluators is presented below.
The Reserves and Sustainability Committee of the Board of Directors of Baytex (the "Reserves Committee") has:
a.reviewed Baytex's procedures for providing information to the independent qualified reserves evaluators;
b.met with the independent qualified reserves evaluators to determine whether any restrictions affected the ability of the independent qualified reserves evaluators to report without reservation; and
c.reviewed the reserves data with management and the independent qualified reserves evaluator.
The Reserves Committee has reviewed Baytex's procedures for assembling and reporting other information associated with oil and natural gas activities and has reviewed that information with management. The Board of Directors of Baytex has, on the recommendation of the Reserves Committee, approved:
a.the content and filing with securities regulatory authorities of Form 51-101F1 containing reserves data and other oil and gas information;
b.the filing of Form 51-101F2 which is the report of the independent qualified reserves evaluators on the reserves data; and
c.the content and filing of this report.
Because the reserves data are based on judgments regarding future events, actual results will vary and the variations may be material.
(signed) "Edward D. LaFehr" | (signed) "Rodney D. Gray" | ||||
| Edward D. LaFehr | Rodney D. Gray | ||||
| President and Chief Executive Officer | Executive Vice President and Chief Financial Officer | ||||
(signed) "David L. Pearce" | (signed) "Don G. Hrap" | ||||
| Director and Chair of the Reserves and Sustainability Committee | Director and Member of the Reserves and Sustainability Committee | ||||
March 1, 2021
APPENDIX B
REPORT ON RESERVES DATA BY INDEPENDENT QUALIFIED RESERVES EVALUATOR
Form 51‑101F2
To the Board of Directors of Baytex Energy Corp. ("Company"):
1.We have evaluated Baytex's reserves data as at December 31, 2020. The reserves data is an estimate of proved reserves and probable reserves and related future net revenue as at December 31, 2020 estimated using forecast prices and costs.
2.The reserves data are the responsibility of the Company's management. Our responsibility is to express an opinion on the reserves data based on our evaluation.
3. We carried out our evaluation in accordance with standards set out in the Canadian Oil and Gas Evaluation Handbook as amended from time to time (the "COGE Handbook") maintained by the Society of Petroleum Evaluation Engineers (Calgary Chapter).
4. Those standards require that we plan and perform an evaluation to obtain reasonable assurance as to whether the reserves data are free of material misstatement. An evaluation also includes assessing whether the reserves data are in accordance with principles and definitions presented in the COGE Handbook.
5.The following table shows the estimated future net revenue (before deduction of income taxes) attributed to proved + probable reserves, estimated using forecast prices and costs and calculated using a discount rate of 10 percent, included in the reserves data of the Company evaluated for the year ended December 31, 2020, and identifies the respective portions thereof that we have evaluated and reported on to Company's management:
| Independent Qualified Reserves Evaluator or Auditor | Effective Date of Evaluation or Review Report | Location of Reserves | Net Present Value of Future Net Revenue (before income taxes, 10% discount rate) (in $ thousands) | |||||||||||||||||||||||||||||||||||
| Audited | Evaluated | Reviewed | Total | |||||||||||||||||||||||||||||||||||
| McDaniel & Associates | December 31, 2020 | Canada | — | 1,488,630.2 | — | 1,488,630.2 | ||||||||||||||||||||||||||||||||
| McDaniel & Associates | December 31, 2020 | United States | — | 1,790,186.4 | — | 1,790,186.4 | ||||||||||||||||||||||||||||||||
| TOTALS | 3,278,816.6 | 3,278,816.6 | ||||||||||||||||||||||||||||||||||||
6. In our opinion, the reserves data evaluated by us have, in all material respects, been determined and are in accordance with the COGE Handbook, consistently applied. We express no opinion on the reserves data that we reviewed but did not evaluate.
7. We have no responsibility to update the report referred to in paragraph 5 for events and circumstances occurring after the effective date of our report.
8. Because the reserves data is based on judgments regarding future events, actual results will vary and the variations may be material.
Executed as to our report referred to above:
| MCDANIEL & ASSOCIATES CONSULTANTS LTD. | |||||||||||
(signed) "Brian R. Hamm" | |||||||||||
| Brian R. Hamm, P. Eng. | |||||||||||
| President & CEO | |||||||||||
| Calgary, Alberta | |||||||||||
| February 4, 2021 | |||||||||||
APPENDIX C
BAYTEX ENERGY CORP.
AUDIT COMMITTEE
MANDATE AND TERMS OF REFERENCE
ROLE AND OBJECTIVE
The Audit Committee (the "Committee") is a committee of the board of directors (the "Board") of Baytex Energy Corp. (the "Corporation") to which the Board has delegated certain of its responsibilities. The primary responsibility of the Committee is to review the interim and annual financial statements of the Corporation and to recommend their approval or otherwise to the Board. The Committee is also responsible for reviewing and recommending to the Board the appointment and compensation of the external auditors of the Corporation, overseeing the work of the external auditors, including the nature and scope of the audit of the annual financial statements of the Corporation, pre-approving services to be provided by the external auditors and reviewing the assessments prepared by management and the external auditors on the effectiveness of the Corporation's internal controls over financial reporting.
The objectives of the Committee are to:
1.assist directors in meeting their responsibilities in respect of the preparation and disclosure of the financial statements of the Corporation and related matters;
2.facilitate communication between directors and the external auditors;
3.enhance the external auditors' independence;
4.increase the credibility and objectivity of financial reports; and
5.strengthen the role of the independent directors by facilitating in depth discussions between the Committee, management and the external auditors.
MEMBERSHIP OF THE COMMITTEE
1.The Committee shall be comprised of not less than three members all of whom are "independent" directors and "financially literate" (within the meaning of National Instrument 52-110 "Audit Committees"). The members of the Committee shall be appointed by the Board from time to time.
2.The Board shall appoint a Chair of the Committee, who shall be an independent director.
3.Any member of the Committee may be removed or replaced at any time by the Board and shall cease to be a member of the Committee as soon as such member ceases to be a director. The Board may fill vacancies on the Committee by appointment from among its members. If and whenever a vacancy shall exist on the Committee, the remaining members may exercise all its powers so long as a quorum remains. Subject to the foregoing, each member of the Committee shall hold such office until the close of the next annual meeting of shareholders of the Corporation following appointment as a member of the Committee.
MANDATE AND RESPONSIBILITIES OF THE COMMITTEE
1.It is the responsibility of the Committee to oversee the work of the external auditors, including resolution of disagreements between management and the external auditors regarding financial reporting. The external auditors shall report directly to the Committee.
2.It is the responsibility of the Committee to satisfy itself on behalf of the Board with respect to the Corporation's internal control systems by:
•identifying, monitoring and mitigating business risks; and
•ensuring compliance with legal, ethical and regulatory requirements.
3.It is a primary responsibility of the Committee to review the interim and annual financial statements of the Corporation prior to their submission to the Board for approval. The review process should include, without limitation:
•reviewing changes in accounting principles, or in their application, which may have a material impact on the current or future years' financial statements;
•reviewing significant accruals, reserves or other estimates such as the ceiling test calculation;
•reviewing accounting treatment of unusual or non-recurring transactions;
•ascertaining compliance with covenants under loan agreements;
•reviewing disclosure requirements for commitments and contingencies;
•reviewing adjustments raised by the external auditors, whether or not included in the financial statements;
•reviewing unresolved differences between management and the external auditors;
•obtaining explanations of significant variances with comparative reporting periods; and
•determining through inquiry if there are any related party transactions and ensuring that the nature and extent of such transactions are properly disclosed.
4.The Committee is to review all public disclosure of audited or unaudited financial information by the Corporation before its release (and, if applicable, prior to its submission to the Board for approval), including the interim and annual financial statements of the Corporation, management's discussion and analysis of results of operations and financial condition, press releases and the Annual Information Form. The Committee must be satisfied that adequate procedures are in place for the review of the Corporation's disclosure of financial information and shall periodically assess the accuracy of those procedures.
5.With respect to the external auditors of the Corporation, the Committee shall:
•recommend to the Board the appointment of the external auditors, including the terms of their engagement for the integrated audit;
•review and approve any other services to be provided by the external auditors (including the fee for such services); and
•when there is to be a change in the external auditors, review the issues related to the change and the information to be included in the required notice to securities regulators of such change.
6.Review with the external auditors (and the internal auditor if one is appointed by the Corporation) their assessment of the internal controls of the Corporation, their written reports containing recommendations for improvement, and management's response and follow-up to any identified weaknesses. The Committee shall also review annually with the external auditors their plan for the audit and, upon completion of the audit, their reports upon the financial statements of the Corporation and its subsidiaries.
7.The Committee must pre-approve all services to be provided to the Corporation or its subsidiaries by the external auditors. In pre-approving any service, the Committee shall consider the impact that the provision of such service may have on the external auditors' independence. The Committee may delegate to one or more of its members the authority to pre-approve services, provided that the member report to the Committee at the next scheduled meeting such pre-approval and the member comply with such other procedures as may be established by the Committee from time to time.
8.The Committee shall review the risk management policies and procedures of the Corporation (i.e., hedging, litigation and insurance).
9.The Committee shall establish procedures for the receipt, retention and treatment of complaints received by the Corporation regarding accounting, internal accounting controls or auditing matters and the confidential, anonymous submission by employees of the Corporation and its subsidiary entities of concerns regarding questionable accounting or auditing matters.
10.The Committee shall review and approve the Corporation's hiring policies regarding employees and former employees of the present and former external auditors of the Corporation.
11.The Committee shall have the authority to investigate any financial activity of the Corporation. All employees of the Corporation and its subsidiary entities are to cooperate as requested by the Committee.
12.The Committee shall forthwith report the results of meetings and reviews undertaken and any associated recommendations to the Board.
13.The Committee shall meet with the external auditors at least four times per year (in connection with their review of the interim and annual financial statements) and at such other times as the external auditors and the Committee consider appropriate.
MEETINGS AND ADMINISTRATIVE MATTERS
1.At all meetings of the Committee every question shall be decided by a majority of the votes cast. In case of an equality of votes, the chairman of the meeting shall be entitled to a second or casting vote.
2.The Chair shall preside at all meetings of the Committee, unless the Chair is not present, in which case the members of the Committee present shall designate from among the members present a chairman for purposes of the meeting.
3.A quorum for meetings of the Committee shall be a majority of its members, and the rules for calling, holding, conducting and adjourning meetings of the Committee shall be the same as those governing the Board unless otherwise determined by the Committee or the Board.
4.Meetings of the Committee should be scheduled to take place at least four times per year and at such other times as the Chair may determine.
5.Agendas, approved by the Chair, shall be circulated to Committee members along with background information on a timely basis prior to the Committee meetings.
6.The Committee may invite those officers, directors and employees of the Corporation and its subsidiary entities as it may see fit from time to time to attend at meetings of the Committee and assist thereat in the discussion and consideration of the matters being considered by the Committee, provided that the Chief Financial Officer of the Corporation shall attend all meetings of the Committee, unless otherwise excused from all or part of any such meeting by the chairman of the meeting.
7.Minutes of the Committee's meetings will be recorded and maintained and made available to any director who is not a member of the Committee upon request.
8.The Committee may retain persons having special expertise and/or obtain independent professional advice to assist in fulfilling its responsibilities at the expense of the Corporation.
9.Any issues arising from the Committee's meetings that bear on the relationship between the Board and management should be communicated to the Executive Chairman or the Lead Independent Director, as applicable, by the Committee Chair.
Approved by the Board of Directors on February 28, 2011