Exhibit 99.1
43-101 TECHNICAL REPORT,
UPDATED MINERAL RESERVE ESTIMATE FOR TIMMINS WEST MINE,
TIMMINS, ONTARIO, CANADA
NTS: 42-A-05,
Longitude: 81.55° West, Latitude: 48.32° North
UTM (NAD 83, Zone17): 458,915m East, 5,359,043 North
PREPARED FOR:
LAKE SHORE GOLD CORP.
181 University Ave, Suite 2000
Toronto, Ontario, Canada, M5H 3M7
Prepared by: Eric Kallio, P. Geo.
Natasha Vaz, P. Eng.
Date: March 31, 2014
Effective Date: February 21, 2014
TABLE OF CONTENTS | |
| |
| CAUTIONARY NOTE | x |
| | |
1.0 | SUMMARY | 1 |
| | |
2.0 | INTRODUCTION | 8 |
| 2.1 | LIST OF QUALIFIED PERSONS | 8 |
| 2.2 | UNITS AND CURRENCY | 8 |
| 2.3 | LIST OF ABBREVIATIONS | 9 |
| 2.4 | DEFINITIONS | 12 |
| | 2.4.1 | Mineral Resource | 12 |
| | 2.4.2 | Inferred Mineral Resource | 12 |
| | 2.4.3 | Indicated Mineral Resource | 12 |
| | 2.4.4 | Measured Mineral Resource | 12 |
| | 2.4.5 | Mineral Reserve | 13 |
| | 2.4.6 | Probable Mineral Reserve | 13 |
| | 2.4.7 | Proven Mineral Reserve | 13 |
| 2.5 | GLOSSARY | 13 |
| | 2.5.1 | General Glossary | 13 |
| | 2.5.2 | Lake Shore Gold Terminology | 15 |
| | | | |
3.0 | RELIANCE ON OTHER EXPERTS | 16 |
| | |
4.0 | PROPERTY DESCRIPTION AND LOCATION | 19 |
| 4.1 | PROPERTY DESCRIPTION | 19 |
| 4.2 | LOCATION | 23 |
| 4.3 | RECENT OWNERSHIP HISTORY AND UNDERLYING AGREEMENTS | 25 |
| 4.4 | PAST MINING ACTIVITY, ENVIRONMENTAL LIABILITIES AND PERMITTING | 26 |
| | | |
5.0 | ACCESSIBILITY, CLIMATE, LOCAL RESOURCES, INFRASTRUCTURE AND PHYSIOGRAPHY | 28 |
| 5.1 | ACCESSIBILITY | 28 |
| 5.2 | CLIMATE | 28 |
| 5.3 | LOCAL RESOURCES AND INFRASTRUCTURE | 28 |
| 5.4 | PHYSIOGRAPHY | 29 |
| | | |
6.0 | HISTORY | 31 |
| 6.1 | PRIOR OWNERSHIP | 31 |
| 6.2 | GENERAL HISTORY | 31 |
| 6.3 | HISTORICAL RESOURCE ESTIMATES | 35 |
| | 6.3.1 | Historically Significant Resource Estimates | 35 |
| | 6.3.2 | Resource Estimates Reported in Accordance with NI 43-101 and Estimated by a QP | 35 |
| 6.4 | HISTORIC PRODUCTION | 38 |
| | | | |
7.0 | GEOLOGICAL SETTING AND MINERALIZATION | 39 |
| 7.1 | REGIONAL GEOLOGY AND STRUCTURE | 39 |
| 7.2 | PROPERTY GEOLOGY | 43 |
| | 7.2.1 | Timmins Mine Portion of the Timmins West Mine | 43 |
| | 7.2.2 | Thunder Creek Portion of the Timmins West Mine | 44 |
| 7.3 | STRUCTURAL GEOLOGY | 47 |
| 7.4 | MINERALIZATION | 48 |
ii
TABLE OF CONTENTS
8.0 | DEPOSIT TYPES | 61 |
| | |
9.0 | EXPLORATION | 63 |
| 9.1 | GENERAL OVERVIEW | 63 |
| | 9.1.1 | Timmins Deposit | 64 |
| | 9.1.2 | Thunder Creek Deposit | 66 |
| | | | |
10.0 | DRILLING | 69 |
| 10.1 | HISTORICAL DRILLING ON THE TIMMINS WEST MINE PROPERTY | 69 |
| 10.2 | DRILLING ON THE TIMMINS DEPOSIT PROPERTY COMPLETED BY LSG | 71 |
| 10.3 | DRILLING ON THE THUNDER CREEK PROPERTY BY LSG | 71 |
| | | |
11.0 | SAMPLING PREPARATION, ANALYSIS AND SECURITY | 74 |
| 11.1 | SURFACE DIAMOND DRILL PROGRAMS | 74 |
| | 11.1.1 | General Statement | 74 |
| | 11.1.2 | Core Handling and Logging Protocols | 74 |
| | 11.1.3 | Property Grids, Hole Collar and Downhole Attitude Surveys | 74 |
| | 11.1.4 | Security | 75 |
| | 11.1.5 | Drill Core Sampling Method and Approach, Sample Preparation, Analysis and Analytical Procedures | 75 |
| 11.2 | UNDERGROUND DIAMOND DRILL PROGRAM | 78 |
| | 11.2.1 | General Statement | 78 |
| | 11.2.2 | Core Handling and Logging Protocols | 78 |
| | 11.2.3 | Property Grids, Hole Collar and Downhole Attitude Surveys | 79 |
| | 11.2.4 | Security | 80 |
| | 11.2.5 | Underground Diamond Drill Core Sampling Protocols | 80 |
| | 11.2.6 | Underground Diamond Drill Core Sample Preparations and Analytical Procedures | 82 |
| 11.3 | UNDERGROUND FACE CHIP CHANNEL AND MUCK SAMPLES | 84 |
| | 11.3.1 | Procedure for Taking Face Chip Channel Samples | 84 |
| | 11.3.2 | Procedure for Taking Muck Samples | 84 |
| | 11.3.3 | Security | 85 |
| | 11.3.4 | Data Management for Chips and Muck Samples | 85 |
| 11.4 | DATA MANAGEMENT FOR SURFACE AND UNDERGROUND DIAMOND DRILL PROGRAMS | 85 |
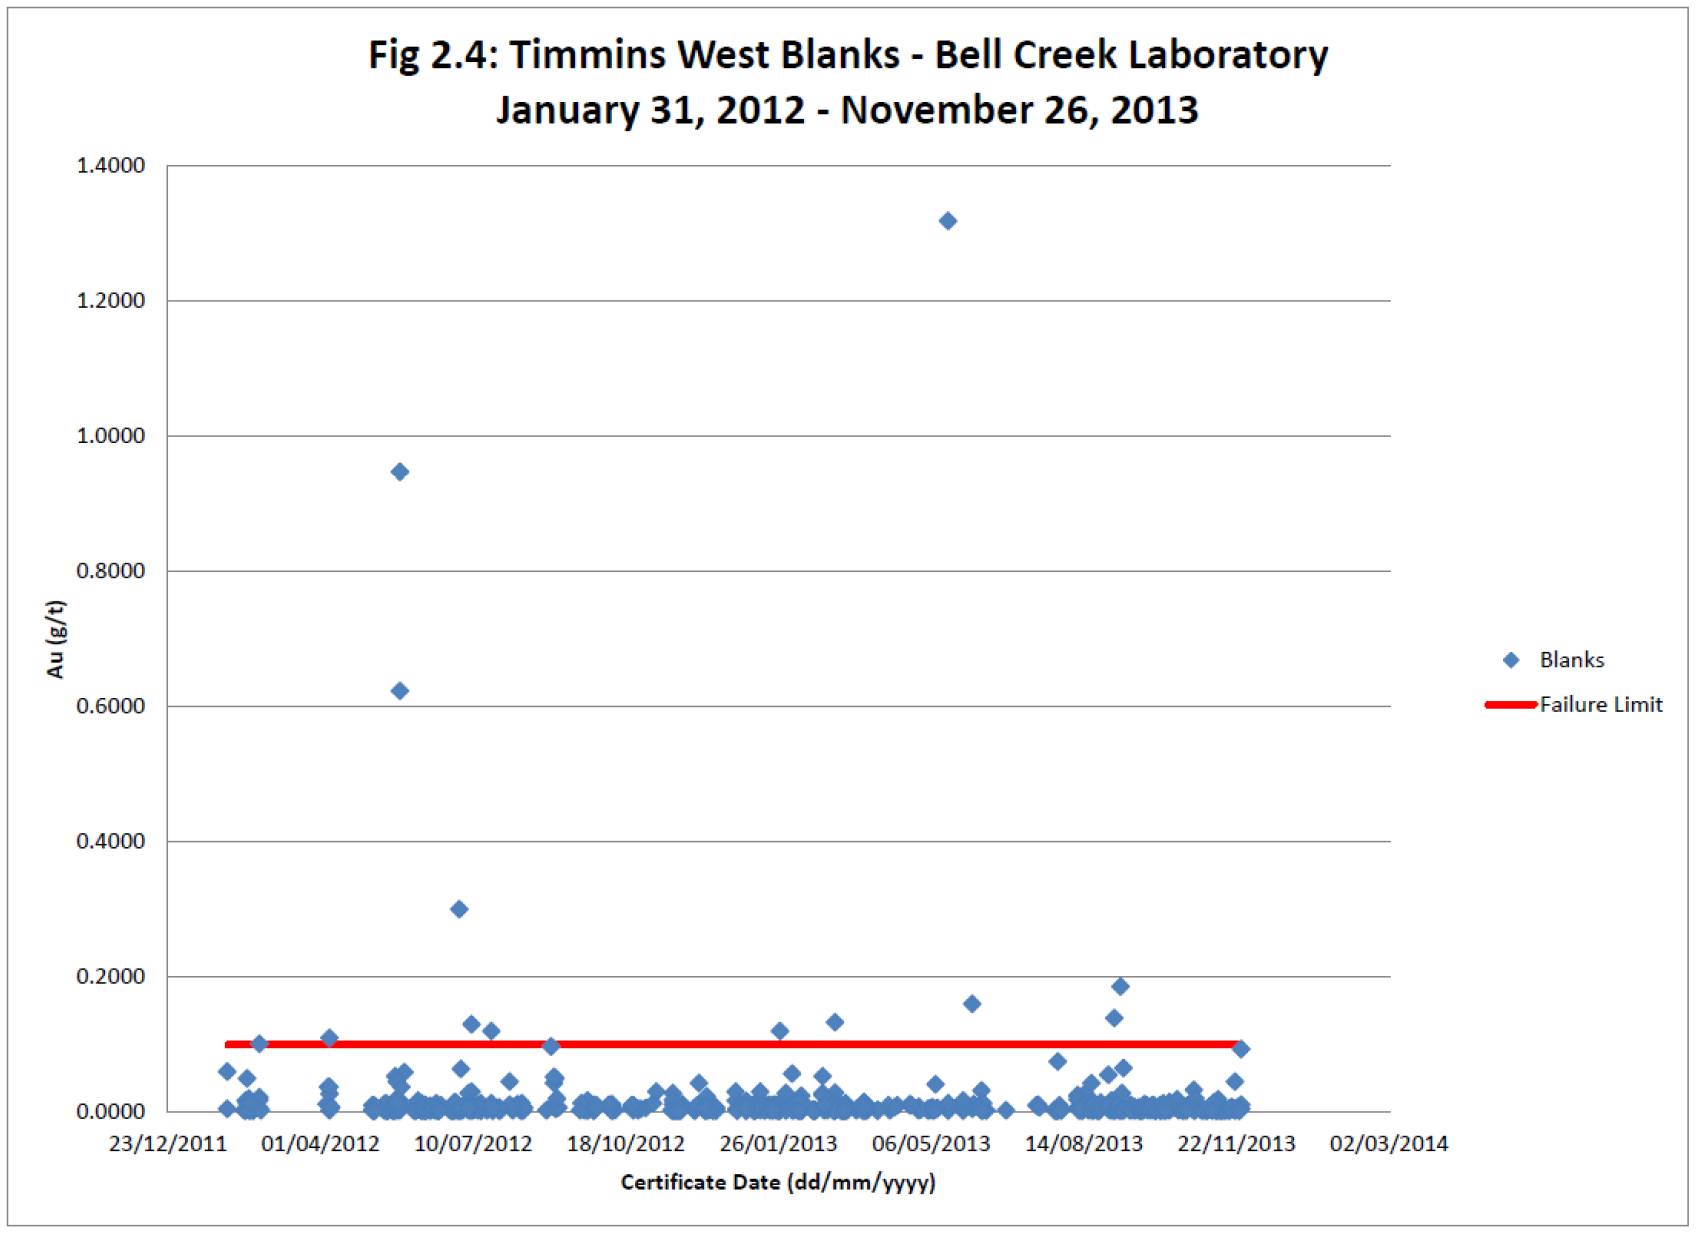
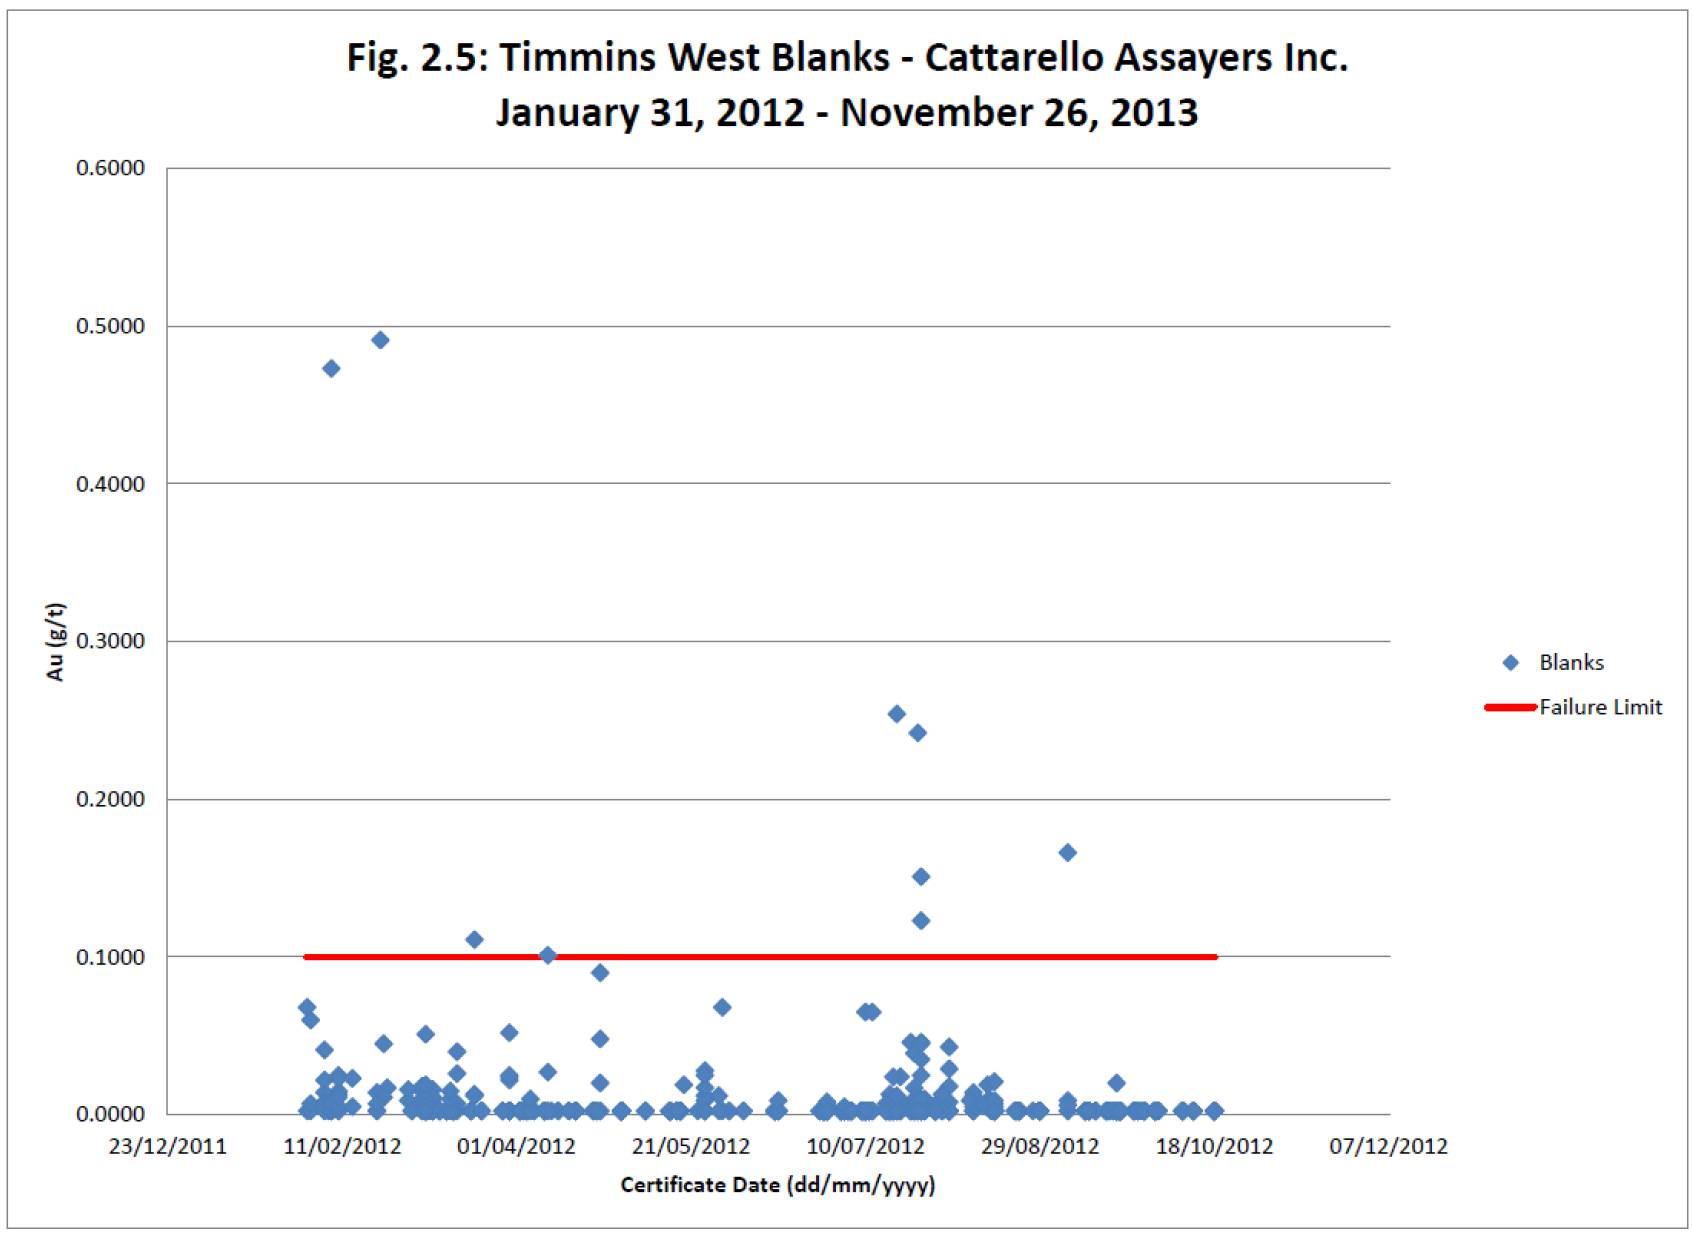
| | 11.4.1 | Accuracy Analysis - Standards and Blanks | 85 |
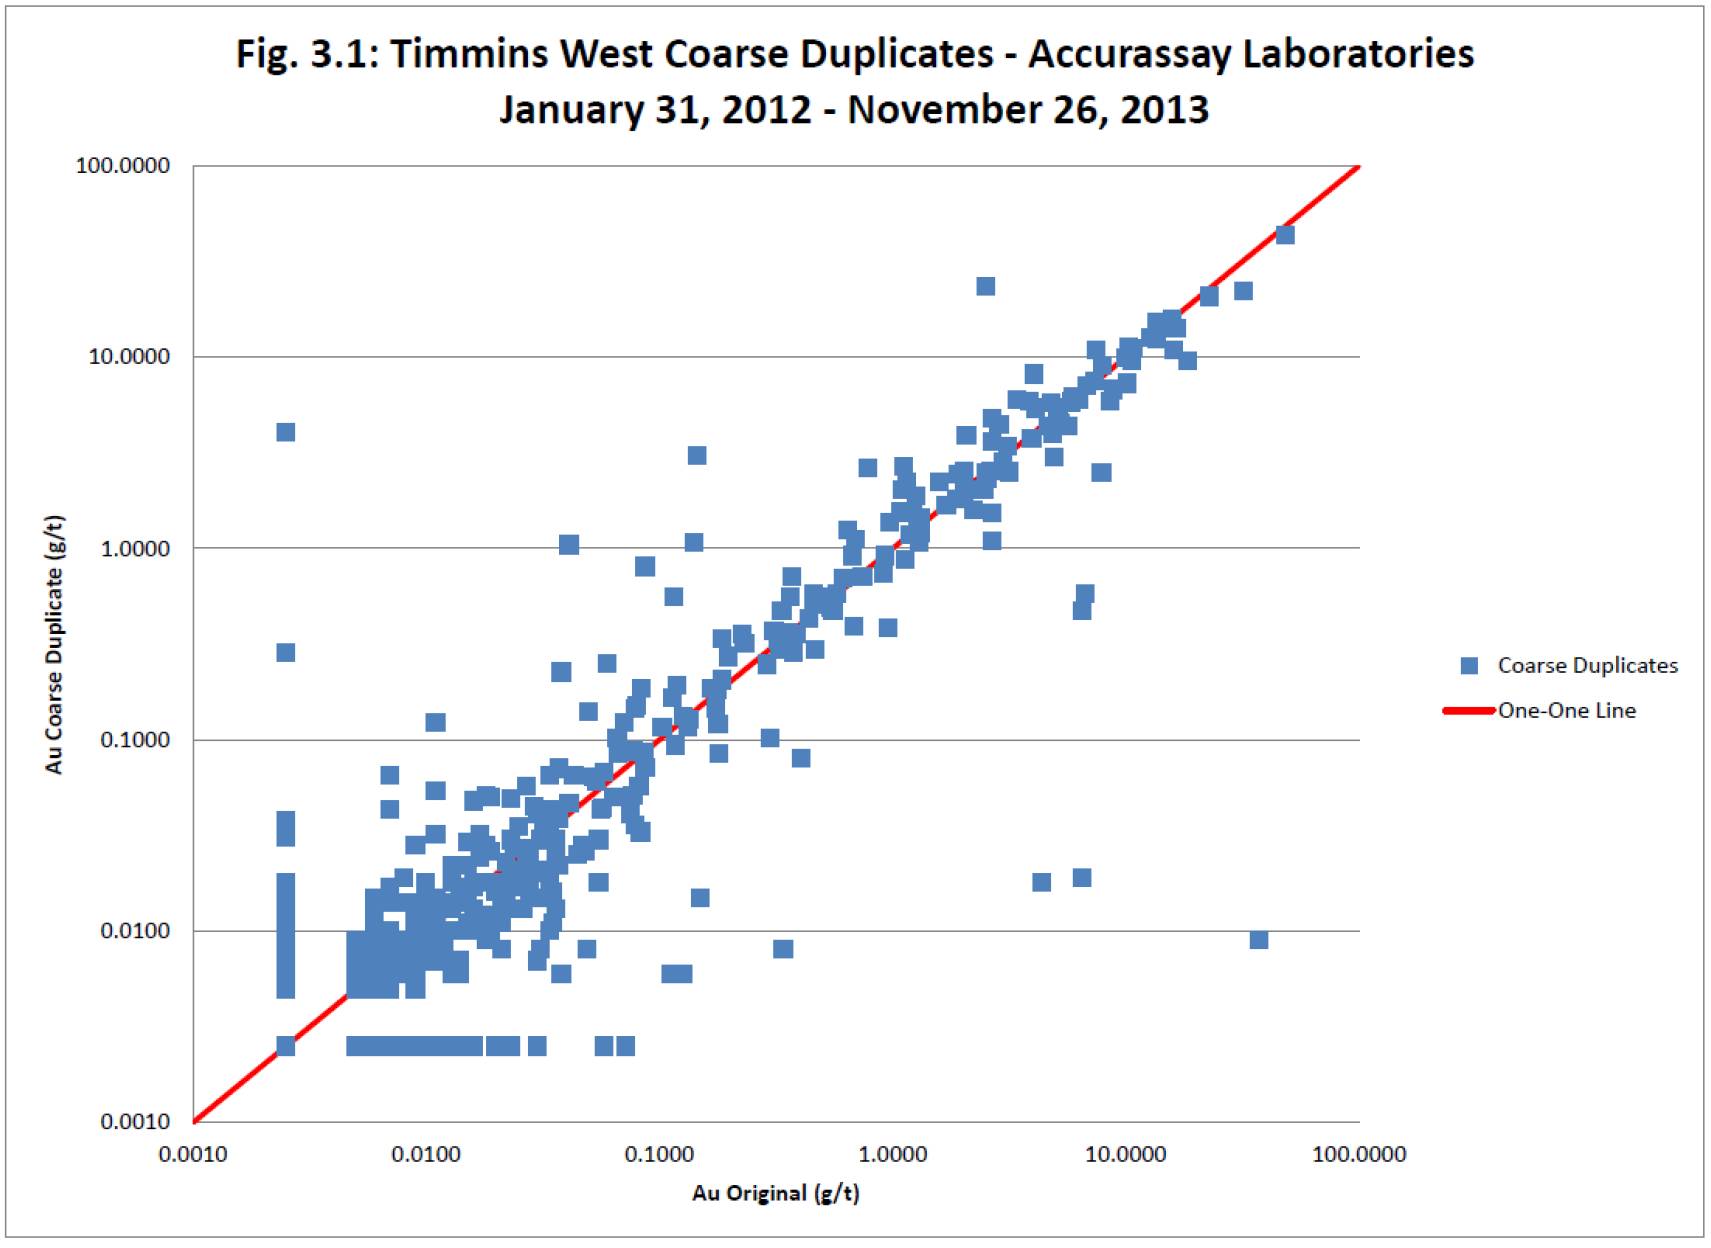
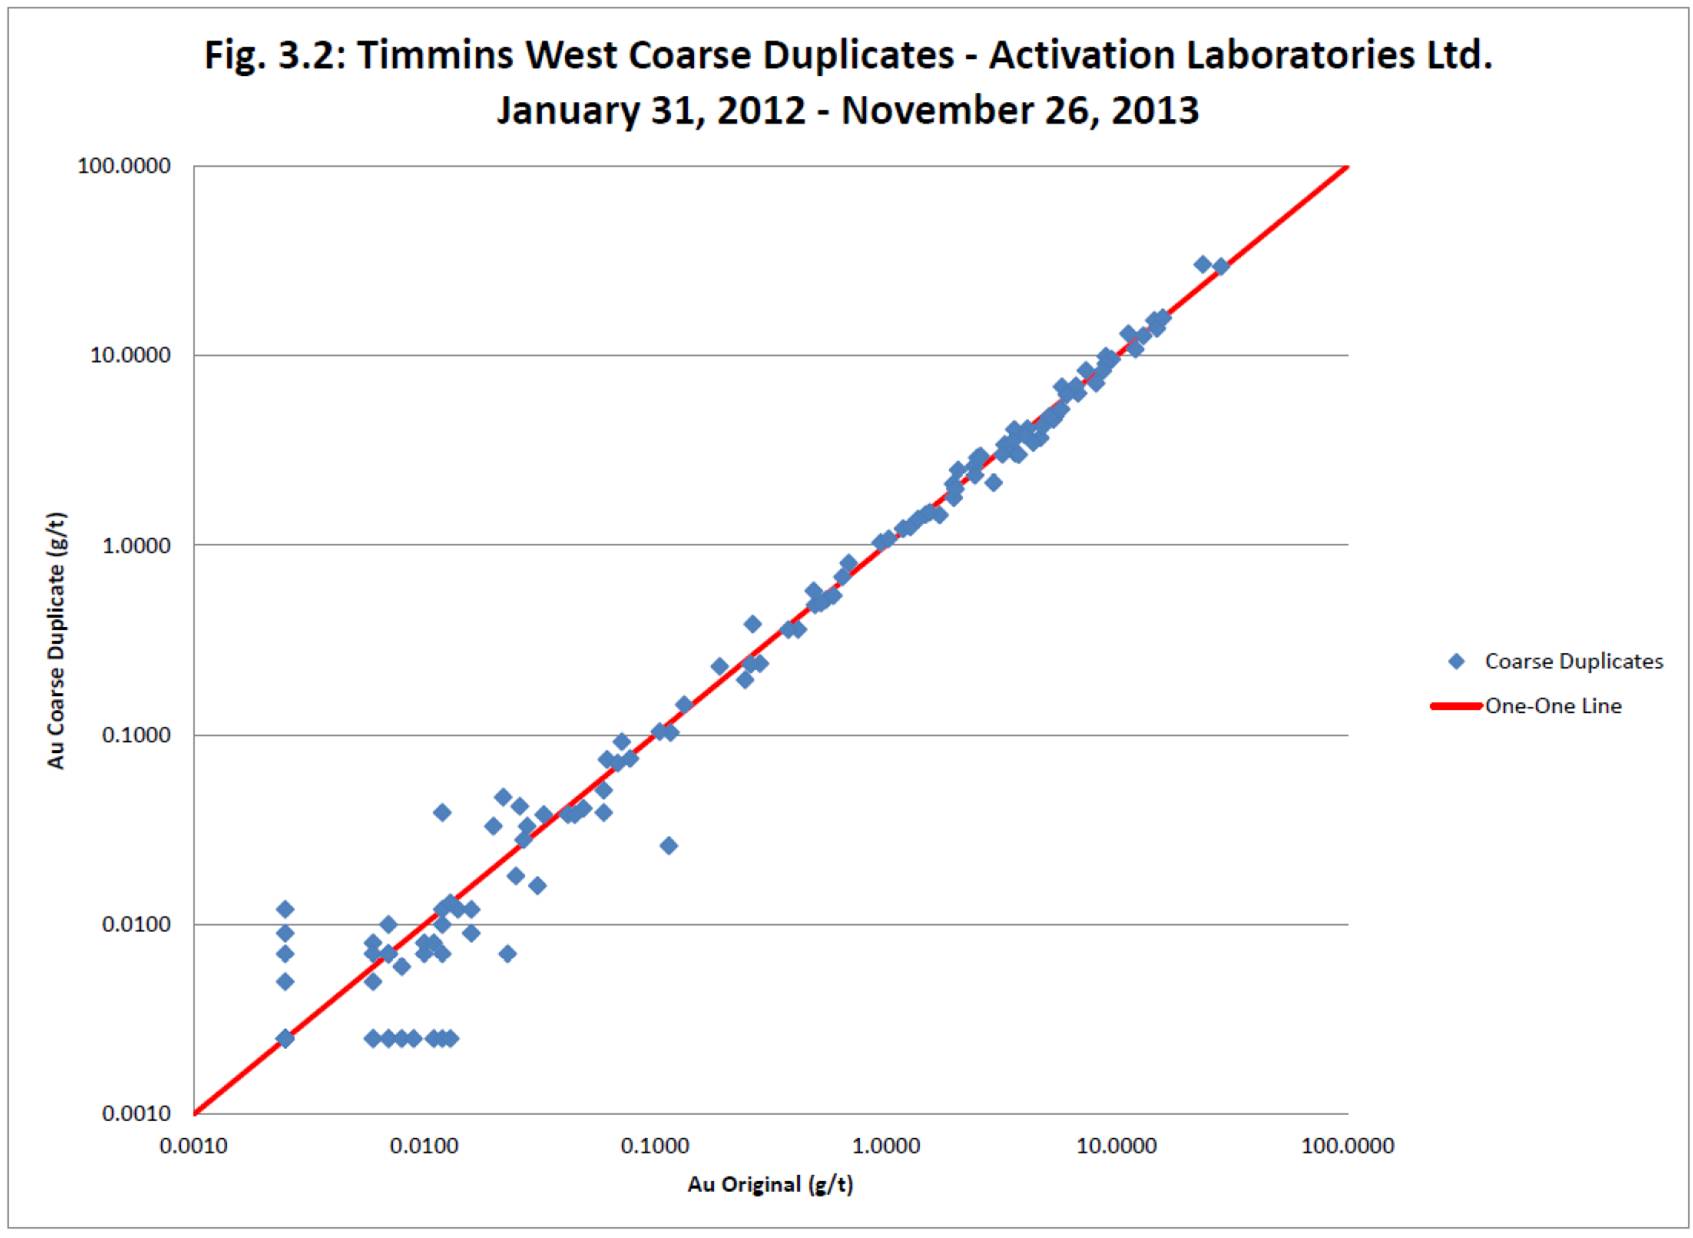
| | 11.4.2 | Precision Analysis — Duplicates | 86 |
| | 11.4.3 | Reporting and Plotting | 86 |
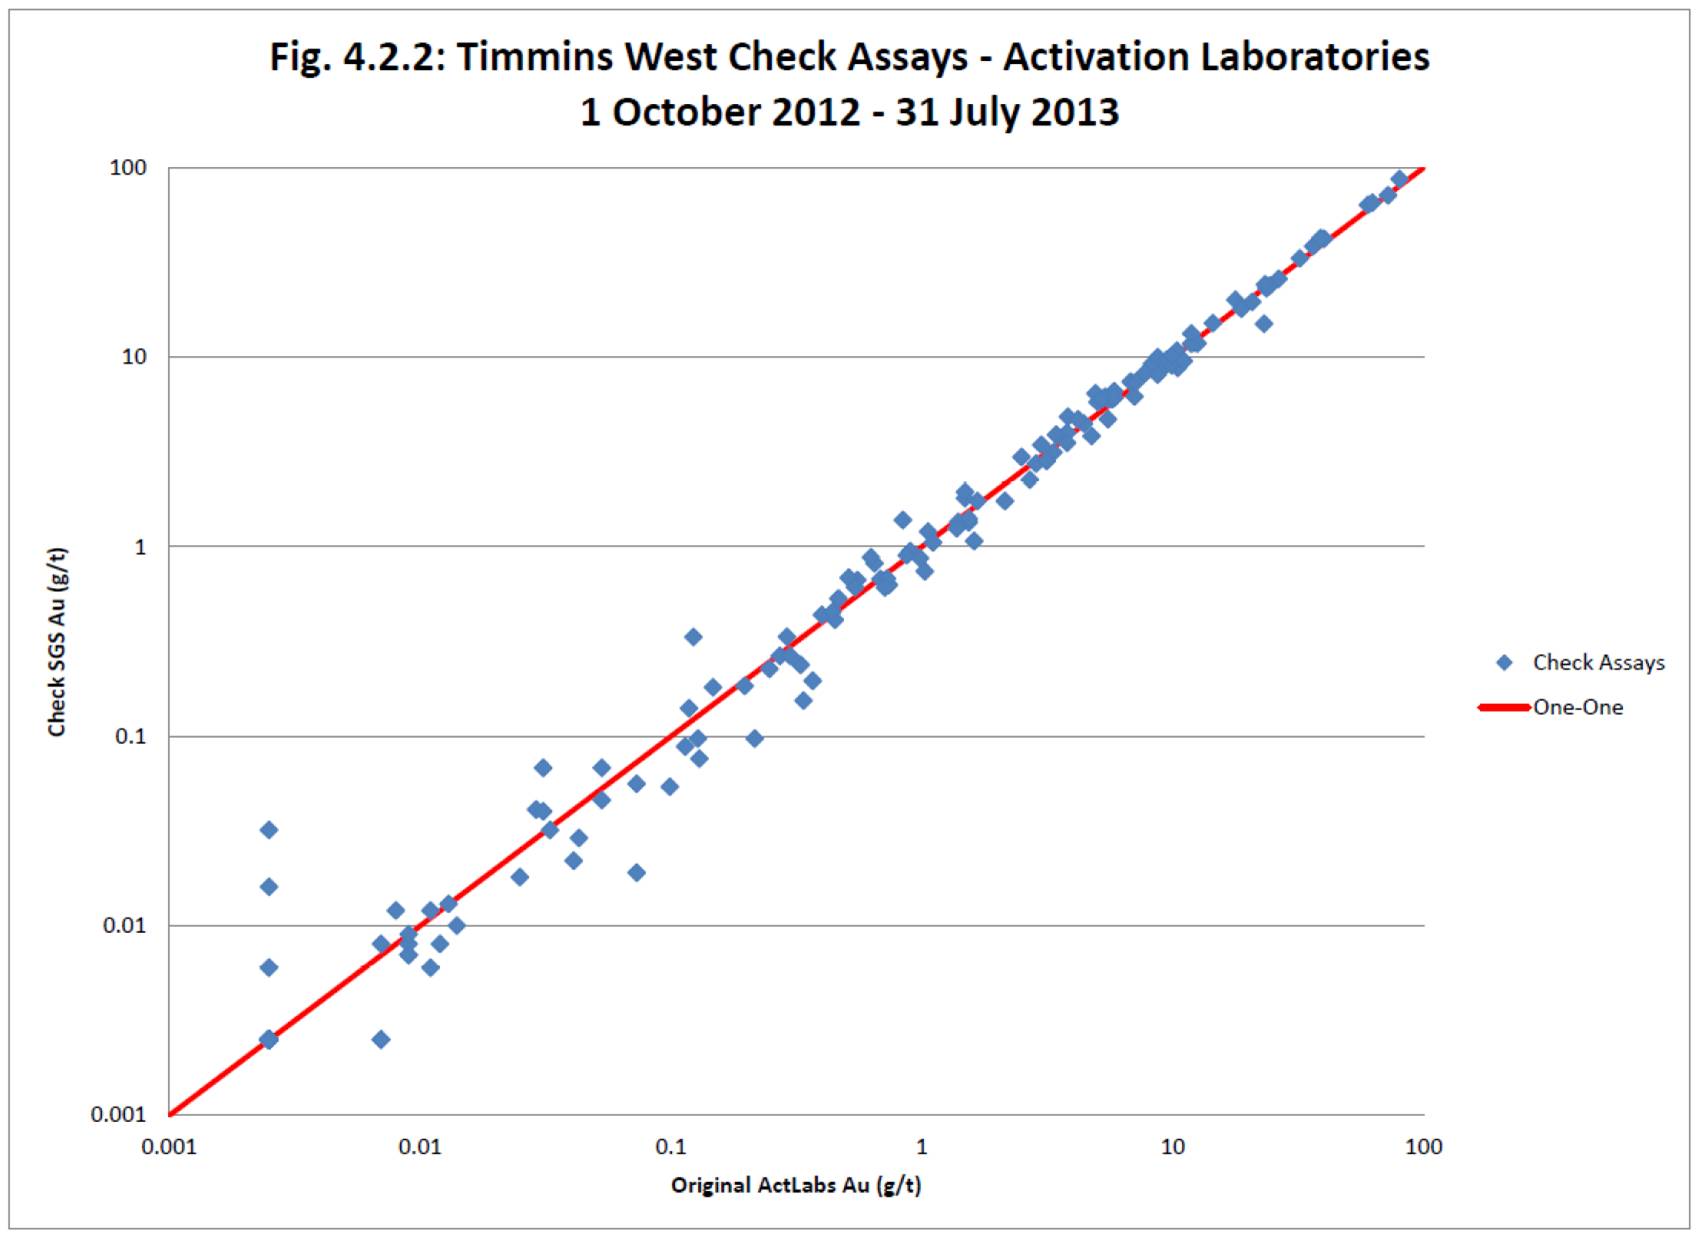
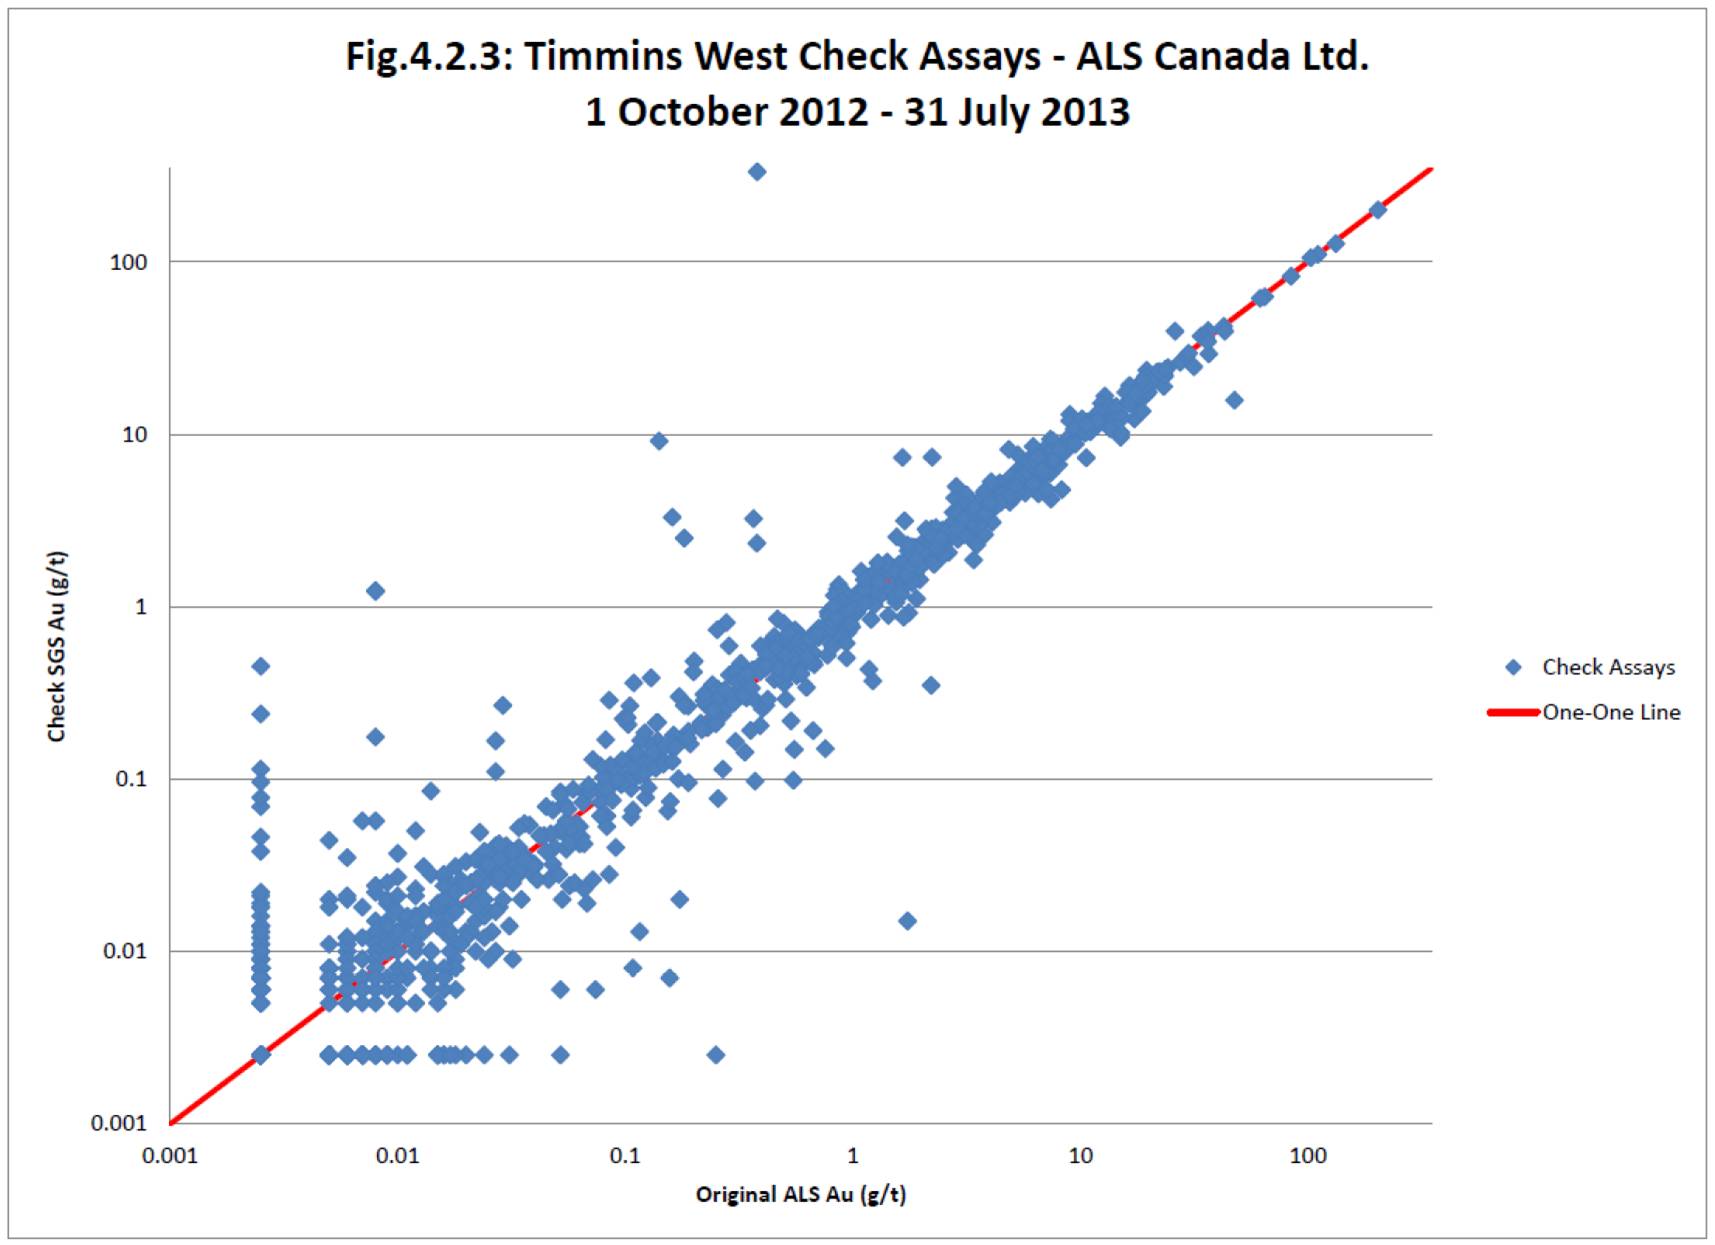
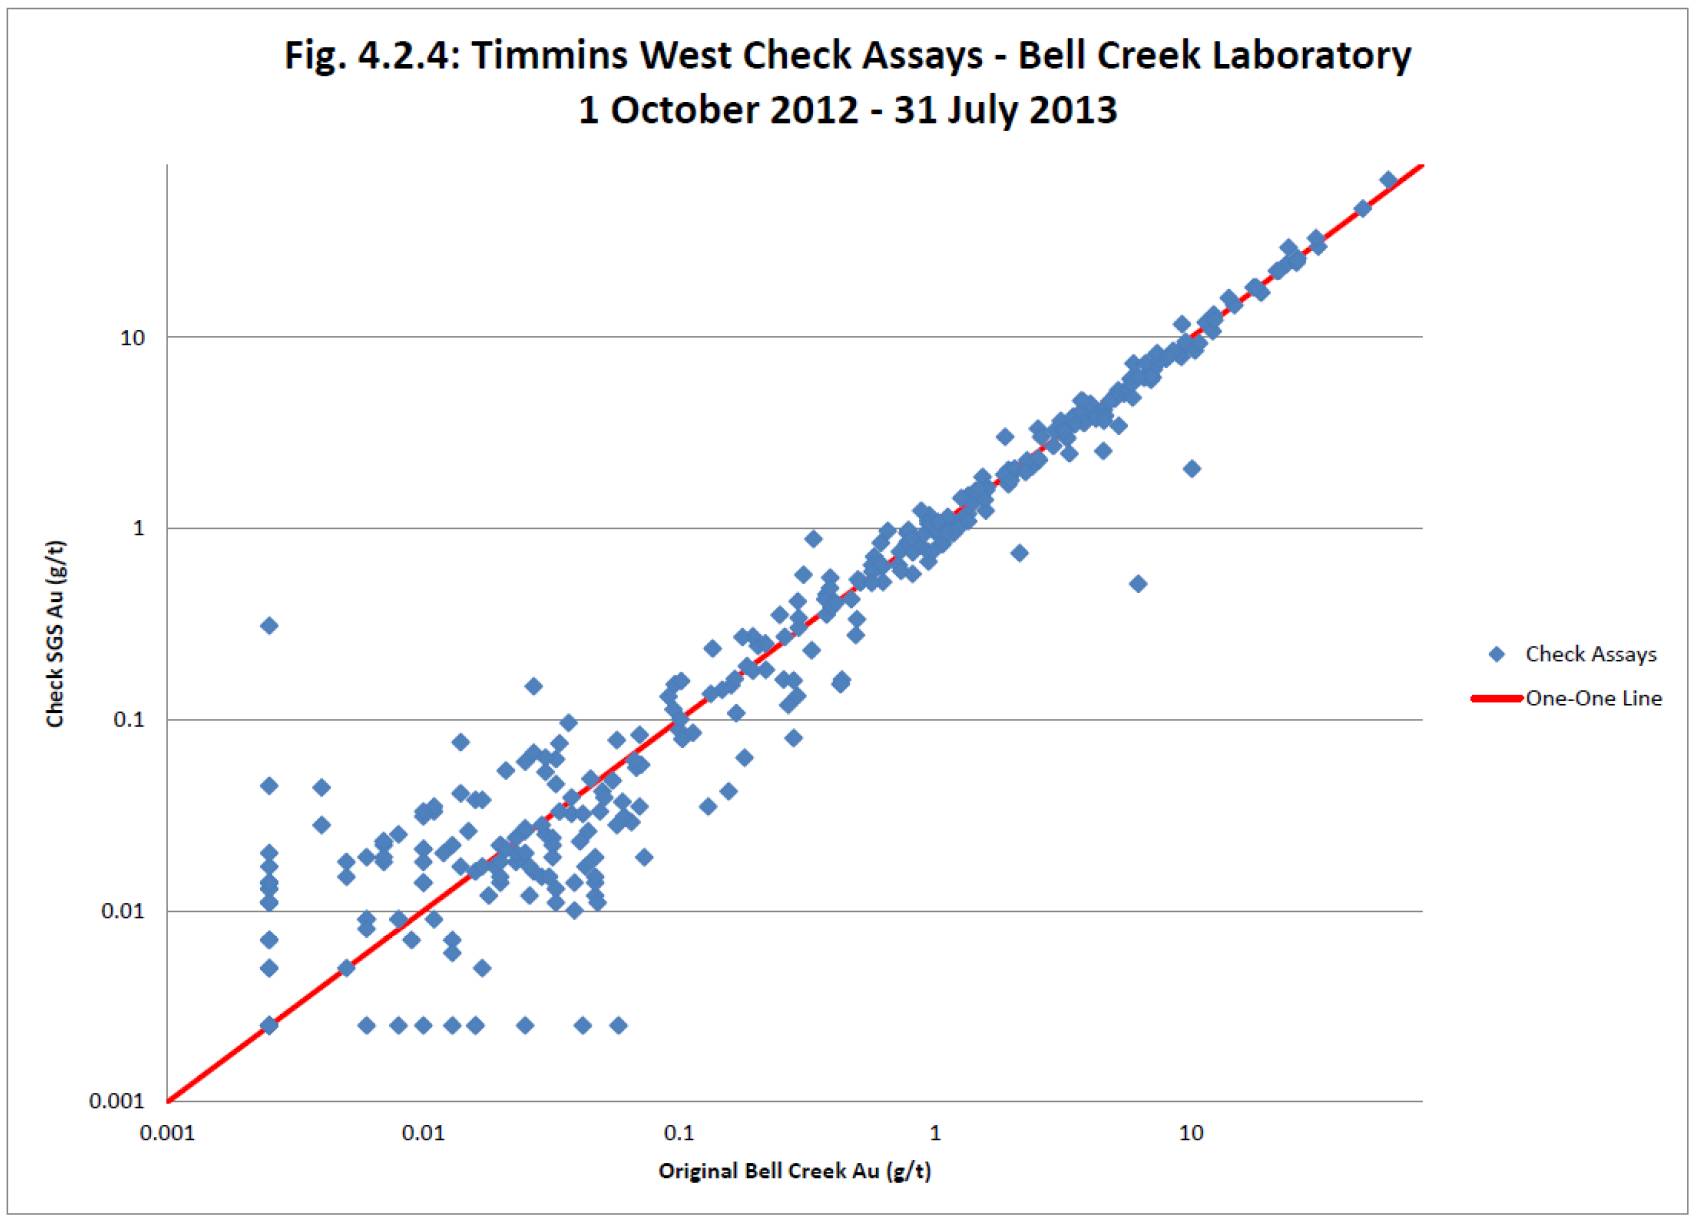
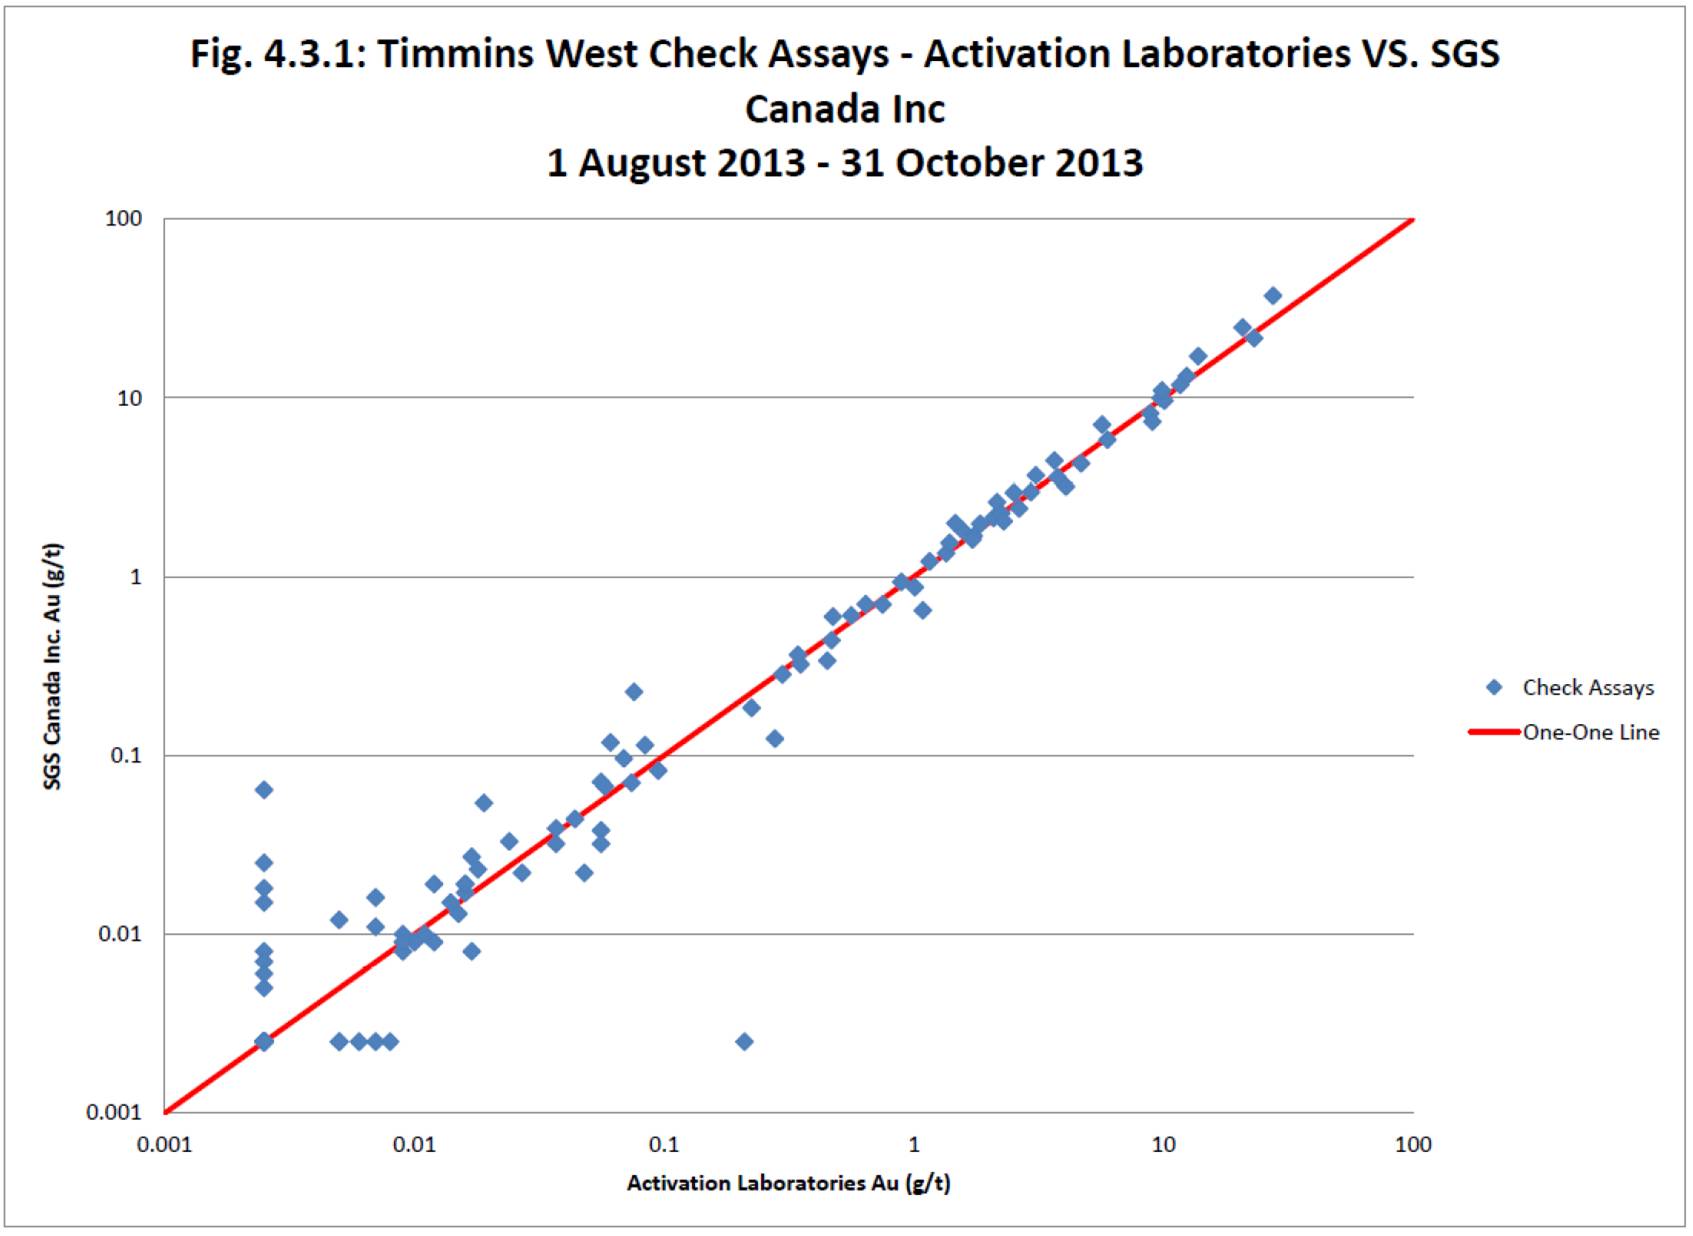
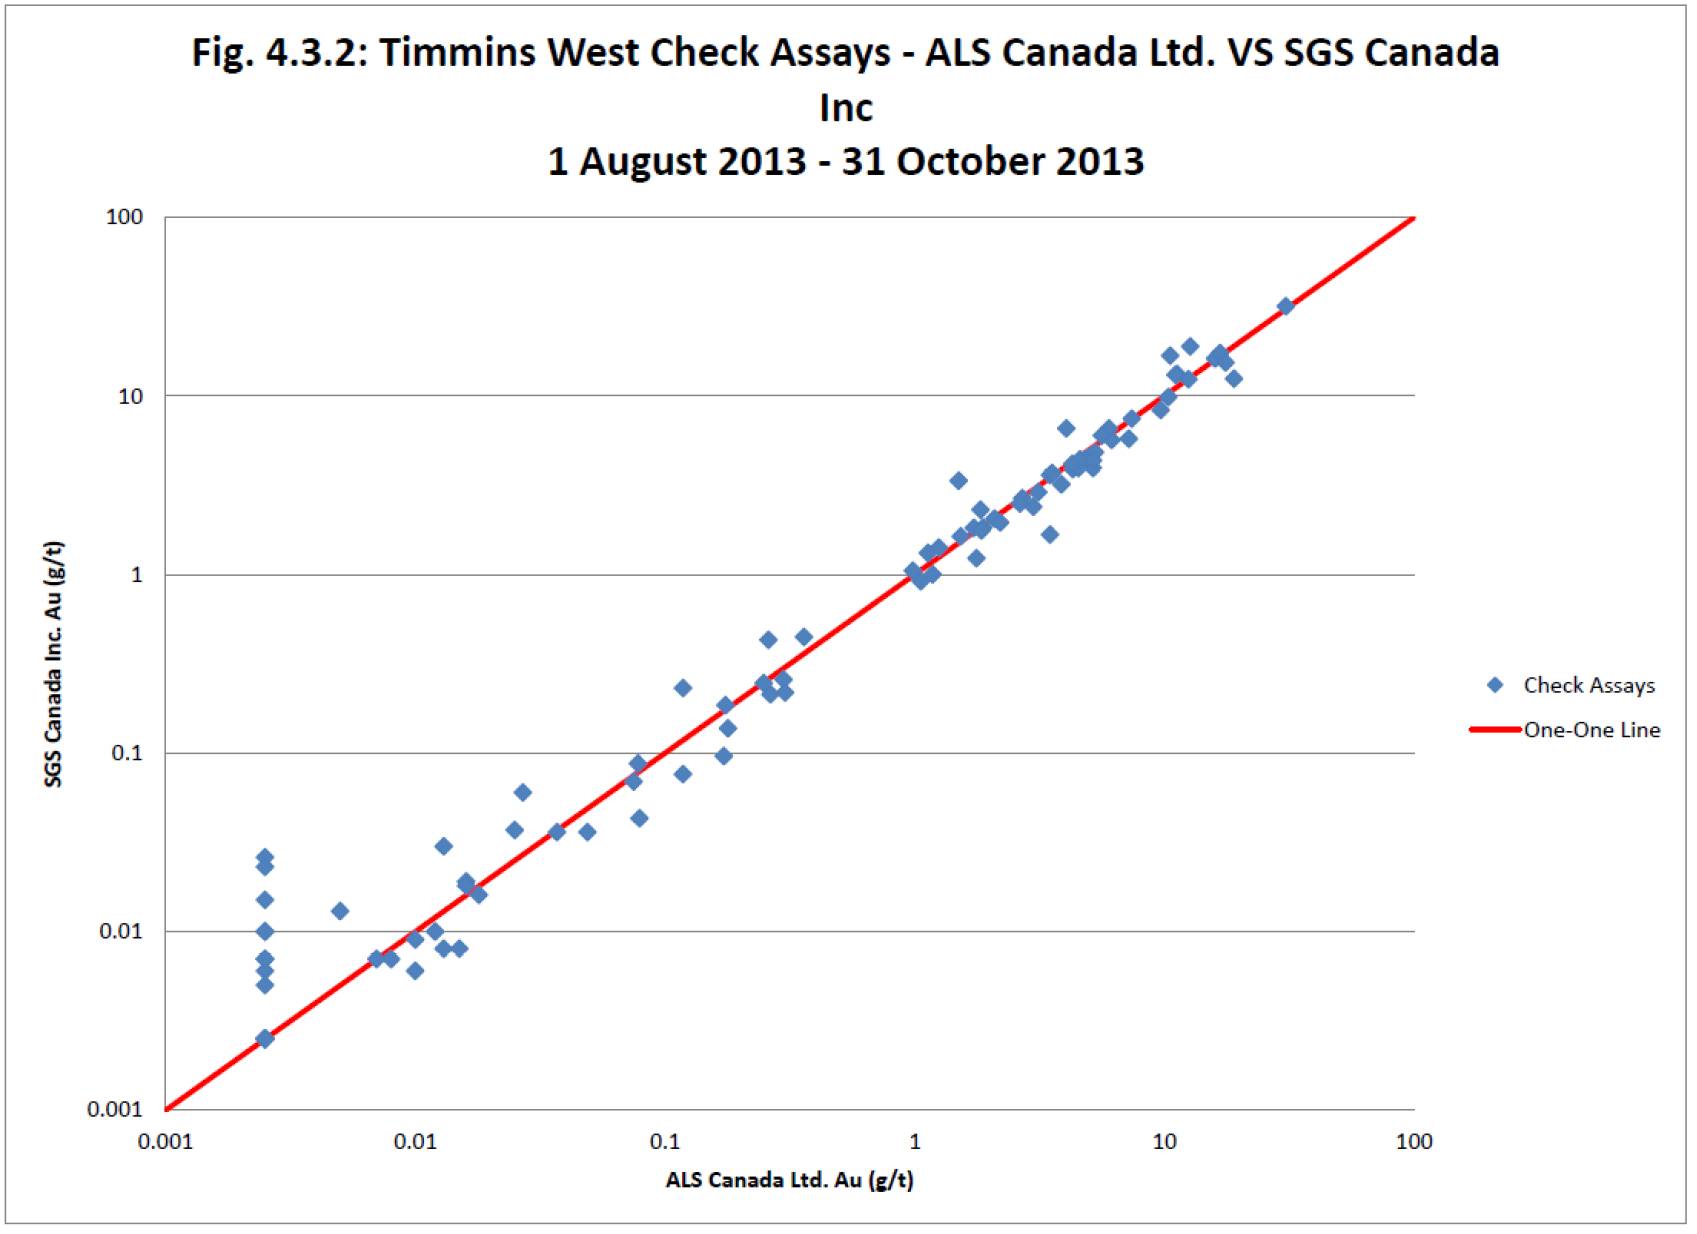
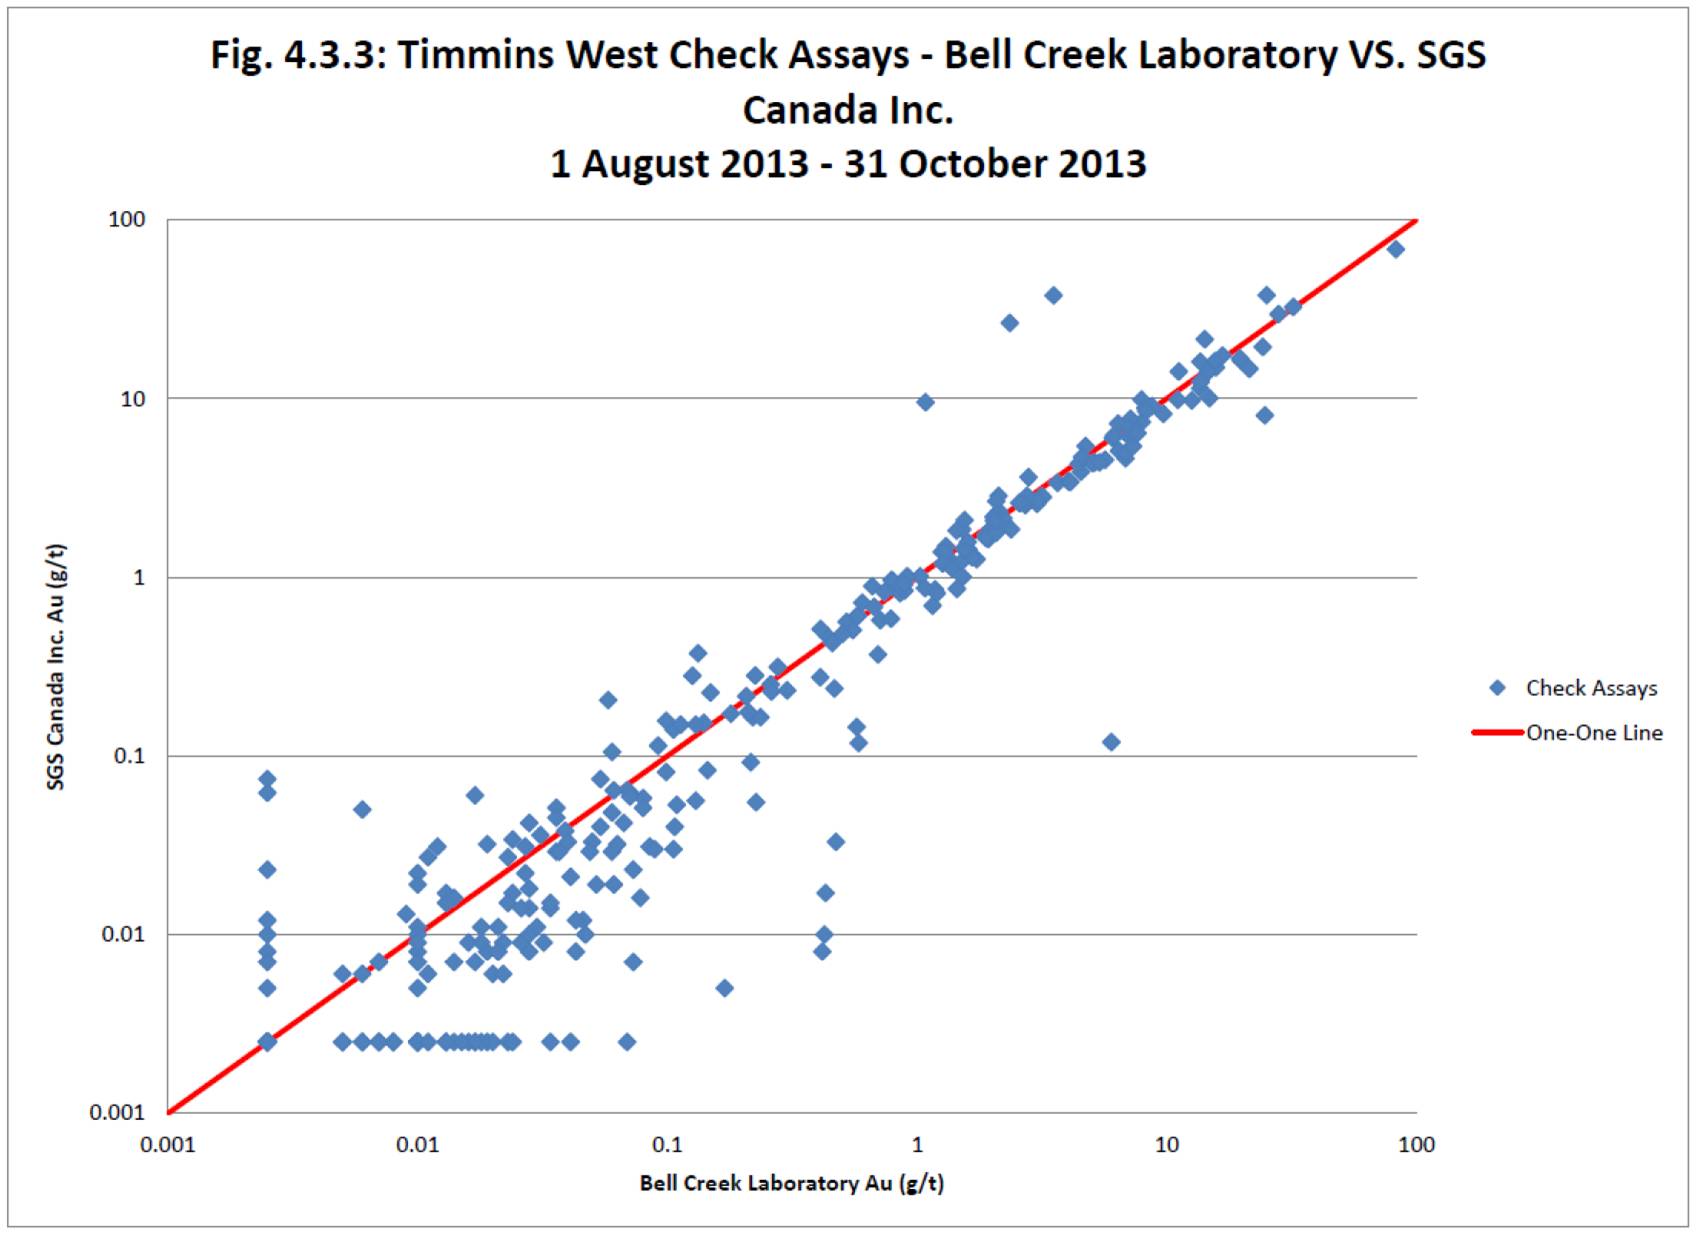
| 11.5 | CHECK ASSAY PROGRAM | 87 |
| | 11.5.1 | General Statement | 87 |
| | 11.5.2 | Procedures | 87 |
| 11.6 | DISCUSSION | 87 |
| | | |
12.0 | DATA VERIFICATION | 89 |
| 12.1 | Database Validation | 89 |
| | | |
13.0 | MINERAL PROCESSING AND METALLURGICAL TESTING | 91 |
| 13.1 | HISTORICAL TEST WORK | 91 |
| 13.2 | RECENT TEST WORK | 91 |
iii
TABLE OF CONTENTS
14.0 | MINERAL RESOURCE ESTIMATES | 93 |
| 14.1 | SUMMARY | 93 |
| 14.2 | ESTIMATION METHOD | 94 |
| | 14.2.1 | Procedures Summary | 94 |
| | 14.2.2 | Database | 95 |
| | 14.2.3 | Mineralized Domains | 96 |
| | 14.2.4 | Grade Capping | 99 |
| | 14.2.5 | Assay Compositing | 104 |
| 14.3 | SPECIFIC GRAVITY | 105 |
| 14.4 | VARIOGRAPHY | 106 |
| 14.5 | BLOCK MODEL MINERAL RESOURCE MODELING | 109 |
| | 14.5.1 | General | 109 |
| | 14.5.2 | Block Model Parameters | 109 |
| | 14.5.3 | Grade Interpolation | 109 |
| 14.6 | BLOCK MODEL VALIDATION | 111 |
| 14.7 | MINERAL RESOURCES AND CLASSIFICATION | 117 |
| | 14.7.1 | General | 117 |
| | 14.7.2 | Mineral Resources | 117 |
| 14.8 | RECONCILIATION TO PREVIOUS RESOURCE TIMMINS DEPOSIT | 122 |
| 14.9 | ADDITIONAL DRILL HOLE INFORMATION | 126 |
| | | |
15.0 | MINERAL RESERVE ESTIMATES | 128 |
| 15.1 | CUT-OFF GRADE | 128 |
| 15.2 | TIMMINS DEPOSIT RESERVE ESTIMATE | 129 |
| 15.3 | THUNDER CREEK DEPOSIT RESERVE ESTIMATE | 130 |
| 15.4 | TIMMINS WEST MINE COMBINED RESERVES | 131 |
| | | |
16.0 | MINING METHODS | 132 |
| 16.1 | UNDERGROUND ACCESS | 136 |
| | 16.1.1 | Primary / Secondary Access | 136 |
| 16.2 | SHAFT AND HOISTING FACILITIES | 136 |
| | 16.2.1 | Hoisting Plant | 136 |
| | 16.2.2 | Shaft Services | 137 |
| | 16.2.3 | Ore / Waste Handling System and Loading Pocket | 137 |
| 16.3 | STOPING METHODS | 137 |
| | 16.3.1 | Timmins Deposit | 137 |
| | 16.3.2 | Thunder Creek Deposit | 139 |
| 16.4 | RESOURCE ANALYSIS (DILUTION AND RECOVERY) | 141 |
| | 16.4.1 | Mining Dilution and Recovery | 141 |
| | 16.4.2 | Stope Cut-Off Grade | 142 |
| | 16.4.3 | Timmins Deposit Reserve Estimate | 142 |
| | 16.4.4 | Thunder Creek Deposit Reserve Estimate | 144 |
| | 16.4.5 | Timmins West Mine Combined Reserves | 145 |
| 16.5 | HAULAGE | 145 |
| | 16.5.1 | Timmins Deposit Underground Truck Haulage | 146 |
| | 16.5.2 | Thunder Creek Deposit Underground Truck Haulage | 146 |
| 16.6 | DEVELOPMENT | 146 |
| | 16.6.1 | Timmins Deposit | 148 |
| | 16.6.2 | Thunder Creek Deposit | 150 |
iv
TABLE OF CONTENTS
| | 16.6.3 | Ground Support | 151 |
| 16.7 | DEVELOPMENT SCHEDULES | 151 |
| 16.8 | BACKFILL | 152 |
| 16.9 | PRODUCTION | 152 |
| | 16.9.1 | Timmins Deposit Production | 152 |
| | 16.9.2 | Thunder Creek Deposit Production | 152 |
| | 16.9.3 | Timmins West Mine Production | 153 |
| 16.10 | PRODUCTION EQUIPMENT | 154 |
| 16.11 | VENTILATION | 154 |
| | 16.11.1 | Timmins Deposit Ventilation | 154 |
| | 16.11.2 | Thunder Creek Ventilation | 155 |
| | 16.11.3 | Mine Air Heating and Cooling | 156 |
| 16.12 | PERSONNEL | 156 |
| 16.13 | UNDERGROUND MINE SERVICES | 158 |
| | 16.13.1 | Electrical Distribution and Communications | 158 |
| | 16.13.2 | Compressed Air | 158 |
| | 16.13.3 | Service Water | 159 |
| | 16.13.4 | Mine Dewatering | 159 |
| | 16.13.5 | Roadbed Material | 159 |
| 16.14 | MATERIALS SUPPLY | 159 |
| 16.15 | MAINTENANCE | 160 |
| 16.16 | SAFETY | 160 |
| 16.17 | GEOTECHNICAL | 160 |
| 16.18 | BELL CREEK TAILINGS FACILITY | 162 |
| | | |
17.0 | RECOVERY METHODS | 165 |
| 17.1 | HISTORY | 165 |
| 17.2 | BELL CREEK MILL PROCESS DESCRIPTION | 165 |
| 17.3 | METALLURGICAL BALANCE | 166 |
| | | |
18.0 | PROJECT INFRASTRUCTURE | 168 |
| 18.1 | TIMMINS WEST MINE SITE | 168 |
| 18.2 | BELL CREEK MILL SITE | 168 |
| | | |
19.0 | MARKET STUDIES AND CONTRACTS | 169 |
| | |
20.0 | ENVIRONMENTAL STUDIES, PERMITTING AND SOCIAL OR COMMUNITY IMPACT | 170 |
| 20.1 | REGULATORY AND FRAMEWORK | 170 |
| | 20.1.1 | Provincial Environmental Assessments | 170 |
| | 20.1.2 | Federal Environmental Assessments | 170 |
| | 20.1.3 | Provincial Permits | 170 |
| | 20.1.4 | Federal Permits | 171 |
| 20.2 | ENVIRONMENTAL IMPACTS | 172 |
| 20.3 | ENVIRONMENTAL MONITORING PROGRAM | 173 |
| 20.4 | HAZARDOUS MATERIALS HANDLING | 175 |
| 20.5 | SPILL AND EMERGENCY RESPONSE PLAN | 175 |
| 20.6 | CLOSURE PLANNING | 175 |
| 20.7 | CONSULTATION | 176 |
| | | |
21.0 | CAPITAL AND OPERATING COSTS | 177 |
| 21.1 | CAPITAL COSTS | 177 |
v
TABLE OF CONTENTS
| 21.2 | OPERATING COSTS | 179 |
| | | |
22.0 | ECONOMIC ANALYSIS | 182 |
| | |
23.0 | ADJACENT PROPERTIES | 183 |
| 23.1 | GENERAL STATEMENT ABOUT ADJACENT PROPERTIES | 183 |
| 23.2 | PELANGIO EXPLORATION INC. — POIRIER OPTION — BRISTOL TOWNSHIP | 183 |
| 23.3 | NEWCASTLE MINERALS LIMITED — WEST TIMMINS GOLD PROJECT — CARSCALLEN TOWNSHIP | 183 |
| 23.4 | RICHMONT MINES INC. — CRIPPLE CREEK PROPERTY — DENTON TOWNSHIP | 184 |
| 23.5 | EXPLOR RESOURCES INC. — TIMMINS PORCUPINE WEST (ONTARIO) PROPERTY — BRISTOL AND OGDEN TOWNSHIPS | 184 |
| | | |
24.0 | OTHER RELEVANT DATA AND INFORMATION | 187 |
| | |
25.0 | INTERPRETATION AND CONCLUSIONS | 188 |
| 25.1 | RISKS | 191 |
| | | |
26.0 | RECOMMENDATIONS | 192 |
| | |
27.0 | REFERENCES | 194 |
| 27.1 | REPORTS AND SCHEDULES | 194 |
| 27.2 | ASSESSMENT RESEARCH IMAGING FILES (AFRI) | 201 |
| 27.3 | PRESS RELEASES | 206 |
| | | |
28.0 | DATE AND SIGNATURE PAGE | 219 |
| | |
29.0 | CERTIFICATES OF QUALIFIED PERSONS | 220 |
| | |
LIST OF FIGURES | |
| | |
Figure 4.1: | TIMMINS WEST MINE PROPERTY | 20 |
Figure 4.2: | LOCATION MAP | 24 |
Figure 5.1: | PHYSIOGRAPHY | 30 |
Figure 7.1: | TECTONIC ASSEMBLAGES OF THE ABITIBI SUBPROVINCE EAST OF THE KAPUSKASING STRUCTURAL ZONE (AFTER AYER, J.A., DUBÉ, B., TROWELL, N.F.; NE ONTARIO MINES AND MINERALS SYMPOSIUM, APRIL 16, 2009) | 40 |
Figure 7.2: | REGIONAL GEOLOGY | 42 |
Figure 7.3: | PROPERTY GEOLOGY | 53 |
Figure 7.4: | TIMMINS DEPOSIT UNDERGROUND GEOLOGY 790 M LEVEL (UPPER LEVEL) | 54 |
Figure 7.5: | TIMMINS DEPOSIT GENERALIZED CROSS-SECTION 4575E (TIMMINS WEST MINE GRID) | 55 |
Figure 7.6: | THUNDER CREEK UNDERGROUND GEOLOGY 300 M LEVEL (UPPER MINE) | 56 |
Figure 7.7: | THUNDER CREEK UNDERGROUND GEOLOGY 765 M LEVEL | 57 |
Figure 7.8: | THUNDER CREEK GENERALIZED CROSS-SECTION, 9550N (THUNDER CREEK SURFACE GRID) | 58 |
Figure 7.9: | 3-D VIEW LOOKING EAST, ILLUSTRATING TIMMINS WEST MINE SHAFT, RAMPS, LEVELS, AND RESOURCE ENVELOPES | 59 |
Figure 7.10: | STRUCTURAL PLAN, 300 LEVEL (RHYS, 2010) | 60 |
Figure 10.1: | SURFACE DIAMOND DRILL HOLE COLLAR LOCATIONS AND TRACES AND VERTICAL PROJECTION TO SURFACE OF THE OUTER PERIMETER OF THE RESOURCE | 70 |
Figure 14.1: | 3D VIEW OF RESOURCE SOLIDS, LOOKING NORTHEAST | 99 |
| | | | |
vi
TABLE OF CONTENTS
Figure 14.2: | TIMMINS DEPOSIT CUMULATIVE HISTOGRAMS | 101 |
Figure 14.3: | THUNDER CREEK CUMULATIVE HISTOGRAMS | 102 |
Figure 14.4: | VARIOGRAMS — TIMMINS DEPOSIT — FW ZONE, UM BELOW 650ML | 106 |
Figure 14.5: | VARIOGRAMS FOR THUNDER CREEK DEPOSIT — UTC, RUSK ZONES | 108 |
Figure 14.6: | TIMMINS MINE SECTION 4575 EAST — BLOCK MODEL AND DRILL HOLES | 112 |
Figure 14.7: | TIMMINS MINE PLAN FOR 790 LEVEL — BLOCK MODEL AND DRILL HOLES | 113 |
Figure 14.8: | THUNDER CREEK DEPOSIT — SECTION 9550N — BLOCK MODEL AND DIAMOND DRILL HOLES | 114 |
Figure 14.9: | THUNDER CREEK DEPOSIT— PLAN VIEW AT 730 LEVEL-BLOCK MODEL AND DIAMOND DRILL HOLES | 115 |
Figure 14.10: | MILL CORRECTION FOR GRADES FROM MINE PRODUCTION SAMPLING | 116 |
Figure 14.11: | 3D VIEW OF NEW GRADE BLOCK MODEL FOR THE TIMMINS DEPOSIT, LOOKING NORTHWEST | 119 |
Figure 14.12: | 3D VIEW OF NEW GRADE BLOCK MODEL FOR THE THUNDER CREEK DEPOSIT LOOKING NORTHWEST | 120 |
Figure 14.13: | TIMMINS DEPOSIT — GRADE TONNAGE CURVE | 121 |
Figure 14.14: | THUNDER CREEK — GRADE TONNAGE CURVE | 121 |
Figure 14.15: | LONG SECTION VIEW LOOKING NORTHWARDS COMPARING 2012 AND 2013 BLOCK MODELS FOR THE 790 FOOTWALL ZONE AT THE TIMMINS DEPOSIT | 123 |
Figure 14.16: | COMPARISON OF 2012 AND 2013 BLOCK MODELS FOR THE THUNDER CREEK DEPOSIT ON 730 LEVEL | 124 |
Figure 16.1: | TIMMINS DEPOSIT AND THUNDER CREEK DEPOSIT, LOOKING EAST | 132 |
Figure 16.2: | TIMMINS WEST MINE SURFACE INFRASTRUCTURE | 134 |
Figure 16.3: | TIMMINS WEST MINE EXISTING UNDERGROUND INFRASTRUCTURE | 135 |
Figure 16.4: | LONGITUDINAL LONGHOLE MINING METHOD | 138 |
Figure 16.5: | TRANSVERSE LONGHOLE MINING METHOD | 140 |
Figure 16.6: | PLANNED MINE INFRASTRUCTURE | 148 |
Figure 16.7: | EXISTING 650L INFRASTRUCTURE | 149 |
Figure 16.8: | EXISTING 730L INFRASTRUCTURE | 151 |
Figure 16.9: | LOM OUNCE PRODUCTION | 153 |
Figure 16.10: | TIMMINS WEST MINE VENTILATION SYSTEM | 155 |
Figure 16.11: | BELL CREEK TAILINGS FACILITY | 164 |
Figure 17.1: | SIMPLIFIED MILLING PROCESS AND SAMPLING POINTS | 167 |
Figure 20.1: | TIMMINS WEST MINE WATER MANAGEMENT PLAN | 173 |
Figure 20.2: | SITE PLAN | 174 |
Figure 25.1: | GRADE-TONNAGE GRAPH AS A FUNCTION OF CUT-OFF GRADE (TIMMINS DEPOSIT) | 189 |
Figure 25.2: | GRADE-TONNAGE GRAPH AS A FUNCTION OF CUT-OFF GRADE (THUNDER CREEK) | 189 |
vii
TABLE OF CONTENTS
LIST OF TABLES
Table 1.1: | TWM RESOURCE ESTIMATE AT 1.5 G/T IN-SITU COG | 3 |
Table 1.2: | TWM RESOURCE ESTIMATES AT 3.0 G/T IN-SITU COG | 4 |
Table 1.3: | TWM ESTIMATED RESERVES | 6 |
Table 1.4: | ESTIMATED LOM PRODUCTION PROFILE | 6 |
Table 1.5: | ESTIMATED LOM CAPITAL AND OPERATING COSTS | 7 |
Table 2.1: | LIST OF ABBREVIATIONS | 9 |
Table 2.2: | GLOSSARY | 13 |
Table 3.1: | QUALIFIED PERSONs FOR TIMMINS WEST MINE | 16 |
Table 4.1: | TIMMINS WEST MINE STAKED CLAIMS | 21 |
Table 4.2: | LEASED LANDS | 22 |
Table 4.3: | PATENTED LANDS | 22 |
Table 4.4: | SPECIES AT RISK | 27 |
Table 5.1: | AVERAGE TEMPERATURES, PRECIPITATION AND SNOW FALL DEPTHS FOR THE TIMMINS AREA (1971 TO 2000) | 28 |
Table 6.1: | CHRONOLOGY OF EVENTS FOR THE TIMMINS WEST MINE AREA | 31 |
Table 6.2: | WGM MINERAL RESOURCE ESTIMATE, OCTOBER 31, 2006 | 36 |
Table 6.3: | LSG UPDATED MINERAL RESOURCE OF SRK POLYGONAL RESOURCE AND STANTEC MINERAL RESERVE, AUGUST 2009 (DARLING ET AL., 2009) | 36 |
Table 6.4: | LSG INITIAL MINERAL RESOURCE ESTIMATE FOR THE THUNDER CREEK DEPOSIT (CRICK ET AL., 2011) | 36 |
Table 6.5: | LSG UPDATED MINERAL RESOURCE ESTIMATE FOR TIMMINS WEST MINE (CRICK ET AL., 2012A) | 37 |
Table 6.6: | LSG MINERAL RESERVE AND INDICATED RESOURCE ESTIMATE FOR TIMMINS WEST MINE (CRICK ET AL., 2012B) | 37 |
Table 6.7: | LSG MINERAL RESERVE AND RESOURCE ESTIMATE FOR TIMMINS WEST MINE, AT YEAR-END 2012 (AIF 2012; PRESS RELEASE DATED MARCH 18, 2013) | 38 |
Table 6.8: | TIMMINS DEPOSIT ANNUAL PRODUCTION FIGURES | 38 |
Table 6.9: | THUNDER CREEK ANNUAL PRODUCTION FIGURES | 38 |
Table 7.1: | TECTONIC ASSEMBLAGES | 41 |
Table 7.2: | LITHOLOGICAL UNITS | 46 |
Table 8.1: | OPERATIONS WITH GREATER THAN 100,000 OUNCES OF GOLD PRODUCTION IN THE PORCUPINE GOLD CAMP | 62 |
Table 9.1: | SUMMARY OF SIGNIFICANT EXPLORATION ACTIVITY BY LSG AT THE TIMMINS WEST MINE — 2003 TO PRESENT (EXCLUDES DRILLING) | 63 |
Table 10.1: | DIAMOND DRILLING BY PREVIOUS OPERATORS (1984 — 2002) | 69 |
Table 10.2: | STATISTICS ON DIAMOND DRILLING BY LSG FOR TIMMINS WEST MINE AREA (2003 TO FEBRUARY 2014) | 72 |
Table 10.3: | DRILLING AND SAMPLING STATISTICS TO CUT-OFF DATES FROM DATABASE | 73 |
Table 11.1: | OREAS STANDARDS USED BY LAKE SHORE GOLD CORP. | 81 |
Table 11.2: | SUMMARY OF SAMPLE DISTRIBUTION BY ANALYTICAL LABORATORIES | 82 |
Table 11.3: | TIMMINS WEST MINE DIAMOND DRILL CORE QA/QC SAMPLE SUMMARY | 88 |
Table 14.1: | TIMMINS WEST MINE RESOURCE ESTIMATE | 94 |
Table 14.2: | SUMMARY OF GEMS SQL DRILL HOLE DATABASE | 96 |
Table 14.3: | MINERALIZED DOMAINS | 97 |
Table 14.4: | BASIC STATISTICS OF RAW AU ASSAYS BY RESOURCE SOLID | 100 |
Table 14.5: | CAPPED AND UNCAPPED GOLD GRADES | 104 |
viii
TABLE OF CONTENTS
Table 14.6: | BASIC STATISTICS OF 1 METRE COMPOSITES | 105 |
Table 14.7: | SPECIFIC GRAVITY BY ZONE | 105 |
Table 14.8: | BLOCK MODEL GRID PARAMETERS | 109 |
Table 14.9: | TIMMINS DEPOSIT SEARCH ELLIPSE PARAMETERS | 110 |
Table 14.10: | THUNDER CREEK SEARCH ELLIPSE PARAMETERS | 111 |
Table 14.11: | COMPARISON OF ID2 AND NEAREST NEIGHBOUR INTERPOLATION | 115 |
Table 14.12: | TIMMINS WEST MINE RESOURCE ESTIMATES | 118 |
Table 14.13: | COMPARISON OF 2012 AND 2013 RESOURCE ESTIMATES | 122 |
Table 14.14: | THUNDER CREEK RESOURCES FROM 2012 AND 2013, LISTED BY ZONE | 125 |
Table 14.15: | TIMMINS MINE RESOURCES FROM 2012 AND 2013, LISTED BY ZONE | 125 |
Table 14.16: | THUNDER CREEK RESOURCES FROM 2012 AND 2013, LISTED BY LEVEL | 125 |
Table 14.17: | TIMMINS MINE RESOURCES FROM 2012 AND 2013, LISTED BY LEVEL | 126 |
Table 15.1: | TIMMINS WEST MINE IN-SITU INDICATED RESOURCE AT 3.0 G/T CUT-OFF GRADE | 128 |
Table 15.2: | TWM COG ASSUMPTIONS | 128 |
Table 15.3: | TIMMINS DEPOSIT ESTIMATED RESERVES | 129 |
Table 15.4: | THUNDER CREEK DEPOSIT ESTIMATED RESERVES | 131 |
Table 15.5: | TIMMINS WEST MINE COMBINED RESERVES | 131 |
Table 16.1: | TIMMINS WEST MINE IN-SITU INDICATED RESOURCE AT 3.0 G/T CUT-OFF GRADE | 135 |
Table 16.2: | TWM COG ASSUMPTIONS | 142 |
Table 16.3: | TIMMINS DEPOSIT ESTIMATED RESERVES | 143 |
Table 16.4: | THUNDER CREEK UNPLANNED DILUTION PARAMETERS | 144 |
Table 16.5: | THUNDER CREEK UNPLANNED BACKFILL DILUTION PARAMETERS | 144 |
Table 16.6: | THUNDER CREEK DEPOSIT ESTIMATED PROBABLE RESERVES | 145 |
Table 16.7: | TIMMINS WEST MINE COMBINED RESERVES | 145 |
Table 16.8: | TIMMINS DEPOSIT ESTIMATED LOM DEVELOPMENT QUANTITIES | 146 |
Table 16.9: | THUNDER CREEK DEPOSIT ESTIMATED LOM DEVELOPMENT QUANTITIES | 147 |
Table 16.10: | WASTE ROCK GENERATED FROM DEVELOPMENT | 147 |
Table 16.11: | TWM ANNUAL PRODUCTION TONNES | 153 |
Table 16.12: | TWM ANNUAL OUNCES MINED TO SURFACE | 153 |
Table 16.13: | UNDERGROUND MOBILE EQUIPMENT FLEET | 154 |
Table 16.14: | PERSONNEL ON PAYROLL | 156 |
Table 16.15: | SUMMARY OF GROUND SUPPORT MINIMUM REQUIREMENTS — LATERAL DEVELOPMENT | 162 |
Table 16.16: | SUMMARY OF GROUND SUPPORT MINIMUM REQUIREMENTS — RAISES | 162 |
Table 21.1: | TIMMINS WEST MINE ESTIMATED LOM CAPITAL COSTS | 177 |
Table 21.2: | OPERATING COST SUMMARY | 179 |
Table 23.1: | DISTANCE FROM THE TIMMINS WEST MINE HEADFRAME TO SIGNIFICANT TIMMINS AREA MINING LANDMARKS | 183 |
Table 23.2: | SUMMARY OF WORK COMPLETED BY NEWCASTLE MINERALS LIMITED | 184 |
| | |
APPENDICES | |
| |
1 | MEMOS REGARDING STATISTICAL ANALYSIS OF QA/QC ASSAY DATA FOR THUNDER CREEK AND TIMMINS WEST DEPOSITS | |
2 | SGS CANADA MEMO REGARDING REVIEW OF THE TIMMINS WEST MINE RESOURCES | |
3 | UNDERGROUND PHOTOS OF THE TIMMINS WEST MINE MINERALIZATION AT THUNDER CREEK AND TIMMINS DEPOSITS | |
| | | |
ix
CAUTIONARY NOTE WITH RESPECT TO FORWARD LOOKING INFORMATION
Certain information and statements contained in this report are “forward looking” in nature. All information and statements in this report, other than statements of historical fact, that address events, results, outcomes, or developments that Lake Shore Gold and/or the Qualified Persons who authored this report expect to occur are “forward-looking statements”. Forward-looking statements are statements that are not historical facts and are generally, but not always, identified by the use of forward-looking terminology such as “plans”, “expects”, “is expected”, “budget”, “scheduled”, “estimates”, “forecasts”, “intends”, “anticipates”, “projects”, “potential”, “believes” or variations of such words and phrases or statements that certain actions, events or results “may”, “could”, “would”, “should”, “might” or “will be taken”, “occur” or “be achieved” or the negative connotation of such terms. Forward-looking statements include, but are not limited to, statements with respect to anticipated production rates; grades; projected metallurgical recovery rates; infrastructure, capital, operating and sustaining costs; the projected life-of-mine; proposed development and potential impact on cash flow; estimates of Mineral Reserves and Resources; the future price of gold; government regulations; the maintenance or renewal of any permits or mineral tenures; estimates of reclamation obligations that may be assumed; requirements for additional capital; environmental risks; and general business and economic conditions.
All forward-looking statements in this report are necessarily based on opinions and estimates made as of the date such statements are made and are subject to important risk factors and uncertainties, many of which cannot be controlled or predicted.
Material assumptions regarding forward-looking statements are discussed in this report, where applicable. In addition to, and subject to, such specific assumptions discussed in more detail elsewhere in this report, the forward-looking statements in this report are subject to the following assumptions: (1) there being no signification disruptions affecting the operation of the mine; (2)��the availability of certain consumables and services, and the prices for diesel, propane, cyanide, electricity and other key supplies being approximately consistent with current levels; (3) labour and materials costs increasing on a basis consistent with current expectations; (4) that all environmental approvals, required permits, licenses and authorizations will continue to be held on the same or similar terms and obtained from the relevant governments and other relevant stakeholders within the expected timelines; (5) no significant changes will be made to tax rates and no new taxes, royalties or other fees will be levied by applicable governments; (6) the timelines for exploration activities will proceed in accordance with estimates; (7) assumptions made in Mineral Resource and Reserve estimates, including geological interpretation, grade, recovery rates, gold prices, foreign exchange rates, and operational and capital costs, will hold true; and (8) general business and economic conditions will remain substantially the same.
Forward-looking statements involve known and unknown risks, uncertainties and other factors which may cause the actual results, performance or achievements to be materially different from any of the future results, performance or achievements expressed or implied by forward-looking statements. These risks, uncertainties and other factors include, but are not limited to: a decrease in future gold prices; costs of labour, supplies, fuel and equipment rising; adverse changes in anticipated production, including discrepancies between actual and estimated production, Reserves, Resources and recoveries; exchange rate fluctuations; title risks; regulatory risks, and political or economic developments in Canada; changes to tax rates; risks and uncertainties with respect to obtaining necessary permits, land use rights and other tenure from the Crown and private landowners or delays in obtaining same; risks associated with maintaining and renewing permits and complying with permitting requirements, and
x
other risks involved in the gold exploration, development and mining industry; as well as those risk factors discussed elsewhere in this report, in Lake Shore Gold’s latest Annual Information Form, Management’s Discussion and Analysis and its other SEDAR filings from time to time. All forward-looking statements herein are qualified by this cautionary statement.
Accordingly, readers should not place undue reliance on forward-looking statements. Lake Shore Gold and the Qualified Persons who authored this report undertake no obligation to update publicly or otherwise revise any forward-looking statements whether as a result of new information or future events or otherwise, except as may be required by law.
CAUTIONARY NOTE TO U.S. READERS CONCERNING ESTIMATES OF MEASURED, INDICATED, AND INFERRED MINERAL RESOURCES
Information concerning the Timmins West Mine has been prepared in accordance with Canadian standards under applicable Canadian securities laws, and may not be comparable to similar information for United States companies. The terms “Mineral Resource”, “Measured Mineral Resource”, “Indicated Mineral Resource” and “Inferred Mineral Resource” used in this report are Canadian mining terms as defined in accordance with National Instrument 43-101 (NI 43-101) under guidelines set out in the Canadian Institute of Mining, Metallurgy and Petroleum (CIM) Standards on Mineral Resources and Mineral Reserves adopted by the CIM Council on November 27, 2010. While the terms “Mineral Resource”, “Measured Mineral Resource”, “Indicated Mineral Resource” and “Inferred Mineral Resource” are recognized and required by Canadian securities regulations, they are not defined terms under the rules and regulations of the United States Securities and Exchange Commission applicable to mining companies. As such, certain information contained in this report concerning descriptions of mineralization and resources under Canadian standards is not comparable to similar information made public by United States companies subject to the reporting and disclosure requirements of the United States Securities and Exchange Commission. An “Inferred Mineral Resource” has a great amount of uncertainty as to its existence and as to its feasibility. It cannot be assumed that all or any part of an “Inferred Mineral Resource” will ever be upgraded to a higher category. Readers are cautioned not to assume that all or any part of an “Inferred Mineral Resource” exists, or is mineable.
xi
1.0 SUMMARY
This Technical Report has been prepared under the direct supervision of Eric Kallio (P. Geo.) and Natasha Vaz (P. Eng.) on behalf of Lake Shore Gold Corp. (LSG) for the Timmins West Mine. Timmins West Mine (TWM) consists of mineralized zones from the Timmins Deposit and Thunder Creek Deposit. The Timmins Deposit has been in commercial production since January 2011, prior to the establishment of TWM. The resource and reserves statements included in this report have an effective date of February 21, 2014.
The purpose of this report is to provide a summary of the total resource pool, current mine infrastructure, the life-of-mine (LOM) plan, and estimated mine capital and operating costs to substantiate an updated Mineral Reserve estimate for TWM. The work completed to support the updated reserves has been conducted on the indicated mineral resource only, with mining, milling, and cost estimating based on actual operating experience at TWM and the Bell Creek Mill.
This revised mineral resource and reserve statement uses data collected by LSG from underground and surface diamond drilling, and underground mapping and sampling from mineralization exposed in mine openings.
Commercial production at the Timmins Deposit was announced in January 2011 and at Thunder Creek in January 2012. As such (and meeting gross revenue criteria), LSG considers this technical report as being issued by a “Producing Issuer” under the definitions of NI 43-101.
The headframe of the Timmins West Mine is located approximately 1.1 kilometres southeast of the intersection of Provincial Highways 101 and 144, approximately 19 kilometres west of the city of Timmins. The highways and a short site access road provide year round road access to the property.
The TWM area includes the Timmins Deposit property and the Thunder Creek Deposit property for a total area of approximately 12.9 square kilometres situated in Bristol and Carscallen Townships. The Timmins Deposit portion consists of a block of 23 contiguous claims (395 hectares) of which there are 21 individual patented claims and 12 leased claims that are further divided into two 21 year leases. The Thunder Creek portion of the property consists of 57 staked claim units and three leasehold single unit patent claims totaling approximately 960 hectares. LSG owns 100% interest in the property subject to underlying royalties. The claims and leases are all in good standing.
The TWM area lies along the northeast trending contact zone between southeast facing mafic metavolcanic rocks of the Tisdale Assemblage (to the northwest) and unconformably overlaying, dominantly southeasterly facing metasedimentary rocks of the Porcupine Assemblage (to the southeast). The contact dips steeply to the northwest, and is modified and locally deflected by folds and shear zones that are associated with gold mineralization.
Gold mineralization occurs in steep north-northwest plunging mineralized zones which plunge parallel to the local orientations of the L4 lineation features. Mineralization occurs within, or in favourable lithostructural settings within 100 metres of the Holmer and Rusk Shear Zones. Mineralization comprises multiple generations of quartz-carbonate-tourmaline ±albite veins, associated with disseminated pyrite alteration envelopes. Textural evidence suggests that veining formed progressively through D3 and D4 deformation. All phases of gold-bearing veins cut and post-date alkali intrusive complex and syenitic to monzonitic intrusions (Rhys, 2010).
1
The TWM is accessed by a production shaft and portal/ramp from surface. Both facilities are located near the Timmins Deposit. Mining at the Timmins Deposit was initiated in the second half of 2009 via the main ramp from surface that had been developed to a depth of 200 vertical metres (while the production shaft was being constructed). Mining started within the Vein Zones, Footwall (FW) Zone, and the Main Zone (MZ). In the upper levels, mining results were largely as anticipated, short strike length, narrow quartz-tourmaline veins that returned low grade and small tonnes with poor continuity of mineralization.
In 2010, mining continued in the MZ and Vein Zones from the ramp between the 140 metre level and the 270 metre level. Mining in the upper part of the Timmins Deposit has been mainly idle since mid-2013. Drilling of the Main and Vein Zones below the 290 Level is limited but shows potential for new zones similar to levels above.
The first stope in the UM1 complex from the 650 metre level (accessed via the production shaft) was mined in the fourth quarter of 2010 and was highly successful. Mining a number of the smaller, structural hangingwall lenses comprising the UM complex (including the UM2 and UM1a) has also proven successful despite smaller size, moderately lower grade, and complex geometry. The positive mining results in the UM mineralization to date is a promising indicator for continued mining at depth.
From 2009 through 2013, 1.25 million tonnes at an average grade of 4.4 grams per tonne Au (176,644 ounces) have been milled from the Timmins Deposit.
Access to the Thunder Creek Deposit was gained by developing ramps from the Timmins Deposit 200 metre level (accessing Thunder Creek Rusk Zone at the 300 metre level) and 650 metre level (accessing Thunder Creek Porphyry Zone at the 730 metre level). The Rusk horizon was intersected in July of 2010 and the Porphyry Zone in November 2010.
From 2010 through 2013, 0.86 million tonnes at an average grade of 4.1 grams per tonne (g/t) Au (114,928 ounces) have been milled from the Thunder Creek Deposit.
LSG has prepared an updated Resource Estimate for the TWM which includes mineralized zones from the Timmins and Thunder Creek Deposits. The report updates the TWM Resources as reported by LSG in March 2013. The estimate for the TWM is based on historical diamond drilling dating back to March 1984 and drilling completed by LSG between July 2003 and the date of databases being closed for the current estimate. The database for the Timmins Deposit was closed November 26, 2013 and the database was for Thunder Creek was closed January 8, 2014. A total of 1,158 drill holes (totaling 215,997 metres) were used to estimate resources for the Timmins Deposit, with 670 holes (120,053 metres) used in the Thunder Creek Estimate.
The Timmins West Mine Resource totals 4.36 Mt at 5.09 g/t Au, amounting to 714,633 ounces of gold in the Indicated category and 2.94 Mt at 5.46 g/t Au amounting to 516,339ounces of gold in the Inferred category. Subdivision of the resource into the Timmins Deposit and the Thunder Creek Deposit is shown in Table 1.1.
Resources are centered on 9700E (4425E mine grid) section and extend from 9900 to 8670 elevation (115 to 1,345 metres below surface) for the Timmins Deposit and are centered on 9550N (4675E mine grid) section extending from 9820 to 8980 elevation (190 to 1,040 metres below surface) for the Thunder Creek Deposit. The Mineral Resource for the Timmins Deposit has been modeled into 51
2
sub-zones which refine the broader mineralized Ultramafic, Footwall, and Vein Zones. The Thunder Creek Deposit has been modeled into 18 sub-zones which refine the broader Rusk and Porphyry Zones.
Resources were estimated using Inverse Distance Squared (ID2) grade interpolation with an anisotropic search. All gold assays were capped with capping limits varying between 50 and 90 g/t by zone. A minimum mining width of 2 metres was assumed and only samples within a mineralized zone were used for estimation of the zone. A weighted average gold price of $1,150 per ounce was assumed which compares to the weighted average gold price of $1,500 per ounce used in the March 2013 resource and reserve update.
The mineralized zones defined and used for estimation of resources are focused on material grading 3.0 g/t with lower grade material included for internal continuity. For the purposes of this report, a base case using a cut-off grade of 1.5 g/t Au is reported in order to maintain continuity within each zone.
The in-situ TWM resource using 1.5 g/t and 3.0 g/t in-situ Cut-Off Grades (COG) are summarized in Table 1.1 and Table 1.2.
TABLE 1.1: TWM RESOURCE ESTIMATE AT 1.5 G/T IN-SITU COG
Deposit | | Resource
Classification | | Tonnes | | Capped Grade
(g/t Au) | | Contained Gold
(ounces) | |
Timmins Deposit | | Indicated | | 1,893,497 | | 5.2 | | 314,153 | |
| | Inferred | | 2,075,079 | | 5.7 | | 378,516 | |
| | Subtotal | | 3,968,576 | | 5.4 | | 692,669 | |
| | | | | | | | | |
Thunder Creek Deposit | | Indicated | | 2,470,674 | | 5.0 | | 400,480 | |
| | Inferred | | 863,633 | | 5.0 | | 137,823 | |
| | Subtotal | | 3,334,307 | | 5.0 | | 538,303 | |
| | | | | | | | | |
Total TWM | | Indicated | | 4,364,171 | | 5.1 | | 714,633 | |
| | Inferred | | 2,938,712 | | 5.5 | | 516,339 | |
| | Total | | 7,302,883 | | 5.2 | | 1,230,972 | |
Notes:
1. Sums may not add due to rounding.
2. CIM definitions were followed for classification of Mineral Resources.
3. Capped gold grades are used in estimating the Mineral Resource average grade.
4. A minimum mining width of 2 metres was used.
5. The estimate includes low grade material which is not in the current mine plan.
6. Mineral Resources are reported at a cut-off grade of 1.5 g/t and include internal dilution to maintain zone continuity.
7. Weighted average gold price was assumed at $1,150 per ounce (approximately US$1,100).
8. Metallurgical recoveries are assumed to average 96.5 percent.
3
TABLE 1.2: TWM RESOURCE ESTIMATES AT 3.0 G/T IN-SITU COG
Deposit | | Resource
Classification | | Tonnes | | Capped Grade
(g/t Au) | | Contained Gold
(ounces) | |
Timmins Deposit | | Indicated | | 1,242,932 | | 6.7 | | 267,417 | |
| | Inferred | | 1,475,976 | | 7.1 | | 335,427 | |
| | Subtotal | | 2,718,908 | | 6.9 | | 602,844 | |
| | | | | | | | | |
Thunder Creek Deposit | | Indicated | | 1,641,057 | | 6.5 | | 341,326 | |
| | Inferred | | 597,382 | | 6.2 | | 118,967 | |
| | Subtotal | | 2,238,439 | | 6.4 | | 460,293 | |
| | | | | | | | | |
Total TWM | | Indicated | | 2,883,989 | | 6.6 | | 608,743 | |
| | Inferred | | 2,073,358 | | 6.8 | | 454,394 | |
| | Total | | 4,957,347 | | 6.7 | | 1,063,137 | |
Notes:
1. Sums may not add due to rounding.
2. �� CIM definitions were followed for classification of Mineral Resources.
3. Capped gold grades are used in estimating the Mineral Resource average grade.
4. A minimum mining width of 2 metres was used.
5. The estimate includes low grade material which is not in the current mine plan.
6. Weighted average gold price was assumed at $1,150 per ounce (approximately US$1,100).
7. Metallurgical recoveries are assumed to average 96.5 percent.
The drilling, development and mining completed since the last resource/reserve update in March 2013, indicates a significant decrease in resource and reserve ounces. The decrease results from a number of factors including mining depletion, a lack of new exploration drilling over the past two years, and a reduction in the assumed average weighted gold price ($1,150 per ounce versus $1,500 per ounce in the March 2013 update). The decrease also reflects the results of extensive definition drilling which have indicated lower grades and changes in the interpretation in the geology in some areas. The effect of the lower grades is changes to resource shapes and the removal of certain low grade sections of the new models. The estimate also reflects the removal of zones from the resource model which are considered unmineable or uneconomic as well as the use of more conservative projection of grades, especially near zone boundaries.
Subsequent to the closing of the Timmins Mine and Thunder Creek databases, additional drilling was completed. This drilling is not likely to have a significant effect on the overall resource reported.
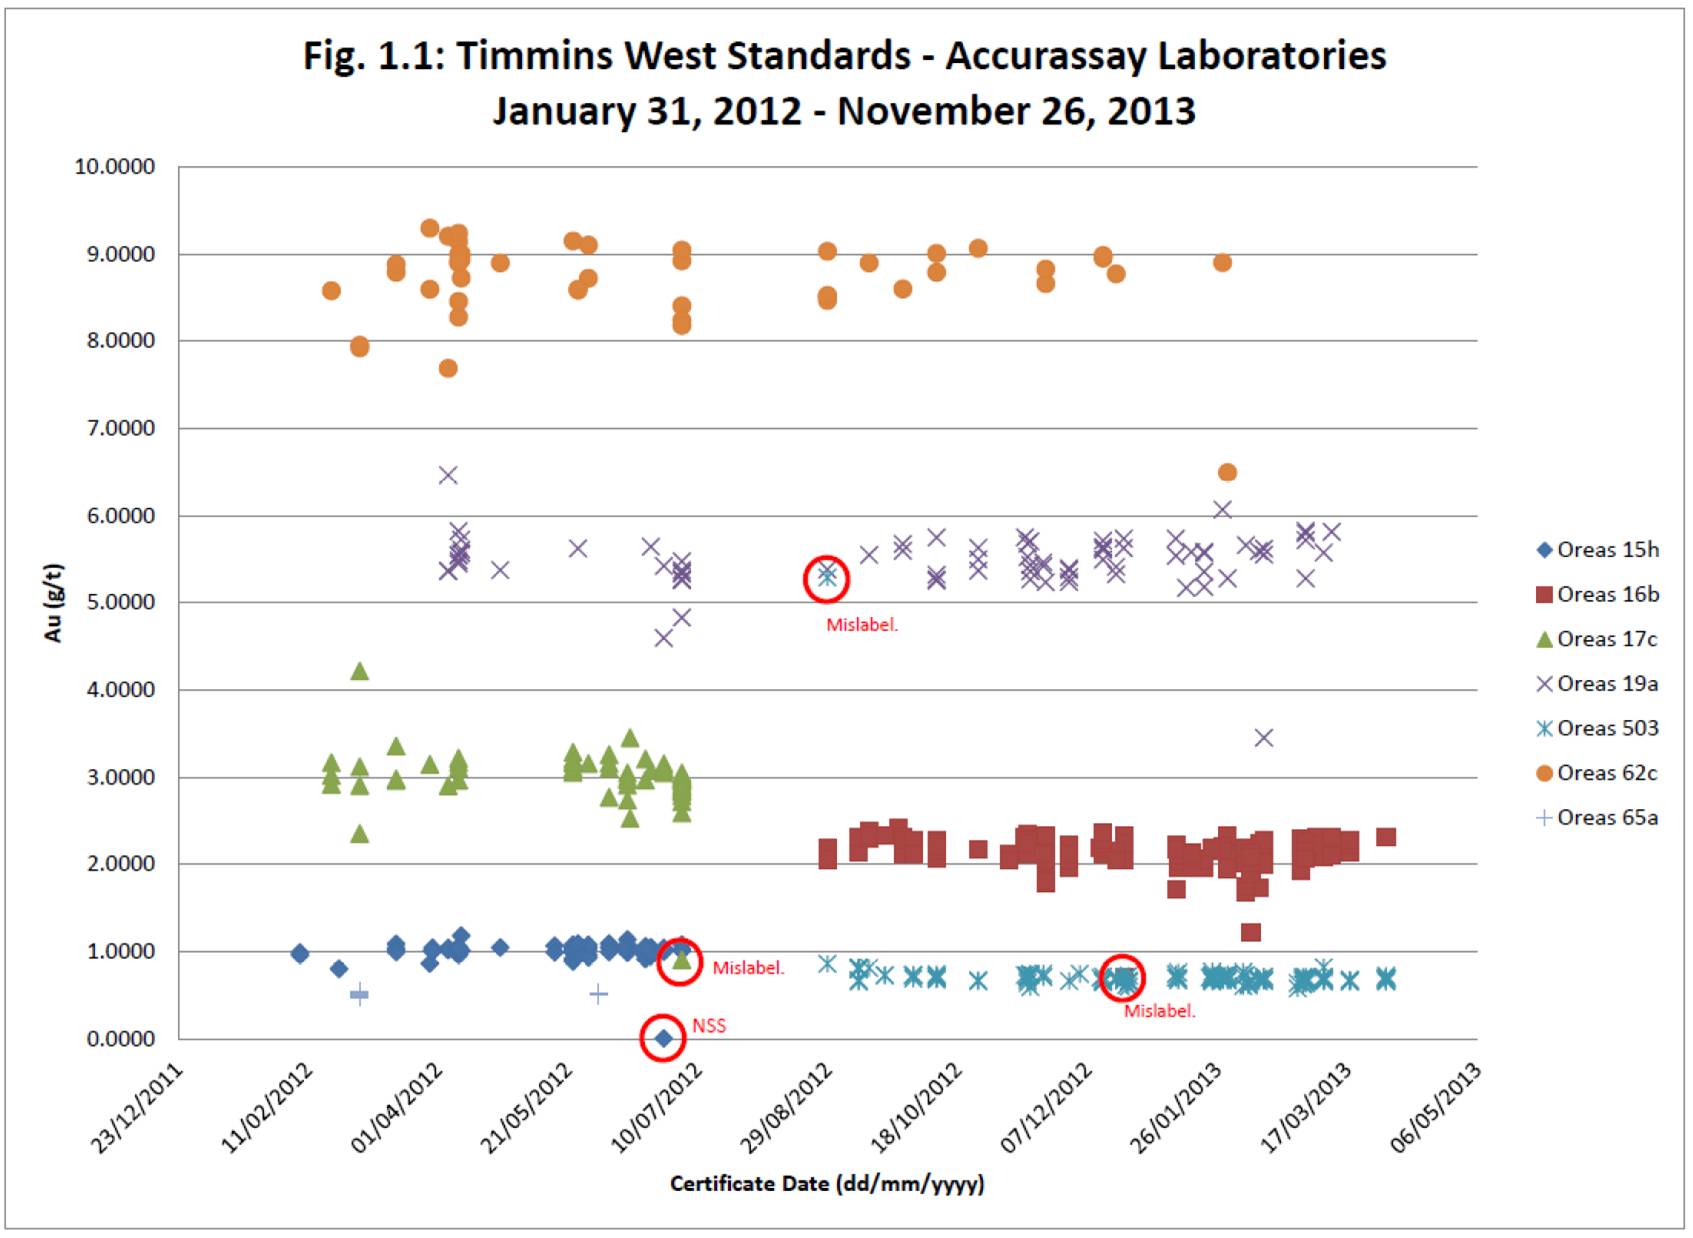
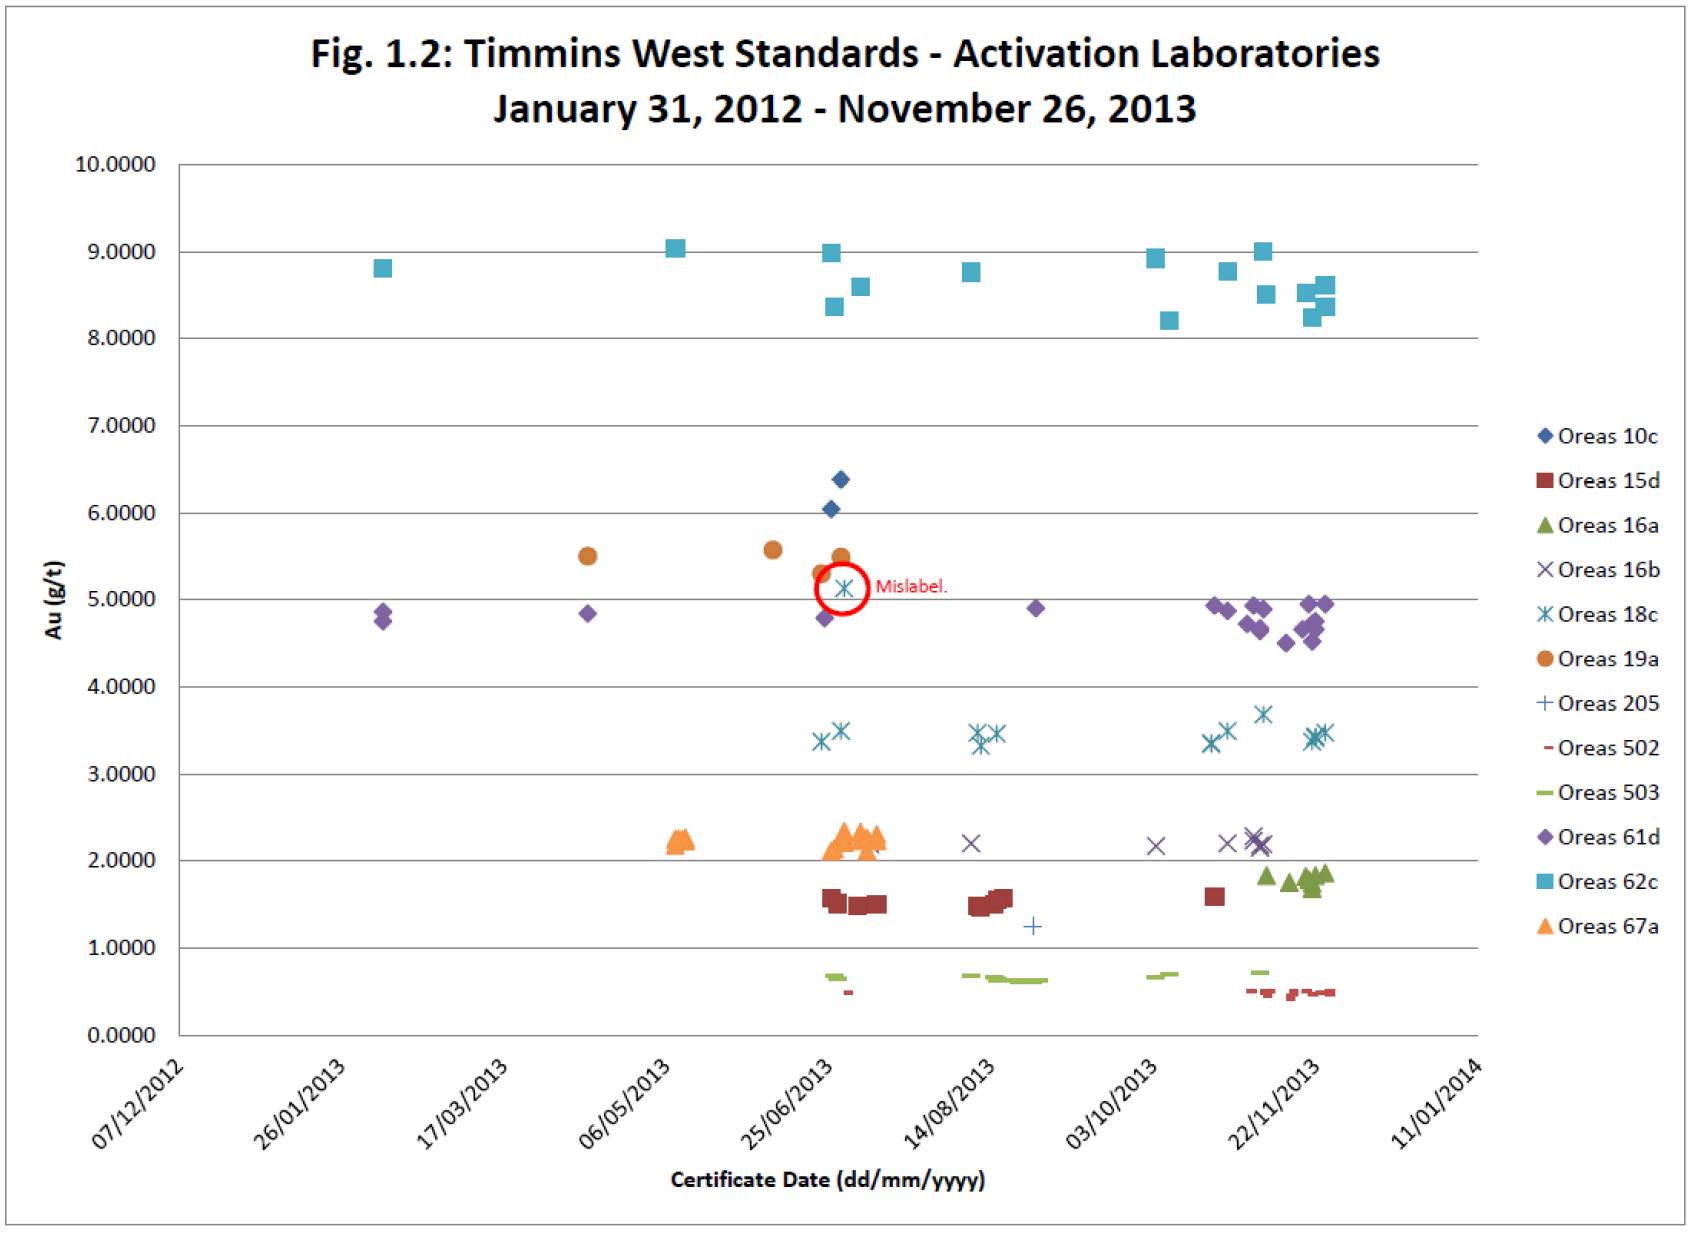
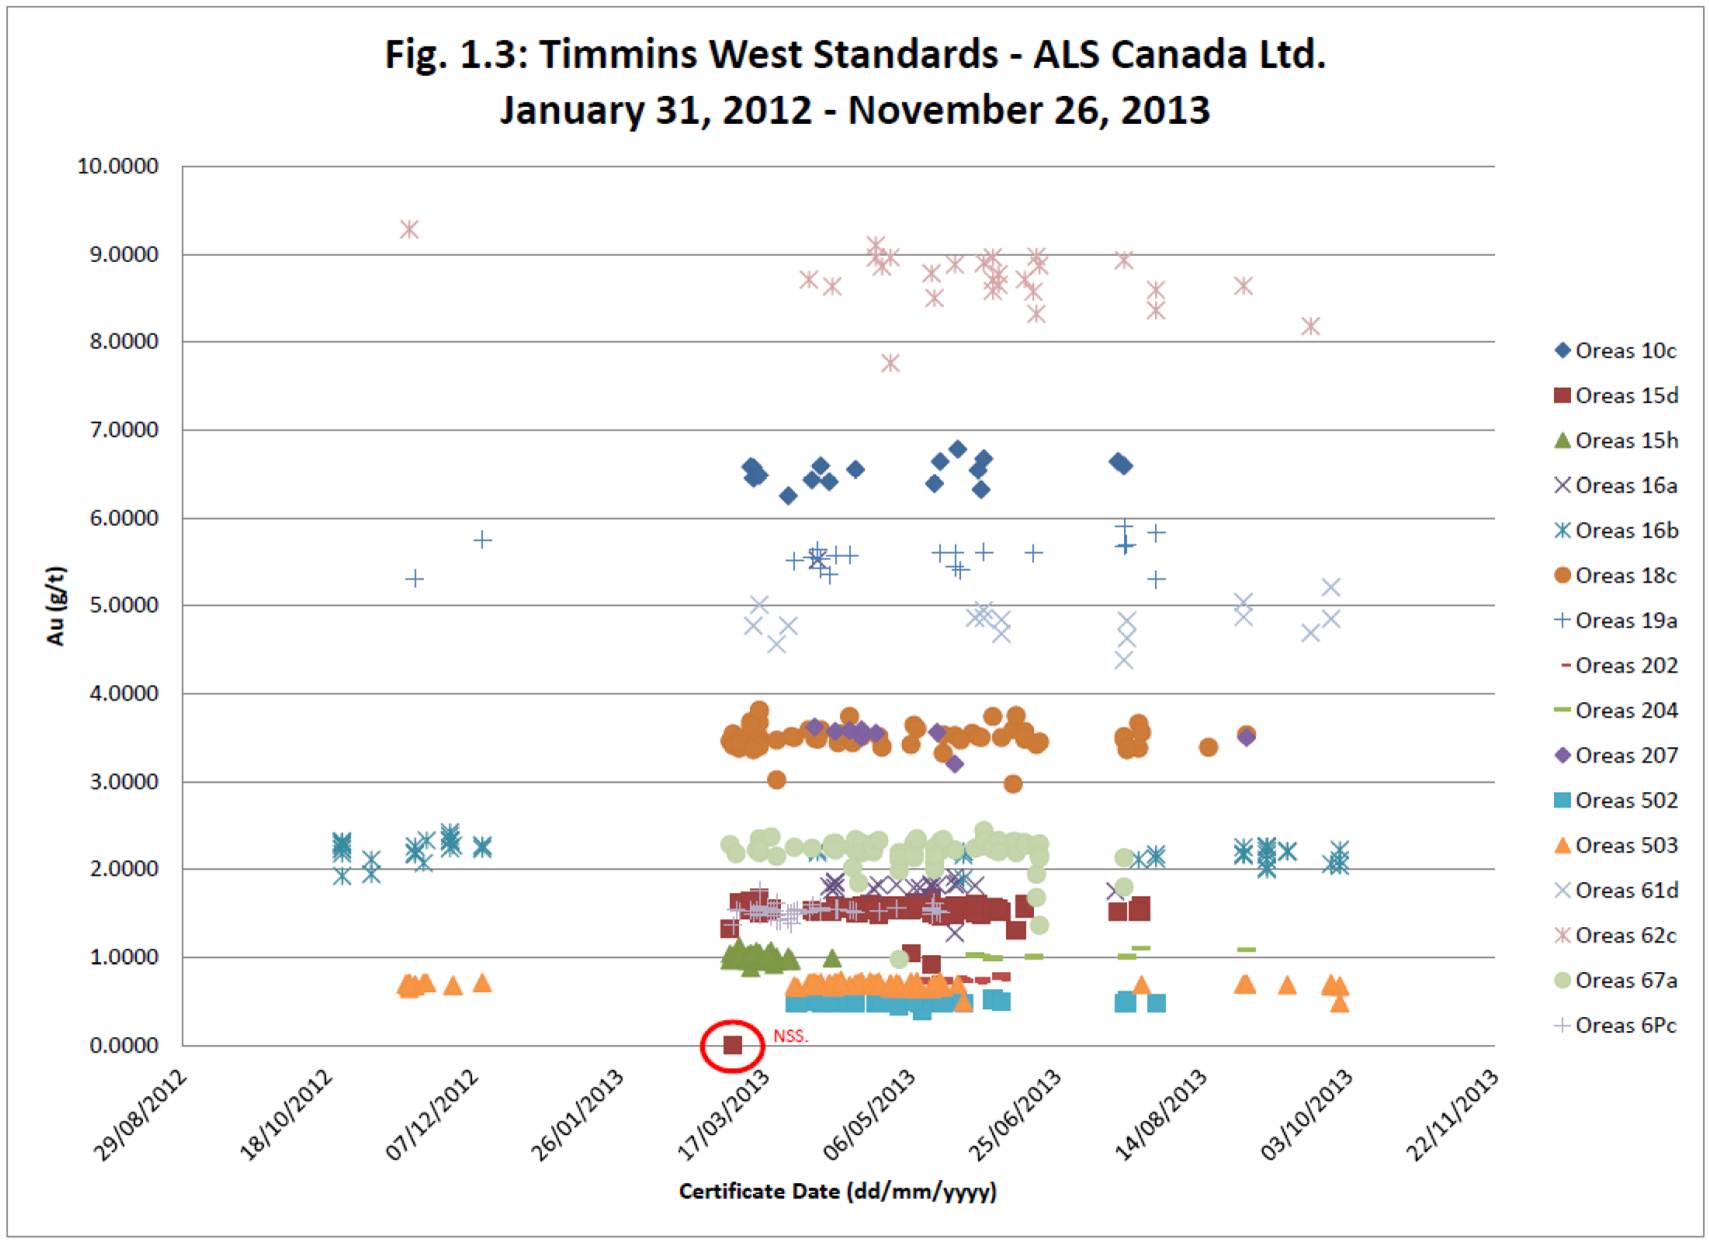
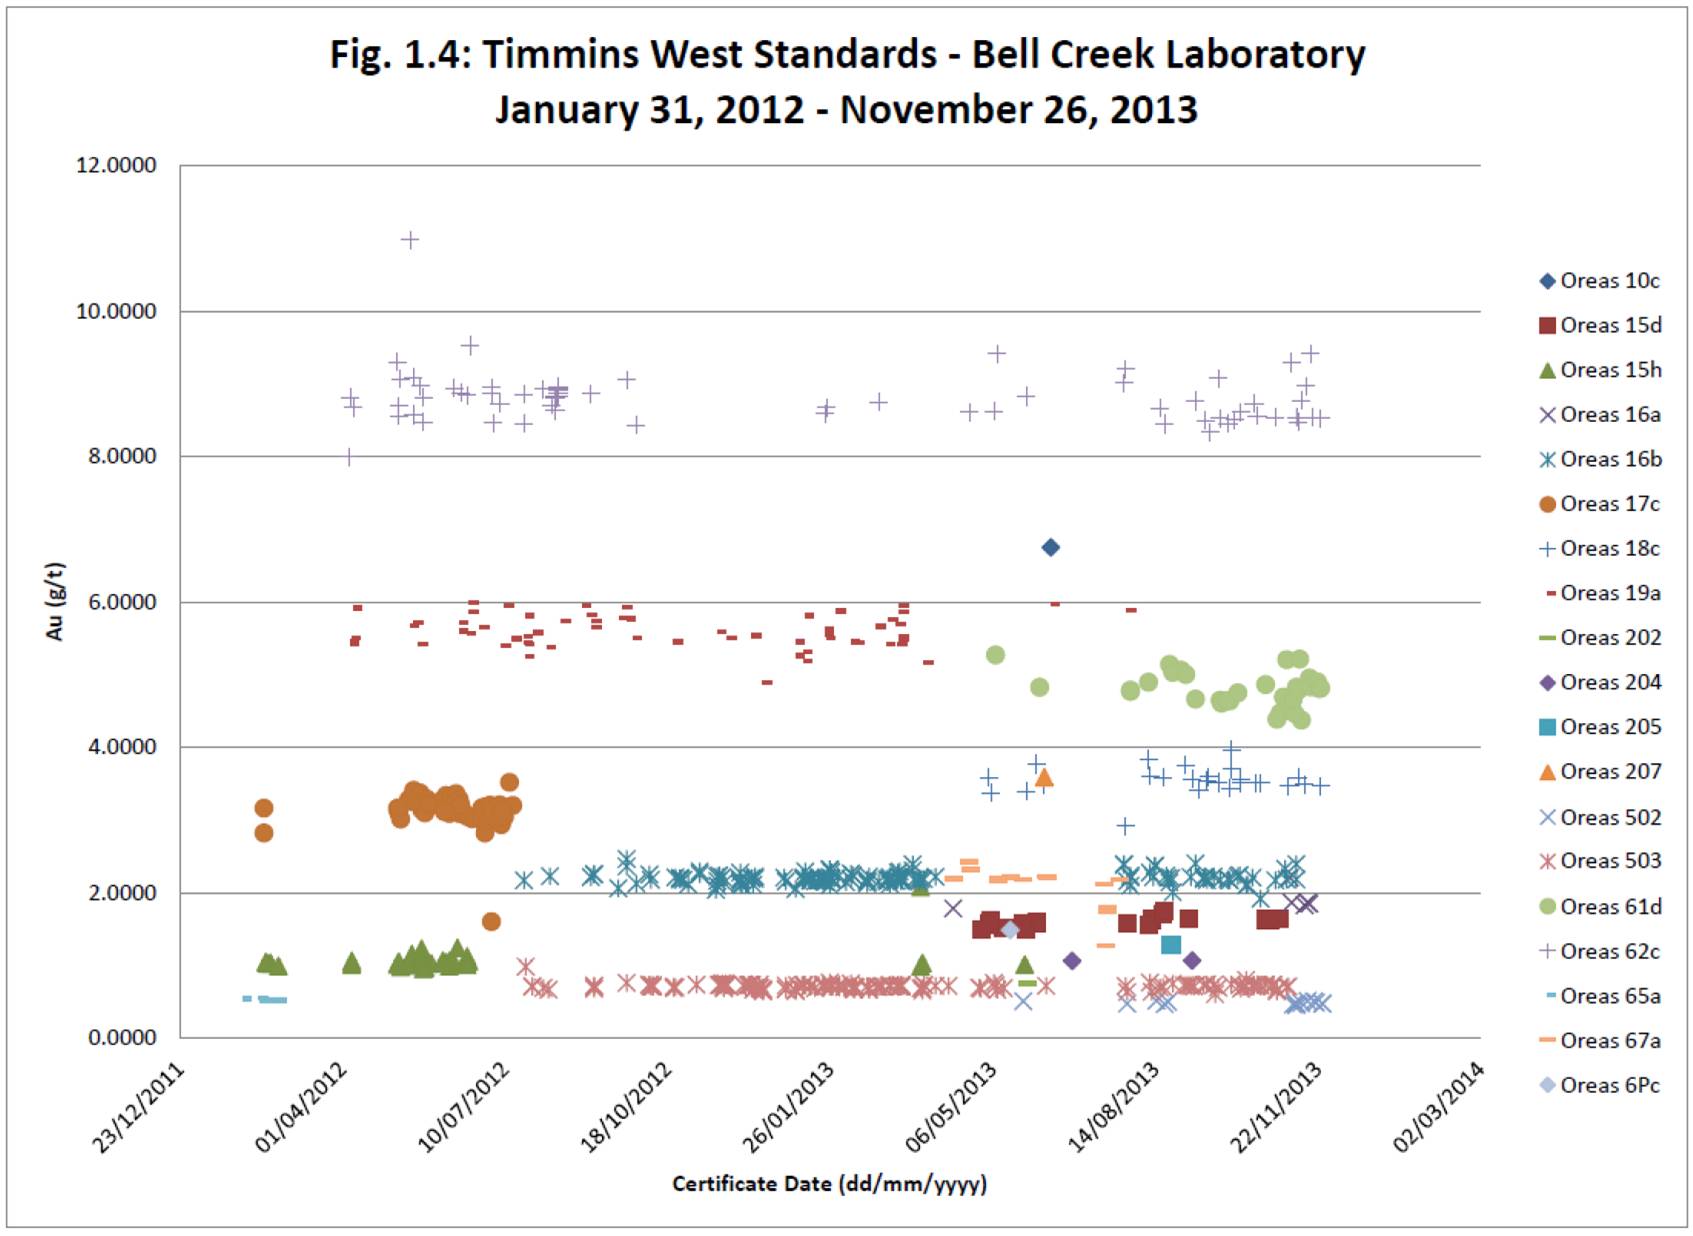
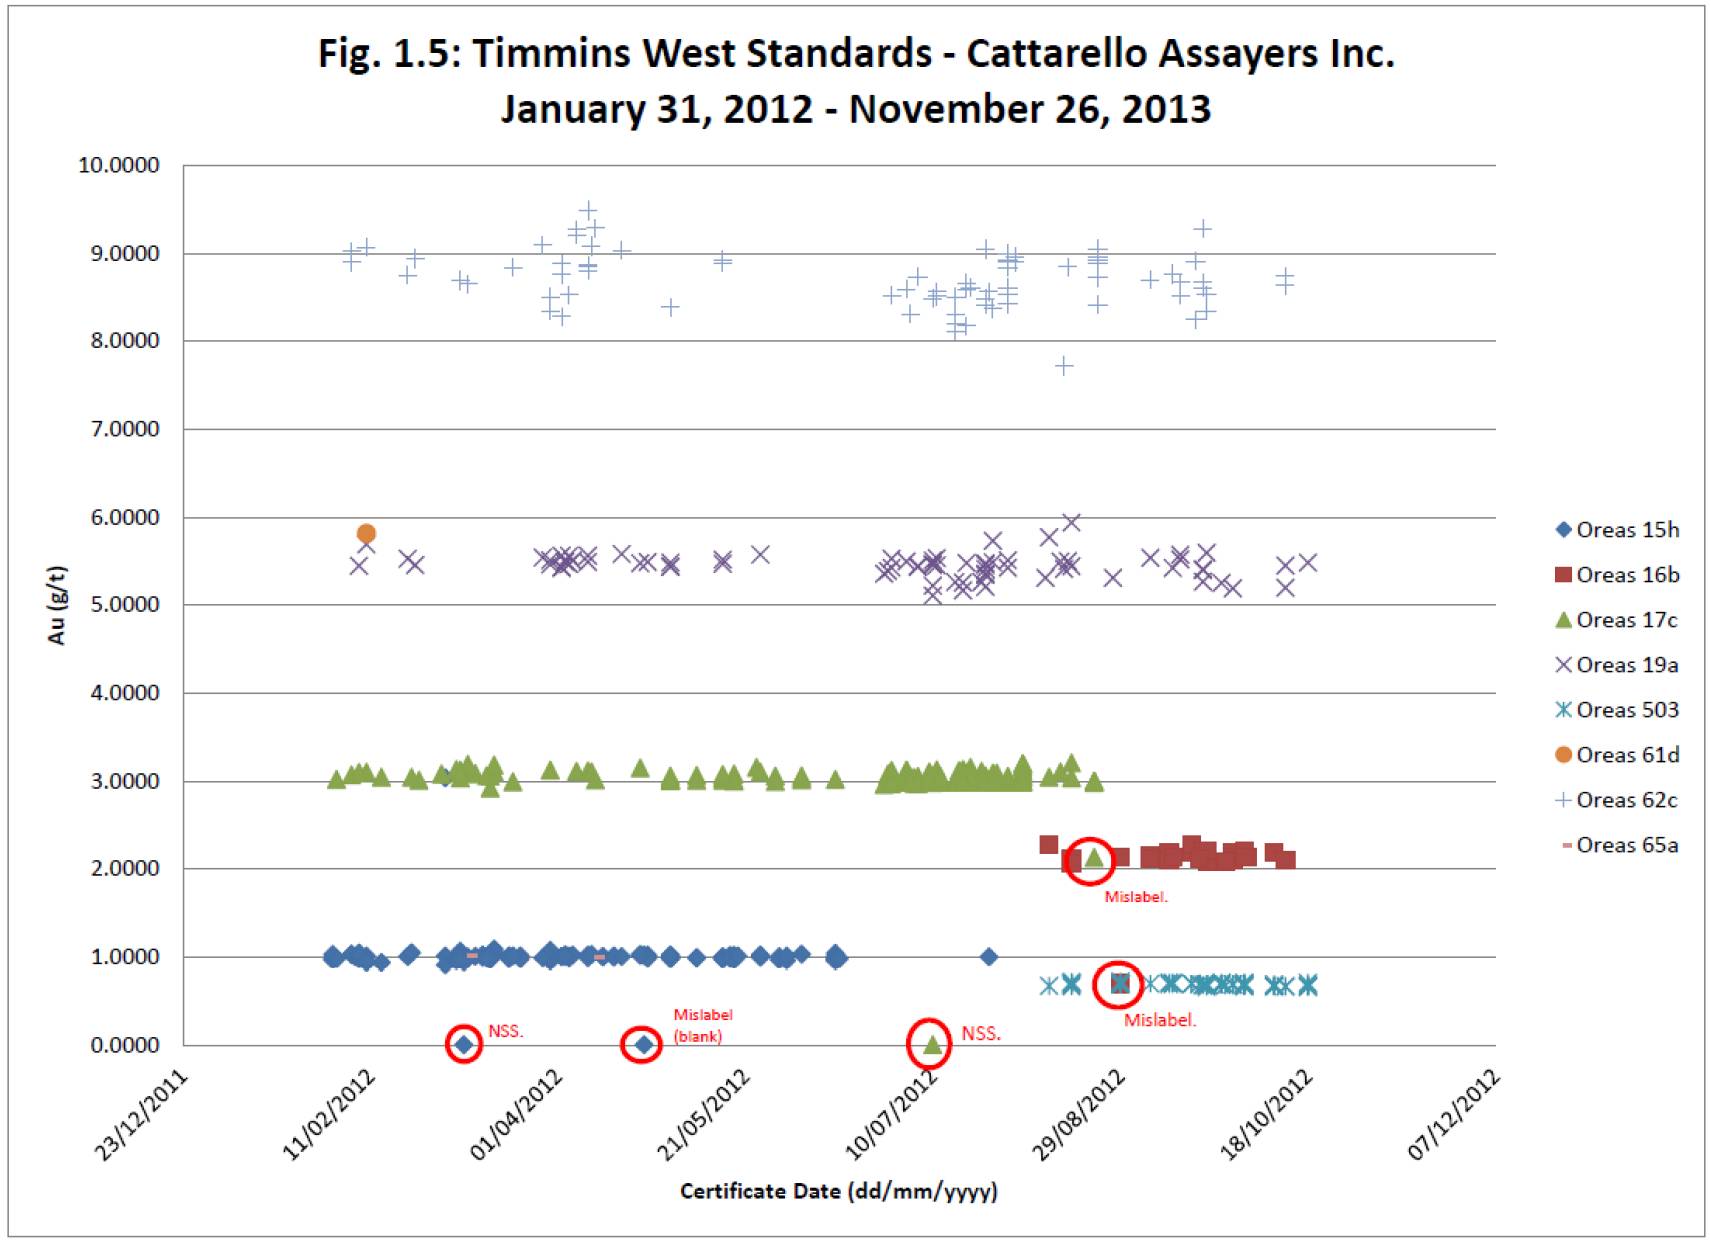
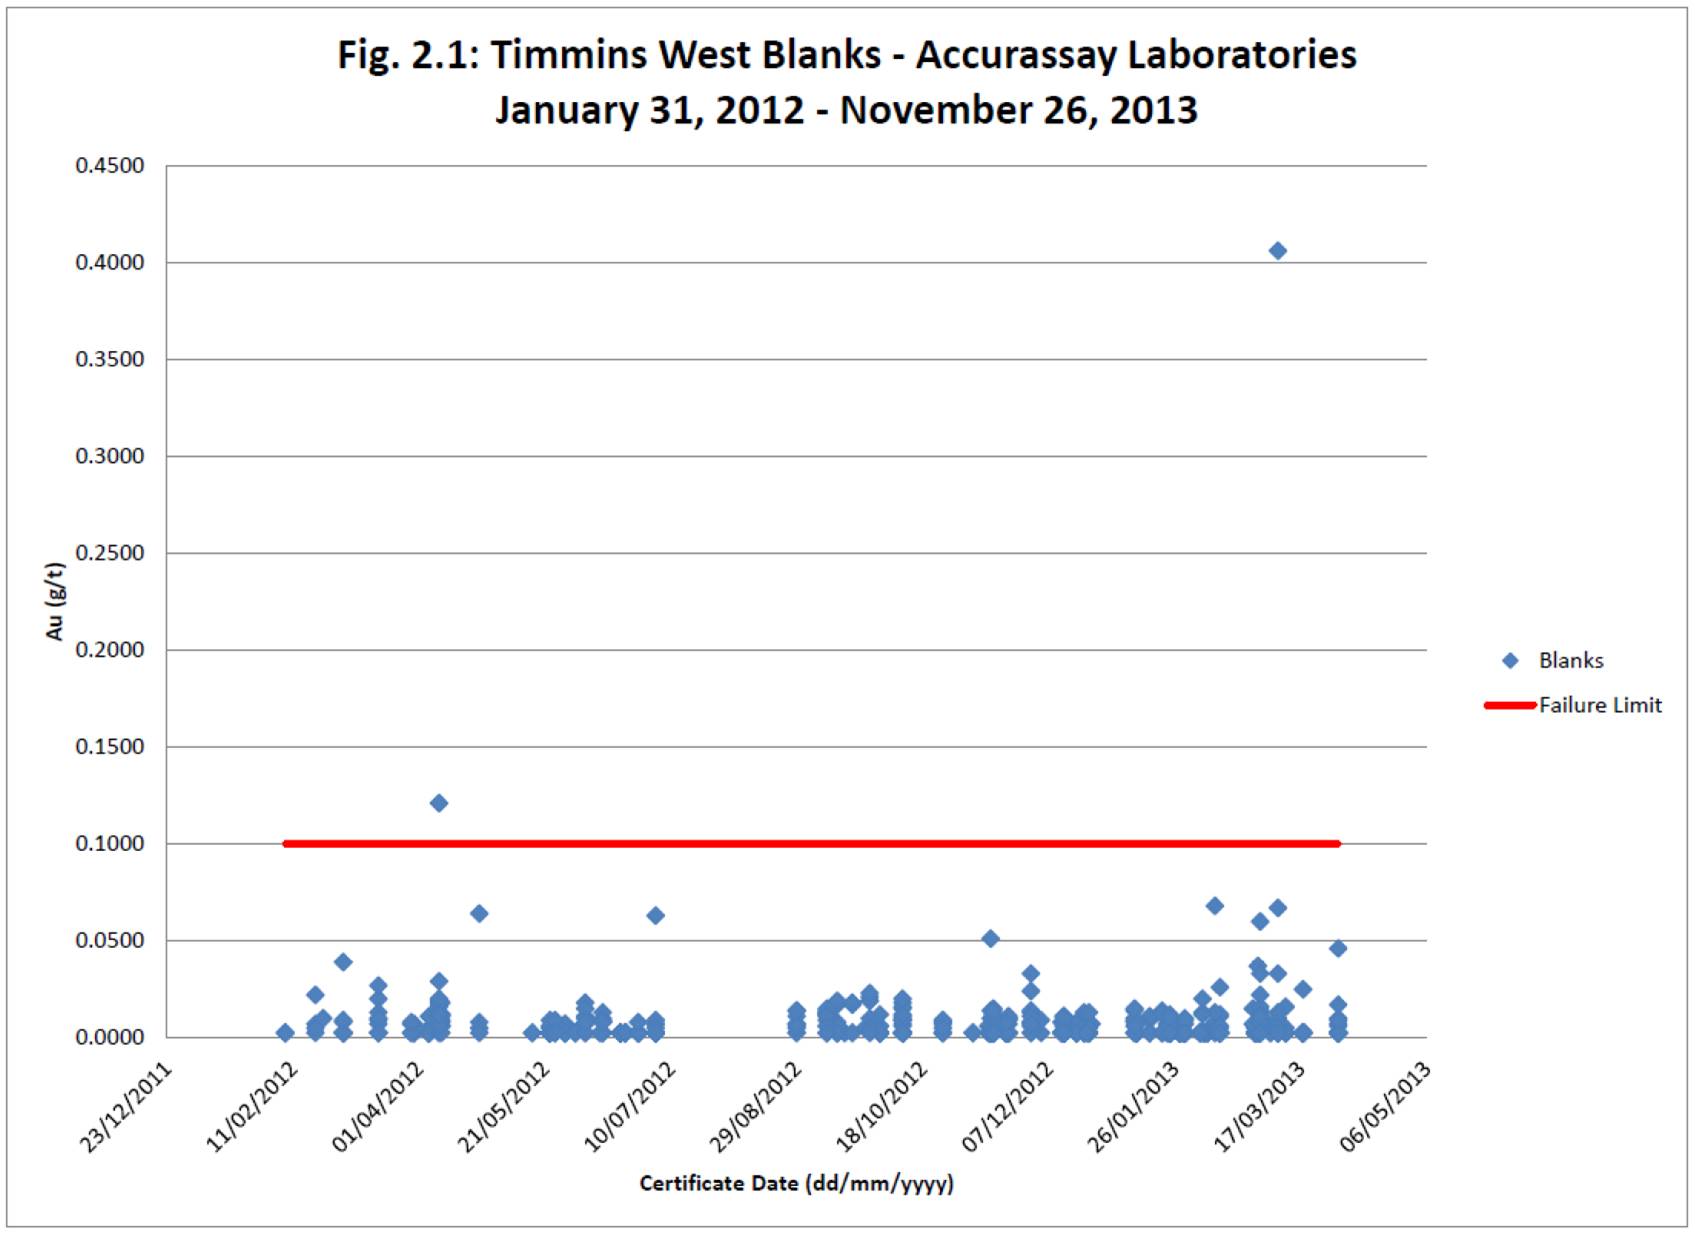
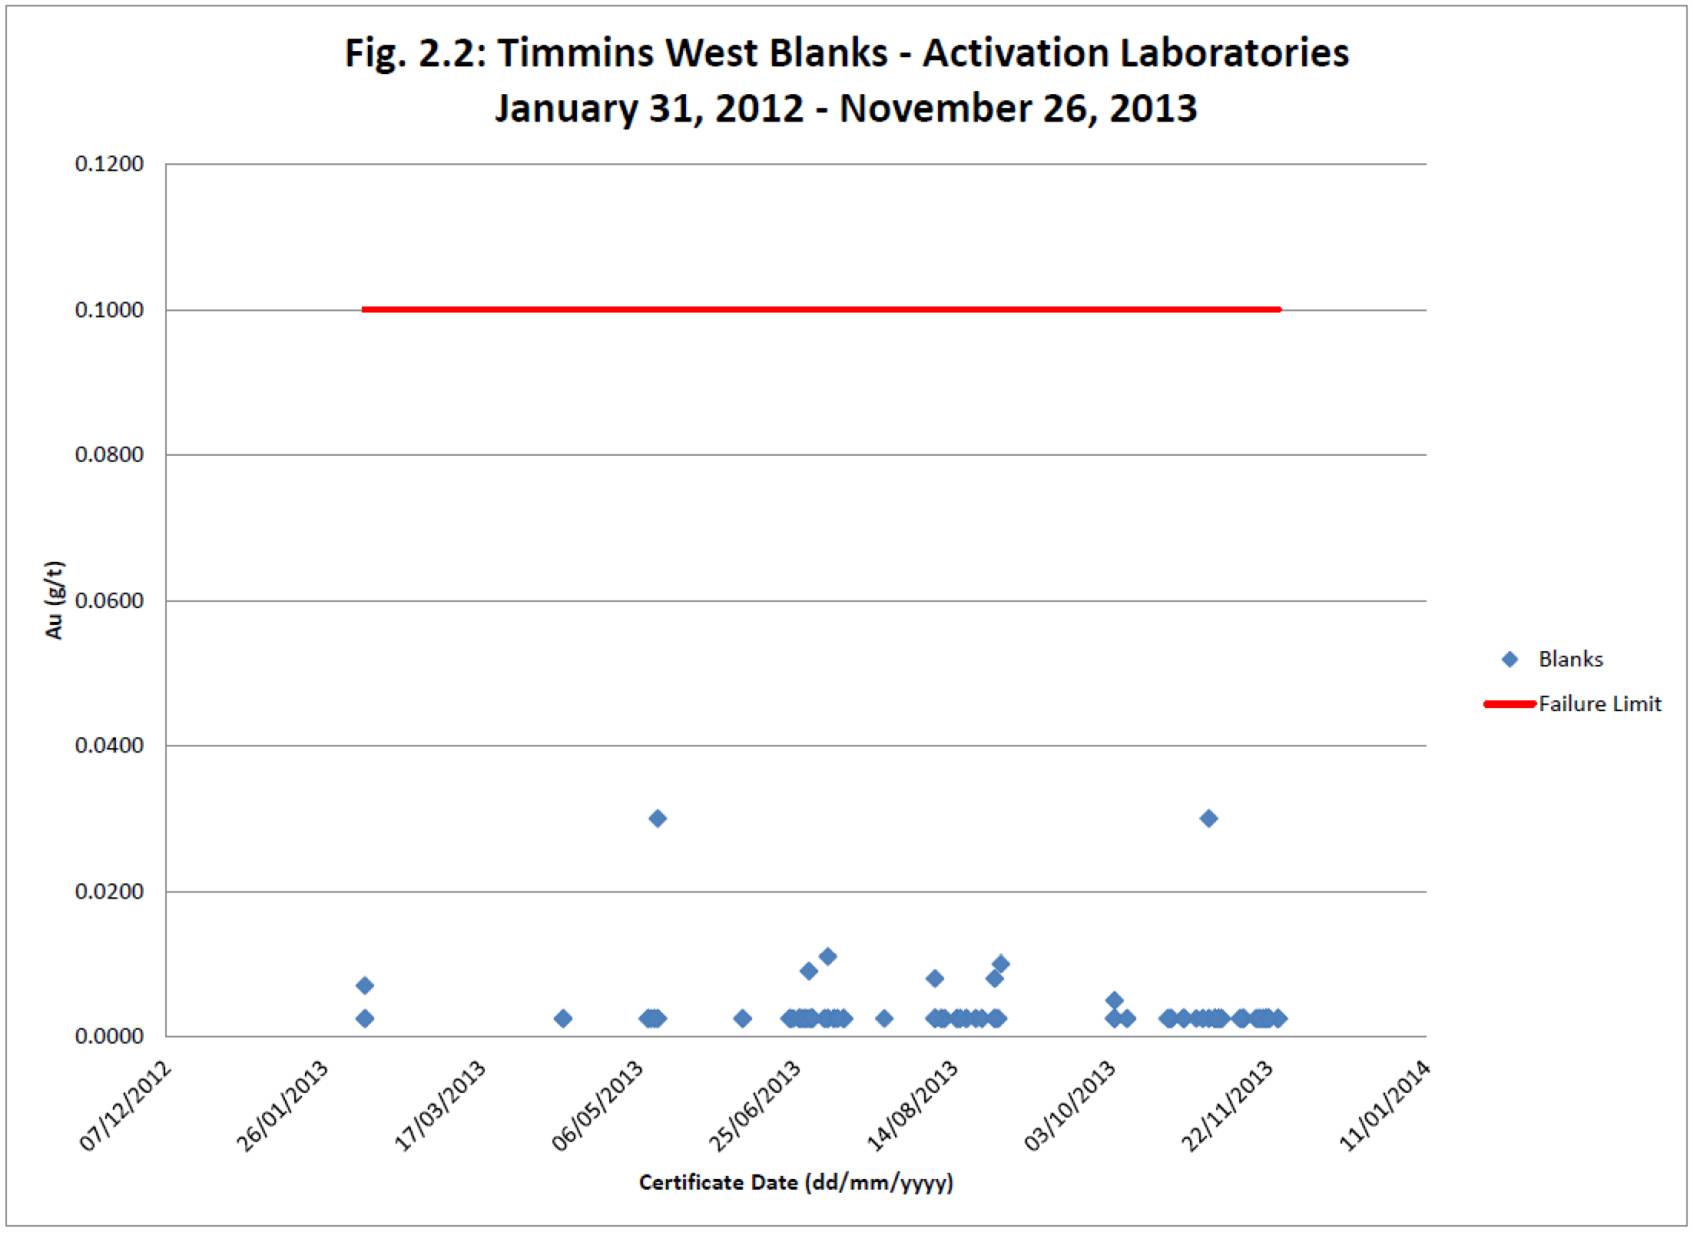
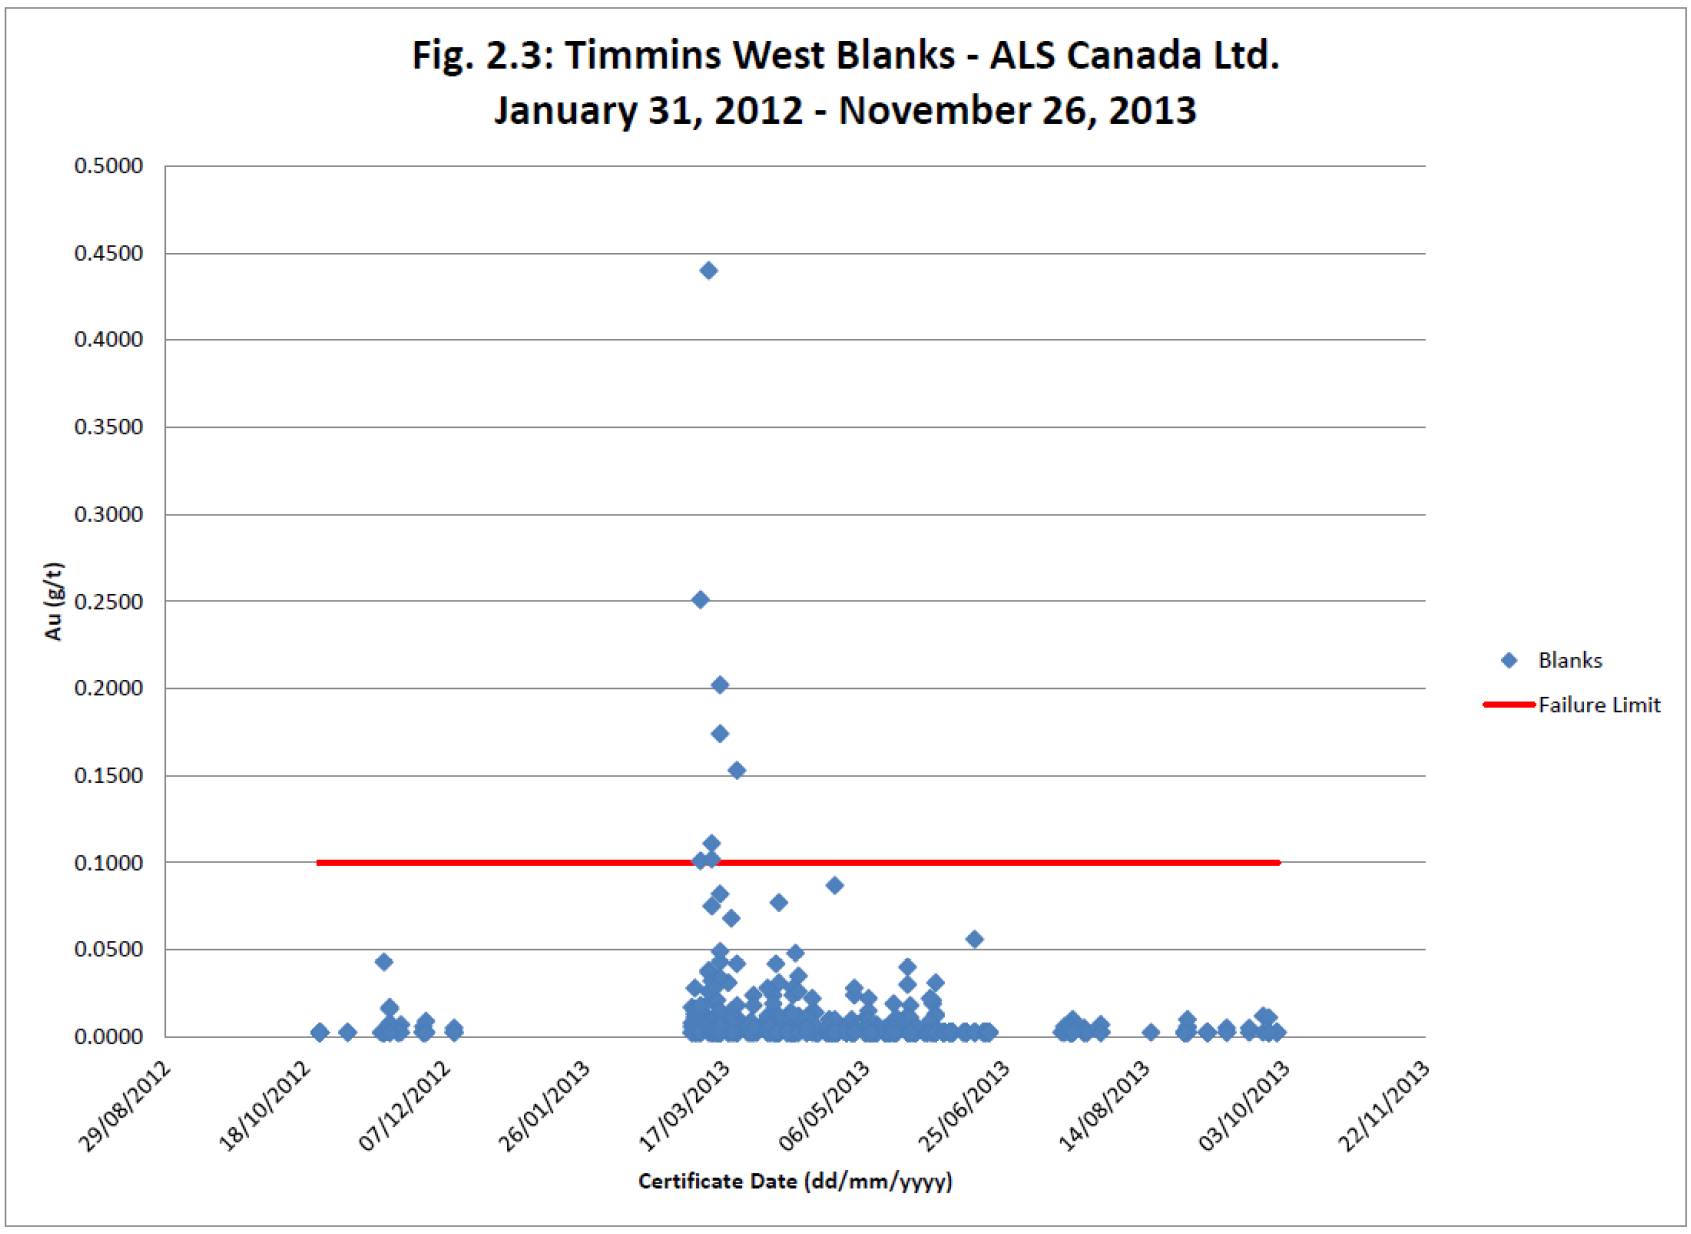
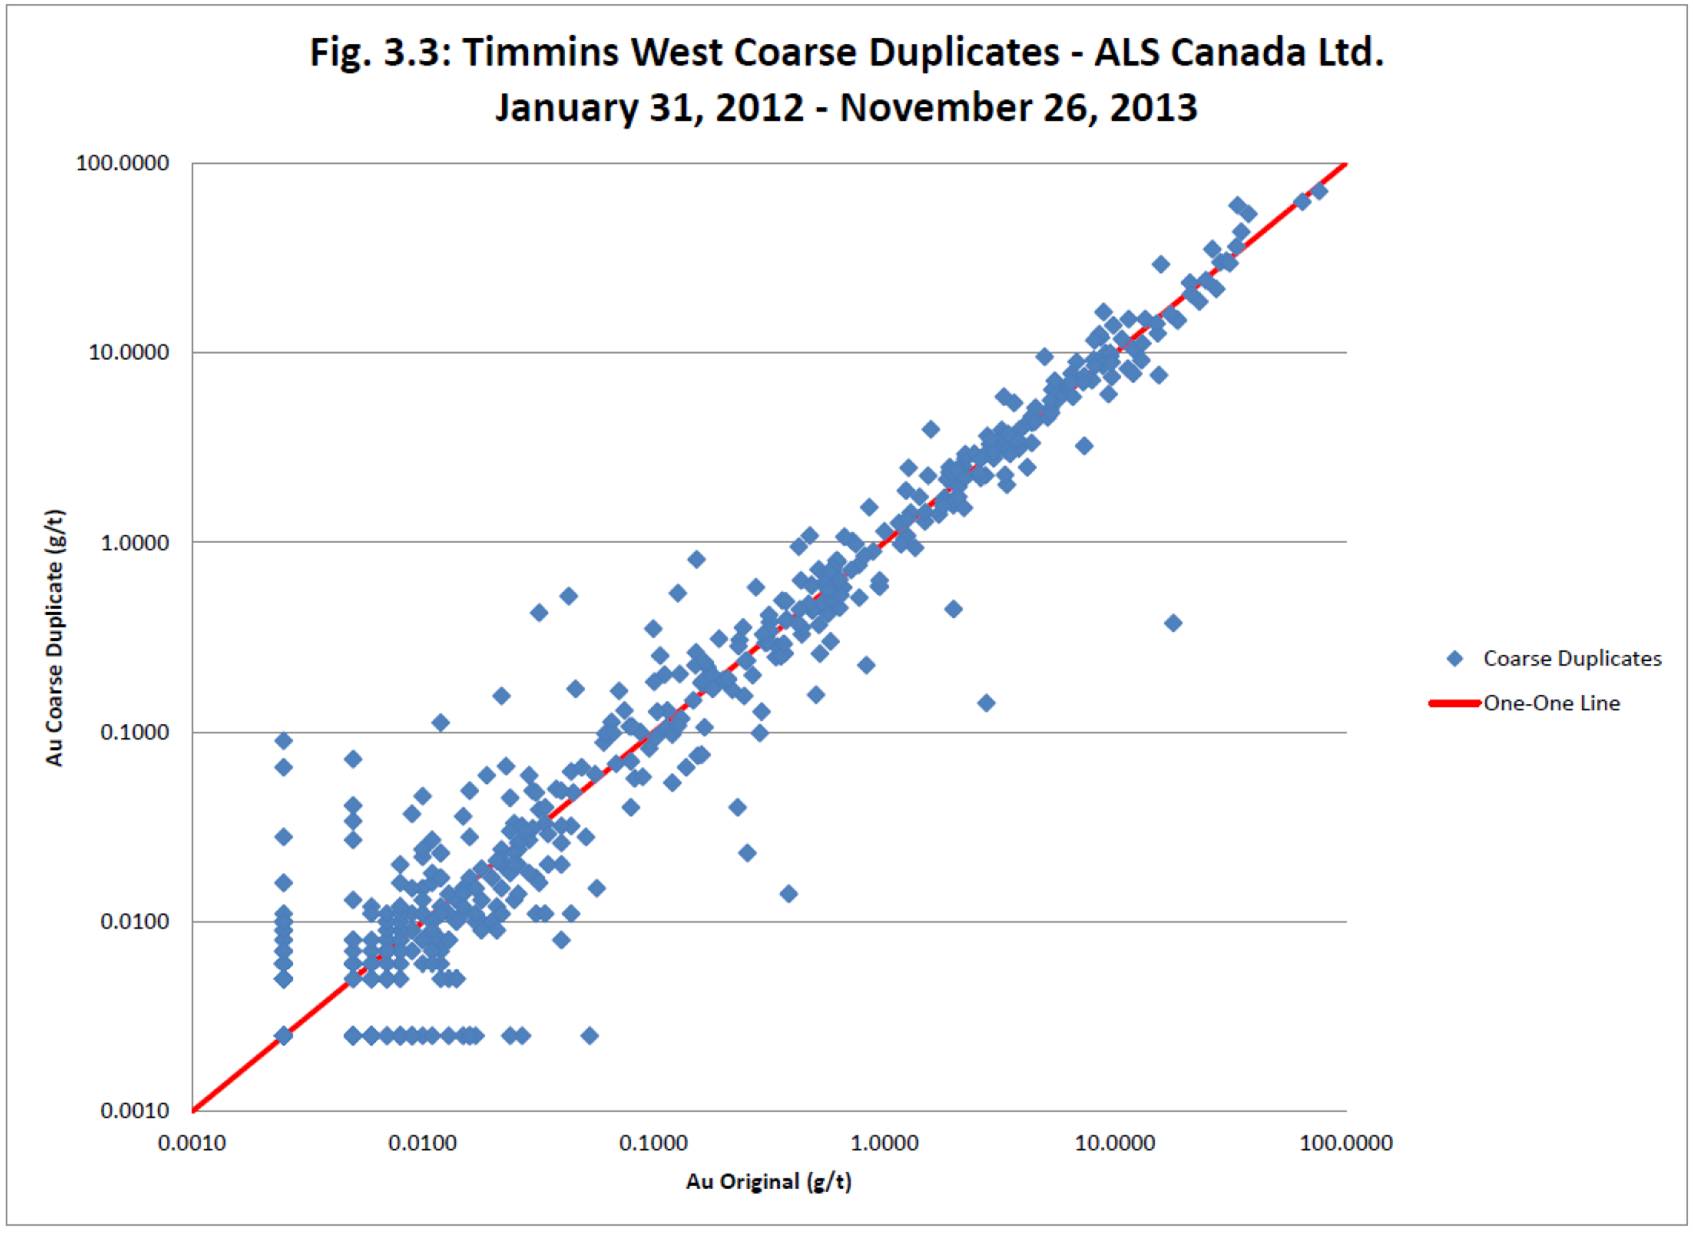
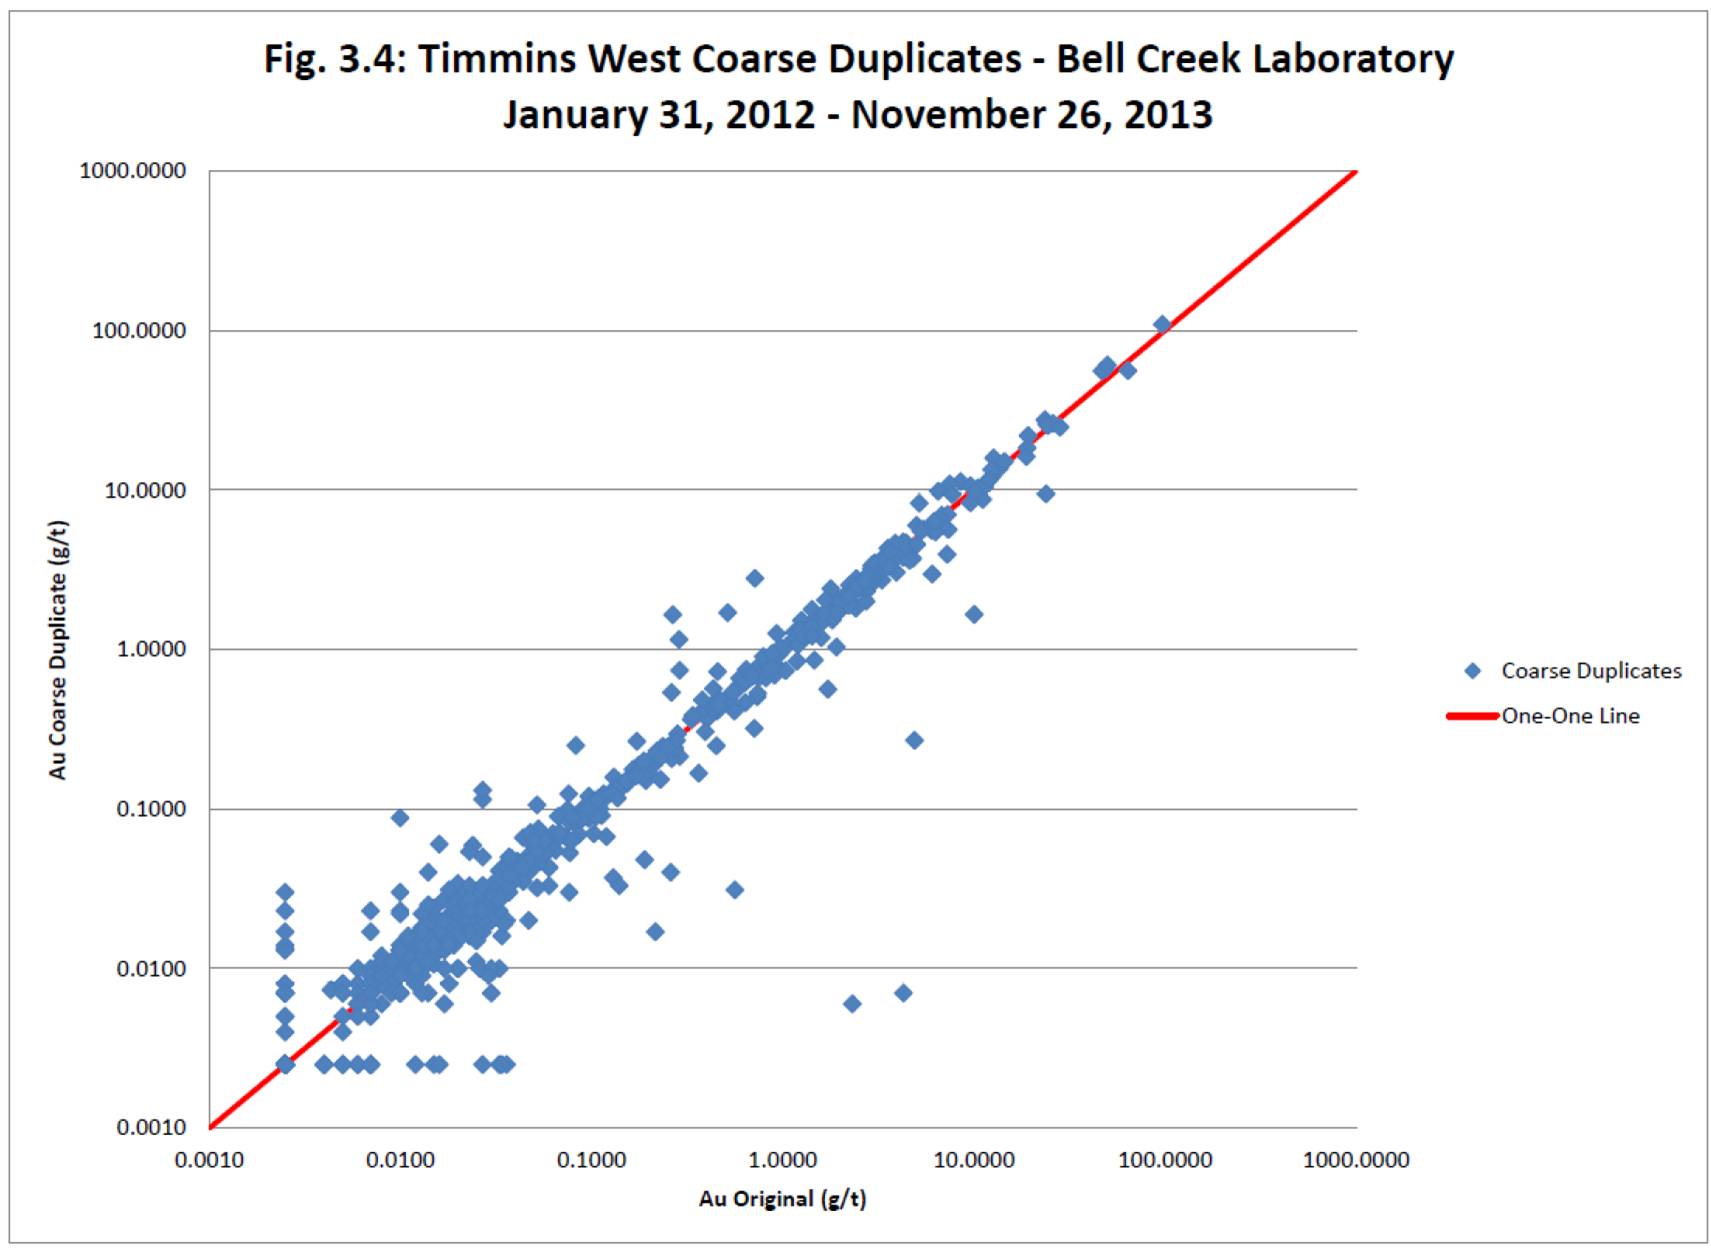
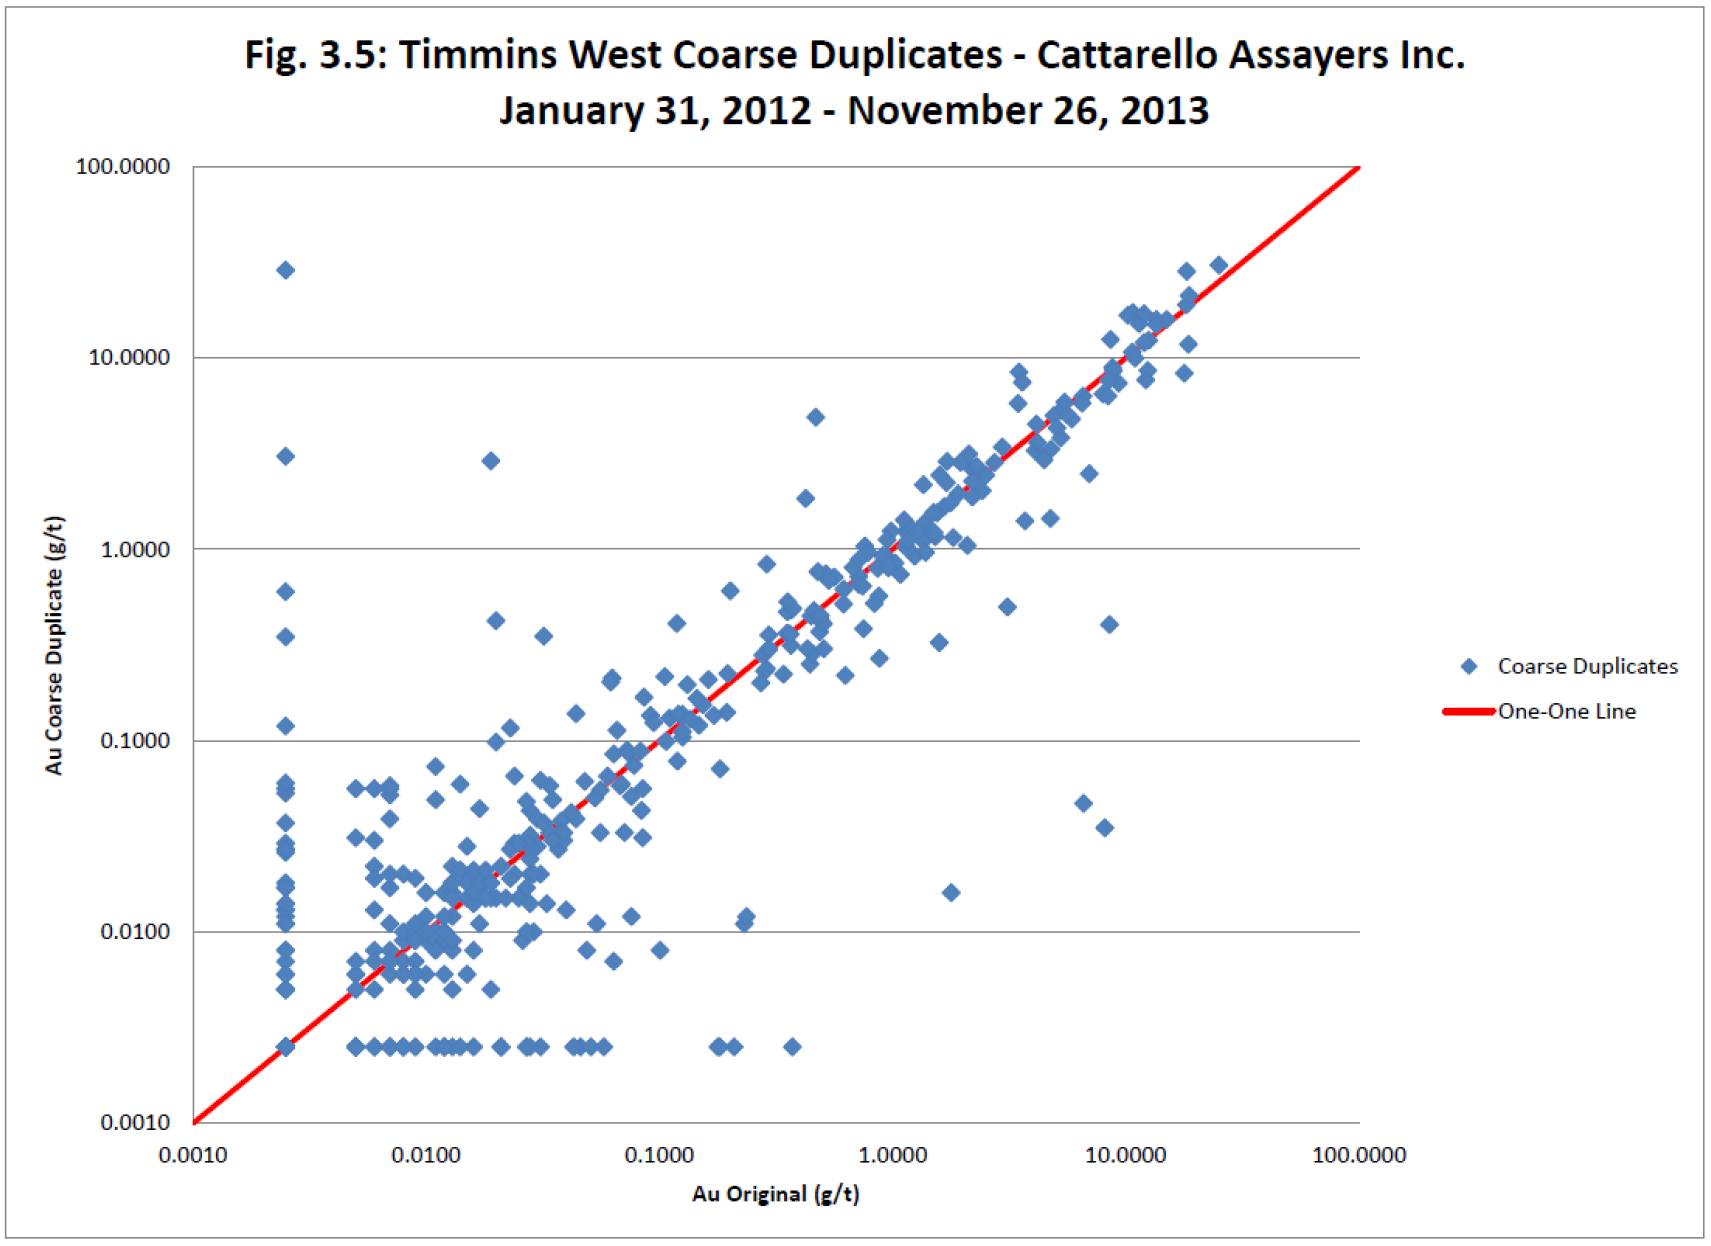
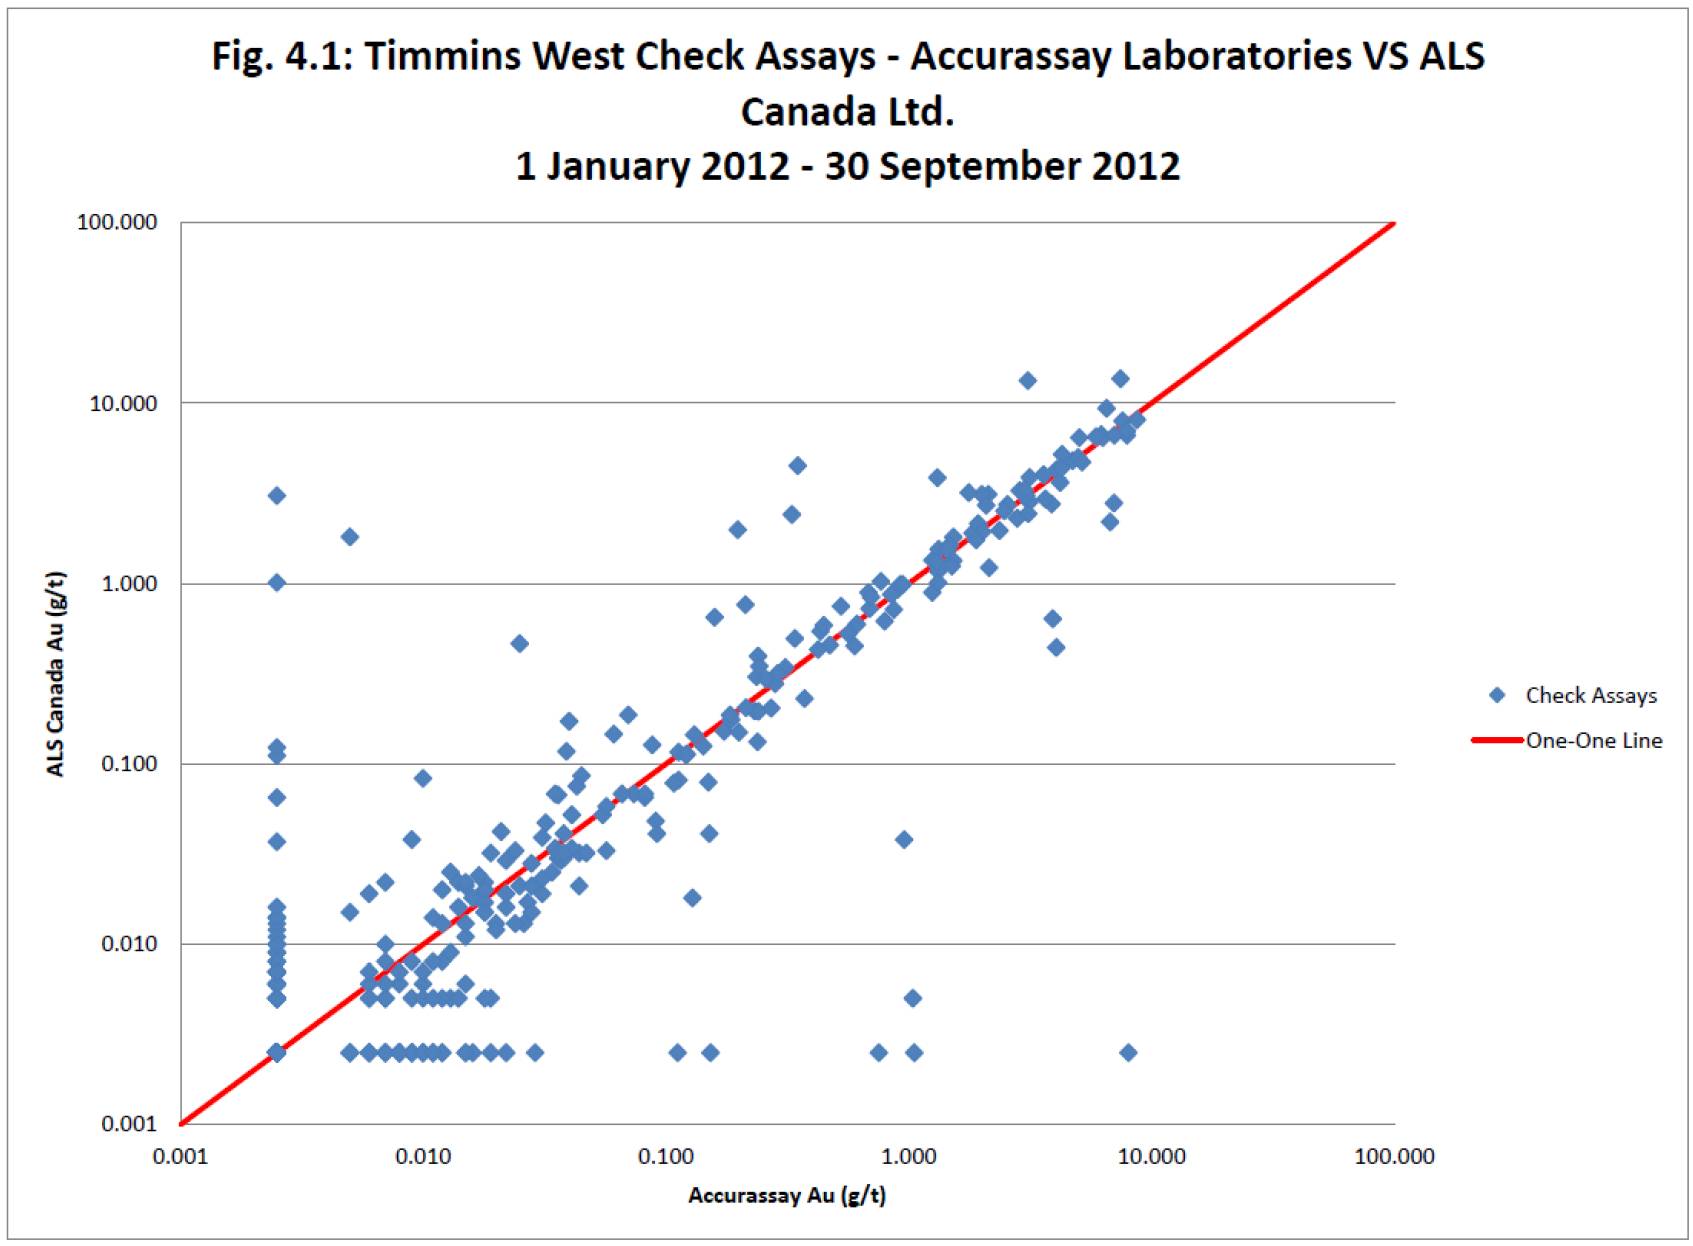
A review of the QA/QC samples routinely introduced into the drill hole sample stream, has concluded that the quality of the assaying introduced into the block model is satisfactory demonstrating no significant bias and adequate precision and reproducibility.
Several steps were taken in order to review and validate the current block model and reported results which included: comparison of solid model and block model volumes, comparison of the block model against diamond drill results, checking with nearest neighbor estimates, and comparison with recent production data.
4
Volumes of the individual solids were compared to volumes from the block model for the same domain to ensure proper coding of the model. No significant variances were encountered. Plans and sections were cut through the block model and Resource solids to view overall trends and patterns as well as compare block grades and grade distribution to the drill-hole data. Results of the review indicate a pattern for block grades which is consistent with drill hole assays but more patchy than was evident in previous block models which were based on wider spaced drilling.
A review of the resource model was also carried out by SGS Canada and no issues were identified with the resource estimation.
Sensitivities to cut-off were run at 0.50 g/t increments of gold grade from 0.00 g/t to 7.00 g/t and are summarized for unclassified resources. At the higher cut-offs, the zones become patchy and less continuous, which implies a bulk mining method could be the best approach for ore extraction. The base case resource stated at a cut-off grade of 1.5 g/t attempts to introduce some level of selectivity to the mining of the resource, yet maintains continuity of the zone. Recent work indicates that the sensitivity to cut-off grade varies between zones.
All ore mined from TWM has been, and will continue to be processed at LSG’s Bell Creek Mill. The Bell Creek Mill is located approximately 6.5 kilometres north of Highway 101 in South Porcupine, Ontario. TWM ore is loaded into surface haul trucks at TWM and hauled to the mill (approximately 56 kilometres one-way). The Bell Creek Mill is a conventional gold processing plant utilizing cyanidation with gravity and CIP recovery. Mill throughput is over 3,000 tonnes per day and recovery is approximately 96% for TWM ore.
Previous technical reports issued for the TWM (combined Timmins Deposit and Thunder Creek Deposit) include a preliminary economic assessment (PEA) completed in March 2012, “43-101 Technical Report, Preliminary Economic Assessment and Updated Mineral Resource Estimate for Timmins West Mine Timmins, Ontario, Canada, prepared by Dean Crick, (P. Geo.), Ralph Kock (P. Geo.), Robert Kusins (P. Geo.), Brian Buss (P. Eng.) and David Powers (P. Geo.) on behalf of Lake Shore Gold Corp., March 29, 2012”, and a pre-feasibility study (PFS) completed in May 2012, “43-101 Technical Report, Pre-feasibility Study and Mineral Reserve Estimate for Timmins West Mine, Timmins, Ontario, Canada, prepared by Dean Crick (P. Geo.), Ralph Koch (P. Geo.), Robert Kusins (P. Geo.), David Powers (P. Geo.), Brian Buss (P. Eng.) May 14, 2012”. The mine design used for the updated reserve estimate has been based on concepts presented in the PFS, existing surface and underground infrastructure, and operating experience gained since commercial production commenced in 2011. The majority of the main mine infrastructure (surface and underground) is in place, most equipment has been purchased, and the Bell Creek Mill expansion project has been completed to meet current production requirements. TWM successfully uses the longhole mining method which is commonly used worldwide for deposits with similar geometry and conditions. The operation also uses common, proven mining equipment and has experienced management and mine operations personnel. The Timmins area has a significant, well-established mining service/supply industry to support the operation.
Through three years of operating experience, TWM has implemented the systems and programs (i.e. health and safety, environment, training, maintenance, operating procedures, etc.) necessary to sustain production. This experience has also provided a solid basis for estimating the capital and operating costs used in preparation of the LOM plan.
5
To estimate the reserves, the following steps (summarized at a high level) were used by mine planning personnel. The indicated resources were isolated (from Inferred material) from the resource models and assessments were made of the geometry and continuity of each of the mineralized zones. Geotechnical evaluations completed over the last three years were taken into account in the assessment and assignment of appropriate mining methods and stope sizes. Individual stope designs (wireframes) were then created in three dimensions. These stope wireframes were queried against the block models to determine the in-situ resource. This allowed for fair inclusion of internal dilution from both low grade and barren material. Additional factors were assigned for external dilution (with or without grade) dependent on the specific mining method and geometry of each stoping unit being evaluated. Finally, a recovery factor was assigned to the overall reserves to allow for in-stope and mining process losses. Stope cut-off grades were estimated to determine which stopes to include in the reserves. Detailed mine development layouts and construction activities were assigned to provide access to each of the stoping units. A detailed LOM development and production schedule was prepared to estimate the annual tonnes, average grade, and ounces mined to surface. Development, construction, and production costs were estimated to allow an economic assessment to be made comparing the capital and operating expenses required for each area to the expected revenue stream to ensure economic viability.
It should be noted that all capital costs required for all surface and underground facilities at TWM and the Bell Creek Mill facility have been included in the LOM plan. It should also be noted that no contributions from the Bell Creek mining operations (positive or negative) have been considered.
The estimated reserves (diluted and recovered) are summarized in Table 1.3.
TABLE 1.3: TWM ESTIMATED RESERVES
Deposit | | Tonnes | | Grade
(g/t) | | Ounces | |
Timmins Deposit | | 1,540,344 | | 4.6 | | 227,707 | |
Thunder creek Deposit | | 1,791,821 | | 4.6 | | 264,539 | |
TWM Total Reserves Mined to Surface | | 3,332,164 | | 4.6 | | 492,246 | |
Production will average 2,800 tonnes per day from 2014 through 2016 before ramping down and ending in Q3 2017. The production profile is summarized in Table 1.4.
TABLE 1.4: ESTIMATED LOM PRODUCTION PROFILE
Item | | 2013
Year-End
Inventory | | 2014 | | 2015 | | 2016 | | 2017
(Q3) | | Total | |
Tonnes | | 59,853 | | 955,774 | | 1,056,244 | | 1,053,338 | | 206,955 | | 3,332,164 | |
Average TPD | | | | 2,618 | | 2,894 | | 2,886 | | | | | |
Average Grade | | 5.0 | | 4.7 | | 4.5 | | 4.7 | | 4.0 | | 4.6 | |
Ounces — Upper Range | | | | 159,500 | | 168,400 | | 174,000 | | 29,100 | | | |
Ounces — LOM Plan | | 9,603 | | 144,993 | | 153,087 | | 158,123 | | 26,440 | | 492,246 | |
Ounces — Lower Range | | | | 130,500 | | 137,800 | | 142,400 | | 23,800 | | | |
Annual ounce production is presented as a range (Upper and Lower). The range is based on ±10% variance from the LOM plan to reflect potential differences in the combination of stopes that may be mined during each year.
6
The estimated capital and operating costs have been based on operating experience at TWM and the Bell Creek Mill. The costs for 2014 have been developed through the TWM 2014 annual budget exercise and the costs from 2015 through 2017 comprise the remaining LOM plan. The estimated LOM capital and operating costs are summarized in Table 1.5.
TABLE 1.5: ESTIMATED LOM CAPITAL AND OPERATING COSTS
Cost Item | | Total Costs
(millions) | | Cost per Tonne | |
Capital Cost | | $ | 93.8 | | $ | 28.1/tonne | |
Operating Cost | | $ | 330.1 | | $ | 99.1/tonne | |
The costs and productivities used as the basis for estimating the reserves have been based on actual performance metrics of the operation in 2011 through 2013. These factors are considered low risk to the reserve estimate. In addition, social, political, and environmental factors are all considered to be low risk factors for the continued operation of TWM and to the reserves estimate.
Successful mining will be highly dependent on the timely completion of drilling to support both delineation and exploration. A list of some of the key targets to be tested as well as a reasonable cost estimate to complete is provided below:
Timmins Deposit (Total Cost Estimates $9.4 million, Total 74,300 metres of Drilling)
1. Delineation between 810 metre and 900 metre levels -39,300 metres, $4,205,100 (@$107/metre)
2. Exploration below 900 metre level — 5,000 metres, $535,000 (@$107/metre)
3. Exploration from 790 S2 fold nose Exploration Drift - 12,000 metres, $1,080,000 (@$90/metre)
4. Exploration from 830 metre level drill drift to test favorable Ultramafic/Mafic and Sediment contact between Timmins Mine and Thunder Creek -8,000 metres, $720,000 (@$90/metre)
5. Exploration surface drilling to test the deep extension of the Timmins Mine resource below the 1,340 metre level — 5,000 metres, $2,250,000 (@$450/metre).
6. Exploration surface drilling to the northeast of the Timmins Mine Deposit — 5,000 metres, $625,000 (@$125/metre).
Thunder Creek (Total Cost Estimate $4.2 million, Total 38,000 metres of Drilling)
1. Delineation drilling Rusk and Porphyry Zones between 660 and 520 metre level — 11,000 metres, $1,177,000 (@$107/metre).
2. Delineation drilling Rusk and Porphyry Zones above 520 metre level —4,000 metres, $428,000 (@$107/metre).
3. Delineation drilling Rusk and Porphyry Zones between 765 and 1,030 metre level — 10,000 metres, $1,070,000 (@$107/metre).
4. Exploration drilling west Thunder Creek Deposit from 710 metre level Exploration Drift — 3,000 metres, $321,000 (@$107/metre).
5. Exploration drilling west Thunder Creek Deposit from Surface — 10,000 metres, $1,250,000 (@$125/metre).
In addition to the above, closer spaced definition drilling for mining design will be locally required as mining is progressing.
7
2.0 INTRODUCTION
This Timmins West Mine Technical Report has been prepared under the supervision of Eric Kallio (P. Geo.) and Natasha Vaz (P. Eng.) on behalf of Lake Shore Gold Corp. and conforms to NI 43-101 Standards of Disclosure for Mineral Projects. These individuals are considered Qualified Persons under 43-101 definitions.
Lake Shore Gold Corp. (LSG) is a publicly traded company listed on the Toronto Stock Exchange and trading under the symbol LSG. LSG has a head office at 181 University Avenue, Suite 2000, Toronto, Ontario, Canada M5H 3M7. LSG was founded in 2002 to explore for precious and base metals hosted within the portions of the Canadian Shield situated in Quebec and Ontario.
The authors have prepared this report using a combination of publicly available and confidential information. This report is sourced from an amalgamation of several reports listed in Item 27.
The purpose of this report is to provide a summary of the total resource pool, current mine infrastructure, the life-of-mine (LOM) plan, and estimated mine capital and operating costs to substantiate an updated Mineral Reserve estimate for TWM. The work completed to support the updated reserves has been conducted on the indicated mineral resource only, with mining, milling, and cost estimating based on actual operating experience at TWM and the Bell Creek Mill.
Historical work in the TWM area was reviewed by referencing assessment reports filed at the Ministry of Northern Development and Mines’ office at the Ontario Government Complex, Highway 101 East, Timmins (Porcupine), Ontario; and the online Assessment File Research Imaging. Option and legal agreements were reviewed at the LSG Exploration Office.
2.1 LIST OF QUALIFIED PERSONS
Natasha Vaz (P. Eng.), VP of Technical Services for LSG is responsible for Items 1, 2, 3, 4, 13, 15, 16, 17, 18, 19, 20, 21, 22, 24, 25, 26, 27, 28, and 29.
Eric Kallio (P. Geo.), VP of Exploration for LSG is responsible for Items: 5, 6, 7, 8, 9, 10, 11, 12, 14, and 23, and parts of Items 1, 2, 3, 4, 24, 25, 26, and 27.
The Qualified Persons listed above are full time employees of LSG. These individuals are intimately aware of the work going on at the Timmins West Mine and have visited the site on numerous occasions.
2.2 UNITS AND CURRENCY
Metric and Imperial units are used throughout this report. Canadian dollars is the currency used unless otherwise noted.
Common conversions used included converting one ounce of gold to grams gold with a factor of 31.104 grams/troy ounce; and one ounce gold per ton with a conversion factor of 34.29 grams gold per tonne.
8
2.3 LIST OF ABBREVIATIONS
Table 2.1 lists the common abbreviations that may be used in the report.
TABLE 2.1: LIST OF ABBREVIATIONS
Unit or Term | | Abbreviation or Symbol |
Above mean sea level | | amsl |
Advanced Exploration Project | | AEP |
Atomic Absorption | | AA |
Arsenic | | As |
Arsenopyrite | | aspy |
Azimuth | | AZ |
Billion years ago | | Ga |
British thermal unit | | Btu |
Carbon in leach | | CIL |
Carbon in pulp | | CIP |
Centimetre | | cm |
Copper | | Cu |
Cubic centimetre | | cm³ |
Cubic feet per second | | ft³/s, cfs |
Cubic foot | | ft³ |
Cubic inch | | in3 |
Cubic metre | | m³ |
Cubic yard | | yd³ |
Day | | d |
Days per week | | d/wk |
Days per year (annum) | | d/a |
Dead weight tonnes | | DWT |
Degree | | ° |
Degree Celsius | | °C |
Degrees Fahrenheit | | °F |
Diamond bore hole | | dbh, DBH |
Diamond drill hole | | ddh, DDH |
Dollars Canadian | | $C |
Dry metric ton | | dmt |
Foot | | ft |
Gallon | | gal |
Gallon per minute | | gpm |
Gold | | Au |
Gold equivalent grade | | AuEq |
Gram | | g |
Gram metres | | m.g/t |
Grams per litre | | g/l |
9
Unit or Term | | Abbreviation or Symbol |
Grams per tonne | | g/t, gpt |
Greater than | | > |
Hectare (10,000m²) | | ha |
Hour | | h (not hr) |
Inch | | in, “ |
Kilo (1,000) | | k |
Kilogram | | kg |
Kilograms per cubic metre | | kg/m³ |
Kilograms per hour | | kg/h |
Kilograms per square metre | | kg/m² |
Kilometre | | km |
Kilometres per hour | | km/h |
Less than | | < |
Lead | | Pb |
Life-of-mine | | LoM |
Litre | | L |
Litres per minute | | L/m |
Metre | | M |
Metres above sea level | | masl |
Metres per minute | | m/min |
Metres per second | | m/s |
Metric ton (tonne) (2,000 kg) (2,204.6 pounds) | | t |
Micrometre (micron) | | µm |
Miles per hour | | mph |
Milligram | | mg |
Milligrams per litre | | mg/L |
Milliliter | | mL |
Millimetre | | mm |
Million | | M |
Million grams | | M g |
Million tonnes | | Mt |
Million Troy ounces | | M oz |
Million Years | | Ma |
Minute (plane angle) | | min, ‘ |
Minute (time) | | min |
Month | | mo |
National Instrument 43-101 (Canadian) | | NI 43-101 |
No Personal Liability | | N.P.L. |
Ounces | | oz |
Page | | p, pg |
Parts per billion | | ppb |
Parts per million | | ppm |
10
Unit or Term | | Abbreviation or Symbol |
Percent | | % |
Percent moisture (relative humidity) | | % RH |
Potassium | | K |
Pound(s) | | lb |
Pounds per square inch | | psi |
Preliminary Economic Assessment | | PEA |
Pyrite | | py |
Pyrrhotite | | po |
Quality Assurance/Quality Control | | QA/QC |
Quart | | qt |
Revolutions per minute | | rpm |
Rock Quality Description | | RQD |
Second (plane angle) | | sec, “ |
Second (time) | | s |
Short ton (2,000 lb) | | st |
Short ton (US) | | t (US) |
Short tons per day (US) | | tpd (US) |
Short tons per hour (US) | | tph (US) |
Short tons per year (US) | | tpy (US) |
Silver | | Ag |
Sodium | | Na |
Specific gravity | | SG |
Square centimetre | | cm² |
Square foot | | ft² |
Square inch | | in² |
Square kilometre | | km² |
Square metre | | m² |
Thousand tonnes | | kt |
Tonne (1,000 kg) | | t |
Tonnes per day | | t/d, tpd |
Tonnes per hour | | t/h |
Tonnes per year | | t/a |
Volt | | V |
Week | | wk |
Weight/weight | | w/w |
Wet metric ton | | wmt |
Yard | | yd |
Year (annum) | | a |
Year (US) | | yr |
11
2.4 DEFINITIONS
The following definitions of Mineral Resources and Mineral Reserves have been prepared by the CIM Standing Committee on Reserve Definitions and Adopted by the CIM Council on November 27, 2010.
2.4.1 Mineral Resource
Mineral Resources are sub-divided, in order of increasing geological confidence, into Inferred, Indicated and Measured categories. An Inferred Mineral Resource has a lower level of confidence than that applied to an Indicated Mineral Resource which has a lower level of confidence than a Measured Mineral Resource.
A “Mineral Resource” is a concentration or occurrence of diamonds, natural solid inorganic material, or natural solid fossilized organic material including base and precious metals, coal, and industrial minerals in or on the Earth’s crust in such form and quantity and of such a grade or quality that it has a reasonable prospect for economic extraction. The location, quantity, grade, geological characteristics, and continuity of a Mineral Resource are known, estimated or interpreted from specific geological evidence and knowledge.
2.4.2 Inferred Mineral Resource
An “Inferred Mineral Resource” is that part of a Mineral Resource for which quantity and grade or quality can be estimated on the basis of geological evidence and limited sampling and reasonably assumed, but not verified geological and grade continuity. The estimate is based on limited information and sampling gathering through appropriate techniques from locations such as outcrops, trenches, pits, workings, and drill holes.
2.4.3 Indicated Mineral Resource
An “Indicated Mineral Resource” is the part of the Mineral Resource for which quantity, grade or quality, densities, shape, and physical characteristics can be estimated with a level of confidence sufficient to allow the appropriate application of technical and economic parameters, to support mine planning and evaluation of the economic viability of the deposit. The estimate is based on detailed and reliable exploration and testing information gathered through appropriate techniques from locations such as outcrops, trenches, pits, workings, and drill holes that are spaced closely enough for geological and grade continuity to be reasonably assumed.
2.4.4 Measured Mineral Resource
A “Measured Mineral Resource” is the part of the Mineral Resource for which quantity, grade or quality, densities, shape and physical characteristics are so well established that they can be estimated with confidence sufficient to allow the appropriate applications of technical and economic parameters, to support production planning and evaluation for the economic viability of the deposit. The estimate is based on detailed and reliable exploration, sampling and testing information gathered through appropriate techniques from locations such as outcrops, trenches, pits workings and drill holes that are spaced closely enough to confirm both geological and grade continuity.
12
2.4.5 Mineral Reserve
Mineral Reserves are sub-divided in order of increasing confidence into Probable Mineral Reserves and Proven Mineral Reserves. A Probable Mineral Reserve has a lower level of confidence than a Proven Mineral Reserve.
A Mineral Reserve is the economically mineable part of the Measured or Indicated Mineral Resource demonstrated by at least a Preliminary Feasibility Study. This Study must include adequate information on mining, processing, metallurgical, economic, and other relevant factors that demonstrate, at the time of reporting, that economic extraction can be justified. A Mineral Reserve includes diluting minerals and allowances for losses that may occur when the material is mined.
2.4.6 Probable Mineral Reserve
A “Probable Mineral Reserve” is the economically mineable part of an Indicated and, in some circumstances, a Measured Mineral Resource demonstrated by at least a Preliminary Feasibility Study. This Study must include adequate information on mining, processing metallurgical, economic and other relevant factors that demonstrate, at the time of reporting that economic extraction can be justified.
2.4.7 Proven Mineral Reserve
A “Proven Mineral Reserve” is the economically mineable part of a Measured Mineral Resource demonstrated by at least a Preliminary Feasibility Study. This Study must include adequate information on mining, processing, metallurgical, economic, and other relevant factors that demonstrate, at the time of reporting, the economic extraction is justified.
2.5 GLOSSARY
2.5.1 General Glossary
Table 2.2 is a summary table of common technical words accompanied by a simple explanation of the term or word as the term pertains to this report.
TABLE 2.2: GLOSSARY
Term | | Explanation |
Assay | | The chemical analysis of mineral samples to determine the metal content. |
Capital Expenditure | | All other expenditures not classified as operating costs. |
Composite | | Combining more than one sample result to give an average result over a larger distance. |
Concentrate | | A metal-rich product resulting from a mineral enrichment process such as gravity concentration or floatation, in which most of the desired mineral has been separated from waste material in the ore. |
Crushing | | Initial process of reducing ore particle size to render it more amenable for further processing. |
Cut-off Grade (CoG) | | The grade of mineralized rock, which determines whether or not it is economic to recover its gold content by further concentration. |
Dilution | | Unwanted waste, which is mined with ore. |
Dip | | Angle of inclination of a geological feature / rock from the horizontal. |
Fault | | The surface of a fracture along which movement has occurred. |
13
Term | | Explanation |
Footwall | | The underlying side of an orebody or stope. |
Gangue | | Non-valuable components of the ore. |
Grade | | The measure of concentration of “gold” within mineralized rock. |
Hangingwall | | The overlying side of an orebody or stope. |
Haulage | | A horizontal underground excavation which is used to transport mined material. |
Igneous | | Primary crystalline rock formed by the solidification of magma. |
Level | | Horizontal tunnel with the primary purpose to transport personnel and materials. |
Lithological | | Geological description pertaining to different rock types. |
LoM Plans | | Life-of-mine plans. |
Material Properties | | Mining properties. |
Metamorphism | | Process by which consolidated rock is altered in composition, texture, or internal structure by conditions and forces of heat and pressure. |
Milling | | A general term used to describe the process in which the ore is crushed, ground and subjected to physical or chemical treatment to extract the valuable metals to a concentrate or finished product. |
Mineral/Mining Lease | | A lease area for which mineral rights are held. |
Mining Asset | | Material Properties and Significant Exploration Properties. |
Ongoing Capital | | Capital estimates of a routine nature, which is necessary for sustaining operations. |
Ore Reserve | | See Mineral Reserve |
RoM | | Run of Mine |
Sedimentary | | Pertaining to rocks formed by the accumulation of sediments, formed by the erosion of other rocks. |
Shaft | | An opening cut downwards from the surface for transporting personnel, equipment, supplies, ore and waste. |
Smelting | | A high temperature pyrometallurgical operation conducted in a furnace, in which the valuable metal is collected to a molten matte or doré phase and separated from gangue components that accumulate in a less dense molten slag phase. |
Stope | | Underground void created by mining. |
Stratigraphy | | The study of stratified rocks in terms of time and space. |
Strike | | Direction of line formed by the intersection of strata surfaces with the horizontal plane, always perpendicular to the dip direction. |
Sulphide | | A sulphur bearing mineral. |
Tailings | | Finely ground waste rock from which valuable minerals or metals have been extracted. |
Thickening | | The process of concentrating solid particles in suspension. |
Total Expenditure | | All expenditures including those of an operation and capital nature. |
14
2.5.2 Lake Shore Gold Terminology
Timmins West Complex: | | The Company’s entire land package on the west side of the city, Extending through Bristol, Thorneloe, Carscallen, Denton townships. |
| | |
Timmins West Mine: | | The combined areas that are currently being mined using the shared Infrastructure, namely the Timmins Deposit and the Thunder Creek Deposit. |
| | |
Timmins Deposit: | | The deposit formerly known as the Timmins Mine (now one of two deposits comprising the Timmins West Mine). |
| | |
Thunder Creek Deposit: | | The second deposit being mined in the Timmins West Mine. |
15
3.0 RELIANCE ON OTHER EXPERTS
The authors have sourced the information for this technical report from an amalgamation of several reports listed in Item 27. These references include government geological reports, press releases, company annual reports, assessment reports filed with the Ministry of Northern Development and Mines, previously filed NI 43-101 Technical Reports (SEDAR), and reports both public and confidential provided by LSG.
Exploration at the Timmins West Mine has continuously been overseen, and planned by professional geologists and qualified persons (QPs). Table 3.1 summarizes the names of the QPs and the dates that they supervised the exploration and advanced exploration activities.
TABLE 3.1: QUALIFIED PERSONS FOR TIMMINS WEST MINE
Location | | Period | | Qualified Person |
Timmins Deposit | | 2003 — 2004 | | Jacques Samson, P. Geo. |
| | 2005 — 2006 | | Dr. M.J. Byron, P. Geo. |
| | 2006 — 2009 | | Jacques Samson, P. Geo. |
| | 2009 | | Heather Miree, P. Geo. |
| | 2009 | | Stephen Conquer, P. Geo. |
| | August 2010 - May 2013 | | Dean Crick, P. Geo. |
| | May 2013 - present | | Eric Kallio, P. Geo. |
Thunder Creek Deposit | | 2003 — 2009 | | Jacques Samson, P. Geo. |
| | 2005 — 2006 | | Dr. M.J. Byron, P. Geo. |
| | 2006 — 2009 | | Jacques Samson, P. Geo. |
| | 2009 — March 2010 | | Pat Pope, P. Geo. |
| | 2009 — August 2010 | | Stephen Conquer, P. Geo. |
| | August 2010 — May 2013 | | Dean Crick, P. Geo. |
| | May 2013 - present | | Eric Kallio, P. Geo. |
From 2003 to the present, contributions to geology by outside consultants include petrography, ore microscopy and scanning electron microscope investigations by Dr. Miller of Miller and Associates of Ottawa, mineralization and structural studies comparing Thunder Creek and the Timmins Mine by Mr. David Rhys, of Panterra Geoservices Inc., petrology studies of the Timmins Mine and Thunder Creek area by Katherina Ross, Panterra Geoservices, and geological mapping of a 5 square kilometre area surrounding the Rusk surface showing by Mr. John Camier, P. Geo. Mr. Camier’s report includes petrographic analysis thin sections examined by Mr. Camier and Dr. Bob Springer, Professor Emeritus at Brandon University, Manitoba.
Several reports have been submitted to SEDAR describing in detail and outlining the exploration history of the Timmins Mine Complex (formerly known as the Timmins West Gold Project and the Holmer Mine Property) as well as the Thunder Creek Property. The reader is invited to review the detailed summaries and source material outlined in the following documents:
2002: Holmer Gold Mines Limited, Annual Information Form.
2003: Holmer Gold Mines Limited, Annual Information Form.
16
2004: A Technical Review of Holmer Gold Property, In Bristol Township, Timmins Area, Ontario, Canada for Lake Shore Gold Corp. prepared by E. Neczkar, M.W. Kociumbas, J.R. Sullivan September 07, 2004, Watts, Griffis and McQuat Limited.
2004: National Instrument 43-101 Technical Report, Timmins Gold Project, Timmins, Ontario, Lake Shore Gold Corp., L.D.S. Winter September 24, 2004.
2004: National Instrument 43-101 Technical Report, Timmins Gold Project, Timmins, Ontario, Lake Shore Gold Corp., L.D.S. Winter November 26, 2004.
2006: National Instrument 43-101 Technical Report, Timmins West Gold Project, Timmins, Ontario, Lake Shore Gold Corp., L.D.S. Winter January 25, 2006.
2007: A Technical Review of the Timmins West Gold Project In Bristol Township, Timmins Area, Ontario, for Lake Shore Gold Corp., J.R. Sullivan, J.G. Lavigne, M.W. Kociumbas, January 03, 2007, Watts, Griffis and McQuat Limited.
2007: National Instrument 43-101 Technical Report, Lake Shore Gold Corp. Timmins West Project, Timmins, Ontario, G. Darling et al. SRK Consulting, October 12, 2007.
2008: Technical Report of the Thunder Creek Gold Property, Bristol township, Timmins, Ontario, Canada, D. Wagner, June 27, 2008.
2009: Updated NI 43-101 Technical Report on the Timmins Mine Property, Ontario, Canada, prepared for Lake Shore Gold Corp., G. Darling et al. October 01, 2009.
2009: Amended Technical Review and Report of the “Thunder Creek Property” Bristol And Carscallen Townships, Porcupine Mining Division, Ontario, Canada prepared for Lake Shore Gold Corp. and West Timmins Mining Inc. July 29, 2009.
2011: Technical Report on the Initial Mineral Resource Estimate for the Thunder Creek Property Bristol Township, West of Timmins, Ontario, Canada, Prepared for Lake Shore Gold Corp. and West Timmins Mining Inc., D. Crick, R. Kusins, D. Powers, December 23, 2011.
2012: 43-101 Technical Report, Preliminary Economic Assessment and Updated Mineral Resource Estimate for Timmins West Mine Timmins, Ontario, Canada, prepared by Dean Crick, (P. Geo.), Ralph Kock (P. Geo.), Robert Kusins (P. Geo.), Brian Buss (P. Eng.) and David Powers (P. Geo.) on behalf of Lake Shore Gold Corp., March 29, 2012.
2012: 43-101 Technical Report, Pre-feasibility Study and Mineral Reserve Estimate for Timmins West Mine, Timmins, Ontario, Canada, prepared by Dean Crick (P. Geo.), Ralph Koch (P. Geo.), Robert Kusins (P. Geo.), David Powers (P. Geo.), Brian Buss (P. Eng.). May 14, 2012.
The authors rely on the professional integrity of the designated project QPs to maintain and provide true and accurate reporting of the facts throughout the project history. Where possible, the internal documents have been checked against public record filed for assessment purposes.
The authors have also relied on internal experts within the organization for input to certain sections of this report. The authors have reviewed and endorsed the contributions of these experts.
Marcel Cardinal, Manager of Environmental Affairs, Lake Shore Gold Corp. contributed to Items 4 and 20.
Dave Felsher, Chief Mineral Processing Engineer, Lake Shore Gold Corp. contributed to Items 13 and 17.
Keith Green, P. Geo., an employee of Lake Shore Gold Corp., contributed to Items 4, 5, 7, 8, 23, 25, and 26 and to Appendix 1.
17
Jacques Samson, P. Geo., an employee of Lake Shore Gold Corp., contributed to Items 6, 9, 10, 11, and 12.
Ralp Koch, P. Geo., an employee of Lake Shore Gold Corp., contributed to Item 14.
The authors have also relied on external experts for input to certain sections of this report. The authors have reviewed and endorsed the contributions of these experts.
Kathy Kalenchuk, Ph.D. of Mine Design Engineering (Sr. Geomechanics Consultant) contributed to Item 16.
Guy Desharnais, PhD, P. Geo., Technical Manager of Geological Services SGS Canada, contributed to Item 14.
18
4.0 PROPERTY DESCRIPTION AND LOCATION
4.1 PROPERTY DESCRIPTION
The Timmins West Mine (TWM) area includes the Timmins Deposit property and the Thunder Creek property for a total area of approximately 14.5 square kilometres, or approximately 1,536 hectares. The majority of the property is situated within Bristol Township, with approximately 36 hectares located in Carscallen Township. The Mining Land Tenure Map reference for the TWM is Bristol Township; Plan G-3998; Porcupine Mining Division, Land Titles/Registry Division of Cochrane; and Timmins, Ministry of Natural Resources District, Ontario, Canada.
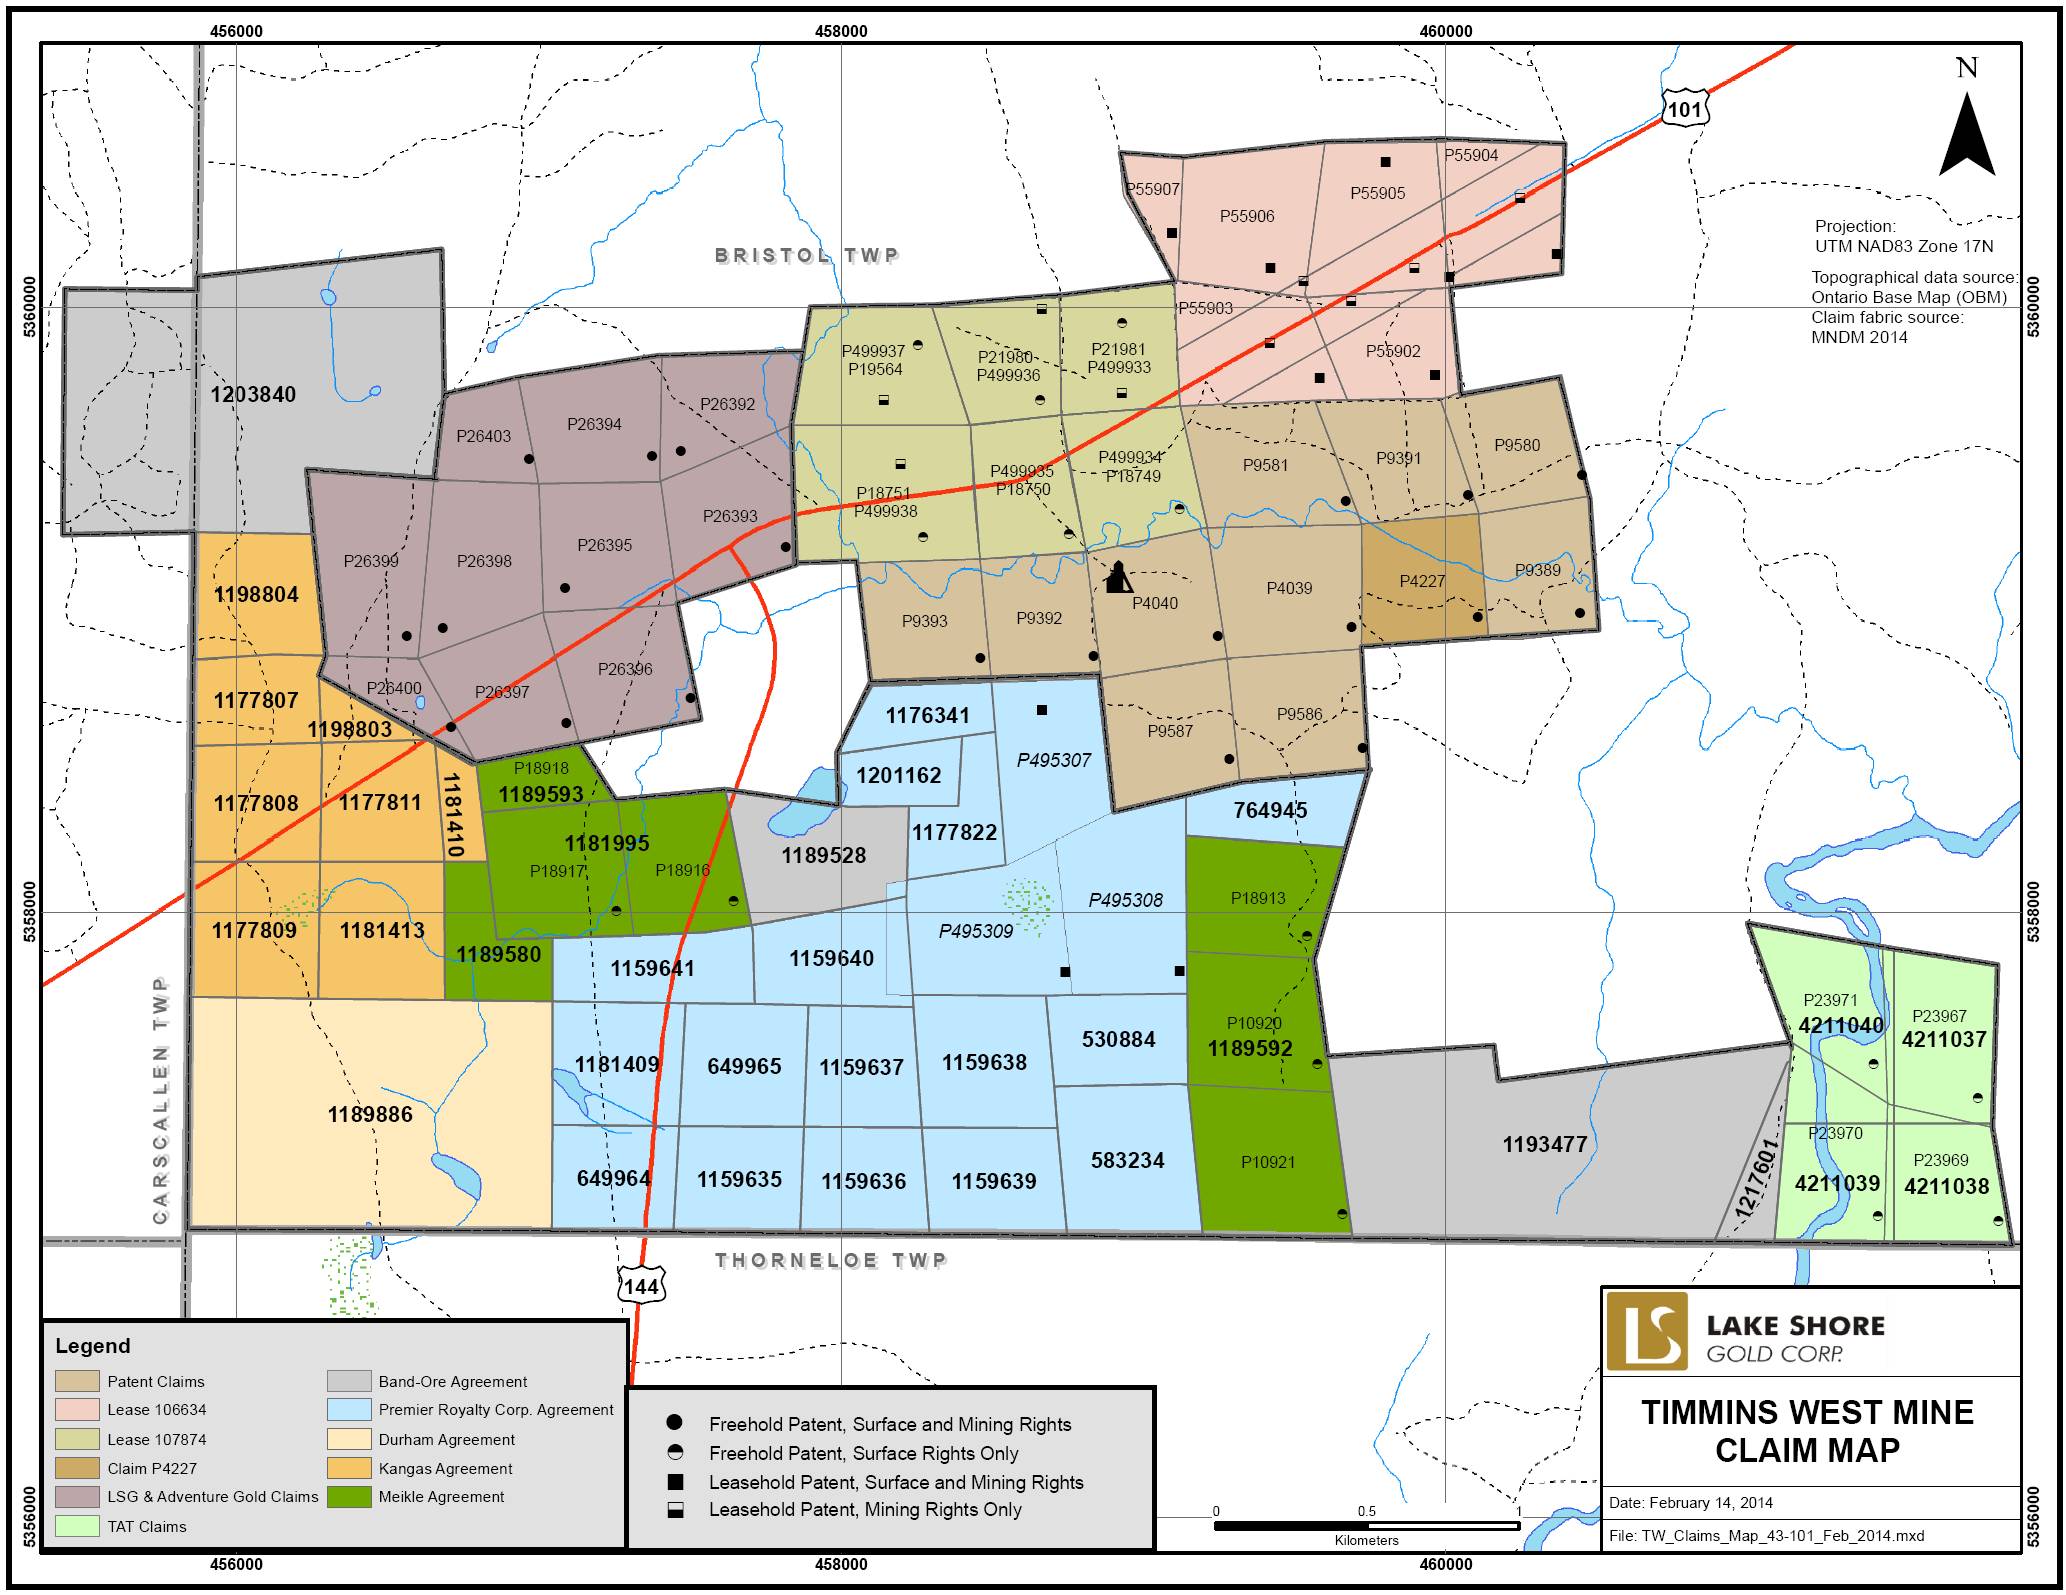
The Timmins Deposit of the TWM consists of a block of 23 contiguous claims (395 hectares) of which there are 21 individual patented claims and 12 leased claims that are further divided into two 21 year Crown mining leases. The Thunder Creek Deposit portion of the property consists of 57 staked claim units and three Crown leasehold single unit patent claims totaling approximately 960 hectares. Lake Shore Gold Corp. (LSG) owns a 100% interest in most of the property, subject to underlying royalties. The only exception is the Meunier 144 property with LSG holding a 50% interest in these ten patent claims. The claims and leases are all in good standing. Figure 4.1 illustrates the TWM property relative to local topographic and cultural features. Table 4.1 contains the details of staked claims, numbers, ownership, size, and expiry date for the TWM property; Table 4.2 contains leased lands information; and Table 4.3 contains patent lands information.
19
FIGURE 4.1: TIMMINS WEST MINE PROPERTY
20
TABLE 4.1: TIMMINS WEST MINE STAKED CLAIMS
STAKED CLAIMS
Claim No. | | Township | | Owner | | No. of
Units | | Recording Date | | Assessment
Due Date | | Assessment Due
($) | | Banked Credits | | Royalty To | |
P1159635 | | Bristol | | LSG | | 1 | | 1990-Dec-18 | | 2017-Dec-18 | | 400 | | 5,387 | | Premier;FNV | |
P1159636 | | Bristol | | LSG | | 1 | | 1990-Dec-18 | | 2017-Dec-18 | | 400 | | 29,423 | | Premier;FNV | |
P1159637 | | Bristol | | LSG | | 1 | | 1990-Dec-18 | | 2017-Dec-18 | | 400 | | 97,374 | | Premier;FNV | |
P1159638 | | Bristol | | LSG | | 1 | | 1990-Dec-18 | | 2017-Dec-18 | | 400 | | 48,241 | | Premier;FNV | |
P1159639 | | Bristol | | LSG | | 1 | | 1990-Dec-18 | | 2017-Dec-18 | | 400 | | 6,400 | | Premier;FNV | |
P1159640 | | Bristol | | LSG | | 1 | | 1990-Dec-18 | | 2017-Dec-18 | | 400 | | 135,326 | | Premier;FNV | |
P1159641 | | Bristol | | LSG | | 1 | | 1990-Dec-18 | | 2017-Dec-18 | | 400 | | 805 | | Premier;FNV | |
P1176341 | | Bristol | | LSG | | 1 | | 1991-Feb-18 | | 2017-Feb-18 | | 400 | | 6,010 | | Premier;FNV | |
P1177807 | | Bristol | | LSG | | 1 | | 1991-May-13 | | 2017-May-13 | | 400 | | 0 | | Kangas;FNV | |
P1177808 | | Bristol | | LSG | | 1 | | 1991-May-13 | | 2017-May-13 | | 400 | | 312 | | Kangas;FNV | |
P1177809 | | Bristol | | LSG | | 1 | | 1991-May-13 | | 2017-May-13 | | 400 | | 1,637 | | Kangas;FNV | |
P1177811 | | Bristol | | LSG | | 1 | | 1991-May-13 | | 2017-May-13 | | 400 | | 1,403 | | Kangas;FNV | |
P1177822 | | Bristol | | LSG | | 1 | | 1991-Oct-04 | | 2017-Oct-04 | | 400 | | 185,760 | | Premier;FNV | |
P1181409 | | Bristol | | LSG | | 1 | | 1994-Feb-14 | | 2017-Feb-14 | | 400 | | 4,997 | | Premier;FNV | |
P1181410 | | Bristol | | LSG | | 1 | | 1994-Feb-14 | | 2017-Feb-14 | | 400 | | 17,851 | | Kangas;FNV | |
P1181413 | | Bristol | | LSG | | 1 | | 1994-Feb-14 | | 2017-Feb-14 | | 400 | | 1,793 | | Kangas;FNV | |
P1181995 | | Bristol | | LSG | | 2 | | 1992-Jun-22 | | 2017-Jun-22 | | 800 | | 4,054 | | Durham; Meikle;FNV | |
P1189528 | | Bristol | | LSG | | 1 | | 1993-Jun-18 | | 2017-Jun-18 | | 400 | | 90,032 | | FNV | |
P1189580 | | Bristol | | LSG | | 1 | | 1993-Jan-08 | | 2017-Jan-08 | | 400 | | 1,013 | | Durham; Meikle;FNV | |
P1189592 | | Bristol | | LSG | | 3 | | 1992-Jun-19 | | 2017-Jun-19 | | 1,200 | | 36,009 | | Durham; Meikle;FNV | |
P1189593 | | Bristol | | LSG | | 1 | | 1992-Jun-22 | | 2017-Jun-22 | | 400 | | 624 | | Durham; Meikle;FNV | |
P1189886 | | Bristol | | LSG | | 6 | | 1992-May-07 | | 2017-May-07 | | 2,400 | | 58,675 | | Hutteri;FNV | |
P1193477 | | Bristol | | LSG | | 6 | | 1994-May-04 | | 2017-May-04 | | 2,400 | | 1,793 | | FNV | |
P1198803 | | Bristol | | LSG | | 1 | | 1994-Feb-14 | | 2017-Feb-14 | | 400 | | 0 | | Kangas;FNV | |
P1198804 | | Bristol | | LSG | | 1 | | 1994-Feb-14 | | 2017-Feb-14 | | 400 | | 0 | | Kangas’FNV | |
P1201162 | | Bristol | | LSG | | 1 | | 1994-Jul-04 | | 2017-Jul-04 | | 400 | | 5,621 | | Premier;FNV | |
P1203840 | | Bristol | | LSG | | 6 | | 1995-Jul-21 | | 2016-Jul-21 | | 2,400 | | 0 | | FNV | |
P1217601 | | Bristol | | LSG | | 1 | | 1996-Nov-26 | | 2016-Nov-26 | | 400 | | 0 | | FNV | |
P530884 | | Bristol | | LSG | | 1 | | 1980-Oct-10 | | 2017-Oct-10 | | 400 | | 7,227 | | Premier;FNV | |
P583234 | | Bristol | | LSG | | 1 | | 1980-Oct-10 | | 2017-Oct-10 | | 400 | | 29,844 | | Premier;FNV | |
P649964 | | Bristol | | LSG | | 1 | | 1983-Mar-25 | | 2017-Mar-25 | | 400 | | 5,069 | | Premier;FNV | |
P649965 | | Bristol | | LSG | | 1 | | 1983-Mar-25 | | 2017-Mar-25 | | 400 | | 34,582 | | Premier;FNV | |
P764945 | | Bristol | | LSG | | 1 | | 1984-Apr-19 | | 2017-Apr-19 | | 400 | | 1,092 | | Premier;FNV | |
P4211037 | | Bristol | | LSG | | 2 | | 2-Jun-2006 | | 2016-Jun-2 | | 800 | | 0 | | FNV | |
P4211038 | | Bristol | | LSG | | 1 | | 2-Jun-2006 | | 2016-Jun-2 | | 400 | | 0 | | FNV | |
P4211039 | | Bristol | | LSG | | 1 | | 2-Jun-2006 | | 2016-Jun-2 | | 400 | | 0 | | FNV | |
P4211040 | | Bristol | | LSG | | 2 | | 2-Jun-2006 | | 2016-Jun-2 | | 800 | | 0 | | FNV | |
21
TABLE 4.2: LEASED LANDS
LEASED LANDS
Claim No. | | Township | | Owner | | Rights | | Lease No. | | Area
(ha) | | PIN | | Lease Due Date | | Banked
Credits | | Royalty To | |
P499933 | | Bristol | | LSG | | MRO | | 107874 | | 108.792 | | 65440-0118 | | July 31 2027 | | | | FNV | |
P499934 | | Bristol | | LSG | | MRO | | | | FNV | |
P499935 | | Bristol | | LSG | | MRO | | | | FNV | |
P499936 | | Bristol | | LSG | | MRO | | | | FNV | |
P499937 | | Bristol | | LSG | | MRO | | | | FNV | |
P499938 | | Bristol | | LSG | | MRO | | | | FNV | |
P55902 | | Bristol | | LSG | | MR & SR | | 106634 | | 99.779 | | 65440-0052 | | July 31, 2013 (Lease Renewal
submitted
May 2013) | | | | FNV | |
P55903 | | Bristol | | LSG | | MR & SR | | | | | FNV | |
P55904 | | Bristol | | LSG | | MR & SR | | | | | FNV | |
P55905 | | Bristol | | LSG | | MR & SR | | | | | FNV | |
P55906 | | Bristol | | LSG | | MR & SR | | | | | FNV | |
P55907 | | Bristol | | LSG | | MR & SR | | | | | FNV | |
P495307 | | Bristol | | LSGWTM | | MRO | | 108773 | | 68.898 | | 65440-0120 | | June 30, 2032 | | 1,410,179 | | Premier;FNV | |
P495308 | | Bristol | | LSGWTM | | MRO | | Premier;FNV | |
P495309 | | Bristol | | LSGWTM | | MRO | | Premier;FNV | |
P495307 | | Bristol | | LSGWTM | | SRO | | 108774 | | 65440-0132 | | June 30, 2032 | FNV | |
P495308 | | Bristol | | LSGWTM | | SRO | | FNV | |
P495309 | | Bristol | | LSGWTM | | SRO | | FNV | |
Note: FNV — Franco Nevada
TABLE 4.3: PATENTED LANDS
PATENTED LANDS
Claim No. | | Township | | Owner | | Rights | | PIN | | Area (ha) | | Royalty To | |
P.19564 | | Bristol | | LSG | | SRO | | 65440-0038 | | 16 | | FNV | |
P.21980 | | Bristol | | LSG | | SRO | | 65440-0041 | | 16 | | FNV | |
P.21981 | | Bristol | | LSG | | SRO | | 65440-0044 | | 16 | | FNV | |
P.18751 | | Bristol | | LSG | | SRO | | 65440-0039 | | 16 | | FNV | |
P.18750 | | Bristol | | LSG | | SRO | | 65440-0042 | | 16 | | FNV | |
P.18749 | | Bristol | | LSG | | SRO | | 65440-0045 | | 16 | | FNV | |
P.9581 | | Bristol | | LSG | | MR & SR | | 65440-0051 | | 16 | | FNV | |
P.9391 | | Bristol | | LSG | | MR & SR | | 65440-0053 | | 16 | | FNV | |
P.9580 | | Bristol | | LSG | | MR & SR | | 65440-0059 | | 16 | | FNV | |
P.9393 | | Bristol | | LSG | | MR & SR | | 65440-0040 | | 16 | | FNV | |
P.9392 | | Bristol | | LSG | | MR & SR | | 65440-0043 | | 16 | | FNV | |
P.4039 T.C. 613 | | Bristol | | LSG | | MR & SR | | 65440-0050 | | 16 | | FNV | |
22
PATENTED LANDS
|
Claim No. | | Township | | Owner | | Rights | | PIN | | Area (ha) | | Royalty To | |
P.4227 T.C. 612 | | Bristol | | LSG | | MRO | | 65440-0086 | | 16 | | Lebrash;FNV | |
| Bristol | | LSG | | SRO | | 65440-0054 | | | Lebrash;FNV | |
P.9389 | | Bristol | | LSG | | MR & SR | | 65440-0060 | | 16 | | FNV | |
P.9587 | | Bristol | | LSG | | MR & SR | | 65440-0047 | | 16 | | FNV | |
P.9586 | | Bristol | | LSG | | MR & SR | | 65440-0049 | | 16 | | FNV | |
P.4040 T.C. 614 | | Bristol | | LSG | | MR & SR | | 65440-0046 | | 16 | | FNV | |
P23967 | | Bristol | | LSG | | SRO | | 65440-0073 | | 16 | | FNV | |
P23969 | | Bristol | | LSG | | SRO | | 65440-0072 | | 16 | | FNV | |
P26392 | | Bristol | | LSG & AG | | MR & SR | | 65440-0033 | | 1 | | Meunier | |
P26393 | | Bristol | | LSG & AG | | MR & SR | | 65440-0029 | | 1 | | Meunier | |
P26394 | | Bristol | | LSG & AG | | MR & SR | | 65440-0036 | | 1 | | Meunier | |
P26395 | | Bristol | | LSG & AG | | MR & SR | | 65440-0035 | | 1 | | Meunier | |
P26396 | | Bristol | | LSG & AG | | MR & SR | | 65440-0032 | | 1 | | Meunier | |
P26397 | | Bristol | | LSG & AG | | MR & SR | | 65440-0031 | | 1 | | Meunier | |
P26398 | | Bristol | | LSG & AG | | MR & SR | | 65440-0028 | | 1 | | Meunier | |
P26399 | | Bristol | | LSG & AG | | MR & SR | | 65440-0027 | | 1 | | Meunier | |
P26400 | | Bristol | | LSG & AG | | MR & SR | | 65440-0034 | | 1 | | Meunier | |
P26403 | | Bristol | | LSG & AG | | MR & SR | | 65440-0030 | | 1 | | Meunier | |
Note: FNV — Franco-Nevada
4.2 LOCATION
The headframe of the TWM is collared at national topography series (NTS) map reference 42-A-05; at 81.55° west longitude and 48.32° north latitude. Universal Transverse Mercator (UTM) co-ordinates for the project centre utilizing projection North American Datum (NAD) 83, Zone 17 are approximately 458,915 metres east and 5,358,043 metres north. This location is approximately 19 kilometres west-southwest of the Timmins city centre and 552 kilometres north-northwest of the City of Toronto. The junction of Highways 101 and 144 is situated 1.1 kilometres northwest of the property centre. The Location Map in Figure 4.2 illustrates the mine relative to the highways and the City of Timmins.
23
FIGURE 4.2: LOCATION MAP
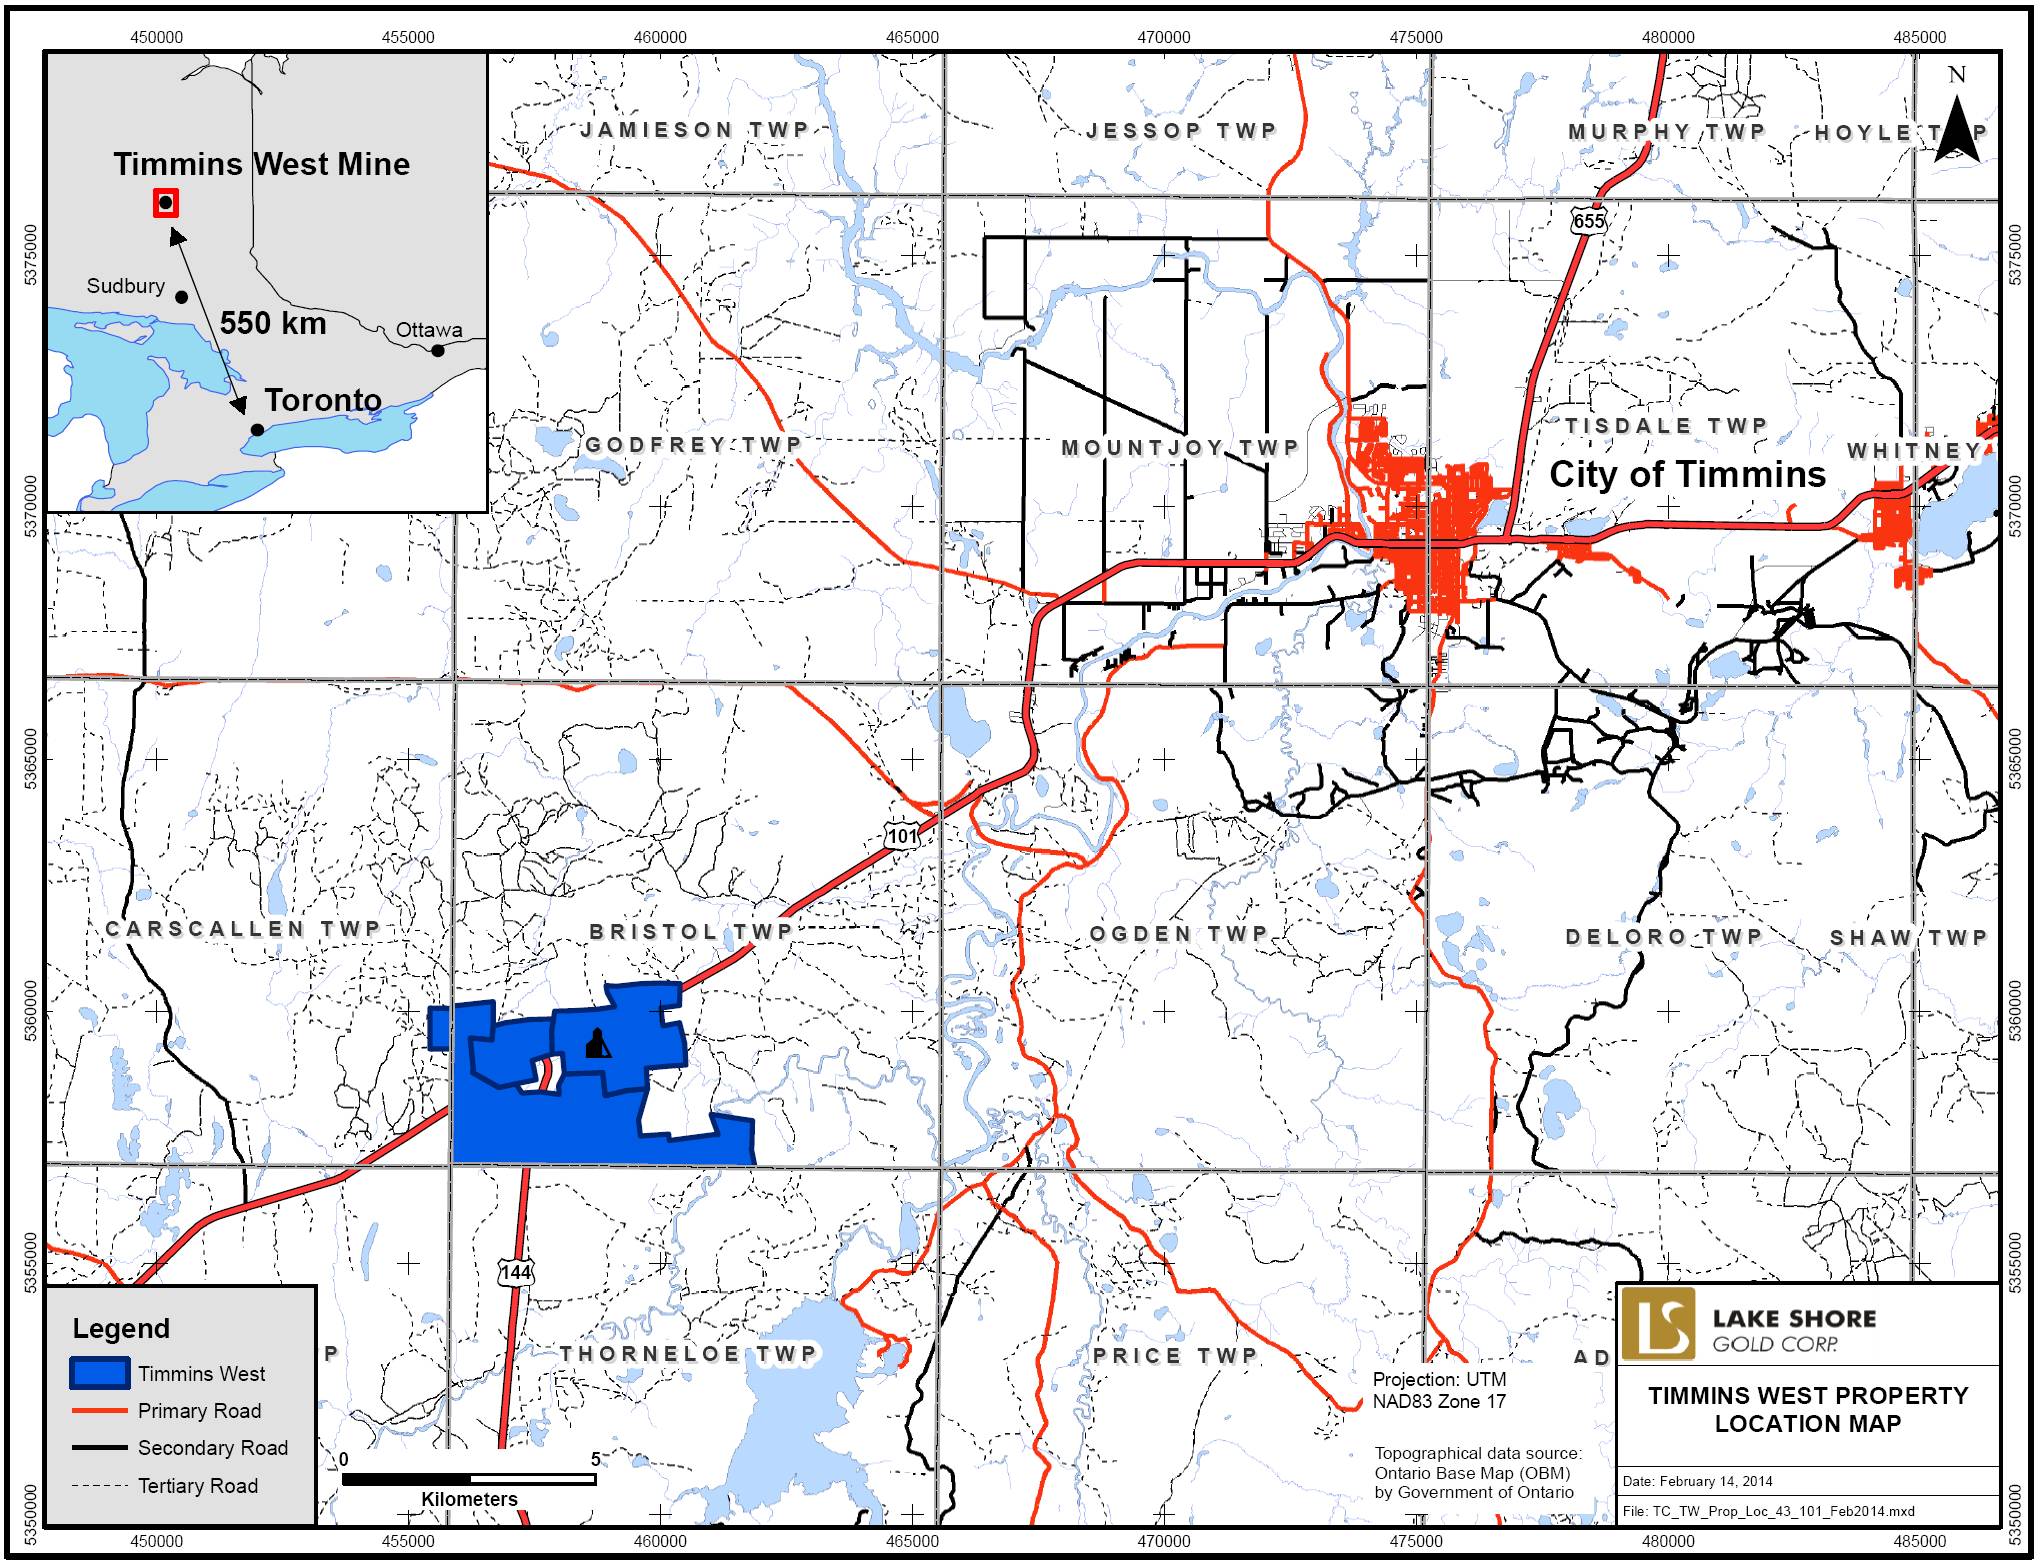
24
4.3 RECENT OWNERSHIP HISTORY AND UNDERLYING AGREEMENTS
In May 2003, LSG and Holmer Gold Mines Limited (Holmer) entered into an option agreement whereby LSG earned a 50% interest in the Holmer Property (the present Timmins Deposit property) by March 24, 2006. The agreement was subject to the following terms; incurring cumulative expenditures of $2,500,000 on the property by May 24, 2006, making staged cash payments totaling $250,000 to Holmer by May 24, 2006, issuing 150,000 common shares of LSG to Holmer by May 24, 2005, and confirming, by means of a report by a Qualified Person, that the property contains an Indicated Mineral Resource of at least 500,000 ounces of gold. This portion of the property consists of 11 Freehold Patents with surface and mining rights; Lease 106634 (formerly lease 102611) a group of six Leasehold Patents with surface and mining rights; and Lease 107874 (formerly Lease 104075) a group of six Freehold Patents with mining rights as well as six Leasehold Patents of surface rights for the same area. LSG completed the requirements to earn 50% of the Holmer property in September 2004. On December 31st, 2004 a business combination agreement between LSG, their wholly owned subsidiary LSG Holdings Corp. and Holmer Gold Mines Limited came into effect, where Holmer became a wholly-owned subsidiary of LSG. A 1.5% NSR royalty is assigned to claim P-4227 payable to Mr. Lorne Lebrash. This royalty may be purchased for $1 million. The current resource model for mineralization does not extend to claim P-4227.
LSG optioned a 60% interest in the Thunder Creek property from Band-Ore Resources Limited (Band-Ore) in November 2003. Under the terms of that agreement LSG could earn a 60% interest in the project by completing in excess of $1,705,000 expenditures, $370,000 in cash payments and the issuing of 100,000 shares within a four year period. In September 2006, Band-Ore and Sydney Resources Corporation merged into the new company West Timmins Mining Inc. (WTM). The terms of the LSG - Band-Ore option agreement succeeded to WTM. In May 2008, LSG informed WTM that the obligations to earn a 60% interest in the Thunder Creek property had been fulfilled. On November 6, 2009, LSG and WTM completed a business combination agreement resulting in WTM becoming a wholly owned subsidiary of LSG. On January 1, 2012, WTM was amalgamated into LSG, which now holds the 100% interest.
Brief summaries of the underlying agreements and royalties are stated below.
Mineral claims 4211037, 4211038, 4211039, and 4211040 were staked by LSG and have no underlying royalties, but were subject to the option agreement with WTM dated November 07, 2003. Because the claims were within the area of influence of the agreement they became part of the joint venture. LSG has received the surface rights for mineral claims 4211037 (P23967, PCL23749, PIN 65440-0073) and 4211038 (P23969, PCL 23750, PIN 65440-0072).
Claims 1189528, 1193477, 1203840, and 1217601 were staked by Band-Ore and are not subject to any underlying royalty agreements.
Mineral claims optioned originally from Mr. Jim Croxall were subject to a 2% Net Smelter Return (NSR) royalty. These claims were also subject to an advanced annual royalty payment of $5,000 until commercial production begins. LSG purchased 1% of the NSR in November 2010 in exchange for approximately $1,500,000 equivalent in LSG stock. The other 1% NSR was purchased from Jim Croxall by Premier Royalty in 2012. The surface rights for leased claims P495307, P495308, and P495309 (mineral rights only lease number 108773) have been acquired by LSG (surface lease number 108774). The renewal has been received and is in good standing until June 30, 2032.
25
The claim with number 1189886 was optioned from Mr. Bruce Durham and partners and has a 3% royalty attached.
Eight claims optioned from the late Mr. Matt Kangas and Mr. Jim Croxall (1177807, 1177808, 1177809, 1177811, 1181410, 1181413, 1198803, and 1198804) are subject to a 2% NSR royalty of which 1% may be purchased for $1,000,000. An advanced royalty payment of $5,000 (indexed for inflation) is paid annually to the estate of Mr. Kangas and to Mr. Croxall in equal portions. After the signing of the original agreement, mineral claims came open and were re-staked: claim 1181410 was former claim 1177813, claim 1181413 was former claim 1177810, claim 1198803 was former claim 1177812, and claim 1198804 was former claim 1177806.
Four claims; 1189593, 1181995, 1189580, and 1189592 were purchased by Bruce Durham, Robert Duess, Ken Krug, and Henry Hutteri from Ray Meikle and Steve Anderson and then optioned to Band-Ore. A 3% NSR royalty is payable, 1.5% from Durham et al., and 1.5% from Meikle and Anderson. There is not a buy down of this royalty.
The surface rights for claims P18913, P18916, P18917, P18918, P10920, and P10921 are held by Timmins Forest Products.
As of March 1, 2012, Franco-Nevada Corporation (Franco-Nevada) entered into an agreement with LSG through which Franco-Nevada paid LSG US$35 million for a 2.25% NSR royalty on the sale of minerals from the Timmins West Mine.
All claims and leases are in good standing as of the Effective Date of this report.
The surface and mining rights for claims P26392, P26393, P26394, P26395, P26396, P26397, P26398, P26399, P26400, P26403, known as the Meunier 144 Property, are currently held by LSG and Adventure Gold Inc. (each with a 50% interest). There is a 2.5% NSR royalty payable to David Meunier, with an option to purchase 1 percent.
In addition to the royalties, the properties comprising TWM have been pledged as security for the outstanding debt obligations of LSG under an agreement with Sprott Resource Lending Partnership for a credit facility totaling up to $70 million, of which approximately $50 million remains outstanding as of December 31, 2013.
4.4 PAST MINING ACTIVITY, ENVIRONMENTAL LIABILITIES AND PERMITTING
During the period of 1911 to 1914 two shallow shafts were sunk; one on the present main mineralized zone and the second east of Vein 2 and Vein 3 Zones. Shaft 1 is reported to be 12 metres deep and the second shaft’s depth is an unspecified “shallower” depth. The footprint of diamond drilling and exploration trenching made minimum impact on the environment. The development of the TWM infrastructure created a local disturbance of the terrestrial environment. Baseline work did not identify any provincially or federally listed fauna species on the development site that would trigger a concern. At closure, the site will be rehabilitated in accordance with closure plans filed with the Ministry of Northern Development and Mines.
From the Ministry of Natural Resources’ Species at Risk in Ontario (“SARO”) list, the following species could range within the Project area.
26
TABLE 4.4: SPECIES AT RISK
Common Name | | Scientific Name | | OMNR Status |
Lake Sturgeon | | Acipenser fluvescens | | Special concern |
Golden Eagle | | Aquila chrysaetos | | Endangered |
Short-Eared Owl | | Asio flammeus | | Special concern |
Eastern Wolf | | Canis lupus lycaon | | Special concern |
Black Tern | | Chlidonias niger | | Special concern |
Yellow Rail | | Coturnicops noveboracensis | | Special concern |
Monarch Butterfly | | Danaus plexippus | | Special concern |
Bald Eagle | | Haliaeetus leucocephalus | | Special concern |
Peregrine Falcon | | Falco peregrinus | | Threatened |
Eastern Cougar | | Puma concolor | | Endangered |
The authors are not aware of any of the species listed in the species at risk table as being present within the area of the Property.
The required permits and approvals for operations at the TWM have been acquired, Timmins Mine (Darling et al., 2009, Crick, D., 2011; Ternes, T., 2011). These include Provincial Permits:
· Ministry of Northern Development and Mines (MNDM)
· Ministry of the Environment (MOE)
· Ministry of Natural Resources (MNR)
· Ministry of Transportation (MTO)
· Technical Standards and Safety Authority (TSSA)
· Ministry of Labour (MOL)
· Occupational Health and Safety
· Explosives
· Notification of Commencement of Construction and Operation
And Federal Permits:
· Department of Fisheries and Oceans Canada (DFO)
· Natural Resources Canada (NR CAN) — Explosives Regulatory Division (ERD)
· Environment Canada (EC)
A closure plan for the bulk sampling was filed in October 2009 and the commercial production closure plan was filed in 2010. In January 2011, Lake Shore Gold Corp. announced the Timmins Mine to be in commercial production.
To the best of the author’s knowledge there is no significant factor or risk that may affect access, title, or the right or ability to perform work on the property.
27
5.0 ACCESSIBILITY, CLIMATE, LOCAL RESOURCES, INFRASTRUCTURE AND PHYSIOGRAPHY
5.1 ACCESSIBILITY
The Timmins West Mine is located 1.1 kilometres southeast of the junction of provincial Highways 101 and 144. All season road access to the property is provided by Highways 101 and 144, and the site access road. Bush roads, trails suitable for all-terrain vehicles, and foot paths provide access throughout the property and other locations within the claim boundaries. A major power transmission line traverses the northwest portion of the property. The location map previously presented in Figure 4.2 illustrates the project area relative to the highways.
5.2 CLIMATE
The Timmins West Mine area, and the City of Timmins experience a continental climate with an average mean temperature range of -17.5°C (January) to +17.4° (July) and an annual precipitation of approximately 831 mm. Table 5.1 summarizes the average temperatures and precipitation values at the Timmins Airport for the 15 year period between 1971 and 2000.
TABLE 5.1: AVERAGE TEMPERATURES, PRECIPITATION AND SNOW FALL DEPTHS FOR THE TIMMINS AREA (1971 TO 2000)
| | Jan | | Feb | | Mar | | Apr | | May | | Jun | | Jul | | Aug | | Sep | | Oct | | Nov | | Dec | | Year | |
Temperature | | | | | | | | | | | | | | | | | | | | | | | | | | | |
Daily Average (°C) | | -17.5 | | -14.4 | | -7.7 | | 1.2 | | 9.6 | | 14.7 | | 17.4 | | 15.7 | | 10.3 | | 4.2 | | -4 | | -13.2 | | 1.3 | |
Daily Maximum (°C) | | -11 | | -7.5 | | -0.9 | | 7.6 | | 16.6 | | 21.7 | | 24.2 | | 22.3 | | 16.1 | | 8.9 | | 0.1 | | -7.8 | | 7.5 | |
Daily Minimum (°C) | | -23.9 | | -21.3 | | -14.5 | | -5.2 | | 2.5 | | 7.5 | | 10.5 | | 9.1 | | 4.4 | | -0.6 | | -8.1 | | -18.7 | | -4.9 | |
Precipitation | | | | | | | | | | | | | | | | | | | | | | | | | | | |
Rainfall (mm) | | 2.9 | | 1.6 | | 14.7 | | 26.6 | | 62.7 | | 89.1 | | 91.5 | | 82 | | 86.7 | | 64 | | 29.5 | | 7 | | 558.1 | |
Snowfall (cm) | | 61.7 | | 40.6 | | 49.9 | | 27.5 | | 6.7 | | 0.4 | | 0 | | 0 | | 1.6 | | 14 | | 45.7 | | 65.4 | | 313.3 | |
Precipitation (mm) | | 53.9 | | 36.6 | | 59.4 | | 52.8 | | 69.2 | | 89.4 | | 91.5 | | 82 | | 88.3 | | 76.8 | | 69.6 | | 61.9 | | 831.3 | |
Annually, ice will start to form on lakes in approximately mid-November, and ice breakup will take place in early to mid-May. Work can be carried out on the property twelve months a year.
5.3 LOCAL RESOURCES AND INFRASTRUCTURE
The City of Timmins with an area of 3,210 square kilometres and a population of 43,165 (2011 Census) has an economic base dominated by the mining and logging industries. The area is serviced from Toronto via Highways 400/69 to Sudbury and Highway 144 from Sudbury to Timmins, or Highway 400/11 to Matheson and from Matheson via Highway 101 westward to Timmins. The Timmins Victor M. Power Airport has scheduled service provided by Air Canada Jazz, Bearskin Airlines, and Air Creebec. Porter Airways provides air service between Timmins and Toronto Island airport. The Timmins District Hospital is a major referral health care centre for northeastern Ontario.
The property is accessible by Highways 101 and 144 and is in close proximity to the main hydro grid transmission line. An experienced mining labour pool is accessible in the Timmins area.
28
To the best of the author’s knowledge, there are sufficient surface rights, a willing and skilled labour pool, and readily available infrastructure to carry on a mining operation.
5.4 PHYSIOGRAPHY
The Timmins West Mine property generally exhibits low to moderate relief. The elevation of Highway 101 as it traverses the property varies from 308 metres in the east to 320 metres in the west, at the junction of Highways 144 and 101 the elevation is approximately 312 metres. The peak height of land on the property is 353 metres located at UTM coordinate 458,879.9 metres east and 5,357,321.5 metres north. The elevation of the Tatachikapika River ranges from 300 to 292 metres as it flows east-north-east to the northerly flowing Mattagami River. Outcrop exposure varies between five to fifteen percent. Figure 5.1 illustrates the claim boundary of the Timmins West Mine property and the township boundaries between Carscallen, Thorneloe, and Bristol townships draped over a landsat panchromatic image of the area.
The continental climate and the location on the Canadian Shield give rise to a plant hardiness Zone 2a which supports the following boreal forest tree species and a timber, pulp and paper industry. In no particular order of significance local trees species include: American Mountain-Ash (Sorbus Americana), Balsam Fir (Abies Balsamea), Black Spruce (Pincea Mariana), Eastern White Cedar (Thuja Occidentalis), Eastern White Pine (Pinus Strobus), Jack Pine (Pinus Banksiana), Pin Cherry (Prunus Pensylvanica), Red Pine (Pinus Resinosa), Tamarack (Larix Laricina), Trembling Aspen (Populus Tremuloides), White Birch (Betula Papyrifera) and White Spruce (Pincea Glauca).
Hawley, J.E., (1926) points out that a large part of Ogden, Bristol, and Carscallen Townships were swept by several forest fires dating back to 1911. Darling et al. (2007) state the Provincial Forest Resources Inventory stand numbers provided by Tembec indicate that most of the forestry related disturbances to the Timmins West Mine occurred approximately 20 years ago, and that the forest communities are composed of poplar, jack pine, white birch, black spruce, and white spruce.
29
FIGURE 5.1: PHYSIOGRAPHY
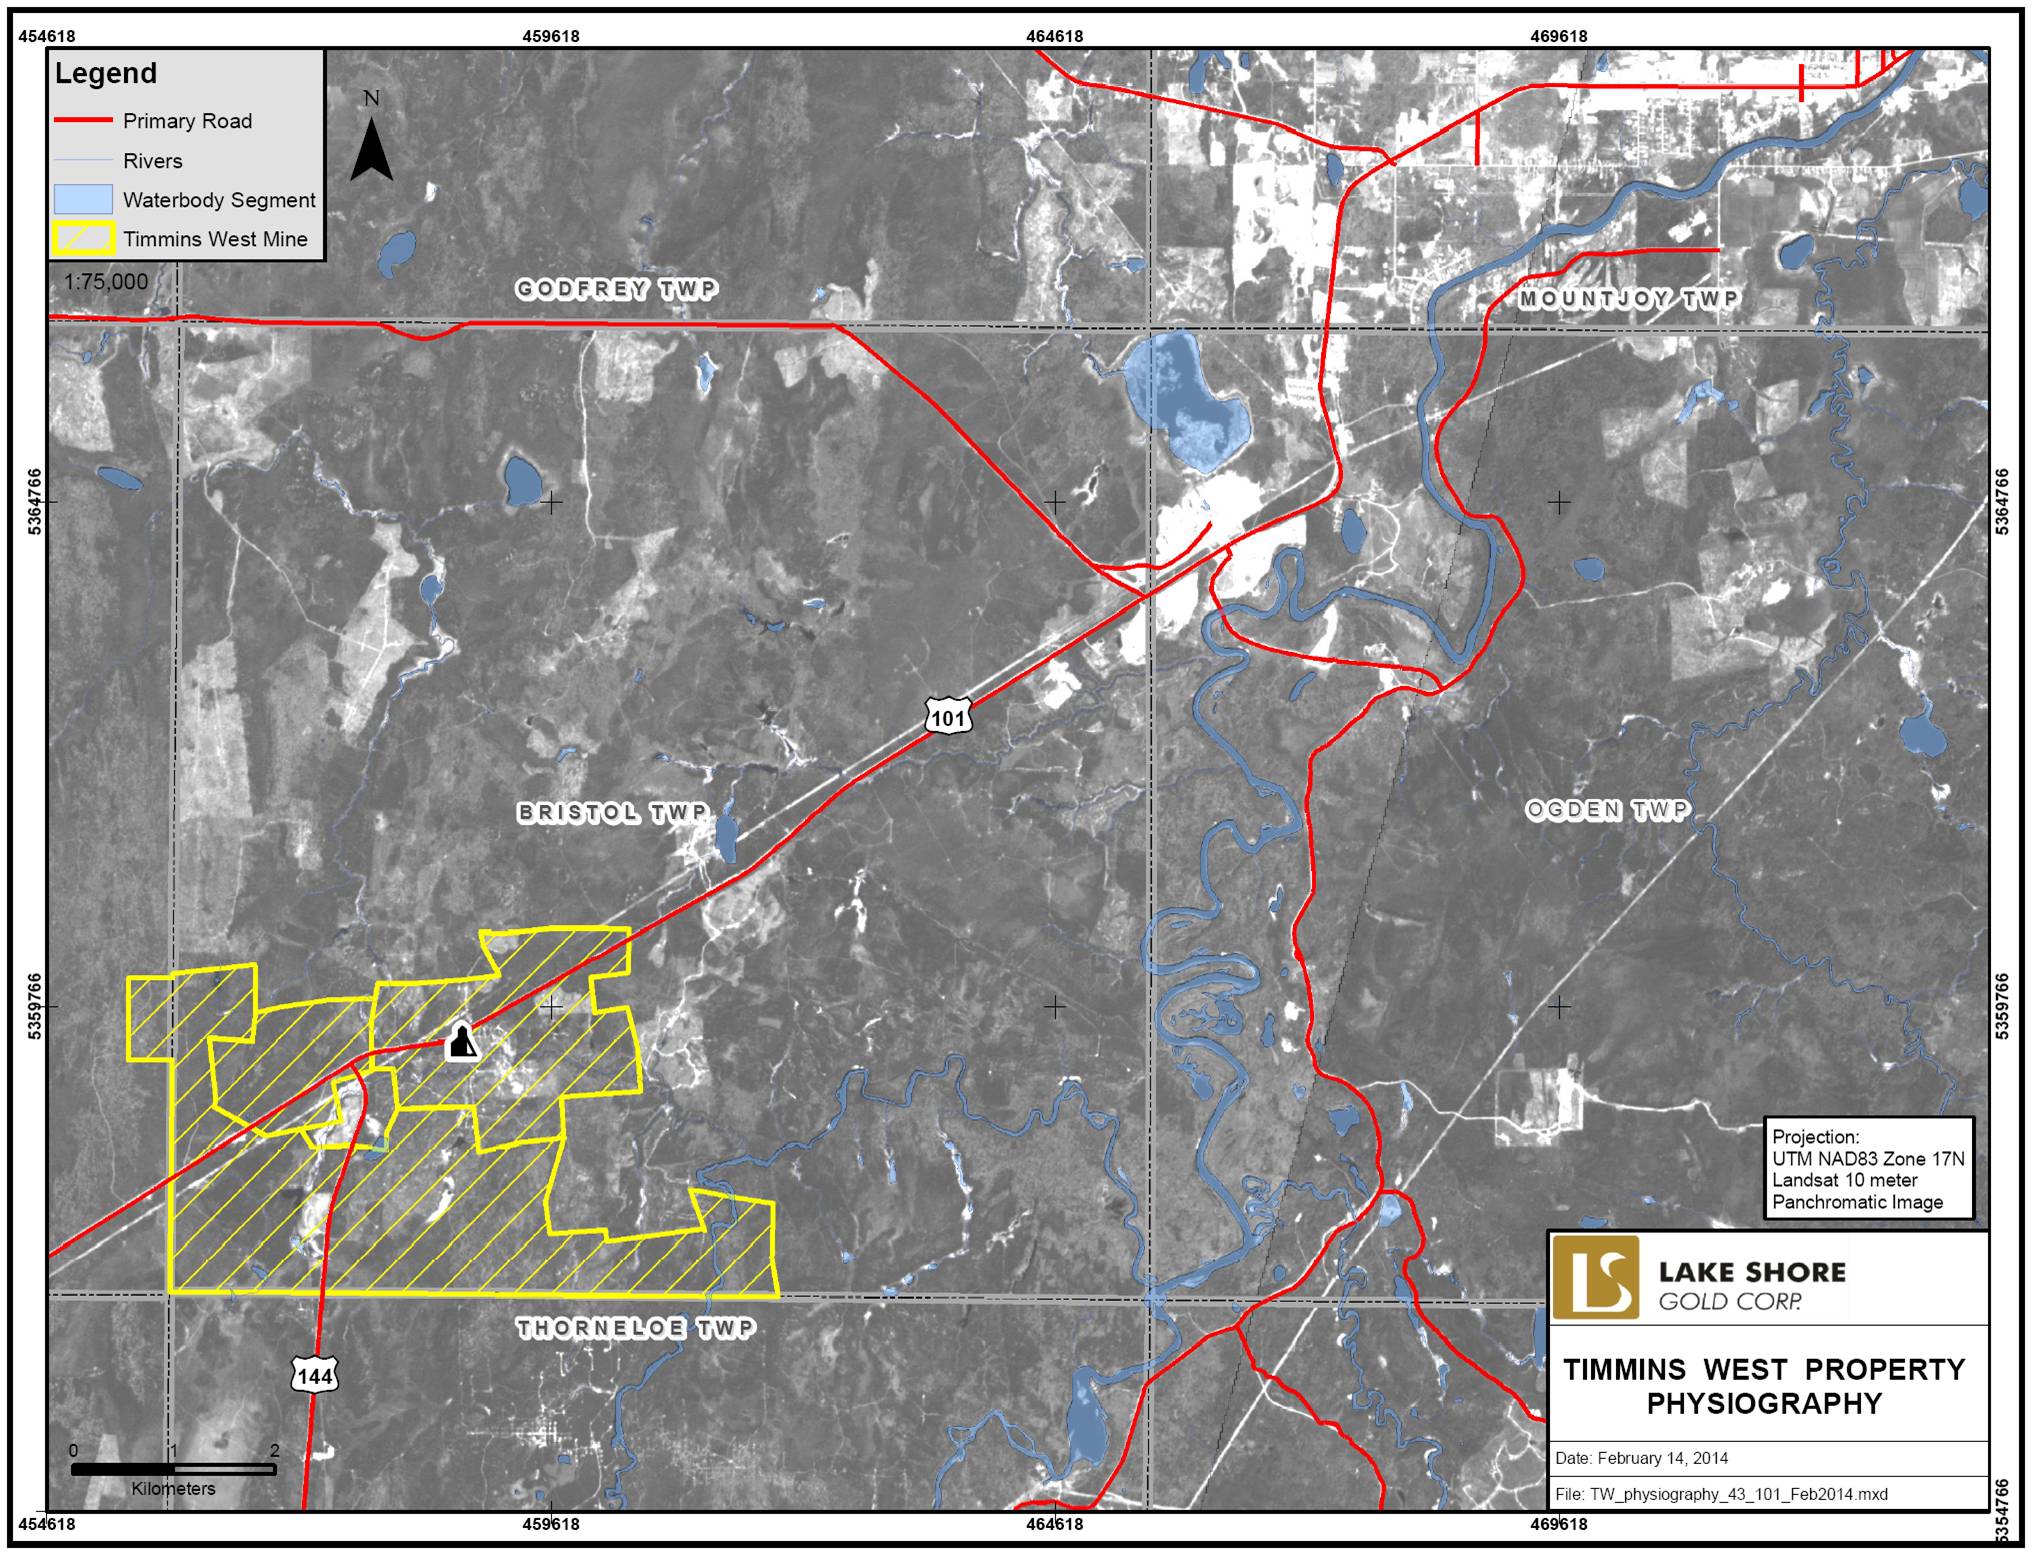
30
6.0 HISTORY
6.1 PRIOR OWNERSHIP
Lake Shore Gold Corp. (LSG) acquired the Timmins West Mine property by fulfilling the earn-in requirements as set out in option agreements with Holmer Gold Mines Limited and West Timmins Mining Inc. (formerly Band-Ore Resources Limited and Sydney Resources Ltd.), and by completing business combination agreements with those companies. Holmer Gold Mines Limited became a wholly-owned subsidiary of LSG in December 2004, and West Timmins Mining Inc. became a wholly-owned subsidiary in November 2009.
6.2 GENERAL HISTORY
The discovery of gold in Bristol Township on the McAuley-Brydge property (currently LSG’s Timmins West Mine) occurred in 1911. At the time, only a few claims were staked within the Bristol Township area. The 1912 geology map (ARM-21a) by A.G. Burrows and W.R. Rogers illustrated three claims (TC612, TC613, and TC614) at the McAuley-Brydge occurrence plus four claims in the vicinity of the Rusk occurrence (HR1187, HR1188, HR1189, and HR1191). Map ARM-21a illustrates only one patented claim in the Gold River mineralized trend area. Claim HR 1257, straddles the Tatachikapika River which divides the Gold River West from the Gold River East mineralized zones on LSG’s Gold River property. At that time, a small cluster of claims surrounded the power dam at Wawaitin Falls. The building of the power dam resulted in flooding the Mattagami River and forming of Kenogamissi Lake. Access to the Tatachikapika River was via a couple of portages west from Kenogamissi Lake.
The 1911 fire storms swept large parts of Carscallen, Bristol and Ogden Townships. The surface plants at Hollinger, Dome, West Dome, Vipond, Standard, Preston, East Dome, and North Dome mines were completely destroyed. South Porcupine, parts of Pottsville and the north part of Porcupine were also destroyed (Burrows, A.G., 1915, Hawley, J.E., 1926).
The following table (Table 6.1) highlights the chronology of significant exploration and provincial geological survey mapping events, surveys, and reports carried out over and surrounding the Timmins West Mine area.
TABLE 6.1: CHRONOLOGY OF EVENTS FOR THE TIMMINS WEST MINE AREA
Date | | Description |
1911 – 1914 | | Gold was discovered on the McAuley-Brydge property and two shafts were sunk; the deepest was 12 metres deep (Timmins Mine original surface showing - Main Zone and Hangingwall Veins). |
| | |
1912 | | Ontario Bureau of Mines published map ARM-21a Map of the Porcupine Gold Area, District of Timiskaming, A.G. Burrows and W.R. Rogers. |
| | |
1926 | | Ontario Bureau of Mines published map ARM35G, The Townships of Carscallen, Bristol, Ogden, District of Cochrane, Ontario, Annual Report Map, J. E. Hawley. |
| | |
1927 | | Ontario Department of Mines published Annual Report Volume ARM35-06.001, Geology of Ogden, Bristol, and Carscallen Townships, Cochrane District, J. E. Hawley. |
| | |
1938 – 1944 | | Orpit Mines Limited acquired the claims and diamond drill 7,620 metres of core. |
31
Date | | Description |
1941 | | Rusk Porcupine Mines excavated several pits and trenches across a 150 metre to 200 metre area of the Thunder Creek portion of the property. The gold discovery pit was 1.2 metres x 1.2 metres and returned values of $24.85 over 121.9 cm, $15.05 over 76.2 cm and $8.41 over 91.4 cm (T-File 542). The 1941 London Fix average price for gold was $33.85 (US) an ounce. Eighteen diamond drill holes totaling 1,981 metres were also completed. |
| | |
1945 | | Piccadilly Porcupine Mines acquired the property and complete 4,983 metres of diamond drilling. |
| | |
1946 | | Gold is reported from a diamond drill hole to the northwest of the Timmins West Mine on the O’Shea claim group (now referred-to as the Meunier-144 property). |
| | |
1953 | | Standwell Oil and Gas Ltd. acquired the property. |
| | |
1957 | | Ontario Department of Mines published map 1957-07, Bristol Township, District of Cochrane, S.A. Ferguson. |
| | |
1958 | | Hollinger Mines Ltd. completed seven diamond drill holes in the northern portion of the Thunder Creek property area. No assays were reported. |
| | |
1959 | | Ontario Department of Mines published Annual Report Volume ARV66-07, Geology of Bristol Township, Annual Report Volume S.A. Ferguson. |
| | |
1959 | | Ontario Department of Mines published preliminary map P0029, Thorneloe Township, S.A. Ferguson, W.D. Harding. |
| | |
1959 | | Paul Meredith purchased the “Standwell Oil” property. |
| | |
1963 | | The property is transferred to Holmer Gold Mines Ltd. |
| | |
1964 | | United Buffadisson Mines Limited optioned the property from Holmer; constructed a road from Highway 101 to the Main Showing, and completed ten boreholes (2,116 metres). United Buffadison Mines Limited interpreted the gold mineralization to be associated with stacked north dipping en-echelon quartz veins. The property was returned to Holmer Gold Mines Ltd. |
| | |
1968 – 1981 | | Holmer diamond drilled 45 boreholes totaling 10,512 metres. The geological interpretation of the day indicated two mineralized zones: the “Main” Zone (also referred to as the “Western Zone”) and the “Shaft” Zone (also referred to as the “Eastern Zone”). A historically significant, but non 43-101 compliant “probable reserve” of 720,000 tons grading 0.124 oz per ton gold (653,000 tonnes grading 4.25 grams per tonne gold) was estimated. Additional surface exploration included ground geophysical surveys (magnetometer and VLF) and limited diamond drilling. |
| | |
1980 | | Falconbridge Nickel Mines Ltd. carried out metallurgical analysis of samples provided by Jim Croxall for the Thunder Creek property. |
| | |
1980 | | Ontario Geological Survey published preliminary map P2360, Quaternary geology of the Timmins Area, District of Cochrane, C.M Tucker, D. Sharpe. |
| | |
1981 | | Preussag Canada Limited completed geophysical surveys in Bristol and Thorneloe Townships including magnetometer, VLF-EM, HLEM and Induced Polarization (“IP”). Ten diamond drill holes (613.9 metres) were bored. Adjacent holes, 64 metres apart, intersected 2.57 grams gold per tonne 2.43 metres, and 4.46 g/tonne gold over 4.6 metres in an area of the Rusk Showing. |
| | |
1982 | | Ontario Geological Survey published map, M2455, Timmins, Precambrian Geology, Map, D. R. Pyke. |
| | |
1982 | | Ontario Geological Survey published preliminary map P2502, Precambrian geology of Thorneloe Township, District of Cochrane, A. G. Choudhry. |
| | |
1984 | | Noranda Exploration Company Limited (N.P.L.), (Norex) optioned the Holmer property and completed a “regional” airborne magnetic and electromagnetic survey, follow-up ground geophysics, and drilled four boreholes totaling 1,465 metres. Norex interpreted a historically significant, non 43-101 compliant, resource estimate of 785,000 tonnes grading 2.4 grams per tonne gold. This included a core of better grade mineralized material estimated to be 159,000 tonnes grading 4.46 grams per tonne gold. The property was returned to Holmer. |
32
Date | | Description |
1984 – 1985 | | Noranda Exploration Company Ltd. (N.P.L) also completed geological mapping, humus geochemical sampling, and outcrop mechanical stripping and trenching in the Thunder Creek property area. The best assays returned in the trenching were 2.86 g/tonne Au and 5.54 g/tonne Au. Nine overburden, reverse circulation drilling and three diamond drill holes (332.3 metres) were also completed with no assay results reported. |
| | |
1987 | | Chevron Minerals Ltd. optioned the Holmer property and completed line cutting, ground geophysics (magnetic, VLF, IP surveys), and geological mapping. A large area of the Main Zone and Hangingwall Veins was stripped, channel sampled and mapped. Twenty-nine diamond drill holes (6,115 metres) were completed testing the mineralization to a vertical depth of 360 metres. The property was returned to Holmer. |
| | |
1987 | | Highwood Resources Ltd. optioned a portion of the Thunder Creek property from J. Croxall. Four diamond drill holes (400 metres) testing geophysical targets were bored. No assay results are reported. |
| | |
1989 | | Ontario Geological Survey published open file report OFR5699, The Geology of Keefer, Denton and Thorneloe Townships, District of Cochrane, A. G. Choudhry. |
| | |
1992 | | Ontario Geological Survey published open file report OFR5829, Geology of the Kamiskotia Area, T.C. Barrie. |
| | |
1994 | | Noranda Exploration Company Ltd. (N.P.L.) carried-out line cutting, IP and ground magnetometer surveys in the Thunder Creek property area. A single diamond drill hole (302 metres) was completed with no assay results reported. |
| | |
1995 | | Hemlo Gold Mines Inc. funded the Thunder Creek area project and the work was carried out by Norex. Surveys include line cutting, magnetometer and IP. Seven diamond drill holes (95-2 to 95-8; 1,581 metres) were drilled with no significant assays reported. |
| | |
1996 | | Band-Ore Resources Ltd. makes gold discoveries on their Thorneloe property and renewed gold exploration in Bristol and Thorneloe townships. |
| | |
1996 – 1997 | | Holmer carried out an exploration program which included ground geophysics (VLF, magnetometer, and IP), humus sampling, geological mapping and rock sampling. A total of 66 drill holes (25,380 metres) were completed, 54 of which were directed to expand “resources” in the “Main” Zone area; 12 holes were drilled to test geophysical anomalies elsewhere on the property. |
| | |
1997 | | Battle Mountain Canada Limited continued to explore the Thunder Creek — Mahoney Creek area. Fourteen diamond drill holes (3,547 metres) tested stratigraphy and geophysical targets. Drill hole MC 97-20 returned an assay value of 5.9 g/tonne Au over 1 metre. Hole MC 97-26 intersected a few anomalies, including 1.28 g/tonne Au over 2 metres. The property was returned to Band-Ore. |
| | |
1998 | | Holmer Gold Mines Ltd. drilled 22 boreholes (3,923 metres) to test the continuity of mineralization at shallow depths. |
| | |
1999 | | St. Andrew Goldfields Ltd. (“St. Andrew”) drilled ten boreholes (1,341 metres) exploring the potential for an open pittable deposit. |
| | |
2000 | | Ontario Geological Survey published preliminary map P3396, Geology of the Kamiskotia Area, T. C. Barrie. |
| | |
2000 | | Ontario Geological Survey published study geological circular S059, Geology of the Kamiskotia Area, T. C. Barrie. |
| | |
2001 | | Ontario Geological Survey published preliminary map P2582 Quaternary Geology of the Dana, Lake Area, Cochrane, Timiskaming area, C. M. Tucker, J. A. Richard; Map M2660, Quaternary Geology of Dana Lake Area, Map, C. M. Tucker, J. A. Richard; Map M2662 Quaternary Geology of Timmins Area, C. M. Tucker, J. A. Richard; and Preliminary map P3436, Precambrian Geology, Timmins West, Bristol and Ogden Townships, C. Vaillancourt, C.L. Pickett, E. R. Dinel. |
33
Date | | Description |
2002 | | Ontario Geological Survey published open file report OFR6101, Toward a New Metamorphic Framework for Gold Exploration in the Timmins Area, Central Abitibi Greenstone Belt, P. H. Thompson. |
| | |
2002 | | Holmer completed a closely spaced, 25 metre centers, 22 hole diamond drill program totaling 5,220 metres. Holmer completed a Mineral Resource estimate which was audited and revisited by Watts, Griffis and McOuat as 422,000 tonnes grading13.68 grams per tonne gold in the Indicated category and 270,000 tonnes grading 9.0 grams per tonne gold in the Inferred category. |
| | |
2003 | | Lake Shore Gold Corp. (LSG) entered into an option agreement with Holmer Gold Mines Limited that allows Lake Shore to earn 50% of the Holmer property by May 26, 2006. In November 2003 Lake Shore enters into an agreement with Band-Ore Resources Ltd. to earn a 60% interest in the Thunder Creek property. |
| | |
2004 | | In September, LSG released an updated resource estimate (see Item 6.3) and thereby completed its earn-in option agreement with Holmer. In December, LSG acquired all outstanding shares of Holmer, giving it 100% ownership of the property, then referred-to as the Timmins Gold Project (currently hosting the “Timmins Deposit”). |
| | |
2005 | | Ontario Geological Survey published open file report OFR6155, Geological Setting of Volcanogenic Massive Sulphide Mineralization in the Kamiskotia Area, Discovery Abitibi Initiative, B. Hathway, G. Hudak, M. A. Hamilton; OFR6154, Overview of Results from the Greenstone Architecture Project, Discover Abitibi Initiative, J. Ayer et al.; and miscellaneous release — data MRD186, Integrated GIS Compilation of Geospatial Data for the Abitibi Greenstone Belt, Northeastern Ontario, Discovery Abitibi Initiative. |
| | |
2006 | | In May, the company initiated the application permit process for advanced underground exploration programs. In December, LSG released another updated resource estimate for the Timmins Gold Project (see Item 6.3). |
| | |
2007 | | In April 2007, the Company received government approval of the closure plan application and receipt of related permits required to proceed with the program. In August, LSG reported mineral reserves and a positive pre-feasibility study for the Timmins West Project (formerly named the “Timmins Gold Project”). In December, LSG also completed the requirements to vest a 60% interest in the Thunder Creek property from West Timmins Mining (formerly Band-Ore Resources Limited and Sydney Resources Corporation). |
| | |
2009 | | Adventure Gold Inc. completed three shallow drill holes (1,229 metres) on the Meunier-144 property. No significant results were reported. |
| | |
2009 | | In November, LSG acquired the outstanding shares of West Timmins Mining Inc., thereby acquiring 100% of the Thunder Creek property. This business combination triggered an update to the Mineral Resource and Mineral Reserve for the Timmins Deposit. The exploration emphasis of the Thunder Creek project changed from anomaly testing to systematic definition drilling. |
| | |
2010 | | LSG and RT Minerals Corp. (RTM) entered into an option agreement with Adventure Gold Inc. for each to earn-in 25% interest in the Meunier-144 property. A “deep drilling exploration program” targeting the extension at depth of the Timmins Deposit was completed (4,038 metres). Mineralization was weak and most significant results include 1.46 g/t Au over 1.60 metres, 2.26 g/t Au over 0.60 metres, and 1.34 g/t Au over 1.00 metre (see Item 9). Through some business arrangements in 2013, LSG now has a 50% vested interest in the property (see Item 4). LSG also has an option to increase its interest to 60% by completing a PEA. |
| | |
2011 | | Ontario Geological Survey published miscellaneous data — release MRD282 Geological Compilation of the Abitibi Greenstone Belt, J. A. Ayer, J. E. Chartrand; miscellaneous release — data MRD285 Lithogeochemical Data for Abitibi Subprovince Intermediate to Felsic Intrusive Rocks, G. P. Beakhouse; and open file report OFR6268 The Abitibi Subprovince Plutonic Record: Tectonic and Metallogenic Implications, G. P. Beakhouse. |
34
Date | | Description |
2011 | | In January, commercial production was declared for the Timmins Deposit. In November, LSG released an initial resource estimate for the Thunder Creek Project. |
| | |
2012 | | In January, commercial production was declared for the Thunder Creek Deposit. Subsequently, the Timmins and Thunder Creek Deposits were combined into a single operation called the Timmins West Mine. In March, LSG filed an updated mineral resource estimate for the Timmins Deposit, including a Preliminary Economic Assessment (PEA) for the Timmins West Mine. In May, LSG released a Pre-feasibility Study and Mineral Reserves (see Item 6.3). |
| | |
2013 | | In March, LSG reported updated reserve and resource estimates for the Timmins West Mine (see Item 6.3). |
6.3 HISTORICAL RESOURCE ESTIMATES
6.3.1 Historically Significant Resource Estimates
The following mineralization estimates were not reported in accordance with NI 43-101 or estimated by a Qualified Person (QP), but are considered historically significant in keeping exploration interest active and continuing to entice companies to explore and better define, and outline the gold bearing system at the Timmins West Mine. These estimates have not been validated, are not considered to be current, and are quoted from the documents referenced.
1946: | | The earliest record found to attempt a mineralization estimate is stated in Ontario Department of Mines, Mineral Resource Circular No. 13, p. 50, which references Survey of mines 1946, p 152. Describes the Orpit property: “Results of drill holes 32, 41, 42, 45, and 46 indicated a zone of 200 feet in length, 50 feet in width, which averaged 0.16 ounces of gold per ton. Indicated reserves were estimated at 300,000 tons between a depth of 400 feet and 800 feet.” |
1968-1981: | | Holmer Gold Mines Ltd. estimated a “probable reserve” of 720,000 tons grading 0.124 oz per ton gold (653,000 tonnes grading 4.25 grams per tonne gold) (WGM, 2004). |
1984: | | Norex interpreted a resource estimate of 785,000 tonnes grading 2.4 grams per tonne gold. This includes a core of better grade mineralized material estimated to be 159,000 tonnes grading 4.46 grams per tonne gold (WGM, 2004). |
6.3.2 Resource Estimates Reported in Accordance with NI 43-101 and Estimated by a QP
In 2002, a Mineral Resource estimate completed by Holmer and audited and revised by Watts, Griffis and McOuat Limited (WGM) included 422,000 tonnes grading 13.7 grams gold per tonne (g/t) gold in the indicated category and 207,000 tonnes grading 9.0 g/t in the Inferred category (WGM, 2004)
In 2004, WGM audited a Mineral Resource estimate prepared by LSG. WGM revised the resource estimate by lowering the cap on high assays in the Footwall Zone and transferring some Indicated Resource blocks into the Inferred category. The estimate used a 6.0 g/t Au cut-off, and a 50 g/t cap (except in the Footwall Zone where a 30 g/t Au cap was used). The estimate included an Indicated Resource of 1,369,000 tonnes grading 10.9 g/t gold (cut grade) and 16.5 g/t gold (uncut grade), with an Inferred Resource of 200,000 tonnes grading 8.7 g/t gold (cut grade) and 12.4 g/t gold (uncut grade), and an additional Inferred Resource grading between 3.0 and 6.0 g/t is 1.0 Mt at 4.1 g/t gold. Total contained ounces with a cut grade of 6.0 g/t Au in the Inferred and Indicated categories was estimated to be 538,000 ounces gold, (804,000 ounces gold uncut), (WGM, 2004).
35
In November 2006 WGM audited an updated Mineral Resource estimate prepared by LSG. The audit validated the assay data, the construction of polygons, and the resulting tonnages and grade. The estimated Indicated and Inferred Mineral Resources for the Timmins West Mine on October 31, 2006, are summarized in Table 6.2.
TABLE 6.2: WGM MINERAL RESOURCE ESTIMATE, OCTOBER 31, 2006
Classification / | | Grade Cut to 3.0 g/t Au | | Contained Gold | | Uncut Grade | | Top Cut Grade | |
Zone | | Tonnes | | Grade (g/t) | | (ounces) | | (g/t) | | (g/t) | |
Indicated | | | | | | | | | | | |
Vein Zone | | 346,000 | | 9.9 | | 110,000 | | 17.6 | | 50 | |
Footwall Zone | | 1,185,000 | | 7.3 | | 277,100 | | 7.6 | | 30 | |
Ultramafic Zone | | 1,737,000 | | 9.3 | | 517,600 | | 14.5 | | 50 | |
Total Indicated | | 3,268,000 | | 8.6 | | 905,000 | | 12.3 | | | |
| | | | | | | | | | | |
Inferred | | | | | | | | | | | |
Vein Zone | | 543,000 | | 5.7 | | 99,100 | | 7.3 | | 50 | |
Footwall Zone | | 340,000 | | 5.9 | | 65,000 | | 6.3 | | 50 | |
Ultramafic Zone | | 85,000 | | 3.9 | | 10,600 | | 3.9 | | 50 | |
Total Inferred | | 968,000 | | 5.5 | | 174,700 | | 5.8 | | | |
*Note: Inferred Mineral Resources are reported in addition to Indicated Mineral resources (WGM, 2007).
In 2000, SRK Consulting Canada Inc. estimated the Probable Mineral Reserve at 3,387,000 tonnes grading an average 7.6 g/t Au, containing 826,000 oz gold.
In August 2009 LSG and West Timmins Mining Inc. agreed to a business combination which triggered an update to the NI 43-101 Technical Report on the project. The 2009 update is summarized in Table 6.3.
TABLE 6.3: LSG UPDATED MINERAL RESOURCE OF SRK POLYGONAL RESOURCE AND STANTEC MINERAL RESERVE, AUGUST 2009 (DARLING ET AL., 2009)
| | Grade Cut to 3.0 g/t Au | | Contained Gold | | Uncut Grade | |
Classification | | Tonnes | | Grade (g/t) | | (ounces) | | (g/t) | |
Indicated Resource | | 3,200,000
| | 8.6
| | 893,000
| | 12.2
(1,278,000 oz gold) | |
Inferred Resource | | 890,000 | | 5.7 | | 165,000 | | | |
Probable Mineral Reserve | | 3,358,000 | | 7.5 | | 812,006 | | | |
In November 2011 the first Mineral Resource estimate was completed for the Thunder Creek Deposit of the Timmins West Mine and is summarized in Table 6.4.
TABLE 6.4: LSG INITIAL MINERAL RESOURCE ESTIMATE FOR THE THUNDER CREEK DEPOSIT
(CRICK ET AL., 2011)
| | | | Grade Cut to 2.0 g/t Au | | Contained Gold | |
Deposit | | Resource Classification | | Tonnes | | Grade (g/t) | | (ounces) | |
Thunder Creek | | Indicated | | 2,877,000 | | 5.6 | | 521,600 | |
| | Inferred | | 2,693,000 | | 5.9 | | 510,000 | |
36
In February 2012, LSG released a Preliminary Economic Assessment (PEA) and updated resource estimate for the Timmins West Mine, combining the Timmins and Thunder Creek Deposits as summarized in Table 6.5.
TABLE 6.5: LSG UPDATED MINERAL RESOURCE ESTIMATE FOR TIMMINS WEST MINE
(CRICK ET AL., 2012A)
| | | | Capped Grade | | Contained Gold | |
Deposit | | Resource Classification | | Tonnes | | Grade (g/t) | | (ounces) | |
Timmins | | Indicated | | 2,949,000 | | 6.3 | | 600,900 | |
| | Inferred | | 1,579,000 | | 5.5 | | 281,500 | |
Thunder Creek | | Indicated | | 2,877,000 | | 5.6 | | 521,600 | |
| | Inferred | | 2,693,000 | | 5.9 | | 510,000 | |
Total Timmins West Mine | | Total Indicated | | 5,826,000 | | 6.0 | | 1,122,500 | |
| | Total Inferred | | 4,272,000 | | 5.8 | | 791,500 | |
*Notes:
1. Cut-off grade of 1.5 g/t Au for the Timmins Deposit, and 2.0 g/t Au for the Thunder Creek Deposit.
2. Effective Date of October 28, 2011 for Thunder Creek Deposit, and January 31 2012 for the Timmins Deposit.
In May 2012, a Pre-feasibility Study and Mineral Reserve estimate was released. The reserves were based on indicated resource material included in revised block models prepared by LSG and validated by SGS Geostat. The mineral reserve estimate is summarized in Table 6.6.
TABLE 6.6: LSG MINERAL RESERVE AND INDICATED RESOURCE ESTIMATE FOR TIMMINS WEST MINE (CRICK ET AL., 2012B)
| | | | Capped Grade | | Contained Gold | |
Deposit | | Classification | | Tonnes | | Grade (g/t) | | (ounces) | |
Timmins Deposit | | Probable Reserve | | 2,249,658 | | 5.6 | | 405,885 | |
Thunder Creek | | Probable Reserve | | 2,672,522 | | 4.9 | | 417,963 | |
Total Timmins West Mine | | Total Probable Reserve | | 4,922,180 | | 5.2 | | 823,848 | |
| | | | | | | | | |
Timmins Deposit | | Indicated Resource | | 2,124,000 | | 7.9 | | 541,700 | |
Thunder Creek | | Indicated Resource | | 2,053,000 | | 7.0 | | 463,000 | |
| | | | | | | | | |
Total Timmins West Mine | | Total Indicated Resource | | 4,177,000 | | 7.5 | | 1,004,700 | |
*Notes:
1. Cut-off grade of 3.0 g/t Au.
2. Effective Date of October 28, 2011 for Thunder Creek Deposit, and January 31 2012 for the Timmins Deposit.
3. Indicated Resources are inclusive of Reserves.
37
In March 2013, LSG published another updated reserve and resource estimate in connection with the filing of its 2012 Annual Information Form. The results are summarized in Table 6.7.
TABLE 6.7: LSG MINERAL RESERVE AND RESOURCE ESTIMATE FOR TIMMINS WEST MINE, AT YEAR-END 2012 (AIF 2012; PRESS RELEASE DATED MARCH 18, 2013)
| | | | Capped Grade | | Contained Gold | |
Deposit | | Classification | | Tonnes | | Grade (g/t) | | (ounces) | |
Total Timmins West Mine | | Probable Reserve | | 4,811,000 | | 5.2 | | 798,000 | |
| | Indicated Resource | | 5,978,000 | | 5.5 | | 1,061,000 | |
| | Inferred Resource | | 3,549,000 | | 5.4 | | 615,000 | |
*Notes:
1. Cut-off grade of 3.0 g/t Au.
2. Indicated Resources are inclusive of Reserves.
3. Reserves account for a depletion of 64,177 ounces in 2012.
6.4 HISTORIC PRODUCTION
Prior to March 2009 there was no production activity at the Timmins West Mine. Annual production figures for the Timmins West Mine from March 2009 to December 31, 2013 (including both the Timmins and Thunder Creek deposits) are summarized in Table 6.8 and Table 6.9.
TABLE 6.8: TIMMINS DEPOSIT ANNUAL PRODUCTION FIGURES
Year | | Deposit | | Milled
Tonnes | | Grade (g/t) | | Contained
Ounces | |
2009 | | Timmins | | 72,899 | | 3.3 | | 7,745 | |
2010 | | Timmins | | 261,294 | | 5.3 | | 44,492 | |
2011 | | Timmins | | 337,582 | | 3.8 | | 41,673 | |
2012 | | Timmins | | 264,545 | | 3.8 | | 32,564 | |
2013 | | Timmins | | 313,679 | | 5.0 | | 50,170 | |
Totals | | Timmins | | 1,249,999 | | 4.4 | | 176,644 | |
TABLE 6.9: THUNDER CREEK ANNUAL PRODUCTION FIGURES
Years | | Deposit | | Milled
Tonnes | | Grade (g/t) | | Contained
Ounces | |
2010 | | Thunder Creek | | 2,824 | | 5.4 | | 490 | |
2011 | | Thunder Creek | | 154,141 | | 3.9 | | 19,549 | |
2012 | | Thunder Creek | | 272,402 | | 3.9 | | 33,748 | |
2013 | | Thunder Creek | | 433,810 | | 4.4 | | 61,141 | |
Totals | | Thunder Creek | | 863,177 | | 4.1 | | 114,928 | |
38
7.0 GEOLOGICAL SETTING AND MINERALIZATION
7.1 REGIONAL GEOLOGY AND STRUCTURE
Supracrustal rocks in the Timmins region are assigned as members of nine tectonic assemblages within the Western Abitibi Subprovince, of the Superior Province. The seven volcanic and two sedimentary assemblages are of Archean age. Intrusions were emplaced during Archean and Proterozoic times. Tectonic Assemblages of the Abitibi Subprovince, east of the Kapuskasing Structural Zone, are illustrated in Figure 7.1 after Ayer J.A., Dubé, B., and Trowell, N.F. (2009). Table 7.1, is modified after Ayer (1999, 2000, 2003, 2005, 2011) and summarizes the characteristics of the assemblages, from youngest to oldest.
There is 80 Ma year time span between the volcanic eruption of the lower Pacaud assemblage (2750 Ma) to the sedimentation and volcanism of the upper Timiskaming assemblage (2670 Ma). Each of the assemblages demonstrates a melt evolution from komatiitic or tholeiitic basalt, to felsic or calc-alkaline volcanics. In the Timmins West Mine area, only the Deloro [2730 – 2724 Ma (6 Ma)], Kidd-Munro [2719 – 2711 Ma (8 Ma)], Tisdale [2710 – 2704 Ma (6 Ma)], Porcupine [2690 – 2685 Ma (5 Ma)], and Timiskaming assemblages [2676 – 2670 Ma (6 Ma)] are present. Revised age dates for the Porcupine assemblage indicate that the felsic volcanism of the Krist Formation is coeval with emplacement of calc-alkalic felsic porphyries in Timmins (2692 ±3 to 2688 ±2 Ma).
Figure 7.2 locates the property relative to the regional geology.
Rhys (2010, 2011) has modified the regional structural history interpretation by adding an additional deformation period (D2) to the earlier folding preceding the Timiskaming assemblage. The interpretation demonstrates that there are at least two pre-Timiskaming fold events (D1 and D2), followed by two dominant syn-metamorphic, post-Timiskaming foliation forming events (D3 and D4) and a later crenulation cleavage (D5) (Rhys, 2010).
Regionally, deformation in the Timmins area is characterized by a sequence from early, pre-metamorphic folds lacking axial planar cleavage (D1 and D2) to a series of syn-metamorphic, fabric–forming events, which overprint the earlier folds (D3 and D4 events). The multi-phase Destor-Porcupine fault system passes approximately 5 kilometres to the south of the property. The fault system is a composite corridor of shear zones and faults that records at least two main stages of displacement: syn-Timiskaming (2680-2677 Ma) brittle faulting associated with truncation of early D1 and D2 folds, apparent sinistral displacement, and formation of half grabens that are locally filled with Timiskaming clastic sedimentary rocks; and syn-metamorphic D3-D4 formation of high strain zones over a broad corridor generally several hundred metres wide generally corresponding with, or developed south of, the trace of the older faults. These shear zones record variable kinematic increments but are regionally dominated by sinistral with north side up displacements (Rhys, 2010).
39
FIGURE 7.1: TECTONIC ASSEMBLAGES OF THE ABITIBI SUBPROVINCE EAST OF THE KAPUSKASING STRUCTURAL ZONE (AFTER AYER, J.A., DUBÉ, B., TROWELL, N.F.; NE ONTARIO MINES AND MINERALS SYMPOSIUM, APRIL 16, 2009)
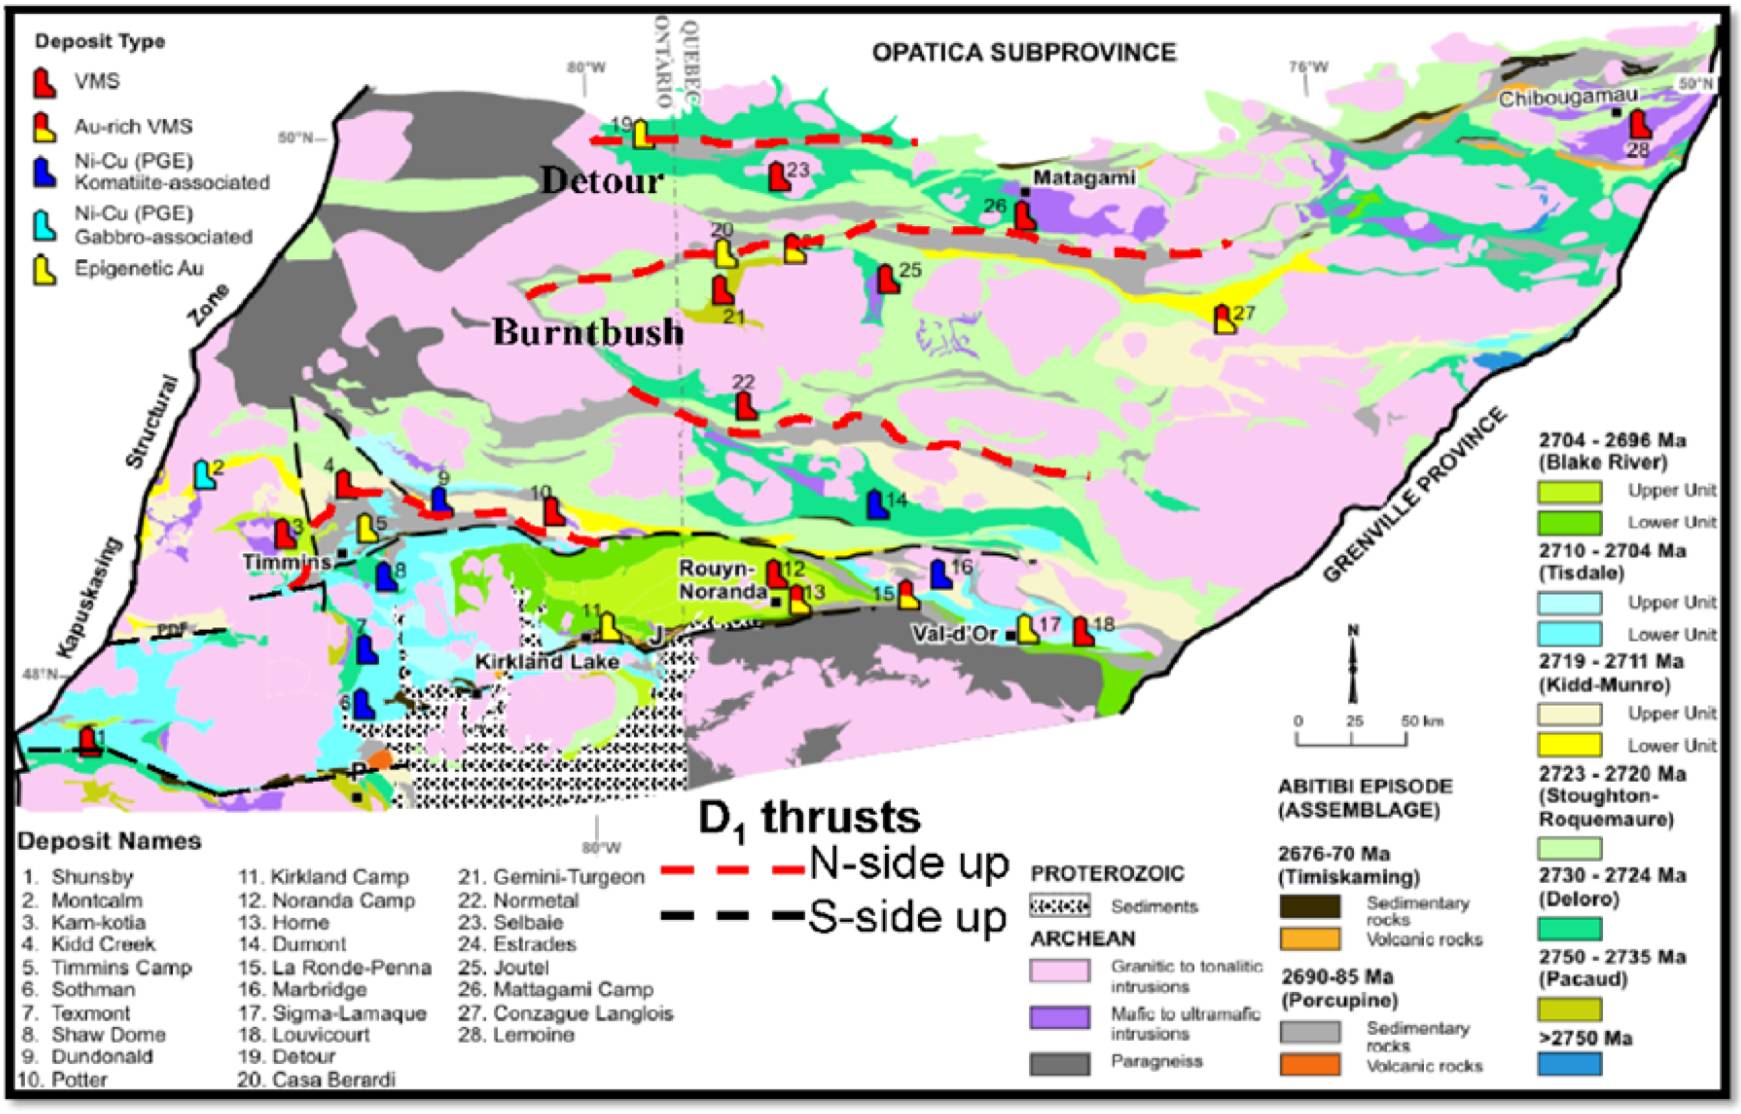
40
TABLE 7.1: TECTONIC ASSEMBLAGES
Assemblages | | Description |
Timiskaming Assemblage | | · Unconformably deposited from 2676- 2670 Ma (6 Ma) · Conglomerate, sandstone, and alkalic volcanics · Coeval Gold mineralization occurs near regional fault zones (PDF & CLLF) Two end member types 1. Quartz veins (Timmins & Val d’Or) 2. Sulphide rich Stockworks (Holloway Twp., Kirkland Lake, Matachewan · Alkali Intrusive Complex (Thunder Creek) 2687 ±3Ma (Barrie, 1992) |
| | |
Porcupine Assemblage | | · Age of 2690 — 2685 Ma (5 Ma) · Turbidites with minor conglomerates & iron formation locally · Krist Formation is coeval with calc-alkalic felsic porphyries 2691 ±3 to 2688 ±2 Ma |
| | |
Blake River Assemblage | | Upper and Lower Units · Age of 2703 — 2696 Ma (7 Ma) · Tholeiitic & Calc-alkaline mafic to felsic volcanics · VMS deposits associated with F3 felsic volcanics at Noranda · Syngenetic gold & base metals (Horne, Thompson Bousquet) |
| | |
Tisdale Assemblage | | · Age of 2710 — 2704 Ma (6 Ma) · Tholeiitic to komatiite suite · Calc-alkaline suite · VMS Deposit: Kamiskotia — tholeiitic volcanics, gabbros & F3 felsics
Val d’Or — calc-alkaline volcanics & F2 felsics
Sheraton Township area — intermediate-felsic calc-alkaline volcanics · Ni-Cu-PGE: Shaw Dome, Texmont, Bannockburn |
| | |
Kidd-Munro Assemblage | | · Age of 2719 — 2711 Ma (8 Ma) · Tholeiitic to komatiitic · Calc-alkaline suite · VMS deposit: F3 felsic volcanics & komatiites (Kidd Creek)
Tholeiitic-Komatiitic volcanism (Potter) · Ni-Cu-PGE (Alexo) |
| | |
Stoughton-Roquemaure Assemblage | | · Age of about 2723 — 2720 Ma (3 Ma) · Magnesium and iron rich tholeiitic basalts · Localized komatiites and felsic volcanics · PGE mineralization in mafic-ultramafic intrusions and komatiites
(Mann & Boston Townships) |
| | |
Deloro Assemblage | | · Age of about 2730 — 2724 Ma (6 Ma) · Mafic to felsic calc-alkaline volcanics · Commonly capped by regionally extensive chemical sediments · Two different types of VMS deposits 1. F2 felsic volcanics and synvolcanic intrusion (Normetal) 2. Localized sulfide-rich facies in regional oxide facies iron formations (Shunsby) |
| | |
Pacaud Assemblage | | · Age of 2750 — 2735 Ma (15 Ma) · Magnesium and iron rich tholeiitic basalt · Localized komatiites and felsic volcanics |
41
FIGURE 7.2: REGIONAL GEOLOGY
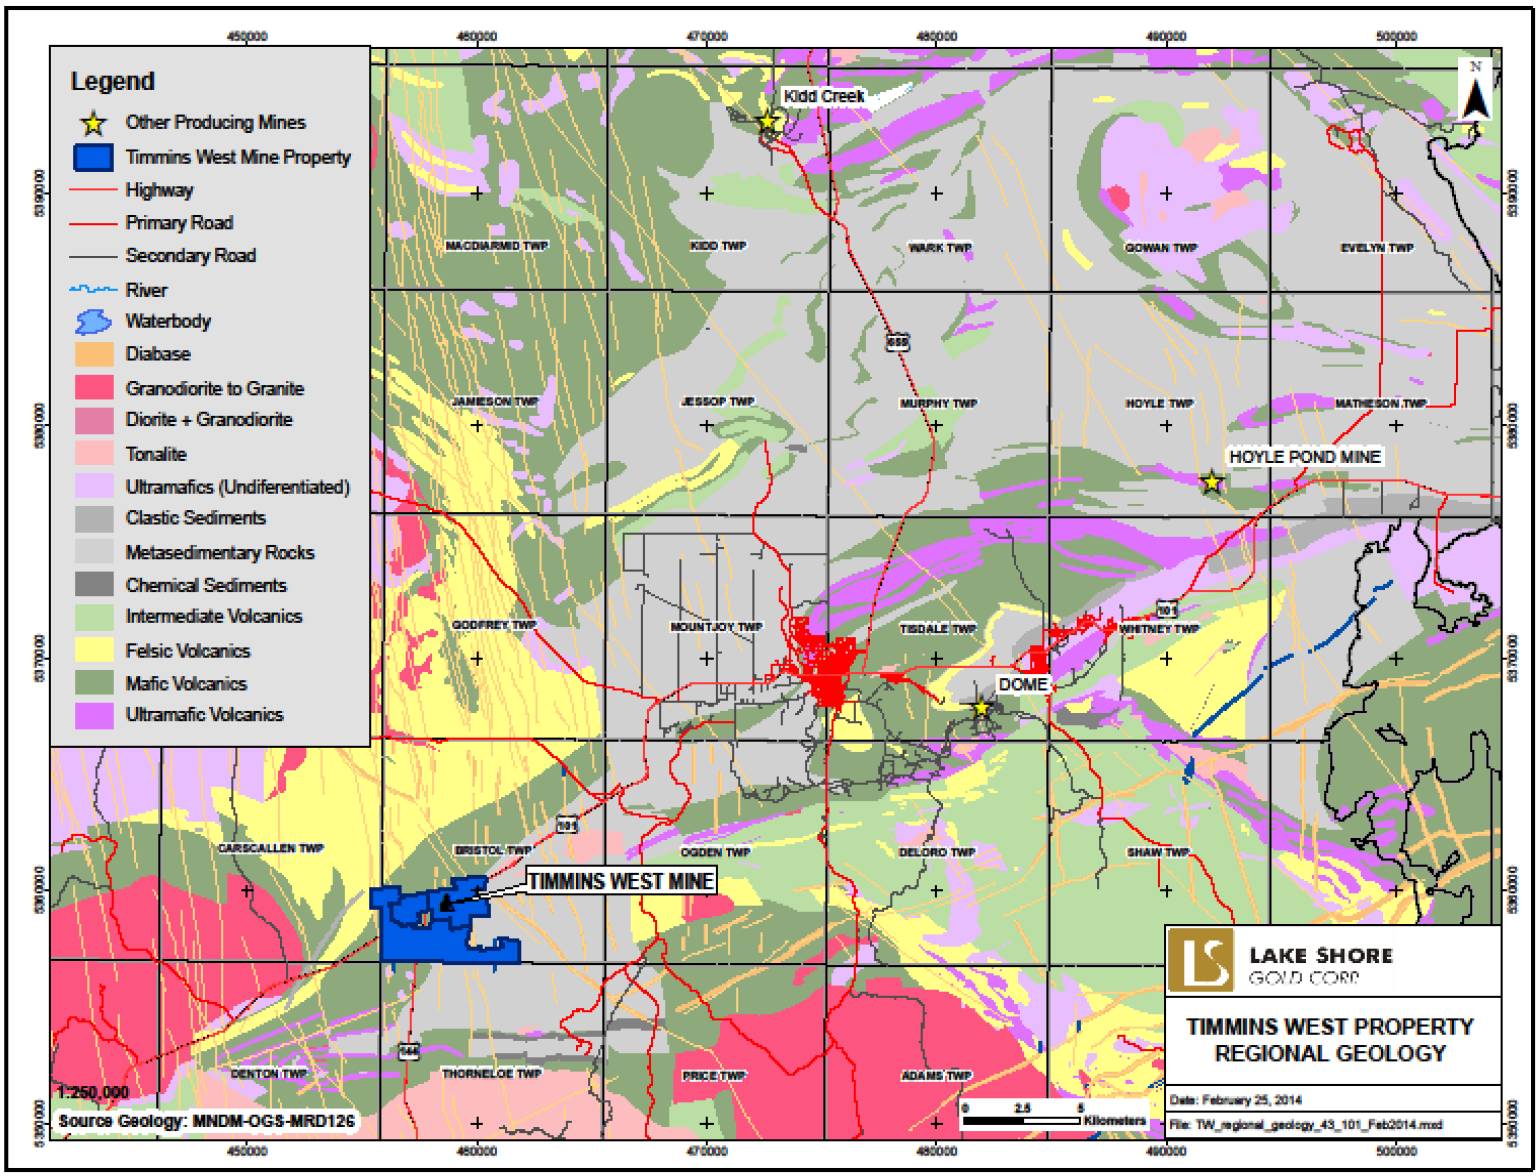
42
7.2 PROPERTY GEOLOGY
7.2.1 Timmins Mine Portion of the Timmins West Mine
Geological understanding of the Timmins West Mine Deposits has evolved from a number of studies carried out under the direction of LSG geological staff. Some of the most comprehensive studies and reports have been completed by Mr. David Rhys (P. Geo.) of Panterra Geoservices Inc. The following description is a summary of observations by both company geologists and outside consultants such as Mr. Rhys.
The TWM area lies along the northeast trending contact zone between southeast facing mafic metavolcanic rocks of the Tisdale Assemblage, to the northwest, and unconformably overlaying, dominantly southeasterly facing metasedimentary rocks of the Porcupine Assemblage to the southeast. The contact dips steeply to the northwest, and is modified and locally deflected by folds and shear zones that are associated with gold mineralization. Along and within several hundred metres of the contact area, several intrusions intrude mainly the mafic metavolcanic sequence between the Timmins Deposit and the southwestern parts of the Thunder Creek property. These include: a southwesterly-widening alkaline ultramafic set of metamorphosed intrusions comprised dominantly of pyroxenite which occur along the mafic —metasedimentary rock contact or intruding the mafic metavolcanic rocks adjacent to the contact and which are termed the “alkaline intrusive complex”; and fine-grained, equigranular to locally K-feldspar porphyritic intrusions which are dominantly monzonite but may range to syenite in composition. The latter include a lenticular, northeast trending unexposed body in the Porphyry Zone adjacent to the mafic-sedimentary contact in the Rusk area, and a more irregularly shaped stock to the south which intrudes the Porcupine Assemblage here termed the “Thunder Creek Stock” (Rhys, 2010).
The Holmer Shear Zone is a key structural feature that can be has been interpreted from drill core and surface mapping. It strikes east-west, dips steeply north and in surface mapping hosts the Main Zone gold mineralization. The patterns of distribution of the Holmer Shear Zone are more complex than suggested by Rhys in 2003, and the Shear Zone is affected by significant folding associated with D4 strain. On 140 metre Level, the most intense area of high strain, which is interpreted to represent the down-dip extent of the Holmer Shear Zone from the surface showing, occur along the Main Zone are folded megascopically, defining a large fold closure with plunges north-northwest. The Shear Zone here comprises an approximately 20 to 30 metre wide, intensely S3 foliated phyllonitic sedimentary contact. Consistent textures of compositional laminations, grain size laminations, higher sericite composition that the surrounding mafic rocks, and potential relic primary fragmental textures suggest that the high strain zone may be localized along an inter-flow sedimentary-fragmental unit. Strain is most intense in this potential clastic unit, but also extends outward from it and is high in immediately adjacent mafic volcanic rocks. Such relationships are also apparent in surface outcrops in the Main Zone as noted to be hosted by highly strained clastic sedimentary rocks at the west end of the outcrop exposures, and areas of high strain extend outward and eastward from this unit forming a core to the Holmer Shear Zone.
The pyroxenite body is largely massive and only weakly foliated, but is cut by areas of high strain up to several metres wide which likely formed both D3 and D4 Shear Zones.
In addition to the locally folded D3 Holmer Shear Zone, zones of high strain associated with S4 foliation are also developed. These typically trend east-west in both the upper levels of the Mine and on the 650 Level. In the upper mine levels for example , an intense 2 to 4 metre wide D4 high strain zone hosting the V1 Vein trends east-west at the mafic sedimentary contact on 120 metre Level where it is host to locally developed mineralized quartz veins. This structure, and a second, narrower Shear Zone
43
approximately 10 metres to the north of it record reverse, north side up displacement parallel to the L4 lineation indicated by shear bands, oblique foliation (S) fabric development, and sigmoidal shapes of peripheral quartz extension veins. Other D4 minor Shear Zones were also observed on other levels, having similar north side up kinematics. The close association of these shears with late extension veins, comparable kinematics of the Shear Zones with the vein arrays and their crosscutting nature with early tourmaline veins suggest that the D4 Shear Zones are coeval with, and locally control later phase of quartz extension veins associated with gold mineralization in upper parts of the Timmins Mine.
On the 650 Level, D4 Shear Zones are also locally developed in the pyroxenite body and are spatially associated with main stage auriferous extension vein arrays. The largest of these Shear Zones occurs in UM1 Vein system, coring the mineralized extension vein arrays that define that zone. This Shear Zone is typically several metres wide and contains an intense internal fabric defined by compositional laminations and phyllosilicate alignment, with fabric grading outward to massive, undeformed or more weakly strained wall rocks. Main stage quartz veins associated with these are structurally late and cut across fabrics, although display some stain in the form of open folding. More diffuse, weaker zones of S4 foliation development were also observed in the UM2 and other zones of quartz extension veining in the 650 Level. These structures overprint and crenulate earlier S3 foliations and Shear Zones. D3 Shear Zones on the 650 Level are therefore associated with latter stages of vein development in the deeper parts of the deposit. Vein geometries and local oblique fabrics on the 650 Level also imply a reverse, north side up sense as is seen on upper levels of the mine.
Intruding the forementioned units are diabase dykes belonging to the Paleoproterozoic age, Matachewan dyke swarm (2.45 Ga). This unit is fine to medium grained, exhibiting a massive gabbroic texture of plagioclase, pyroxene and biotite with accessory magnetite.
7.2.2 Thunder Creek Portion of the Timmins West Mine
Geological understanding of the Thunder Creek area has evolved from a number of studies carried out under the direction of Lake Shore Gold geological staff. Work essentially started by Lake Shore with geological surface mapping of surface exposures and trenches on the Thunder Creek Deposit under the direction of Henry Marsden, Senior Project Manager in 2004. This program traced the contact of the Rusk Shear, the metamorphosed mafic-pyroxenite-sediment-monzonite contacts with a series of trenches staggered along the projected trace of the Rusk Shear. Coincident with the surface mapping, a diamond drill campaign targeting the Rusk Shear Zone and gold mineralization within and proximal to the Shear Zone, and geophysical magnetic, conductivity and resistivity anomalies was initiated. The results of this program are described and discussed in the technical report prepared by Powers (2009).
During late summer 2009, Mr. John Camier, P. Geo., carried out a surface mapping survey confined to a 5 kilometre square area surrounding the Rusk Zone. The scope of the program was: to concentrate on the syenite (monzonite) intrusion, and try to understand its relationship to the surrounding host metasedimentary rocks, and the hydrothermally altered pyroxenitic intrusion previously mapped and intersected in drill core. The “in-house” technical report prepared by Mr. Camier represents field observations, results of geochemical sampling and a petrographic study by Dr. R. Springer, P. Geo., a retired professor from Brandon University, Manitoba.
From 2003 to 2013, >261,000 metres of diamond drill core have been drilled by Lake Shore Gold Corp. in the Timmins West Mine property. Underground mapping includes the outlining of major structures as the Rusk Shear; sulphide and quartz vein mineralization; alteration and rock type. Over the course of these programs several samples have been sent for microscopic study to endeavor to determine the
44
rock type, alteration history, accessory minerals, mineralization type, habit, style, and qualifying the geological understanding. These microscopic studies include work by Dr. A. Miller, Dr. B. Springer, and K. Ross.
In the summer of 2012, Lake Shore Gold initiated a research project in conjunction with the University of Western Ontario that will be part of a M. Sci. thesis on the Thunder Creek Deposit. Information is in the process of being compiled at the time of this report.
Table 7.2 illustrates a geological table of lithological units for the Timmins area. The lithological units underlying the Timmins West Mine Property are presented in the table as a bold font. Seven lithological units have been identified underlying the Timmins West Mine property. The Lithologies range in age from Neoarchean, Tisdale assemblage mafic metavolcanic (2.710 — 2.703 Ga) to Paleoproterozoic Matachewan diabase dykes with an age of 2.45 Ga. The understanding of the geological environment continues to evolve. Presented in this report is the current understanding and interpretation for surveys completed to date. The reader is cautioned that as additional information becomes available, or known, the interpretation will be modified based upon the merits of information presented.
The stratigraphic base of the property is made of by a mafic metavolcanic rock unit that is fine-grained, green in colour, and exhibits massive, pillowed and flow breccia textures and structures. This unit is located in the western portion of the property. Metamorphism varies from mid-greenschist to lower-amphibolite facies. Epidote and calcite alteration is common and increases to strong hydrothermal alteration as the unit is in closer proximity to the Rusk shear. Fine-grained disseminated magnetite occurs proximal to the alkali intrusive complex (AIC). At this location, the rocks become darker in colour, chloritized and locally exhibit hematite alteration (Camier, 2009). Felsite to feldspathic rich syenite dyklets; the AIC; quartz, ±carbonate veins with varying amounts of hematite, ±magnetite, ±pyrite, ±pyrrhotite; and diabase dykes intrude the mafic metavolcanic lithology.
In the eastern portion of the Thunder Creek part of the property, and overlying the mafic metavolcanic unit is a discontinuous sequence of biotite rich meta-greywacke, metamorphosed siltstones, metamorphosed argillite, fine grained tuff, clastic tuff, and laminated chemical metasediments containing magnetite (Camier, 2009; Samson, 2008). This succession of metasedimentary rocks belongs to the Porcupine assemblage, ranging in age from 2690 to 2685 Ma. It is not known if the sediments are conformable or unconformable to the mafic metavolcanic contact. These metasedimentary units occur in the footwall to the AIC and along the Rusk Shear Zone. Within the Shear Zone, these metasedimentary rocks are tectonized to a quartz-sericite-carbonate ±hematite schist that display a crenulation fabrics. The most common alteration assemblage comprises sericite, weak hematite and silicification. Quartz veins, felsites veins and the Matachewan Diabase dyke swarm intrude the metasedimentary lithology. Camier (2009) identified several outcrops of felsic to dacitic metavolcaniclastic fragmental rocks within the central portion of the mapping area. Although age dates have not been acquired for this subunit, it is speculated that the subunit may be related to the Krist formation of the Porcupine assemblage.
The AIC is poorly exposed on surface. It has a very strong magnetic signature that the geophysical interpretation indicates that it extends northeasterly for at least 2 kilometres across the central portion of the Thunder Creek property, and onto the Timmins Mine property to the north. The magnetic trend becomes distorted and exhibits an offset or folded character when intersected by several interpreted structures. The AIC intrudes along the contact between the volcanic and the sediments. It is a poly-phase and vari-textured intrusion, of contemporaneous age with the Timmins Porphyry suite (Pearl Lake
45
2689 Ma, Millerton 2691 Ma, Crown 2688 Ma, and Paymaster 2690 Ma; — Barrie 1992), and is also of similar age as the Bristol Lake Quartz-Feldspar Porphyry in the eastern portion of Bristol Township (2687 ±1.4 Ma; Ayer 2003). The intrusive shows at least three texturally and mineralogically distinct phases: a fine- to coarse-grained pyroxenite; a biotite-pyroxenite; and a porphyritic garnet syenite. The fine to coarse grained pyroxenite is strongly magnetic, and consists of greater than 85% pyroxene (diopside), with variable amounts of accessory biotite + magnetite + rutile + apatite, and interstitial calcite (Miller, 2004). The intrusive is partially exposed at the Rusk Showing, and displays pegmatitic primary layering as well as cumulate-like textures. The pyroxenite locally grades into a biotite-rich phase (possible lamprophyric affinity), characterized by the presence of large biotite “clots” and books (poikilitic biotite) up to several centimetres across. In places, “sweats” and dykes containing 40 to over 75% dark brown to black melanite garnets (up to 1 centimetre across) are noted, contained within a fine-grained and leucocratic matrix consisting of plagioclase + orthoclase + biotite + carbonate + apatite + titanite (Miller 2004). The different phases sometimes exhibit clear yet irregular contacts, and sometimes appear to be transitional. Numerous “monzonitic” to “syenitic” dykes are noted throughout the main body of the pyroxenite and also within the volcanic rocks. It is not clear if these phases are genetically related to the AIC or to the monzonite stock located in the southern portion of the property.
A quartz-feldspar porphyritic monzonite occurs as a nearly circular intrusion greater than 500 metres in diameter in the central portion of the property, representing a high topographic relief area. The composition of the intrusion varies with 10-40% quartz eyes and 10-20% tabular feldspars (commonly zoned and occasionally up to 3 centimetres across), contained within fine-grained pinkish-grey groundmass. The variation in quartz and feldspar content presents this unit with multiple names: a quartz monzonite, monzoninte, syenite, peralkaline syenite. Pink to brick-red, interpreted as being hematized, and generally fine-grained felsic dykes are observed within Shear Zones hosted by the sediments. These dykes are possibly related to the monzonite stock. Camier (2009) noted the presence of riebeckite in the eastern half of the intrusive and thus argues the intrusive to be a peralkaline syenite. Although there is no age dating completed from this unit, it is speculated that the intrusive may be part of the Timiskaming assemblage (2676-2670 Ma).
Intruding the forementioned units are diabase dykes belonging to the Paleoproterozoic age, Matachewan dyke swarm (2.45 Ga). This unit is fine to medium grained, exhibiting a massive gabbroic texture of plagioclase, pyroxene and biotite with accessory magnetite.
TABLE 7.2: LITHOLOGICAL UNITS
Lithological Units | | Description |
Phanerozoic (0.540 Ga — Present) | | Cenozoic — Quaternary: | | Recent — Humus, swamp, and stream deposits |
| | | | Pleistocene — Clay, sand, gravel, till |
| | | | UNCONFORMITY |
| | | | |
Neoproterozoic Era (1.0 — 0.54 Ga) | | Grenville Orogeny: | | Assembly of the continent of “Rodinia” (1.3 — 1.0 Ga) |
| | | | |
Mesoproterozoic Era (1.6 — 1.0 Ga) | | Mafic Intrusive Rocks: | | INTRUSIVE CONTACT |
| | | | Abitibi Diabase Dyke (1.14 Ga) |
| | | | INTRUSIVE CONTACT |
| | | | Sudbury Diabase Dyke Swarm (1.27 Ga) |
| | | | INTRUSIVE CONTACT |
| | | | MacKenzie Diabase Dyke Swarm (1.27 Ga) |
| | | | INTRUSIVE CONTACT |
46
Lithological Units | | Description |
Paleoproterozoic Era (2.5 — 1.6 Ga) | | Penokean Orogeny: | | Wisconsin, Minnesota, Michigan, Ontario (1.8 — 1.8 Ga) |
| | Hudsonian/Trans-Hudsonian Orogeny: | | Collision of Superior-Hearne Cratons (2.0 — 1.8 Ga).
Formation of the continent of “Nena” |
| | Mafic Intrusive Rocks: | | INTRUSIVE CONTACT |
| | | | Presissac (Biscotasing) Dyke Swarm (2.1 Ga) |
| | | | INTRUSIVE CONTACT |
| | Wopmay Orogeny: | | Western edge of Canadian Shield (2.1 — 1.9 Ga) |
| | Mafic Intrusive Rocks: | | INTRUSIVE CONTACT |
| | | | Nipissing Gabbro Suite (2.2 Ga) |
| | | | East Bull Lake Intrusive Suite (2.49 — 2.47 Ga) |
| | | | Matachewan Dyke Swarm (2.45 Ga) |
| | | | INTRUSIVE CONTACT |
| | | | |
Neoarchean Era (2.8 — 2.5 Ga) | | Kenoran Orogeny | | Collision of Slave nad Superior Cratons (2.72 — 2.68 Ga)
Formation of the continent of “Arctica” |
| | | | UNCONFORMITY AND SHEAR CONTACT |
| | Timiskaming Assemblage (2676 — 2670 Ma) | | Quartz ±tourmaline ±ankerite ±pyrite ±native gold |
| | | | Felsic Intrusive Rocks |
| | | | INTRUSIVE CONTACT |
| | | | Syenite — Quartz Monzonite — Perialkaline Syenite (an interpretation, an age date is required) |
| | | | INTRUSIVE CONTACT AND SHEAR CONTACT |
| | Porcupine Assemblage (2690 — 2685 Ma) | | |
| | | | Mafic Intrusive Rocks |
| | | | INTRUSIVE CONTACT |
| | | | Alkaline Intrusive Complex (AIC) — garnetite dyke (2687 Ma ± 3 Ma) |
| | | | INTRUSIVE CONTACT |
| | | | Meta-Sedimentary Rocks |
| | | | Greywacke, siltstone, clastic tuff, chemical metasediments (magnetite chert) |
| | | | CONTACT IS NOT OBSERVED |
| | | | Felsic Epiclastic Metamorphosed Tuff (possible Krist Formation) |
| | | | CONTACT NOT OBSERVED |
| | Tisdale Assemblage (2710 — 2704 Ma) | | Mafic Metavolcanic Rocks |
| | | | Mafic metavolcanic flows, massive and pillowed, flow breccias |
| | | | UNCONFORMITY |
| | Kidd-Munro Assemblage (2719 — 2711 Ma) | | |
7.3 STRUCTURAL GEOLOGY
Rhys (2010, 2011) has modified the regional structural history interpretation by adding an additional deformation period (D2) to the earlier folding preceding the Timiskaming assemblage. The interpretation demonstrates that there are at least two pre-Timiskaming fold events (D1 and D2), followed by two dominant syn-metamorphic, post-Timiskaming foliation forming events (D3 and D4) and a later crenulation cleavage (D5) (Rhys, 2010).
47
Regionally, deformation in the Timmins area is characterized by a sequence from early, pre metamorphic folds lacking axial planar cleavage (D1, D2) to a series of syn-metamorphic, fabric —forming events, which overprint the earlier folds (D3, D4 events). The multi-phase Destor-Porcupine fault system passes approximately 5 kilometres to the south of the property. This fault system is a composite corridor of Shear Zones and faults that records at least two main stages of displacement: syn- Timiskaming (2680-2677 Ma) brittle faulting associated with truncation of early D1 and D2 folds, apparent sinistral displacement, and formation of half grabens that are locally filled with Timiskaming clastic sedimentary rocks; and syn-metamorphic D3-D4 formation of high strain zones over a broad corridor generally several hundred metres wide generally corresponding with, or developed south of, the trace of the older faults. These Shear Zones record variable kinematic increments but are regionally dominated by sinistral, north side up displacements (Rhys, 2010).
At least two areas of high strain reflect probable intense S3 Shear Zones have been recognized in the Thunder Creek and Timmins Deposit areas: the west-northwest trending, but significantly folded Holmer Shear Zone; and the northeast trending Rusk Shear Zone. Shear Zones may also be significantly folded, as occurs in the Main Zone in upper proportions of the Timmins Deposit. These closures have localized gold mineralization which plunge parallel to them, suggesting the definition of additional F4 fold closures (Rhys, 2010).
The oblique (clockwise) nature of the S3 foliation in the Rusk Shear Zone to the Shear Zone margins, and shear sense indicators in the Holmer Shear Zone surface outcrops suggest that both structures accommodated sinistral displacement during D3. Subsequent D4 Shear Zone development in narrower, generally east-west trending and steeply dipping structures with dominantly reverse kinematic indicators in the Timmins Deposit would imply then the change in kinematics later in the deformation history to a more contractional setting associated with development of the stretching lineations. Such variations in kinematics are also suggested in other deposits in the Timmins area and imply changing patterns of far field stress and regional transpression between D3 and D4 (Rhys, 2010).
7.4 MINERALIZATION
Gold mineralization in the Timmins and Thunder Creek Deposits occurs in steep north-northwest plunging mineralized zones which plunge parallel to the local orientations of the L4 lineation features which also plunge parallel to the lineation, including folds and elongate lithologies. Mineralization occurs within, or in favourable lithostructural settings within 100 metres of the Holmer and Rusk Shear Zones. Mineralization comprises multiple generations of quartz-carbonate-tourmaline ±albite veins, associated pyrite alteration envelopes, and disseminated pyrite mineralization. Textural evidence suggests that veining formed progressively through D3 and D4 deformation. All phases of gold-bearing veins cut and postdate AIC and syenitic to monzonitic intrusion, although mineralization is often spatially associated with ore preferentially developed within these intrusions (Rhys, 2010).
Appendix 3 contains a number of photographs (Plates 1-11) illustrating the various styles of mineralization in the Thunder Creek and Timmins Mine deposits taken from Rhys, 2011
At the Timmins Deposit, the character and sequence of veining in the Main, V1 and V2 veins is similar in all of the exposures. Rhys (2003) defined three phases of veining in the Timmins Deposit surface showings, all of which were also apparent in his recent observations (Rhys, 2010 and 2011), although an additional phase of shallow dipping quartz extension veins was also recognized during this field work
48
(Rhys, 2010). The sequence of veining observed is as follows, with most veins in the upper Timmins Deposit mineralization forming composite veins which have this paragenetic sequence.
1. Early tourmaline-rich phase: Early, tourmaline-quartz vein material forms the earliest veining phase, and comprises both dilation veins and wall rock replacement in tabular replacement vein-style zones along strike from, or parallel to dilation veins. The veins have outer tan carbonate ±sericite alteration envelopes. Tourmaline can comprise the majority of the vein material in these veins, forming a black matrix to later phases of veining. These veins vary from a few centimetres to more than 2 metres wide, and may be significantly boudinaged or folded, with S4 axial planar to the folds. Boudins, where developed are linear and shallow plunging, at high angle to the L4 stretching lineation. Dilational veins have sharp contacts and massive central fill consistent with formation as void fill. Replacement tourmaline comprises 5 to 40 centimetre wide replacement veins which unlike the dilational veins have gradational contacts over 0.5 to 2 centimetre and preserves relic textures of the wallrock, including relic fragmental textures in deformed potential clastic sedimentary or fragmental tuffaceous units what occur in the Holmer Shear Zone. These may laterally grade into more dilational quartz-tourmaline veins which have sharp contacts; both vein styles are spatially associated and close in timing, with the replacement style locally enveloping dilational tourmaline veins. Dilational tourmaline-rich vein phase locally form en echelon, moderate to steeply north dipping extension veins separate from the peripheral to the main veins. Broad zones of veining with multiple dilational and parallel, sheeted replacement tourmaline veins may alternate with slivers of carbonate-quartz-sericite altered wall rock. Tourmaline veins may contain disseminated pyrite and arsenopyrite with tourmaline matrix.
2. Quartz-rich second phase: Exploiting the earlier tourmaline-rich veins, this phase of quartz forms white quartz ± tourmaline ± sericite ± pyrite ± arsenopyrite vein material which overprints, but occurs along and parallel to the earlier tourmaline vein material, which with wallrock slivers create a banded appearance to the quartz-tourmaline veins. Tourmaline coeval with this phase may occur with sulphides and carbonate as stylolites in the vein material. Earlier tourmaline may occur as slivers, lenses and fragments in the younger white quartz, or the younger white quartz may occur on the margins of earlier tourmaline veins. This style of quartz may also occur independent of the tourmaline veins as a separate vein generation and locally occupies minor reverse, north-side up D4 Shear Zones. Sampling and local presence of visible gold in this veins phase indicate that it is auriferous. This veining is the intermediate stage of veining discussed by Rhys (2003). When occurring as independent shear veins, it may be joined by quartz-carbonate extension veins which are variably deformed. Like the tourmaline veins this stage of veining is affected by boudinaged and folding, and this generation of quartz also occurs with the early tourmaline as composite folded veins which trend northwest along the southwestern margins of the Main Zone.
3. Quartz extension veins, variably deformed: Shallow to moderate southeast dipping quartz greater than tourmaline + carbonate extension veinlets from ladder-like stacked arrays which preferentially occur in, and cut across the earlier quartz-tourmaline and banded quartz-rich veins phase. The extension veins may either terminate at the margins of the older veins, or nucleate in the early tourmaline and extend outward into surrounding wallrock. The extension veins are often closely spaced and may occur at intervals of a few centimetres to tens of centimetres apart. They range from hairline up to 10 centimetres thick. This set of extension veins locally occurs as en echelon, locally sigmoidal arrays which record apparent northwest side up displacement internal to the older quarts-tourmaline veining, and which also record , reverse north side up displacements. Where not folded in sigmoidal sets, these extension veins are
49
developed approximately orthogonal to the steep northwest plunging L4 stretching / intersection lineation, suggesting that they formed during stretching of the lithology sequence parallel to L4 in response to north-south D4 shortening — consistent with the relatively late structural timing as suggested by the generally low strain state.
4. Late quartz extension veinlets: A late set of shallow dipping, generally to the southeast quartz extension veinlets frequently occurs within the quartz-tourmaline veins, and cuts at low angles across the earlier set of extension veinlets described above, especially where they are folded into sigmoidal sets.
5. These late veinlets are typically narrow (1 to 10 millimetres thick) and consequently volumetrically minor, although they can be locally very abundant. Their similar orientation with respect to L4 as the preceding extension veins set, but generally undeformed state suggest that they represent a second, structurally late increment of extension veining late during D4.
Textural and timing relationships of the different, but spatially related veining generations listed above suggest that they formed incrementally spanning deformation during D3 and D4. The early quartz-tourmaline veins, including the second phase quartz greater than tourmaline vein phase are affected by all D4 strain, exhibiting folding when development oblique to or at high angles to S4 foliation, and boudinaged in response to the stretching parallel to L4. However, these veins also cross S3 foliation as planar veins where they trend northeast at high angles to S3 suggesting that they were affected by only minor D3 strain. In addition, tourmaline replacement veins were they overprint potential fragmental units contain less strain relic fragments that the surrounding wallrock suggesting that they formed part way through D3 where the wallrocks were already deformed, but prior to the accommodation of all strains in the rocks. These field relationships are consistent with the quartz-tourmaline veins and the next generation of banded quartz which is parallel to them forming and extensional veins and shear veins during D3 in response to sinistral displacement along, and shortening across the Holmer Shear Zone. During later potentially progressive D4 deformation, additional phases of veining mainly as quartz extension vein arrays have formed exploiting the earlier rheologically competent quartz-tourmaline, and forming a high angle to the L4 lineation, suggesting vein formation in response to the stretching parallel to L4. These extension veins and the very late set of extension veinlets may also form along the adjacent to minor east-west trending D4 Shear Zones which accommodate north side up displacement, and overprint the transposed fabrics associated with D3 (S3), (Rhys, 2010).
One key recent observation that has affected geological interpretations in the Timmins Mine within the Ultramafic Zone since the last 43-101 technical report (May, 2012) is additional underground drilling has allowed for a better interpretation of the internal lithological correlations within the AIC or Ultramafic sequence of rocks in the the “fold nose” (Rhys, 2012, J. Samson, personal communication). Figure … is a geological level plan on the TM 790 metre Level and illustrates a core of dominately serpentinized and chloritized and locally talc altered komatiitic type ultramafic unit lies in the centre of the “fold nose” in the AIC or dominate pyroxenite unit. Mineralization in the altered pyroxenite in the Ultramafic Zone terminates against the altered komatiitic unit, with non-mineralized quartz-tourmaline veining extending into the komatiitic unit. Recognition of this allows for limiting the projection of the mineralization away from drillholes towards holes with komatiitic unit, thus tightening up the mineralization shapes. This komatiitic unit also separates the AIC into two lobes of dominately pyroxenite with the main part of the Ultramafic Zone being hosted within the western lobe and to date only the poorly explored S1 and S2 Zones being located in the eastern lobe. Here these zones are folded within the eastern pyroxenite around the core of the pyroxenite/sediment contact. Recent underground drillhole intersections show the potential for additional zones of mineralization within this eastern lobe of pyroxenite.
50
In the Thunder Creek area, mineralization occurs in two main stages: a) the Rusk Shear Zone adjacent to and in footwall or the pyroxenite unit, and b) in the Porphyry Zone which is hosted by the quartz monzonite intrusion which is present southeast of and in the immediate footwall to the Rusk Shear Zone below approximately 500 metres below surface. Both of these zones occur spatially related in the same steep north-northwest plunging mineralization area which has been traced over a vertical dip length to date (Rhys, 2010-03-12) of more than 1 kilometre, and within which better intercepts occur along a strike length of 100 to 600 metres (Rhys, 2010).
Mineralization in the Rusk Shear Zone comprises areas of either higher quartz-carbonate-pyrite vein density, and/or areas of elevated medium to coarse-grained disseminated pyrite and associated pyrite-quartz veinlets. Both of these styles were observed to occur in the intensely foliated, often compositionally laminated carbonate-albite-quartz-magnetite portions of the Shear Zone. Mineralization also locally preferentially overprints pink, K-feldspar-rich syenite dykes and local plagioclase-dominant probable diorite dykes in the Shear Zone, with clots and aggregates of coarse pyrite, often associated with which quartz-albite-carbonate veinlets. Areas of gold mineralization occur in portions of the Rusk Shear Zone in which the Shear Zone matrix is variably Fe-carbonate altered.
Most common styles of veining comprises deformed quartz-pink carbonate/albite veins with varying pyrite content and coarse-grained pyrite envelopes/selvages, which correspond generally with higher and more continuous grades. These early deformed veins are very similar in style and texture to the earliest phases of veining seen underground in the 650 metre Level Ultramafic Zone which are also deformed and could be coeval with the set (Rhys, 2010). Veins in the Rusk Shear Zone also include a younger phase of quartz-pyrite veins which have pyrite envelopes, which cut the deformed veins and which have carbonate-pyrite envelopes that over print the Shear Zone matrix and sulphidized magnetite, overprinting the Shear Zone foliation. The coarse pyrite in vein envelopes also overgrows the dominant Shear Zone foliation, which is preserved textually as inclusion trails in the pyrite (Ross, 2010). This younger set of veinlets is likely coeval with the main stage extension vein sets on the 650 metre Level (Rhys, 2010). Both of these veining phases are auriferous and can contain high gold grades. Gold in both phases was observed in the Petrographic study occurring in association with pyrite, including as inclusions often in association with chalcopyrite and galena, on fractures in pyrite, and free in gangue adjacent to pyrite grains (Ross, 2010). The relationship of the disseminated pyrite variety here could not be determined, but the overall style of the pyrite and local occurrence in diffuse veinlets has similarities to the second veining phase (Rhys, 2010).
“Porphyry Zone” mineralization is developed in the quartz monzonite intrusion that occurs at depth in the footwall of the Rusk Shear Zone immediately adjacent to areas of mineralization in the adjacent Rusk Shear Zone. Mineralization is associated with sheeted sets of quartz extension veins which occur in abundance of up to several veins per metre within the intrusion. Most veins are less than 3 centimetres thick and comprise white quartz with occasional pyrite grains. Disseminated pyrite locally occurs in the wall rock to the veins and free visible gold was locally observed in association with pyrite both in veins and wallrock immediately adjacent to veins, accompanied rarely by a bluish silvery grey mineral (a possible telluride), and by local fine grained base metal sulphides (sphalerite, galena) and local scheelite. The intrusion is generally massive in areas of veining. Veins have variable core axis angles, but angles are most commonly high (>70 degrees to core axis) consistent with a shallow dip to extension veinlets, supported by geological underground mapping in development headings. Local irregularity in vein shapes and orientations, particularly in areas of the highest vein abundance, suggests some deformation, possibly in the cores of sigmoidal vein arrays. These veins are of compatible style and probable orientation as the main stage Ultramafic Zone veins in the Timmins Mine which they may be
51
coeval with, and consequently they may also form areas of higher grade continuity which are dictated by the morphology of the extension vein arrays. These veins may have formed preferentially in the upper, thinner portions of the intrusion where it is less than 100 metres thick, in response to brittle behavior of the intrusive body during ductile activity of the Rusk Shear. More isolated narrower intercepts deeper in the intrusion where it is thicker may reflect the more rigid behavior of the unit as its width strengthens it, as is seen in many other Timmins area deposits, where an optimal thickness of the host unit is common for most abundant vein development. Modeling of the morphology and thickness of the host intrusion may as a result aid in definition of the distribution of best developed mineralization (Rhys, 2010).
Areas of veining frequently are associated with more intense pink-red coloured and homogeneous appearance of the intrusion, obscuring the primary igneous textures. A systematic series of samples from drill hole TC09-69a across the hosting monzonite intrusion was stained using Na-cobaltinitrate to assess whether this vein associated alteration is K-feldspar; intense yellow stain in these altered areasconfirms that the reddish-orange alteration with quartz veining is secondary K-feldspar (Rhys, 2010). Within the Porphyry Zone, although at a local scale, no correlation between gold grade and vein density is apparent in review of assays and representative drill core. In general, areas lacking veining, also lack gold grade (Rhys, 2010).
Additional definition drilling since the December 2012 resource model update (approximately 42,000 metres) in the Thunder Creek Deposit has provided the ability to complete a better interpretation of the mineralization model. Several key changes include:
1. Refining the extends of the porphyry body where the previously modeled larger porphyry is now more broken up with lenses of unaltered mafic volcanic rock along the footwall and locally along the edges of the porphyry now being separated from the mineralization model, thus lowering the tonnage locally within the main Porphyry Zone model.
2. Recognition of more discrete shear structure control to mineralization in the Rusk Zone through geological mapping underground has allowed for more accurate models in be interpretated from drillhole information, resulting in the Rusk structure being locally thinner than in previous models.
The observations and conclusions made by Camier (2009) and Rhys (2010, 2011) provide a valid argument for their interpretations, and the interpretations have been accepted and adopted by Lake Shore Gold Corp. The most recent interpretations are illustrated in the accompanying figures:
· Figure 7.3: Property Geology
· Figure 7.4: Timmins Deposit Geology 790 m Level (Lower mine)
· Figure 7.5: Timmins Deposit Generalized Cross-Section 4575E (Timmins West Mine Grid)
· Figure 7.6: Thunder Creek Geological Level Plan 300m Level (Upper Mine)
· Figure 7.7: Thunder Creek Underground Geology 765 Level (Lower Level)
· Figure 7.8: Thunder Creek Generalized Cross-Section, 9550N (Thunder Creek Rotated Surface Grid)
· Figure 7.9: 3-D view looking east Illustrating Timmins Mine Shaft Ramps, Levels, and the Thunder Creek Resource Envelopes (Looking Eastward)
· Figure 7.10: Structural Plan 300 Level (Rhys, 2010)
52
FIGURE 7.3: PROPERTY GEOLOGY
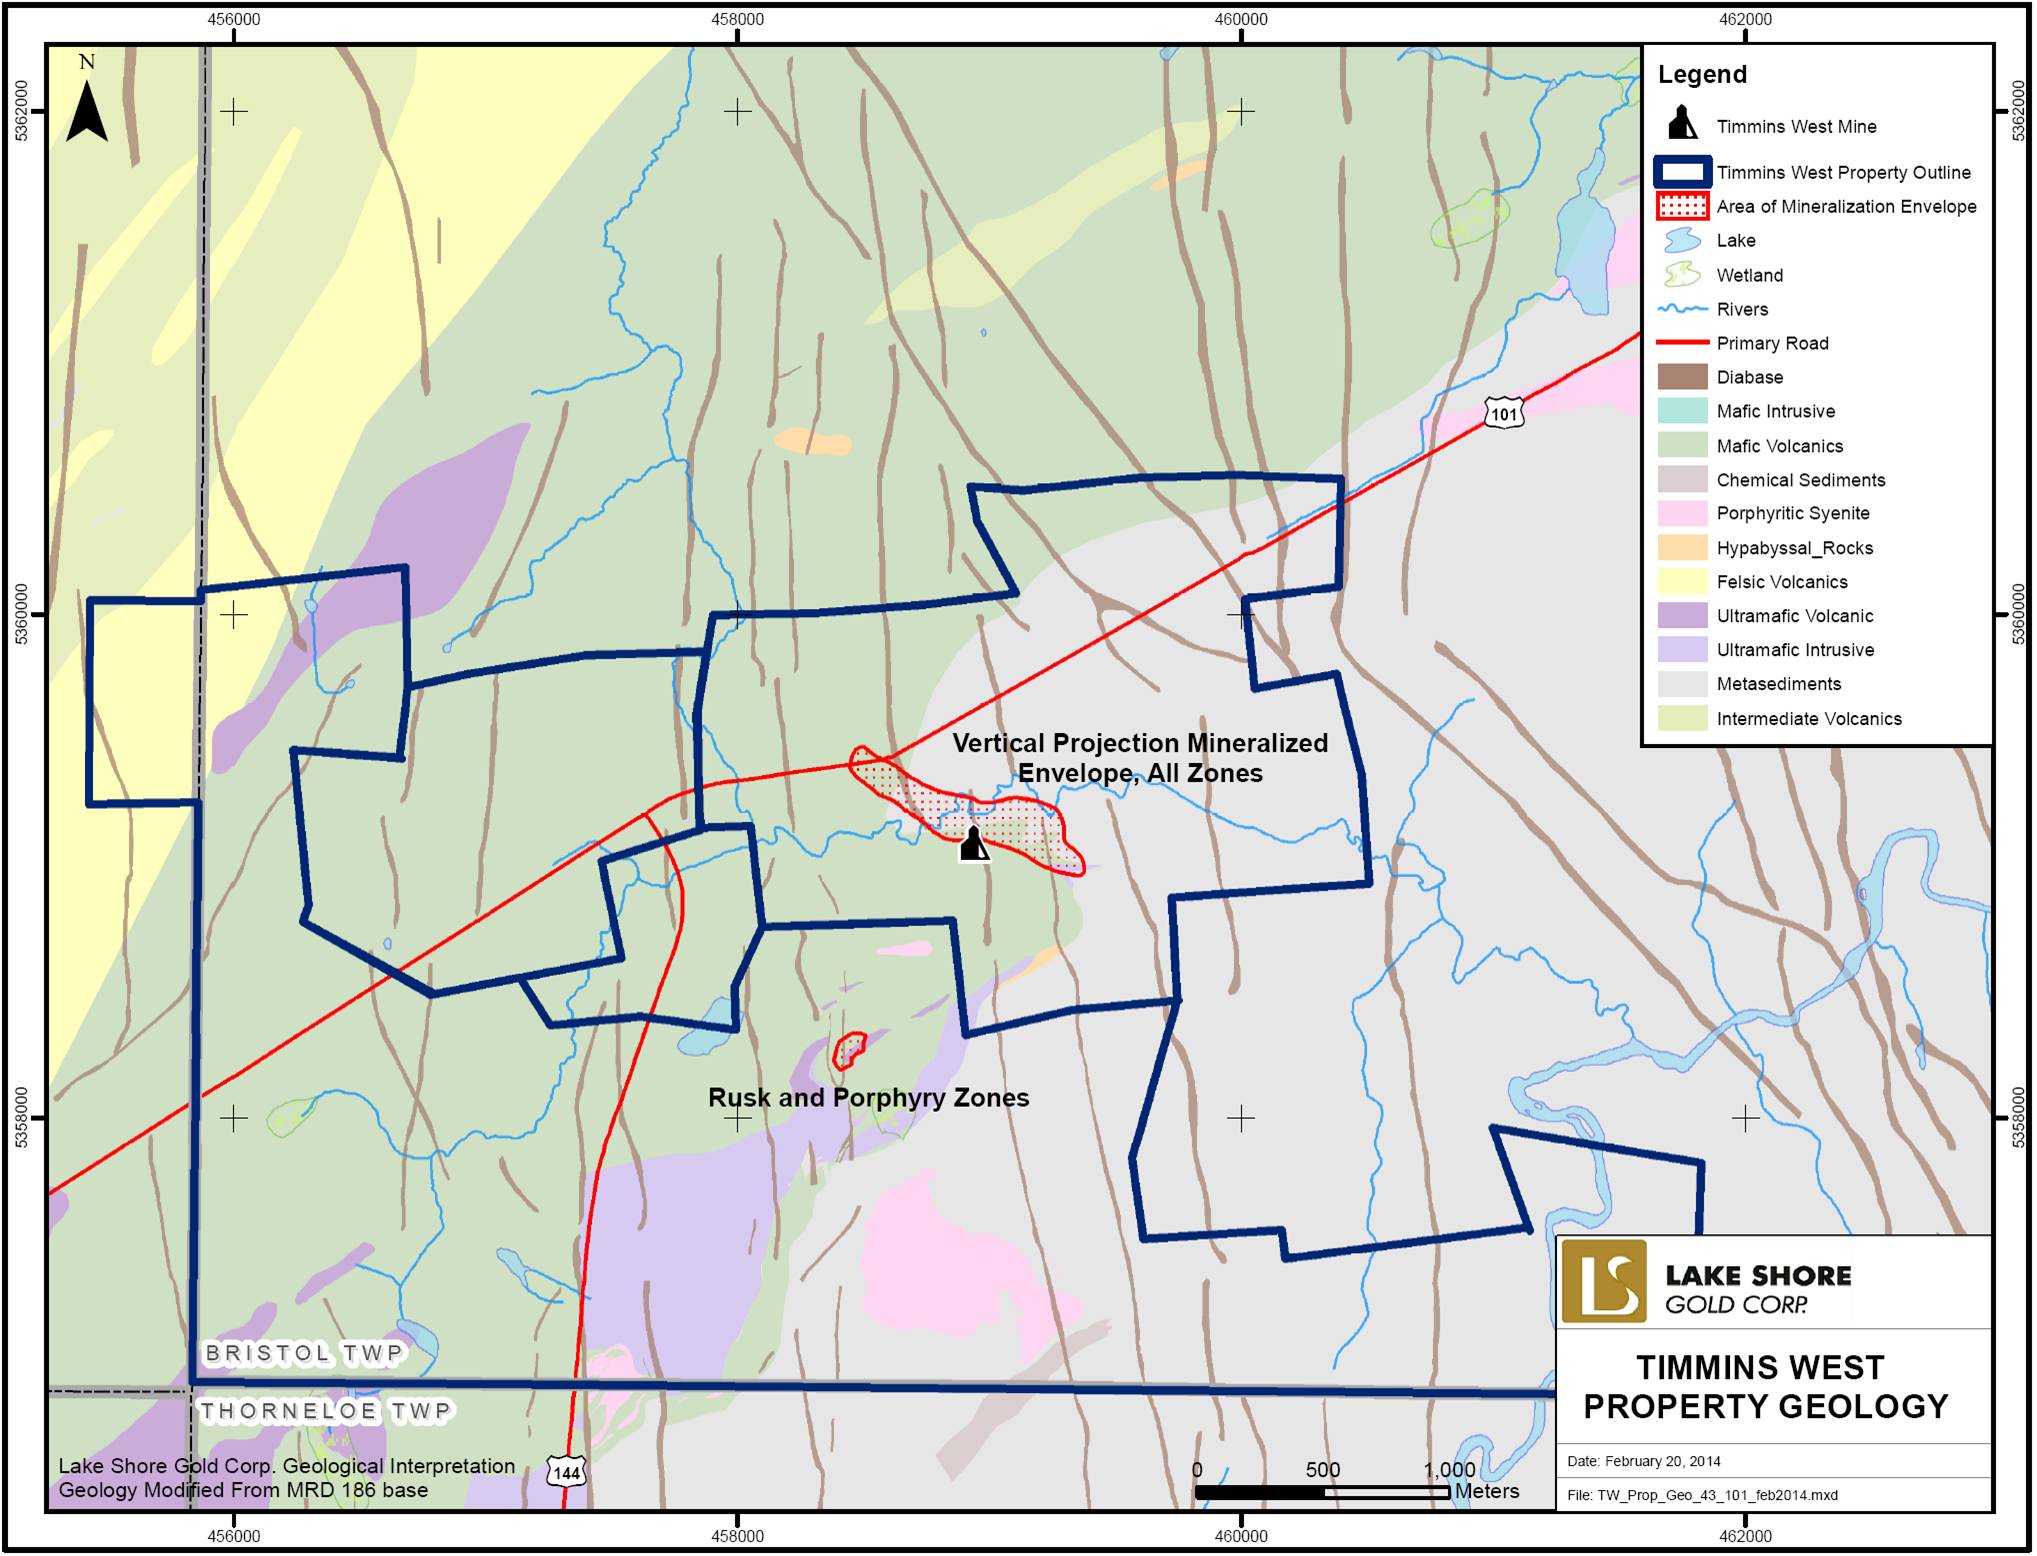
53
FIGURE 7.4: TIMMINS DEPOSIT UNDERGROUND GEOLOGY 790 M LEVEL (UPPER LEVEL)
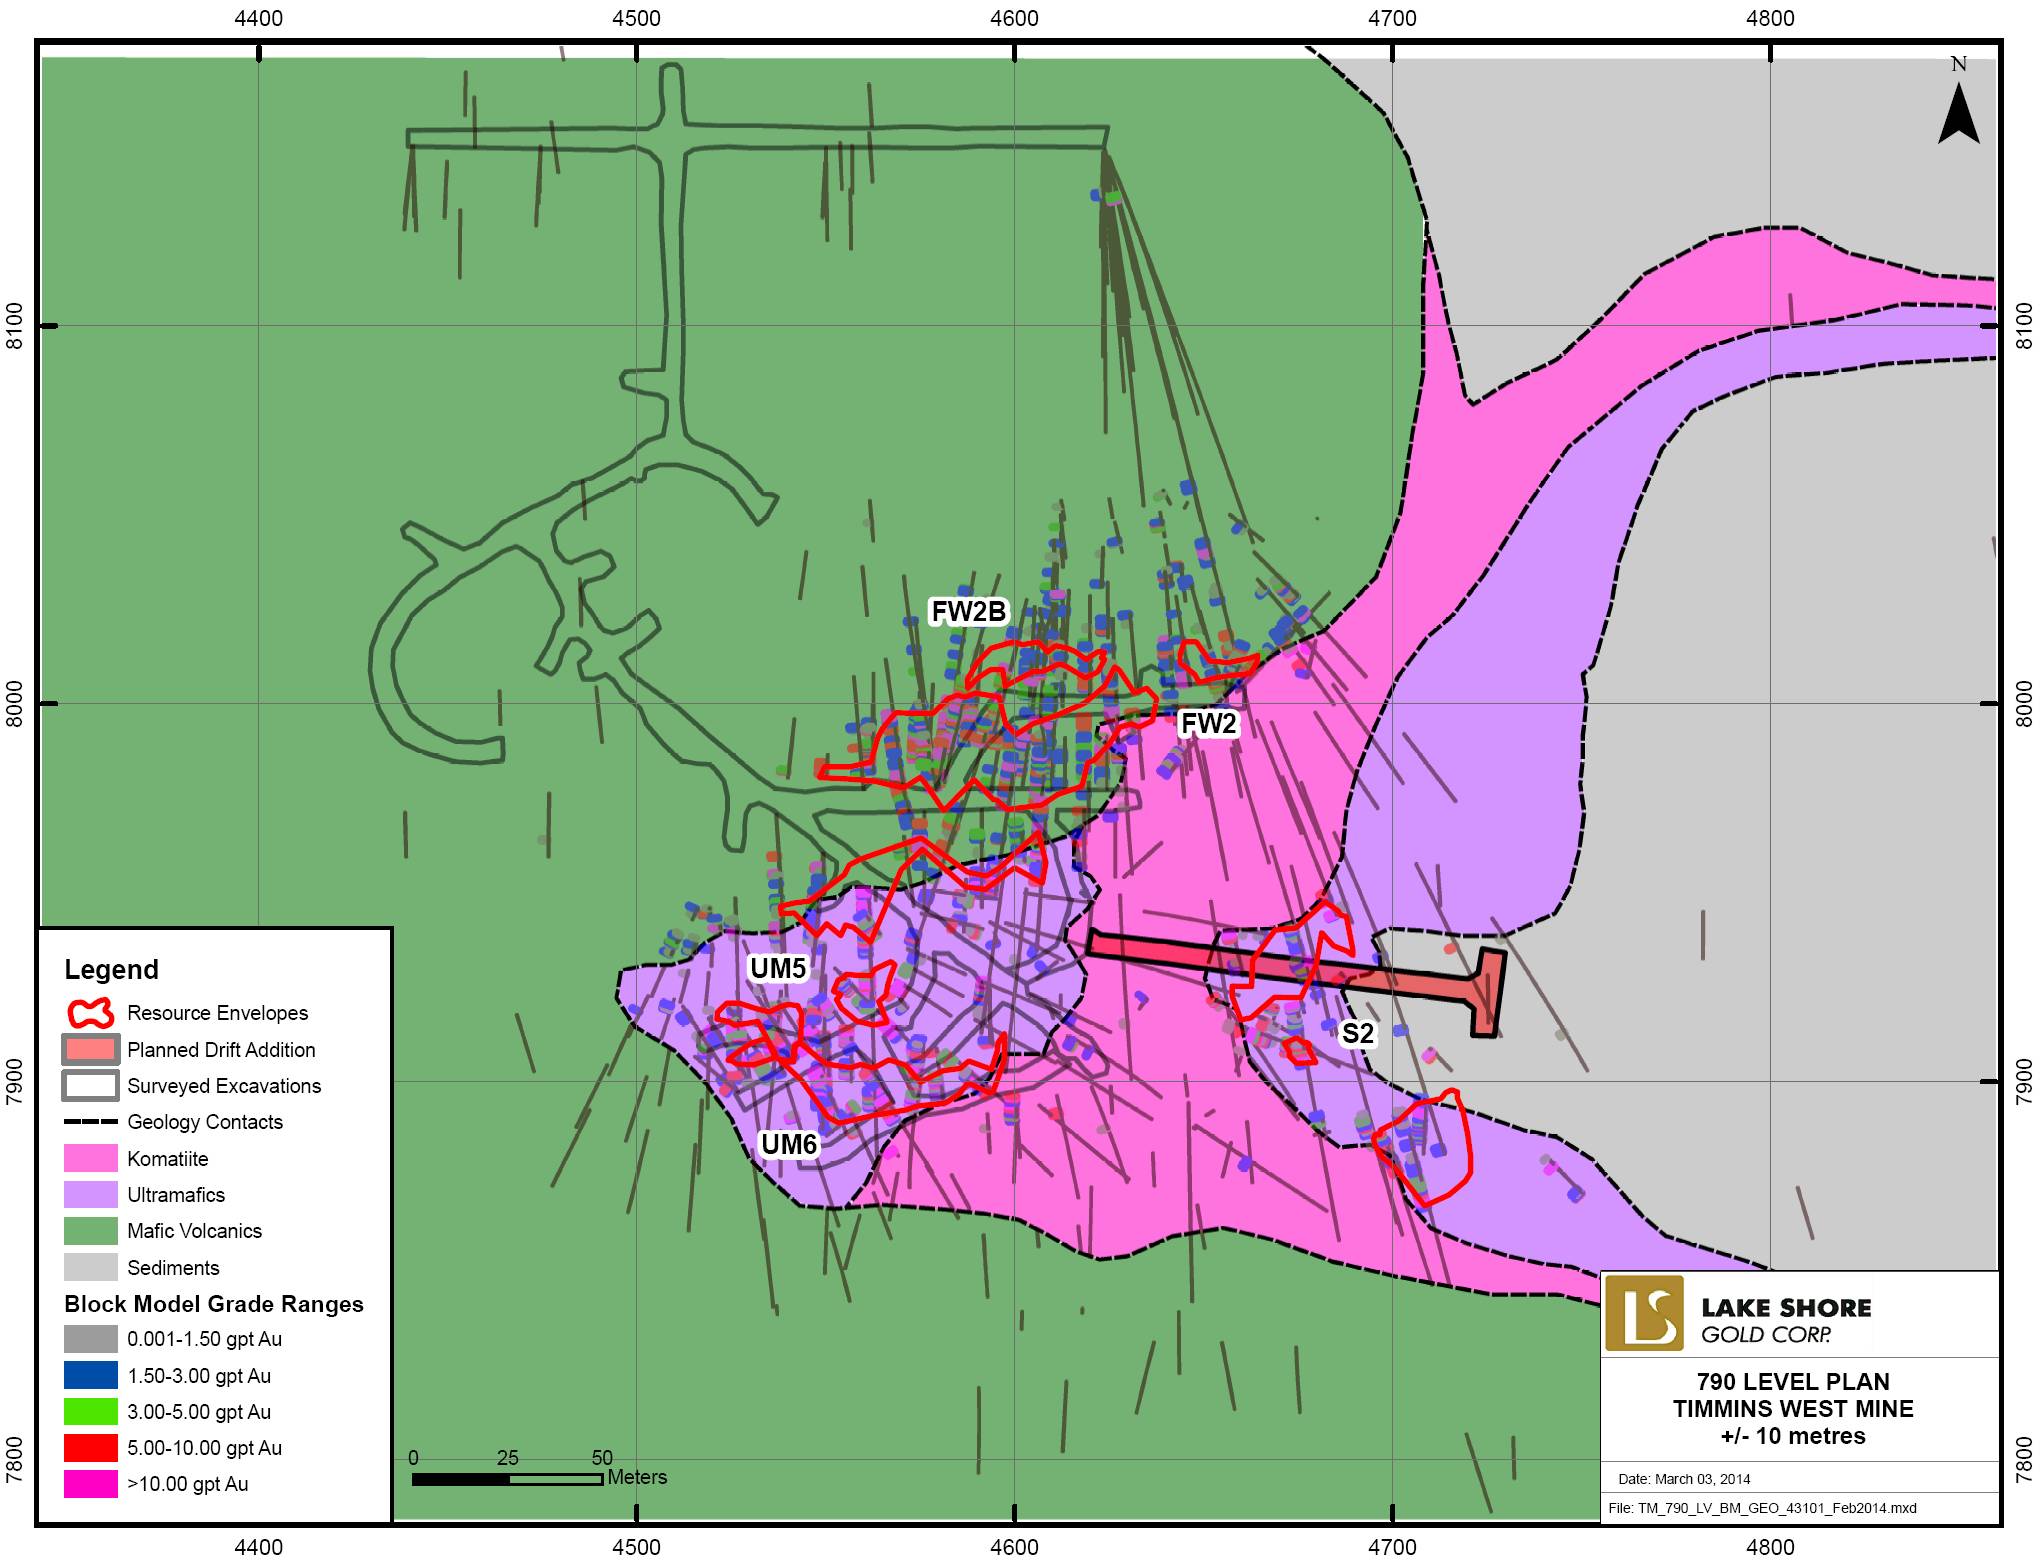
54
FIGURE 7.5: TIMMINS DEPOSIT GENERALIZED CROSS-SECTION 4575E (TIMMINS WEST MINE GRID)
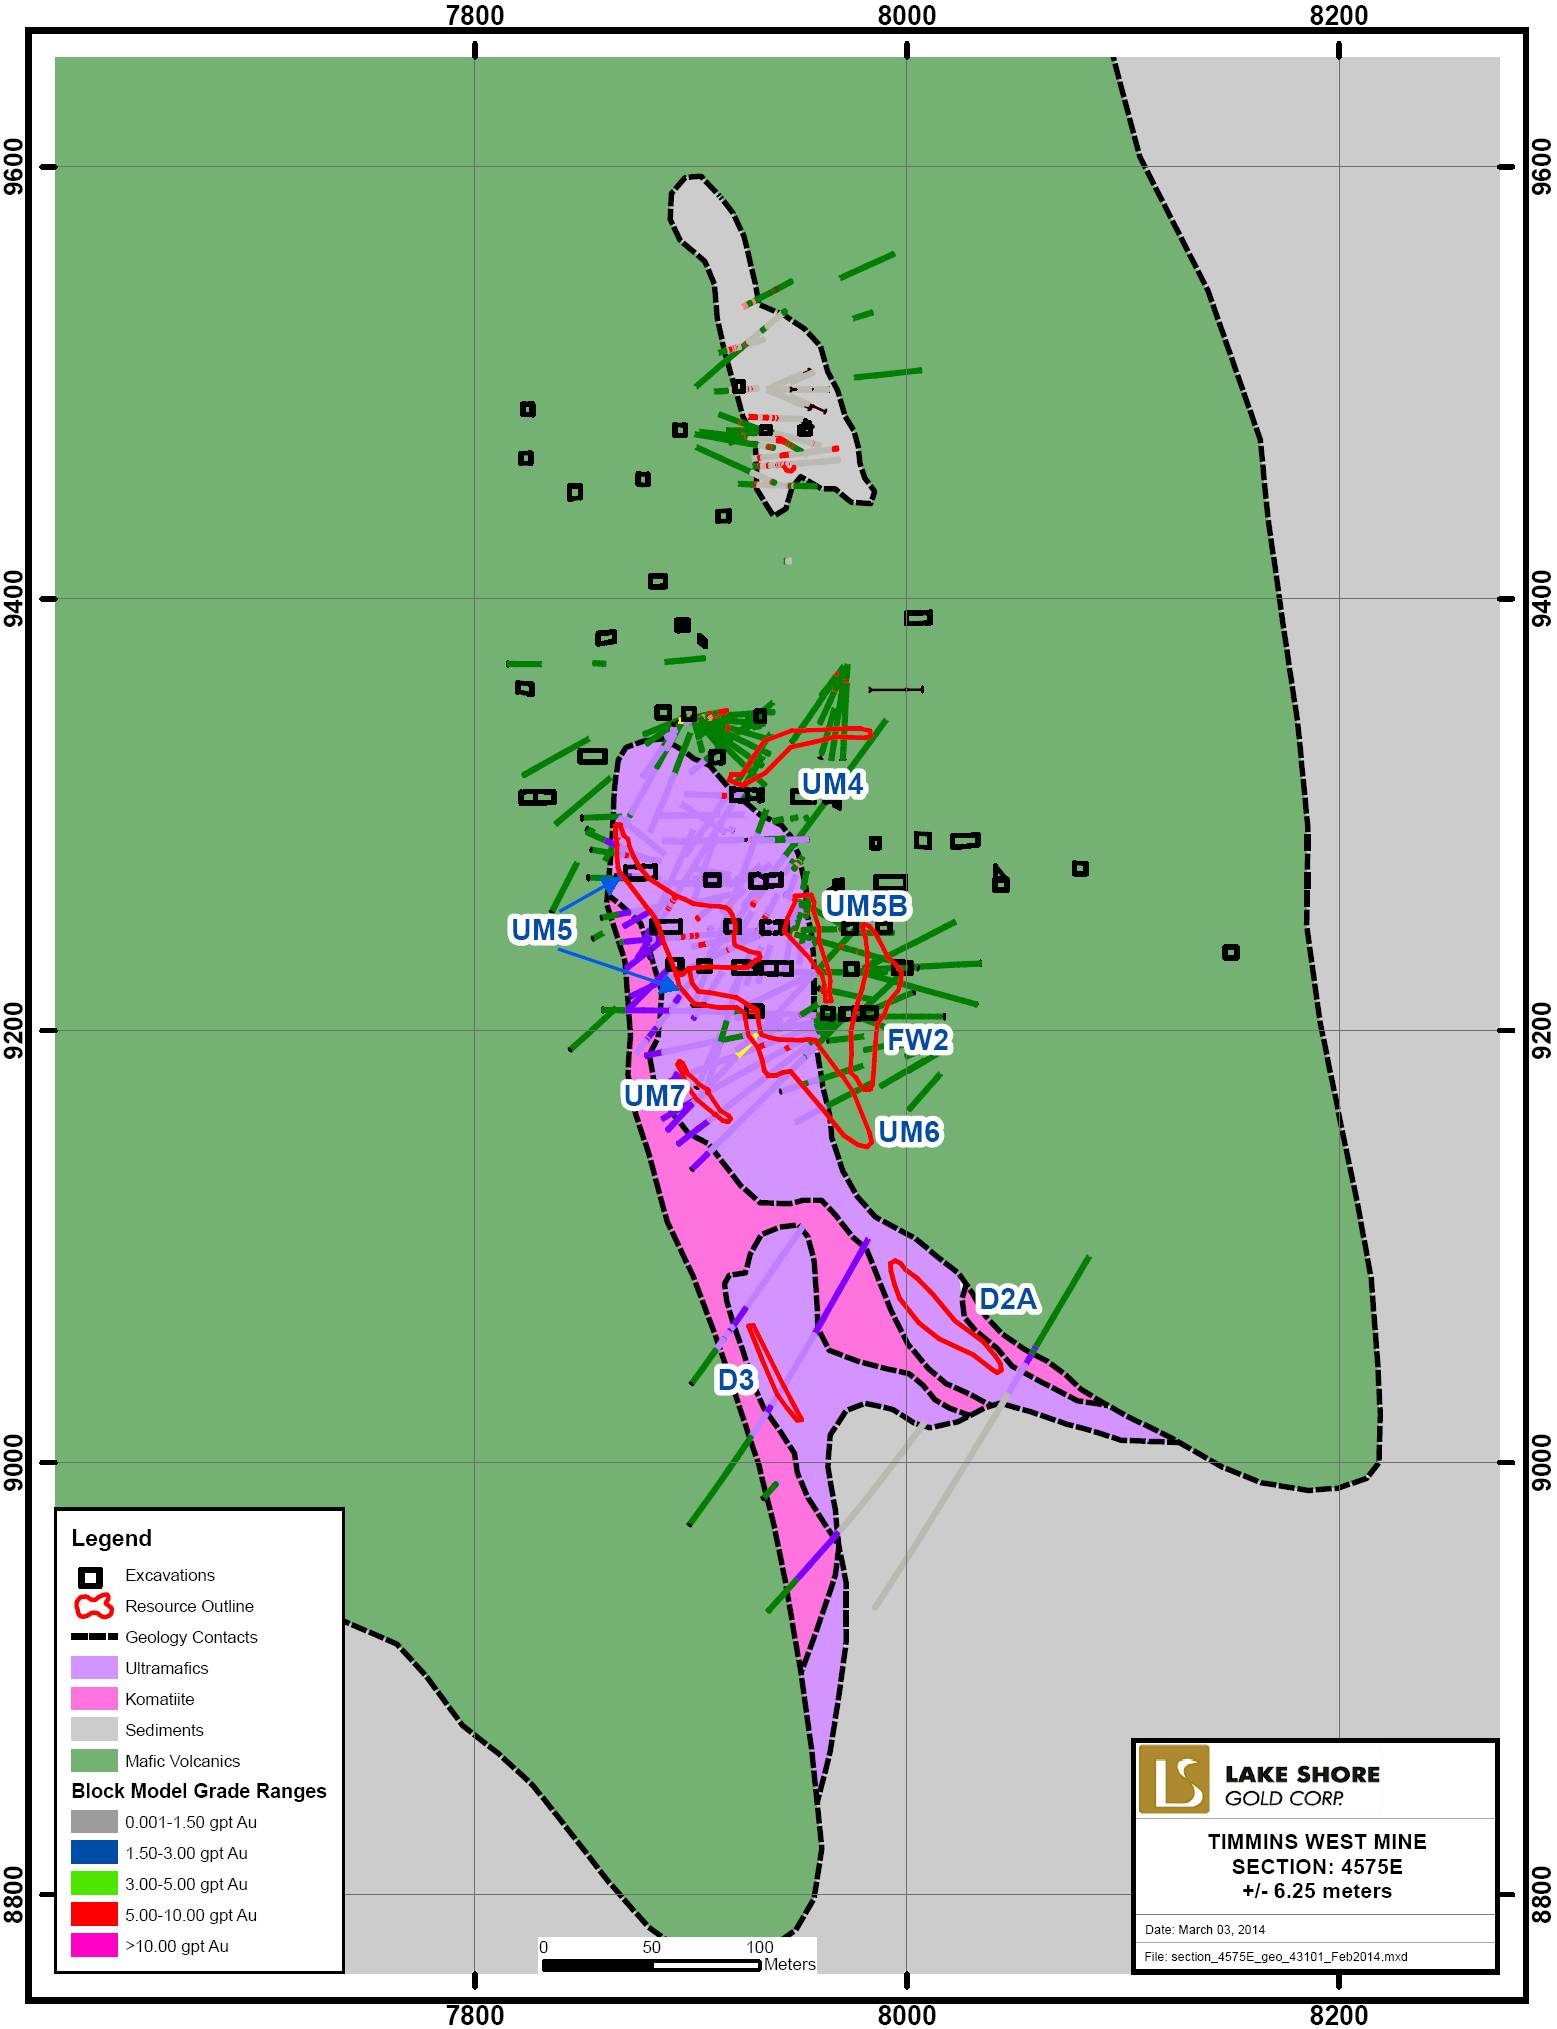
55
FIGURE 7.6: THUNDER CREEK UNDERGROUND GEOLOGY 300 M LEVEL (UPPER MINE)
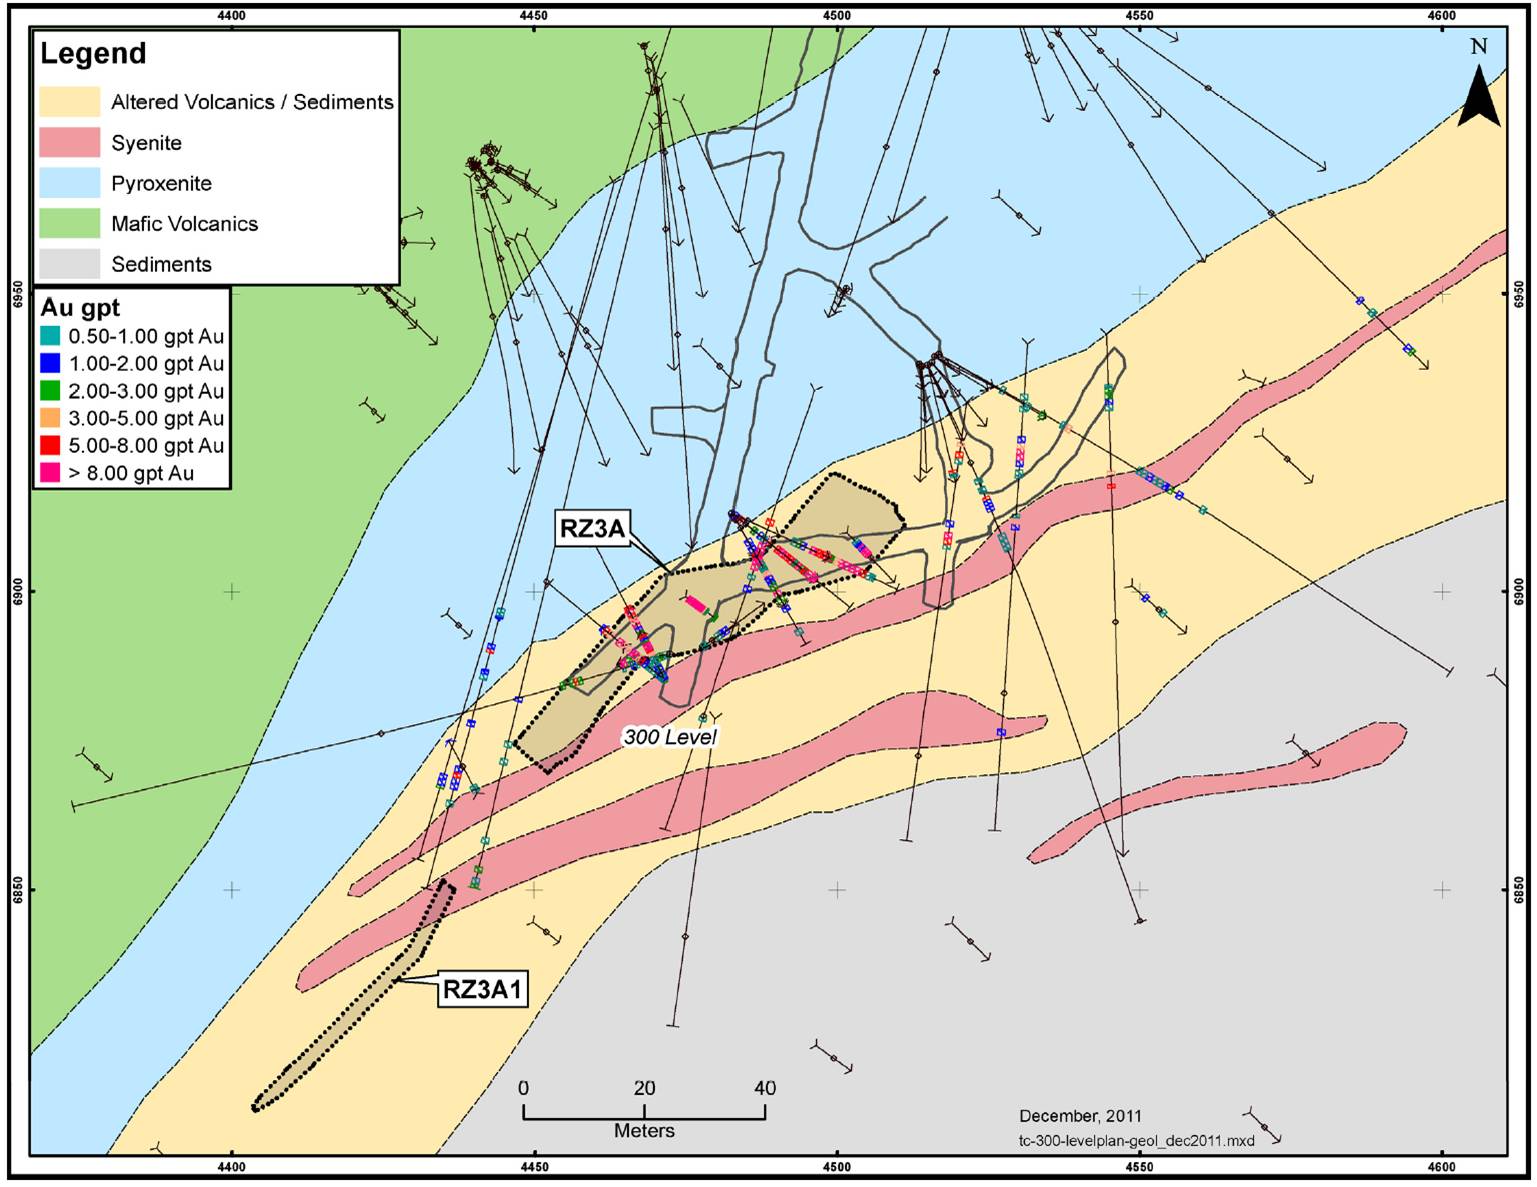
56
FIGURE 7.7: THUNDER CREEK UNDERGROUND GEOLOGY 765 M LEVEL
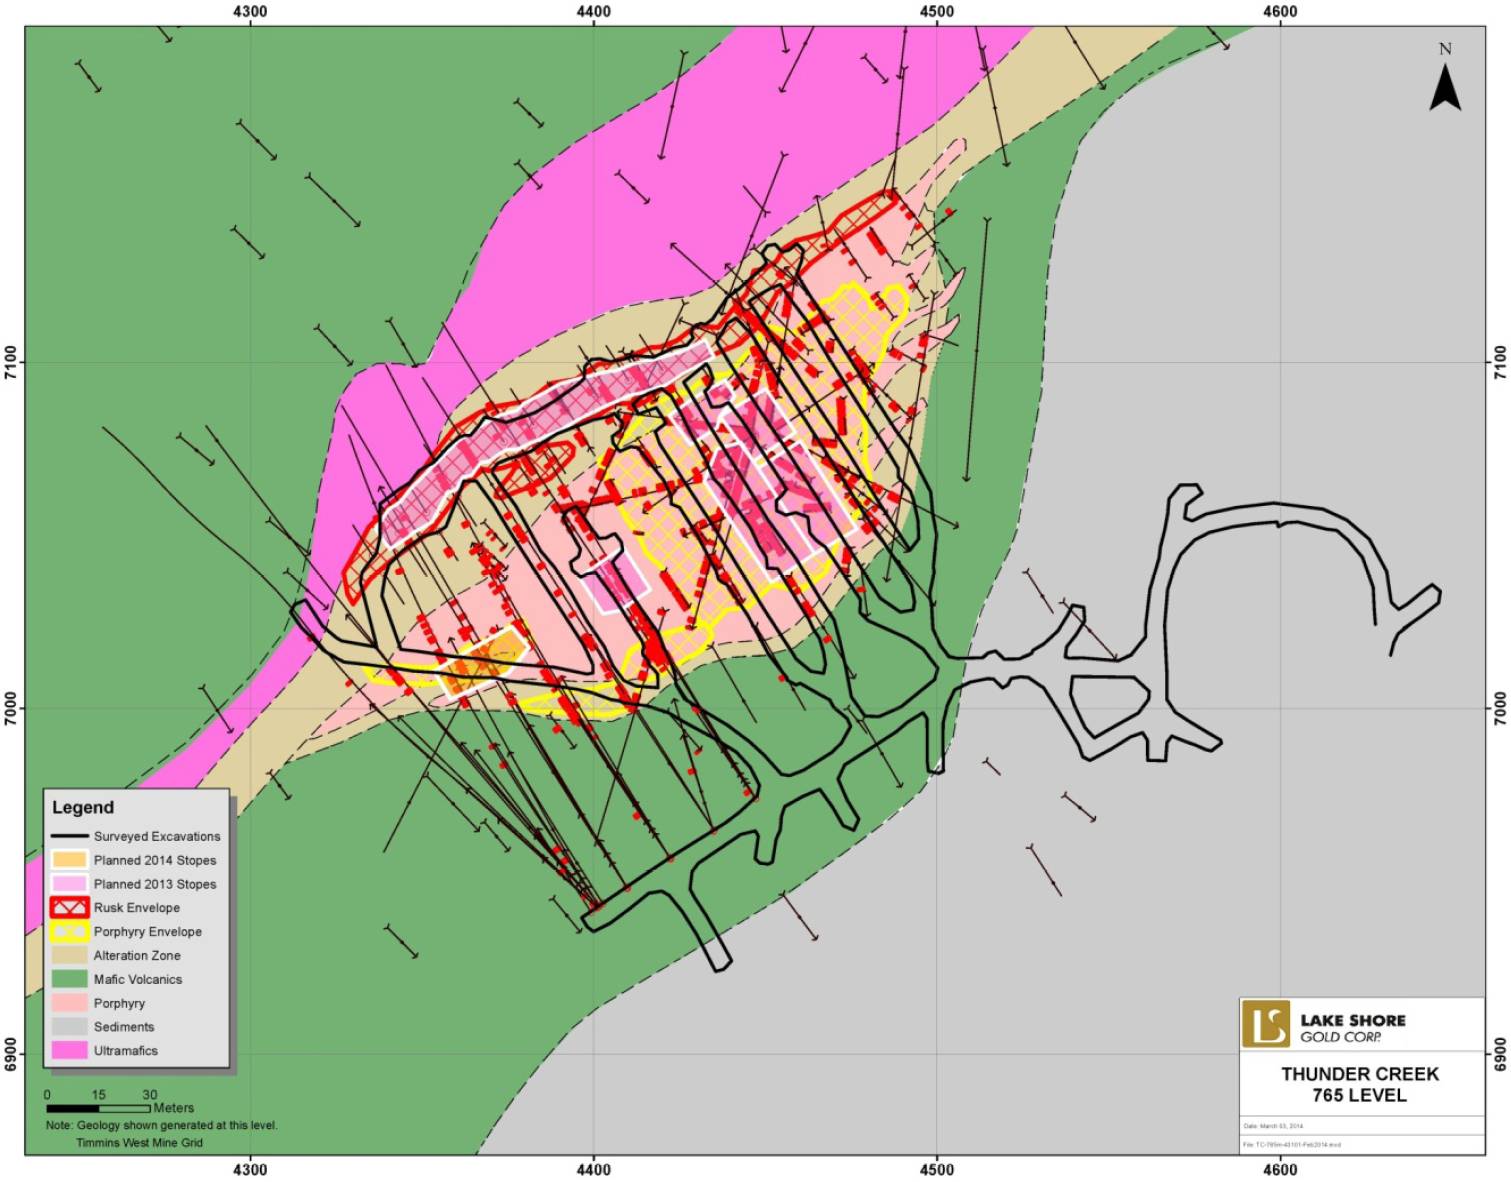
57
FIGURE 7.8: THUNDER CREEK GENERALIZED CROSS-SECTION, 9550N (THUNDER CREEK SURFACE GRID)
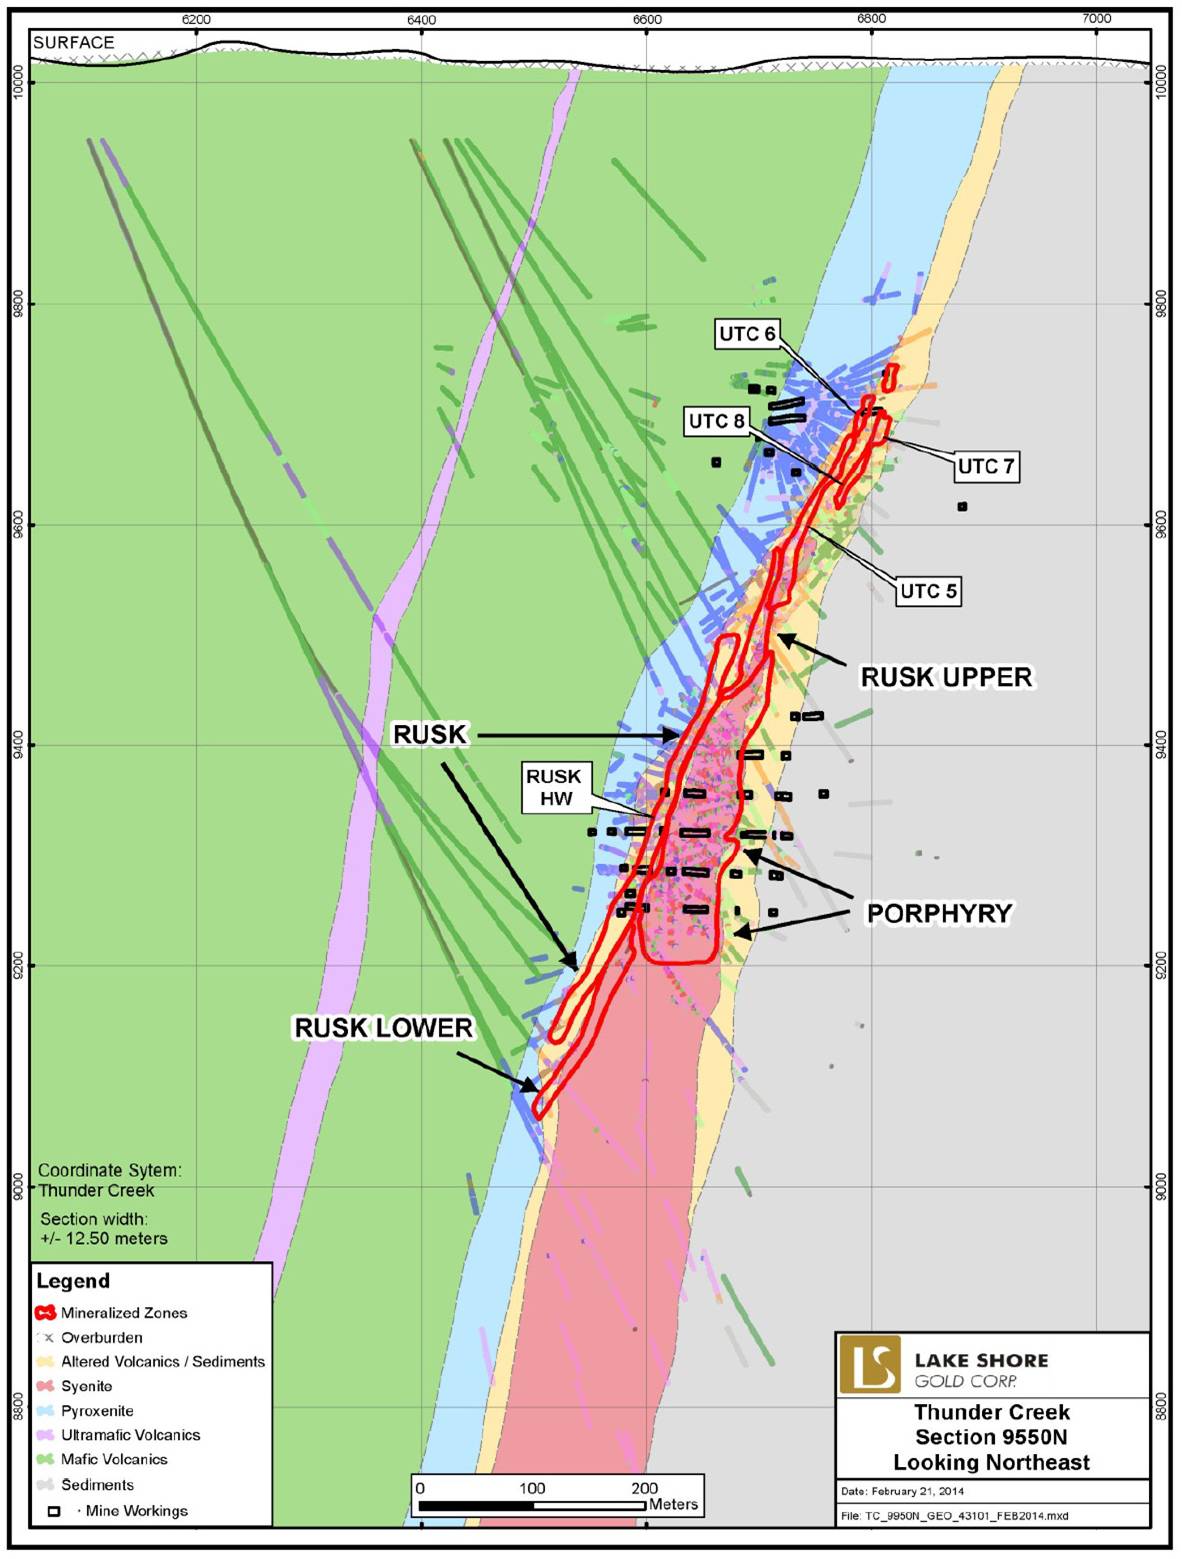
58
FIGURE 7.9: 3-D VIEW LOOKING EAST, ILLUSTRATING TIMMINS WEST MINE SHAFT, RAMPS, LEVELS, AND RESOURCE ENVELOPES
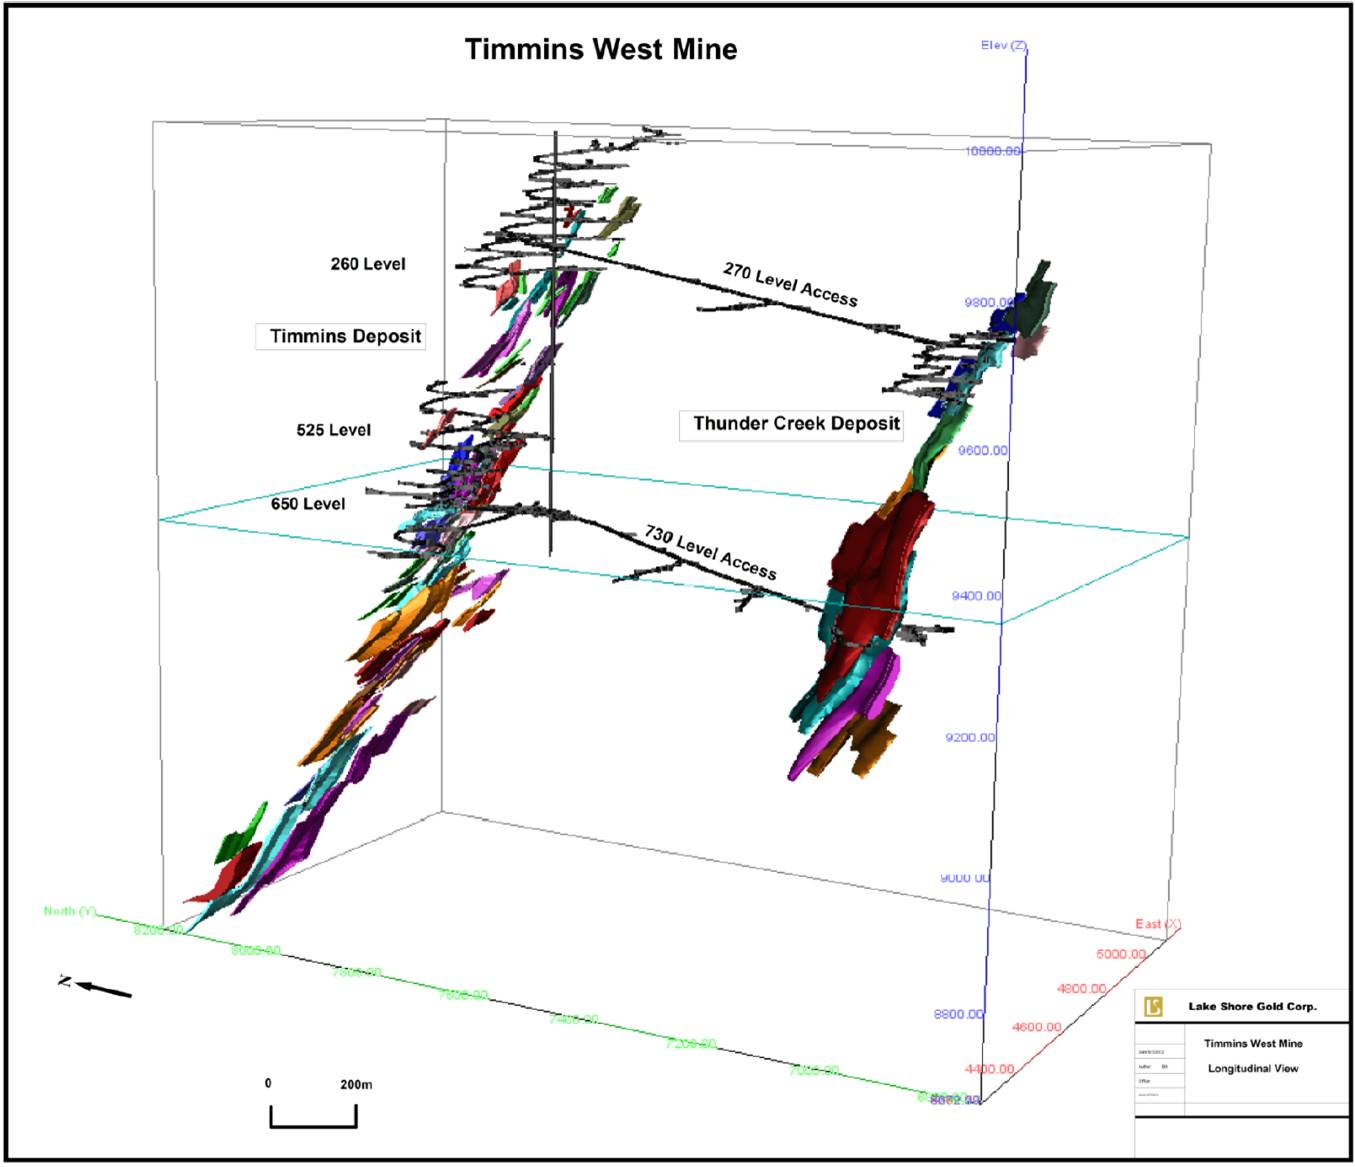
59
FIGURE 7.10: STRUCTURAL PLAN, 300 LEVEL (RHYS, 2010)
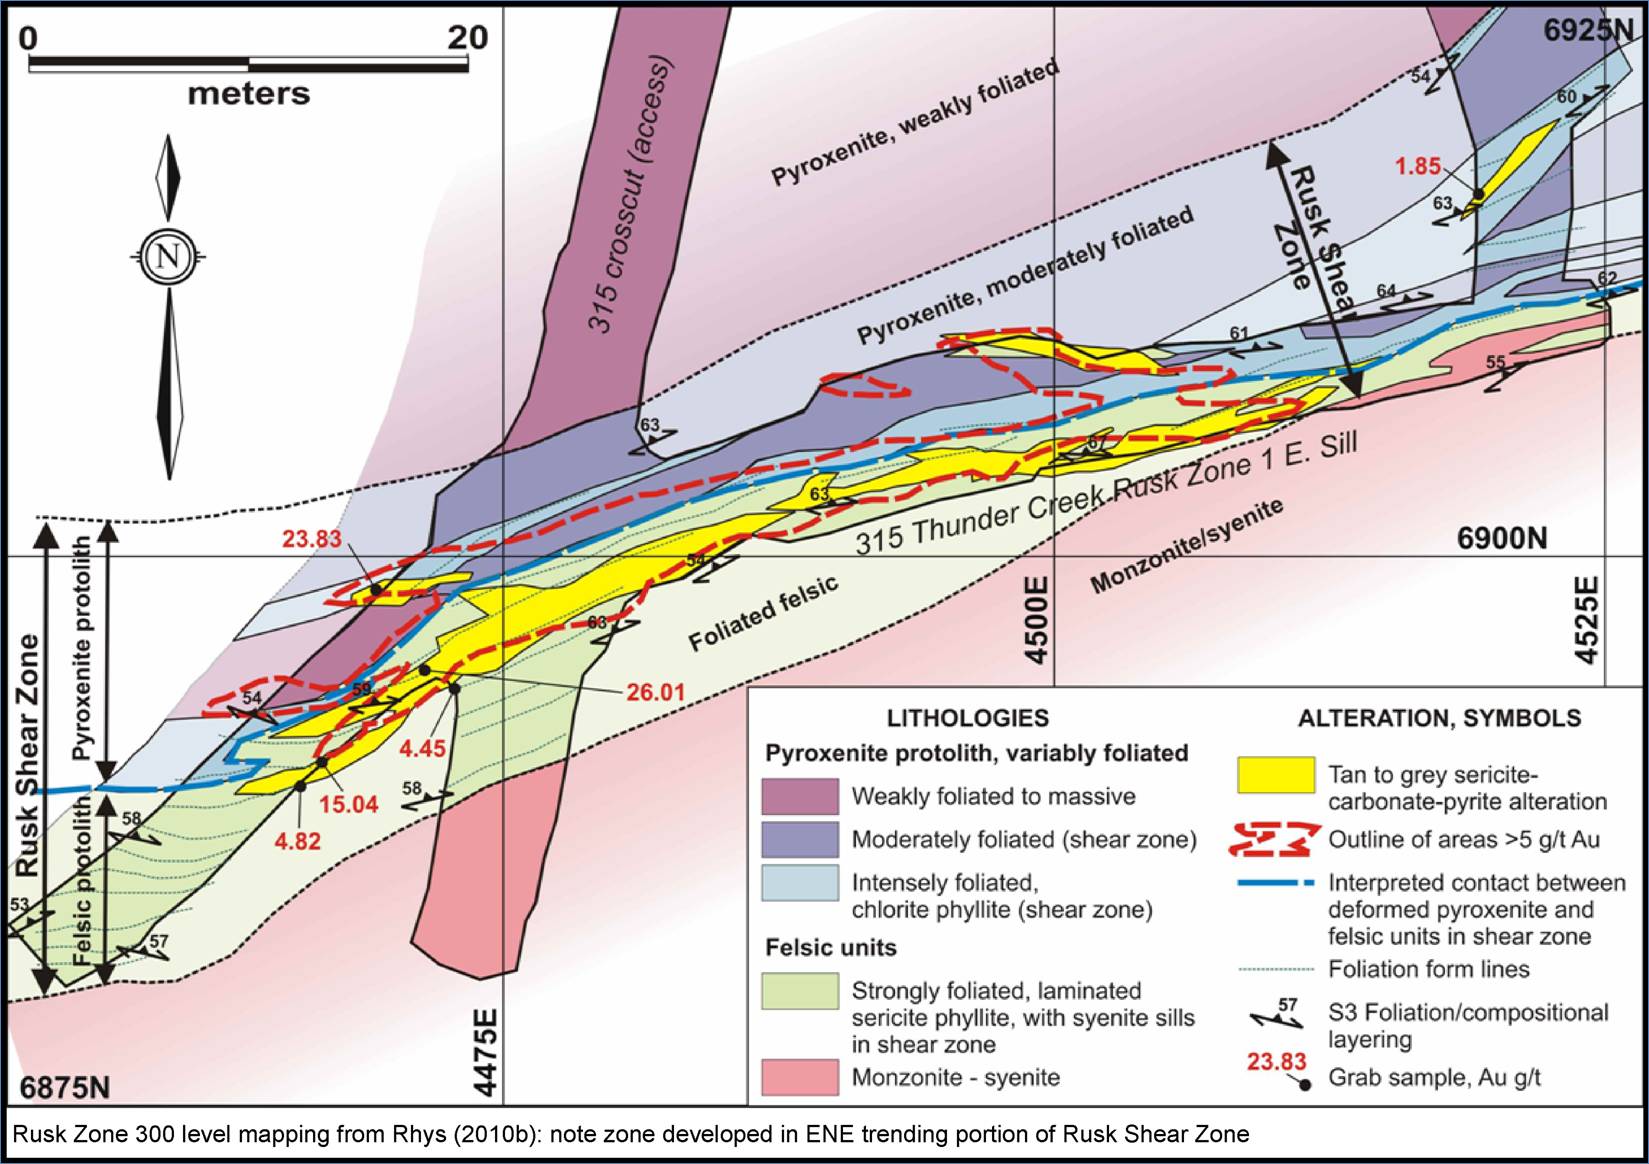
60
8.0 DEPOSIT TYPES
The Porcupine area is well known for hosting two mineral deposit types; 1) a volcanogenic massive sulphide deposit (Glencore’s Kidd Creek Mine); and 2) numerous mesothermal Archean shear-hosted gold deposits. Historic production to the end of 2006, from some 50 mining operations is reported to be 2,028,140 kilograms (65,206,222 ounces) of gold. Table 8.1 highlights the 21 mining operations that exceeded 3,110 kilograms (100,000 ounces) of gold production.
The setting of the Timmins West Mine is characteristic of mesothermal Archean shear-hosted gold deposits. Dube and Gosselin (2007) have summarized the general consensus that greenstone-hosted quartz-carbonate vein deposits are related to metamorphism and thermal re-equilibration of subducted vocano-sedimentary terrains. The deep seated, Au-transporting metamorphic fluid has been channeled to higher crustal levels through major crustal faults or deformation zones, similar to the Destor Porcupine Fault Zone located about 3.5 kilometres south of the Timmins West Mine. Along its pathway, the fluid has dissolved various components, notably gold, from the volcano-sedimentary packages, including a potential gold rich precursor. The fluid then precipitated as vein material or wall-rock replacement in second and third order structures at higher crustal levels through fluid-pressure cycling processes and temperature, pH and other physic-chemical variations.
Mineralization style at the Timmins West Mine is typical of the Timmins and Kirkland Lake gold camps. There are detailed differences with each deposit with respect to individual structural controls, vein density, gold tenor, gold/silver ratio, and size, but they do have some commonality. In his 1997 PhD thesis titled “Geological Setting of Gold Deposits in the Porcupine Gold Camp, Timmins, Ontario”, Brisbin generalizes the ore bodies are typified by single or multiple quartz-carbonate veins with or without albite, tourmaline, sericite, pyrite, and other sulphides, and native gold hosted in carbonatized, sericitized, albitized and pyritized wallrock. Gold occurs both in the veins and the wallrock. The most significant gold deposits are spatially associated with quartz-feldspar porphyry stocks and dykes, and with albitite dykes both of which intrude the folded Archean supracrustal rocks. The supracrustal rocks, porphyry intrusions, albatite dykes and gold mineralization were affected by metamorphism, and penetrative deformation during the Kenoran Orogeny (Brisbin, 1997). Brisbin further compares gold production with lithology. Over 75% of gold production from the Porcupine Camp (1997) was mined from orebodies in the Tisdale Group rocks (which are thus considered the most important rocks in the camp). Approximately 15% of the gold from the Porcupine Camp has been hosted by Timiskaming Group rocks making them the second most important host. Porphyritic intrusions, hetrolithic breccia bodies and albitite dykes host nearly 10% of the gold produced in the camp.
Gold mineralization in the Timmins West Mine occurs in steep north-northwest plunging mineralized zones which plunge parallel to the local orientations of the L4 lineation features which also plunge parallel to the lineation, including folds and elongate lithologies. Mineralization occurs within, or in favourable lithostructural settings within 100 metres of the Holmer and Rusk Shear Zones. Mineralization comprises multiple generations of quartz-carbonate-tourmaline ±albite veins, associated pyrite alteration envelopes, and disseminated pyrite mineralization. Textural evidence suggests that veining formed progressively through D3 and D4 deformation. All phases of gold-bearing veins cut and postdate alkali intrusive complex (AIC) and syenitic to monzonitic intrusion, although mineralization is often spatially associated with ore preferentially developed within these intrusions (Rhys, 2010).
61
TABLE 8.1: OPERATIONS WITH GREATER THAN 100,000 OUNCES OF GOLD PRODUCTION IN THE PORCUPINE GOLD CAMP
Mine | | Kilograms Gold Produced | | Ounces Gold Produced | |
Hollinger | | 601,158 | | 19,327,691 | |
Dome | | 487,558 | | 15,675,367 | |
McIntyre Pamour Schumacher | | 334,423 | | 10,751,941 | |
Pamour #1 (Pits 3, 4, 7, Hoyle) | | 131,393 | | 4,224,377 | |
Aunor Pamour (#3) | | 77,828 | | 2,502,214 | |
Hoyle Pond | | 72,046 | | 2,316,346 | |
Hallnor (Pamour #2) | | 52,582 | | 1,690,560 | |
Preston | | 47,879 | | 1,539,355 | |
Paymaster | | 37,082 | | 1,192,206 | |
Coniarum/Carium | | 34,512 | | 1,109,574 | |
Buffalo Ankerite | | 29,775 | | 957,292 | |
Delnite (Open Pit) | | 28,740 | | 924,006 | |
Pamour (Other Sources) | | 21,046 | | 676,645 | |
Broulan Reef Mine | | 15,519 | | 498,932 | |
Broulan Porcupine | | 7,485 | | 240,660 | |
Owl Creek | | 7,368 | | 236,880 | |
Hollinger Pamour Timmins | | 5,663 | | 182,058 | |
Nighthawk | | 5,468 | | 175,803 | |
Moneta | | 4,642 | | 149,250 | |
Crown | | 4,303 | | 138,330 | |
Bell Creek | | 3,507 | | 112,739 | |
21 Site Totals | | 2,009,976 | | 64,622,226 | |
The Porcupine Camp Total (50 Sites) | | 2,028,140 | | 65,206,222 | |
(source: http://www.mndm.gov.on.ca/mines/ogs/resgeol/office)
62
9.0 EXPLORATION
9.1 GENERAL OVERVIEW
Prior to 2003, all exploration on the Timmins West Mine area was carried-out by previous operators (as summarized in Item 6.0). Since then, exploration on the Timmins Deposit and Thunder Creek Deposit by Lake Shore Gold (LSG) has primarily consisted of diamond drilling (discussed in Item 10 of this report). Other exploration activites from 2003 to present are summarized in Table 9.1 and include basic geological and structural mapping, prospecting, outcrop stripping, lithogeochemical sampling, and MMI surveys. Airborne geomagnetics, and surface and downhole IP surveys were also completed, along with various research projects.
TABLE 9.1: SUMMARY OF SIGNIFICANT EXPLORATION ACTIVITY BY LSG AT THE TIMMINS WEST MINE — 2003 TO PRESENT (EXCLUDES DRILLING)
YEAR | | ACTIVITY | | UNITS | | COMMENTS |
2003 | | Fugro Airborne Magnetic Survey | | 237 km | | Timmins Mine property (Soltanzadeh and Griffith, 2003) |
2003-2012 | | Structural Mapping and Interpretations; Microscope Petrography | | Several surface and underground visits | | Several reports (D. Rhys and K. Ross — Panterra Geoservices Inc.) |
2004 | | Geological Mapping; Stripping; Sampling | | 103 samples | | Thunder Creek property (Hockings and Marsden, 2004) |
2004 | | MMI Geochemical Survey | | 830 samples | | Thunder Creek property (Hockings and Marsden 2004) |
2004-2010 | | Microscope Petrography | | | | Several reports on both Timmins and Thunder Creek Deposits (A. Miller) |
2006 | | Outcrop Stripping, mapping and sampling | | 3 areas; 135 samples | | Thunder Creek property (Samson, 2008) |
2008-2013 | | Lithogeochemical and Stable Isotope Study and correlation to gold mineralization | | Bristol and Thorneloe Twps | | MSc Thesis Study with Wayne State Univ. (Z. Stevenson and Dr. E.H. van Hees, 2013) |
2009 | | Geological Mapping | | 5 km square | | Surrounding the Rusk surface showing (Camier, 2009) |
2009-2012 | | Surface and Underground Structural Mapping | | | | |
2010 | | Resistivity, IP (pole-dipole), and Ground Magnetic Surveys | | 82 km mag; 45 km IP; proposed tailings condemnation program | | Thunder Creek property (Abitibi Geophysics Ref. 10N085) |
| | 3-D Downhole Spectral IP | | 9 boreholes surveyed | | Thunder Creek and Timmins Mine property (JVX Ref. 10-05, 2010) |
2012 | | Clarity3D DSIP/Resistivity survey | | 6 boreholes | | Thunder Creek property (JVX Ref. 12-050) |
2013 | | Regional Geophysical Data Compilation and Reprocessing | | | | Laurie Reed (Geophysical Consultant) |
Ongoing | | Characteristics of Syenite-Hosted Au Mineralization at the Timmins West Mine | | | | MSc Thesis Study with Western Univ. (R. Campbell and Dr. R. Linnen) |
Note: All drilling statistics are summarized in Item 10.0
63
9.1.1 Timmins Deposit
When LSG optioned the property from Holmer Gold Mines in 2003, the initial main focus of the surface exploration program was diamond drilling the down-plunge and along-strike extensions of the Footwall and Ultramafic Zones. As underground access became available (starting in 2008), the priorities gradually shifted towards infill drilling and stope definition drilling. This work led to the preparation of a Mineral Resource estimate in 2004, reported in accordance with NI 43-101, followed by updates in 2006, 2009, 2011, and 2012, also reported in accordance with NI 43-101.
Exploration activities by LSG on the Timmins Deposit consisted primarily of diamond drilling. The diamond drilling results are included in Item 10. The highlights of the programs are summarized as follows:
2003: Drilling completed in 2003 consisted of 53 NQ holes and wedge holes totaling 17,145 metres. Twenty-three of these holes were deep mineral resource expansion holes. Nine were exploration holes completed away from the known resource and 21 short holes were drilled in an area above 100 metre vertical in a program designed to define an open pit resource. The nine exploration holes which tested geological, structural, and alteration targets did not yield significant gold assay results.
2004: An additional 38 diamond drill holes totaling 17,655 metres were drilled to extend the resources from 4715E to 4595E and to a depth of 850 metres. Thirty-five of the holes were directed towards Mineral Resource expansion and three were exploration holes directed towards various exploration targets on the property. The exploration holes did not return significant results.
2005: During 2005, 58 diamond drill holes totaling 28,875 metres were completed. Forty-seven of the holes were directed towards Mineral Resource expansion and 11 were exploration holes targeting the sediment-volcanic contact to the north and east of the deposit. Only minor anomalous gold values were obtained in the northeast portion of the property.
In January 2005 a Pre-feasibility Study was initiated by LSG with support from SRK. The study was completed in 2007 and indicated potential for a 1,000 tonne per day underground mining operation.
2006: LSG completed 55 diamond drill holes totaling 28,313 metres. Thirty holes were directed towards down plunge Mineral Resource expansion and 25 were exploration holes. The exploration holes targeted the possible extensions of the deposit along strike and at depth, as well as various other exploration models.
2007: LSG drilled 20 diamond drill holes (10,959 metres). Most were drilling exploration targets with some testing down-plunge extensions to the Vein Zones. No new mineralization was discovered, and drilling below the veins had limited success due to excessive hole deviation. Two sub-vertical shaft pilot holes were completed, and several old holes were re-collared and extended past the proposed shaft area in order to explore and record additional structural data. Geotechnical core logging and packer testing was completed by Golder Associates (Sudbury) on selected holes. Numerous holes drilled into the deposit and around the proposed mining infrastructure were cemented/grouted and plugged, and several casings were removed. LSG has also continued with the planning and initial implementation of the AEP throughout 2007 as covered in the 2007 SRK Technical Report.
2008: A total of 75 surface holes (9,844 metres) were completed in 2008. Twenty-one shallow holes (877 metres) were designed to assist in the definition of a ramp area in the vicinity of the main showing.
64
Twenty-six holes were focused on exploring to the east and south of the mine site, mainly targeting the volcanic-to-sedimentary contact zone. No significant mineralization was intersected. Twenty-eight geotechnical holes (RC-holes) were also completed in the ramp area. Historical drill holes into the deposit and near mine developments were also cemented. Underground diamond drilling commenced on the property in October 2008, initially via the ramp. Underground drilling during late 2008 targeted upper areas accessible from the ramp being developed at the time. This included drilling of the Main Zone, Vein 1 and Vein 2.
2009: Surface holes completed in 2009 (10,086 metres in 13 holes) targeted the volcanic-to-sediment contact zone south of the mine site, and others explored for down-plunge extensions to the deposit west of section 4350E. Four exploration holes were also drilled from a drill bay, on the 525 metre Level (525-029 to -033; 2722 metres). As the ramp progressed to deeper levels, underground drill targets included the Main Zone, Vein 1, Vein 2, Vein 3 and Footwall Zones. Once the shaft was available, drilling commenced from the shaft area with drilling on the 525 metre Level, followed shortly after by drilling on the 650 metre Level. Drill targets in the shaft area include the Ultramafic Zone and Footwall Zones. By year-end the surface ramp development had reached a vertical depth of 200 metres and ramp development from the 650 metre Level had reached the 630 metre Level. Sill level development on the 650 metre Level UM complex was also completed.
2010: Three surface holes targeted the extension of the deposit at depth, and had limited success mainly due to technical difficulties and deviations (1,737 metres in three holes). In March 2010, the Timmins Mine shaft was completed to a depth of 710 metres. A total of 350 underground drill holes (46,315 metres) were completed on the Timmins Deposit mineralization in 2010. The drilling was split between Upper Mine ramp drilling and Lower Mine shaft drilling. The primary targets in the Upper Mine targeted the FW, Vein Zones and MZ from the 270 to 400 metre Level. The drilling was a combination of delineation/definition and exploration drilling in the case of the MZ where the Mineral Resource had not been modeled below the 260 metre Level. Drilling from the Lower Mine was concentrated on sectional resource definition of the UM, FW and MZ below the 525 metre Level. By year end, the surface ramp development had reached a vertical depth of 290 metres. The ramp in the Lower Mine extended from the 525 to below 650 metre Level.
Commercial production was announced January 1, 2011 at the Timmins Deposit.
2011: Three surface wedge-holes targeting the deposit at depth were attempted (1,022 metres); two hols were abandoned due to technical difficulties, and the other was suspended indefinitely due to a change in priorities. A total of 295 underground holes (40,878 metres) intersecting the Timmins Deposit were also completed. This was moderately less than 2010 as the focus was shifted to delineating the Thunder Creek mineralization for an initial Mineral Resource by the fourth quarter of 2011. Very little drilling was conducted from the Timmins Upper Mine ramp area with the exception of the 260 metre Level MZ drilling. The majority of the drilling was focused on shaft area drilling including delineation of the UM complex between the 610-525 metre Levels, and MZ and FW Zone drilling from the 525 metre Level. Drilling in the fourth quarter of 2011 transitioned to below the 650 metre Level, as drills were mobilized from the Thunder Creek drill platforms to the Timmins Deposit. Approximately 15 stope definition holes collared from the 650 metre Level were extended to explore south of the Timmins Deposit, although most holes did not reach the projected volcanic-to-sediment contact zone since the target depth was beyond the drill rig capacity. Four additional holes (4,525 metres) were also drilled towards the north from an exploration drift off the Thunder Creek ramp on the 680 metre Level (680-001 to -002A). The holes targeted the volcanic-to-sediment contact zone below the plunge of the
65
Timmins Mine, around 1300 metre Level. Strong alteration and deformation were noted, but no significant results were obtained. By the end of 2011, development in the Lower Mine extended from the 480 to 725 metre Level.
2012 to November 26 2013: No surface exploration was carried out on the Timmins Mine property since 2011. The main focus of all underground drilling has been directed towards upgrading the resource and stope definition. A 185 metre long “exploration drift” was developed on the 790 metre Level, to allow for infill drilling of the Timmins Deposit down to approximately the 1150 metre Level. Holes drilled from that location are occasionally extended beyond or outside of the resource model in order to explore for new mineralization. By the end of 2013, the ramp in the Lower Mine was advancing to the 870 metre Level.
An underground exploration program is being proposed for 2014, consisting of 170 metres of development and approximately 20,000 metres of diamond drilling. The program would be carried-out from the 790 Exploration Drift, from a new drill bay on the 830 metre Level, and from a new exploration drift located in the sediment-to-ultramafic fold nose (790-S2 Exploration Drift). The program is designed to test the limbs to the “Timmins Mine fold structure”, to test for up-plunge and down-plunge extensions to the S1 and S2 Zones, and explore the sediment-to-volcanic structural zone which is hosting the Timmins and Thunder Creek Deposits (further recommendations are included in Item 26.0).
9.1.2 Thunder Creek Deposit
Exploration activities by LSG on the Thunder Creek Deposit began shortly after the property was optioned from Band-Ore Resources in 2003. The claim group was optioned because it is contiguous to the Timmins Gold property and was known to be hosting at least one gold showing, discovered by Rusk Porcupine Mines Ltd. in the early 1940’s. Historical trenching and shallow diamond drilling had returned gold assays up to “0.24 opt over 3 feet, and 0.71 opt over 4.0 feet” on what is now referred to as the “Rusk Showing” (T-File 542). The objectives of the early LSG diamond drill campaigns was to test the historical showing, follow-up on grab samples and MMI soil anomalies, test geophysical interpreted structures, and explore various lithologies. The emphasis and targeting of the diamond drill programs evolved to the definition drilling of gold mineralization associated with gold zones hosted in the Rusk and Porphyry Zones. As Project Operator, LSG planned and carried-out all exploration activities on the Thunder Creek Deposit, eventually acquiring 100% interest in the property through a business combination in 2009 with West Timmins Mining (formerly Band-Ore Resources Limited and Sydney Resources Corp.).
All exploration on the Thunder Creek Deposit and surrounding area prior to 2003 was completed by previous operators as summarized in Item 6.0.
The main exploration activity by LSG on Thunder Creek was carried out by diamond drilling, and highlights are summarized below. Drill statistics are reported in Item 10.0, and all other exploration activities on the property are summarized in Table 9.1.
2003 — 2005: A three-phase surface diamond drilling program comprising 8,396 metres in 25 holes was completed by LSG. The program was targeting the Rusk Showing, the ultramafic complex, and tested various other structures identified during a concurring mapping program (see Item 7.0 for Geological Setting and Mineralization). Some of the significant intercepts included 5.84 g/t Au over 2.05 metres and 13.3 g/t Au over 0.70 metres in association with the Rusk Zone — (Samson 2005).
66
2004: LSG completed a reconnaissance exploration program consisting of bedrock mapping, stripping, lithogeochemical sampling, and Mobile-Metal-Ion (MMI) soil sampling. Several gold targets were identified for follow-up via diamond drilling. A single float sample from an existing pit in the Rusk Showing area returned an assay value of 71.9 g/t Au — (Hocking and Marsden, 2004).
2006: LSG completed a small stripping and trenching program at three different locations along the Southwest Shear Zone or Rusk Horizon. Gold anomalies were detected in all trenches, including up to 15.02 g/t Au over 0.41 cm in a channel sample collected from the Rusk Showing — (Samson 2008).
2007 — April 2008: Twenty five surface diamond drill holes were completed, and three holes were extended, for a total of 13,760 metres drilled (Phase 4). Objectives were to further test the Rusk Horizon, explore along an east-west shear structure, and explore in the vicinity of a syenite stock located further south. Drilling on the Rusk Horizon was most successful in defining a shoot of high-grade gold mineralization approximately 150 metres wide, 250 metres long, and steeply plunging towards the northeast along the contact between an alkalic intrusive (pyroxenite) and sediments. Some of the most significant results from these discovery holes on the “Rusk Zone” included 10.4 g/t Au over 3.95 metre (TC07-30), 24.8 g/t Au over 7.00 metre (TC07-36), and 8.6 g/t Au over 9.00 metre (TC07-43). The other exploration targets provided low-grade intercepts and further testing was recommended (Samson 2009).
August 2008 — 2009: In August of 2008, LSG announced the commencement of a 22,000 metre diamond drill program (Phase 5), in order to follow-up on the Rusk Zone and other high-priority gold targets. Drill hole TC09-54 led to the discovery of a second zone located in the footwall to the Rusk Zone, now referred-to as the “Porphyry Zone”. Significant results included 11.2 g/t Au over 10.40 metres (uncut) in TC08-54, followed by 12.8 g/t Au over 83.40 metres (uncut; apparent width) in TC09-68b. Drilling was accelerated, with up to five surface drills systematically targeting the Rusk and Porphyry Zones on nominal 50 metre spacing. At this point, a joint venture between LSG (60%) and West Timmins Mining Inc. (WTM — 40%) was being considered, and by November 2009, LSG acquired the outstanding shares of WTM, thereby acquiring 100% of the Thunder Creek property.
2010 — 2012: From 2010 to 2012, surface exploration focused on defining the overall large-scale geometry of the Thunder Creek mineralization zones by deep drilling and wedging. Wide-spaced exploration holes also targeted the TC-144 Trend, which represents an alteration and deformation corridor now being traced over 1.5 kilometres from the Thunder Creek Deposit towards the southwest. Some of the best intercepts include 8.0 g/t Au over 2 metres in TC10-85a, and 6.1 g/t Au over 3 metres in HWY-12-40 (LSG Press Release Jan 21, 2013). The last surface diamond drill hole on Thunder Creek was completed in November 2012.
Concurrently, in 2010, an Advanced Exploration program was initiated to open up and cross cut mineralization at Thunder Creek utilizing access from the Timmins Deposit shaft and other underground infrastructure. Ramps were driven for a horizontal distance of roughly 660 and 890 metres from the Timmins Deposit 200 and 650 metre Levels to access the Rusk and Porphyry Zones on the 300 metre and 730 metre Level. Drill cut-outs were excavated and underground exploration and definition drilling began in April 2010. By November 2011, an initial resource estimate was released, including 2,877,000 tonnes at 5.6 g/t (521,600 ounces) in the indicated category and 2,693,000 tonnes at 5.9 g/t (510,000 ounces) in the inferred category. By January 2012, commercial production was declared for the Thunder Creek Deposit.
67
2013 — January 8 2014: Since 2013, drilling on the Thunder Creek property was mainly focused on upgrading the resource and on stope definition. Drill holes are occasionally extended beyond and outside of the resource envelopes in order to test for new mineralization. Other exploration activities such as an MSc thesis study on the characteristics of the syenite-hosted gold mineralization at the Thunder Creek Deposit are also ongoing.
Meunier Property
The Meunier 144 Property is contiguous to the western boundary of the Timmins West Mine. The property was optioned from Adventure Gold Inc. (AGE) by RT Minerals Corp. (RTM) and LSG in 2010. LSG proposed a deep exploration program targeting the downplunge extension of the Timmins West Deposit on the Meunier-144 property at a vertical depth of 2,400 metres.
The exploration program was completed between July 19, 2010 and March 30, 2012. One hole was abandoned at 320 metre depth (M-10-04), and one master hole completed in three wedge segments (M-10-05, -05A and -05B) successfully reached the target area, for a total of 4,038 metres (Samson 2012).
The program was successful at intersecting the projection of the Timmins West Mine gold structure, as anticipated, at a vertical depth of 2,310 to 2,572 metres below surface. Hole M-10-05B intersected a broad zone, over 370 metres wide, of locally deformed and altered pyroxenite, accompanied by quartz-carbonate ±tourmaline veining, iron-carbonated bleaching and patchy disseminated pyrite. Most significant results include 1.5 g/t Au over 1.60 metres, 2.3 g/t Au over 0.60 metres, and 1.3 g/t Au over 1.00 metre. Although the assays were disappointing, the geological setting and style of mineralization is very similar to the Timmins Deposit. Hole M-10-05B was successful in extending the mineralization at the Timmins West Mine onto the Meunier-144 property, 1.3 kilometre downplunge from the deepest previously released intercept, and over 2.9 kilometre downplunge from surface. After encountering numerous technical drilling difficulties which led to excessive costs, drill hole M-10-05B had to be abandoned in March 2012 while remaining in pyroxenite. At a remarkable depth of 3,444 metres, M-10-05B represents the deepest surface diamond drill hole in the Timmins Camp. At present, the property is a 50-50 Joint Venture between LSG and AG. LSG also has the option to increase its interest to 60% by completing a PEA.
68
10.0 DRILLING
10.1 HISTORICAL DRILLING ON THE TIMMINS WEST MINE PROPERTY
Between 1938 and 1980, 145 diamond drill holes totaling 27,622 metres were drilled on the TWM property. The information from this work is either missing or unreliable/incomplete and has not been considered in the LSG Mineral Resource estimates.
Between 1984 and 2002, diamond drilling on the TWM property was carried-out by four operators, including Norex, Chevron, St. Andrew, and Holmer Gold. All holes were drilled from surface and in reference to the same cut grid, oriented north-south, which was refurbished as required. Bradley Bros. Limited of Timmins contracted most of the drilling, using a variety of drill rigs. Most holes were NQ-size (47.6 mm diameter core), except for 37 holes which were drill using BQ rods (36.5 mm diameter core). Core recoveries were consistently excellent and close to 100 percent. Drill hole direction and dips were monitored at regular intervals (mostly 50 metre spacing) using Sperry-Sun and EZ-Shot Reflex instruments. Casings were generally left in place and capped. The hole number was stamped on the cap or indicated by a labeled steel bar emplaced at the collar. All collars were subsequently surveyed by a qualified surveyor.
A total of 47,420 metres in 159 holes were completed during this period. The majority of this drilling was directed towards initial resource definition of the Timmins Deposit and is considered to be of sufficient quality to be used for estimating mineral resources for the property. Details regarding collar and downhole surveys, core handling, and logging protocols for the historical drill programs are noted in Item 11.0 and are further discussed in previous NI 43-101 reports (Darling et al, 2009; Powers, 2009). These reports are referenced in Item 27.0 and are filed on SEDAR.
Drilling on the Thunder Creek Deposit property by previous operators (1942 to 1996) was sparse and very limited, and not significant for the current Resource estimate.
The drilling completed between 1984 and 2002 is summarized in Table 10.1. The table only includes drilling by previous operators which has been considered in the resource estimates.
TABLE 10.1: DIAMOND DRILLING BY PREVIOUS OPERATORS (1984 — 2002)
Company | | Year | | Holes | | Metres | | No. Samples | |
Norex | | 1984 | | 4 | | 1,465 | | 644 | |
Chevron | | 1987 — 1989 | | 31 | | 7,870 | | 3,620 | |
Holmer | | 1996 — 2002 | | 114 | | 36,745 | | 13,679 | |
St.Andrew | | 1999 | | 10 | | 1,340 | | 667 | |
Total: | | | | 159 | | 47,420 | | 18,610 | |
Please refer to Figure 10.1 for the surface drill collar locations.
69
FIGURE 10.1: SURFACE DIAMOND DRILL HOLE COLLAR LOCATIONS AND TRACES AND VERTICAL PROJECTION TO SURFACE OF THE OUTER PERIMETER OF THE RESOURCE
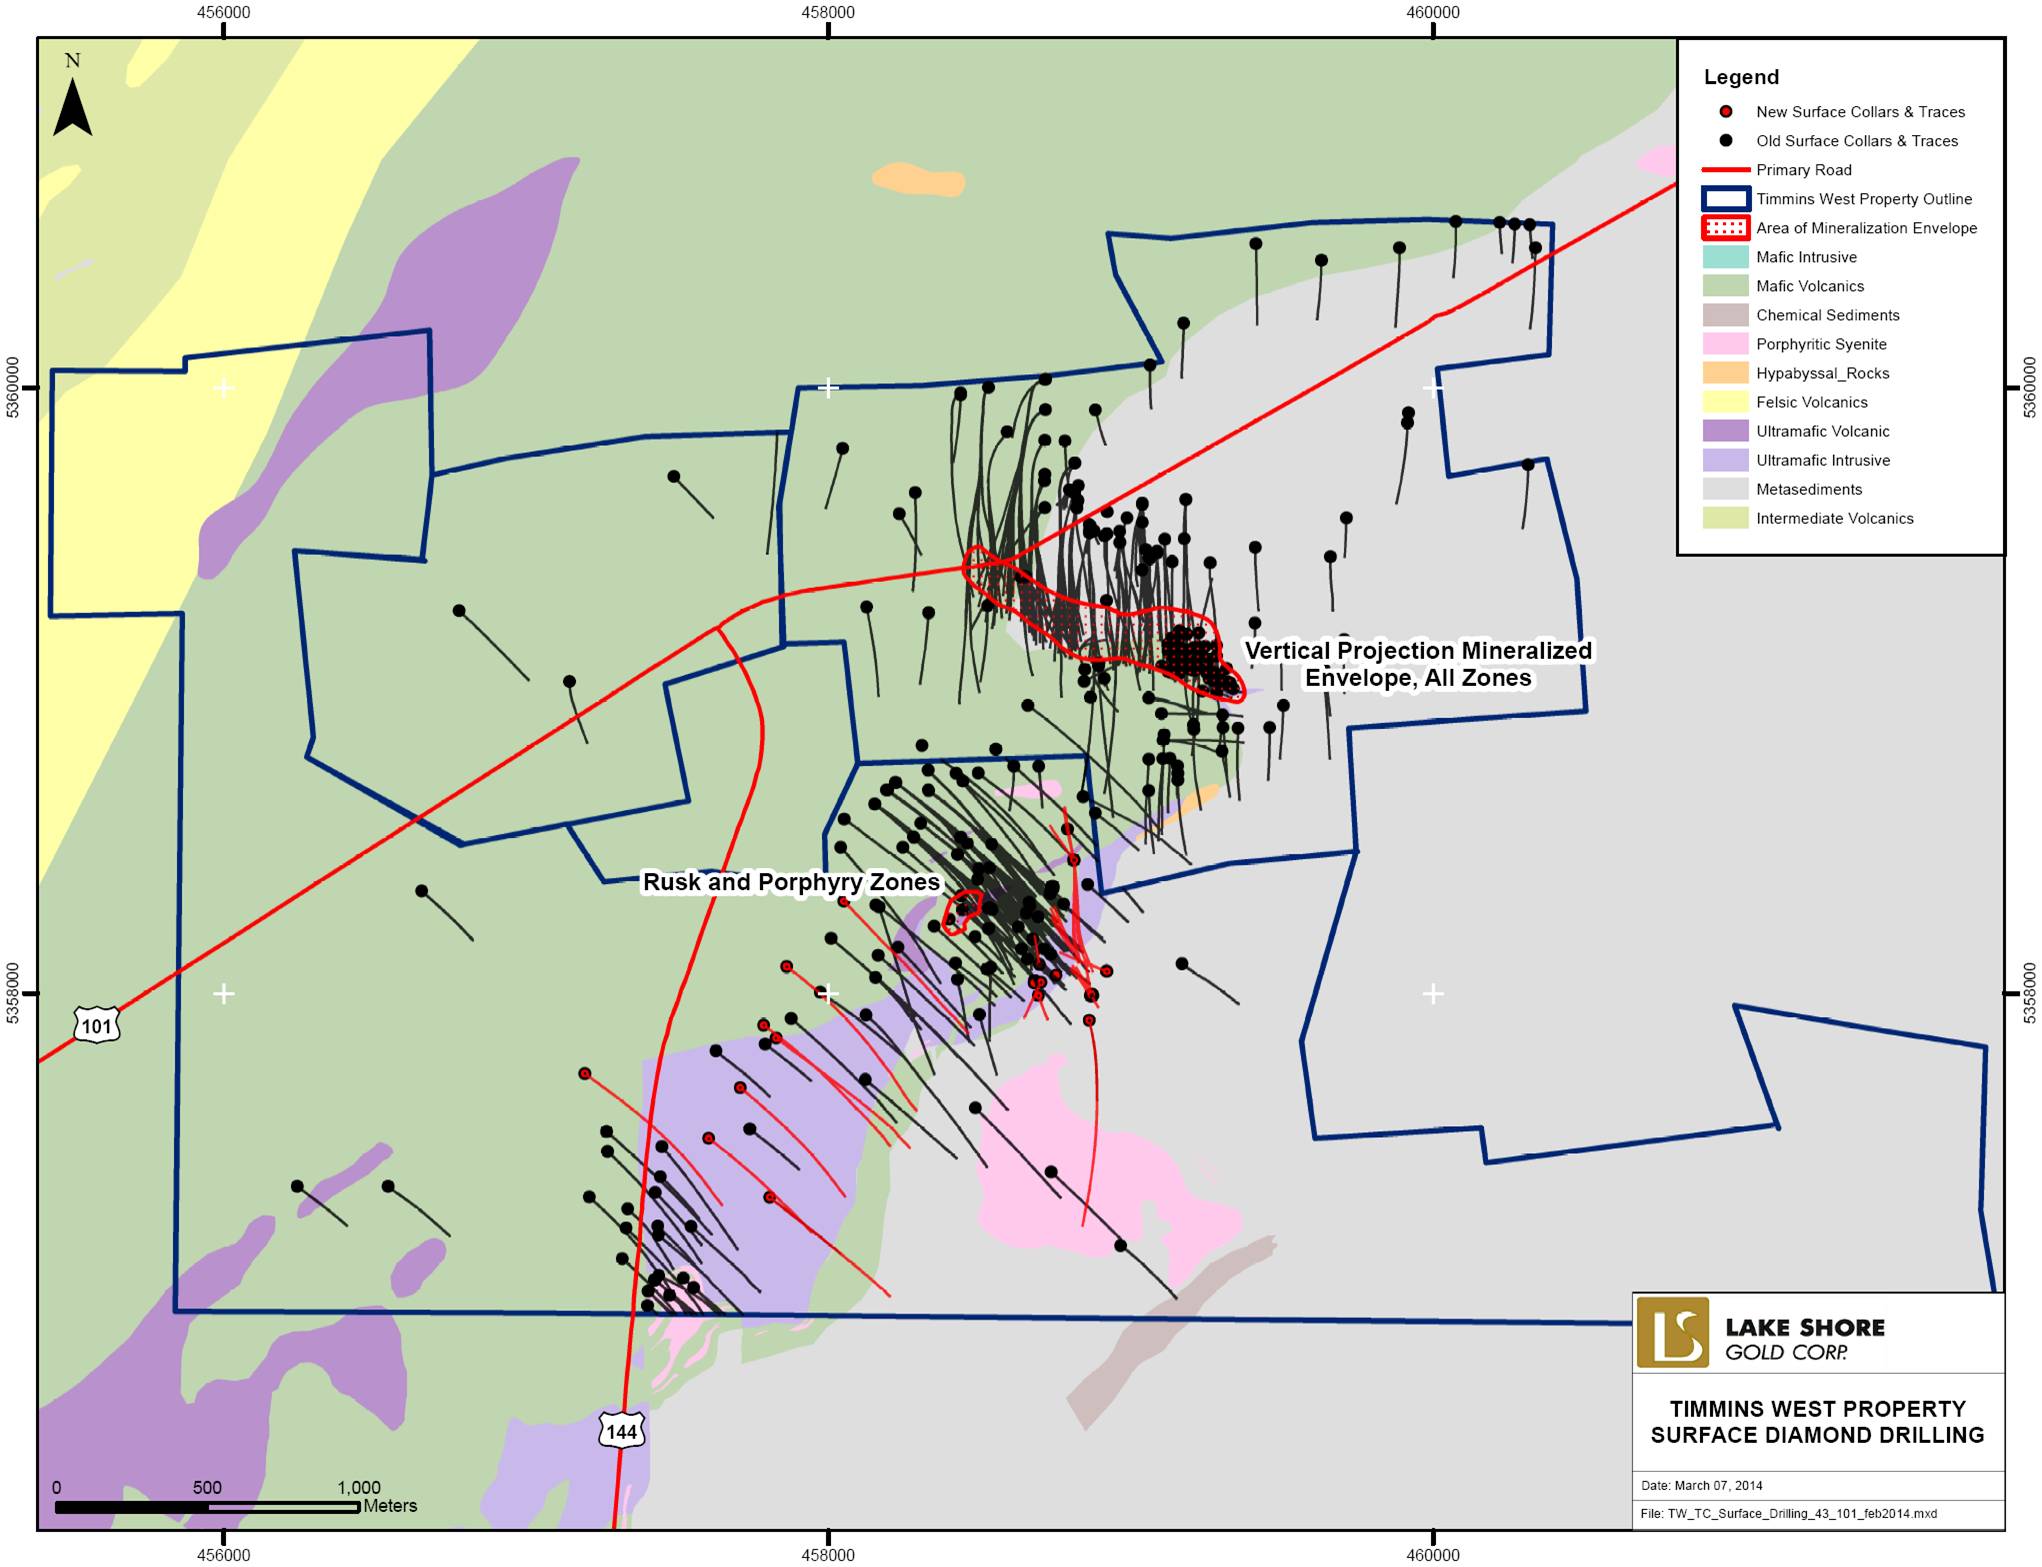
70
10.2 DRILLING ON THE TIMMINS DEPOSIT PROPERTY COMPLETED BY LSG
The main objectives and priorities for diamond drilling on the Timmins Deposit property are summarized in Item 9.0.
Procedures for surface diamond drill holes completed by LSG are similar to those described above for previous operators. Drilling was mostly contracted to Bradley Bros. Limited, and a minor portion was contracted to Orbit Garant Drilling Services of Val-d’Or. NQ-size holes were standard, except where it was necessary to reduce to BQ rods due to difficult ground conditions. Drill core recoveries were consistently excellent. For deep-drilling, numerous branches off the pilot holes were completed using steel wedges. Drill hole directions were closely monitored using EZ-Shot tests at 30 to 50 metre intervals, and downhole gyro surveys were regularly done for deep holes. Most of the holes were initially not cemented, but in 2007 and 2008, cement grout was pumped down all of the casings which were relatively easy to access. Further details are discussed in Item 11.0.
Underground diamond drilling on the Timmins Deposit started in October 2008, and was initially carried-out by Forage Azimuth Inc. of Rouyn-Noranda, followed by Boart-Longyear from April 2009 to April 2013, and has since been contracted to Orbit Garant of Val-d’Or. Various electric drills are being used and the majority of underground holes are BQTK in diameter (40.7 mm diameter core), NQ-sized rods are occasionally used on deeper holes, and HQ-sized rods are typically used for service holes. LTK-48 and AQTK core is provided when air-powered drills are used. Further details are discussed in Item 11.0.
Drilling on the TWM property by LSG since 2003 includes 318 surface holes and 1,990 underground holes, as of the effective date of this report (February 21, 2014).
Since the effective date of the last technical report on the Timmins Deposit (January 31, 2012 — Crick et al., 2012a), a total of 843 new holes have been completed, and 67,622 assays have been received. An additional 177 holes drilled prior to the last effective date have also been logged (completed backlog), providing another 15,916 new analytical results to the database.
The number of diamond drill holes and metres drilled by year are provided in Table 10.2, and additional drilling statistics are included in Table 10.3.
10.3 DRILLING ON THE THUNDER CREEK PROPERTY BY LSG
Diamond drilling on the Thunder Creek Deposit property initially focused on testing an old showing, testing various geophysically interpreted structures, and following up on MMI and grab sample anomalies. This led to the discovery of the Rusk and Porphyry Zones, which became the main focus of all diamond drilling on the property. These drilling activities are summarized in Item 9.0.
Surface drilling by LSG on the Thunder Creek Deposit began in 2003 and amounts to 209 holes, for a total of 115,837 metres drilled. This included pastefill holes, service holes, and ten grout holes completed in order to minimize water infiltrations underground (Table 10.2). The work was mostly contracted to Bradley Bros. Ltd. (Timmins), including short periods by Norex Drilling (Porcupine), and Orbit Garant (Val d’Or). All drilling protocols were the same as those implemented by LSG on the Timmins Deposit property. The only difference is that the cut grid lines are rotated, with the predominant drilling direction at an azimuth of 130 degrees. Further details are included in Item 11.0.
71
Underground drilling on Thunder Creek began in 2010 and remains ongoing. Access is provided via the Timmins Mine shaft and by ramps on two separate levels. Operations are combined with the Timmins Mine, and drilling contractors, drill specifications, and protocols are therefore the same at both locations.
As of the effective date of this report (February 21, 2014), a total of 209 surface holes (115,837 metres) and 1,065 underground holes (160,712 metres) have been drilled on the Thunder Creek property.
Since the effective date of the last technical report (October 28, 2011 — Crick et al, 2012a), a total of 694 holes have been completed, and 69,387 assays have been received. An additional 42 holes drilled prior to the last effective date have also been logged (completed backlog), providing another 8,540 new analytical results to the database.
The number of diamond drill holes and metres drilled by year are provided in Table 10.2, and additional drilling statistics are included in Table 10.3.
TABLE 10.2: STATISTICS ON DIAMOND DRILLING BY LSG FOR TIMMINS WEST MINE AREA
(2003 TO FEBRUARY 2014)
Property | | Year | | Surface Hole
Qty. | | Depth (m) | | Underground
Hole Qty. | | Depth (m) | |
Timmins Mine | | 2003 | | 53 | | 17,145 | | | | | |
| | 2004 | | 38 | | 17,655 | | | | | |
| | 2005 | | 58 | | 28,875 | | | | | |
| | 2006 | | 55 | | 28,313 | | | | | |
| | 2007 | | 20 | | 10,959 | | | | | |
| | 2008 | | 75 | | 9,844 | | 67 | | 5,456 | |
| | 2009 | | 13 | | 10,086 | | 298 | | 25,806 | |
| | 2010 | | 3 | | 1,737 | | 350 | | 46,315 | |
| | 2011 | | 3 | | 1,022 | | 295 | | 40,878 | |
| | 2012 | | 0 | | 0 | | 452 | | 64,384 | |
| | Jan 01 to Nov 26/13 | | 0 | | 0 | | 423 | | 44,417 | |
| | Nov 27/13 to Feb 21/14 | | 0 | | 0 | | 105 | | 11,603 | |
| | Subtotal | | 318 | | 125,636 | | 1,990 | | 238,858 | |
Thunder Creek | | 2003 | | 6 | | 1,667 | | | | | |
| | 2004 | | 13 | | 4,370 | | | | | |
| | 2005 | | 6 | | 2,359 | | | | | |
| | 2007 | | 22 | | 10,650 | | | | | |
| | 2008 | | 16 | | 7,921 | | | | | |
| | 2009 | | 35 | | 25,860 | | | | | |
| | 2010 | | 18 | | 11,071 | | 183 | | 24,123 | |
| | 2011 | | 56 | | 34,425 | | 244 | | 51,774 | |
| | 2012 | | 33 | | 15,839 | | 382 | | 61,513 | |
| | 2013 | | 4 | | 1,675 | | 238 | | 21,349 | |
| | Jan 01 to Jan 08/14 | | 0 | | 0 | | 0 | | 0 | |
| | Jan 09 to Feb 21/14 | | 0 | | 0 | | 18 | | 1,953 | |
| | Subtotal | | 209 | | 115,837 | | 1,065 | | 160,712 | |
Meunier | | 2010-2012 | | 4 | | 4,038 | | | | | |
Timmins West Mine Area | | Total Surface Holes | | 531 | | 245,511 | | 3,055 | | 399,570 | |
Note: Includes all pilot holes, wedge holes and extended holes completed within the period indicated. Table includes 28 geotechnical holes (2008 RC holes; 487 m), 12 mine service holes (PF and RAR holes; 5,586 m), and 10 grout holes (GRT holes; 2,296 m).
72
TABLE 10.3: DRILLING AND SAMPLING STATISTICS TO CUT-OFF DATES FROM DATABASE
Property | | Hole Qty. | | Depth
(m) | | Sample
Qty. | | Comments | |
Timmins Mine Property | | | | | | | | | |
Previous Operators (1938 - 2002) | | 304 | | 75,042 | | 21,035 | | 159 holes “considered” in the resource estimate | |
LSG (2003 to January 31, 2012) | | | | | | | | | |
Previous Drilling Old Info: | | 1,177 | | 221,174 | | 46,087 | | To last effective date | |
Previous Drilling New Info: | | 177 | | 30,350 | | 15,916 | | Backlog information after last effective date | |
LSG (1 February 2012 - 26 November 2013) | | | | | | | | | |
New Drilling Info: | | 843 | | 102,019 | | 67,622 | | 14 holes logging in progress; 2121 assays pending | |
LSG (27 November 2013 - 21 February 2014) | | | | | | | | | |
New Drilling Since Cutoff Date: | | 105 | | 11,603 | | 6,990 | | Hole completed and/or in progress since cutoff date | |
Total Holes on Timmins Mine Property: | | 2,606 | | 440,188 | | 157,650 | | | |
Total Info to Cutoff Date: | | 2,501 | | 428,585 | | 150,660 | | | |
Total New Info to Cutoff Date: | | 1,020 | | 132,369 | | 83,538 | | | |
Total New Holes in Model: | | 953 | | 123,112 | | 80,649 | | | |
Total New Holes Having Sol_Int: | | 691 | | 88,901 | | 63,668 | | | |
| | | | | | | | | |
Thunder Creek Property | | | | | | | | | |
Previous Operators (1942 - 1996) | | 32 | | 6,271 | | 981 | | Not considered in the resource estimate | |
| | | | | | | | | |
LSG (2003 to 28 October 2011) | | | | | | | | | |
Previous Drilling Old Info: | | 520 | | 149,543 | | 74,657 | | To last effective date. | |
Previous Drilling New Info: | | 42 | | 15,124 | | 8,540 | | Backlog information after last effective date | |
| | | | | | | | | |
LSG (29 October 2011 - 8 January 2014) | | | | | | | | | |
New Drilling Info: | | 694 | | 109,928 | | 69,387 | | 14 holes logging in progress; 1265 assays pending | |
| | | | | | | | | |
LSG (9 January 2014 - 21 February 2014) | | | | | | | | | |
New Drilling Since Cutoff Date: | | 18 | | 1,953 | | 1,794 | | Hole completed and/or in progress since cutoff date | |
| | | | | | | | | |
Total Holes on Thunder Creek Property: | | 1,306 | | 282,819 | | 155,359 | | | |
Total Info to Cutoff Date: | | 1,288 | | 280,866 | | 153,565 | | | |
Total New Info to Cutoff Date: | | 736 | | 125,052 | | 77,927 | | | |
Total New Holes in Model: | | 572 | | 94,585 | | 71,781 | | | |
Total New Holes Having Sol_Int: | | 400 | | 51,539 | | 49,417 | | | |
| | | | | | | | | |
Timmins West Mine | | | | | | | | | |
Total Holes TM-TC Combined: | | 3,912 | | 723,007 | | 313,009 | | | |
Total Info to Cutoff Date TM-TC Combined: | | 3,789 | | 709,451 | | 304,225 | | | |
Total New Info TM-TC Combined: | | 1,756 | | 257,421 | | 161,465 | | | |
Total New Holes in Models TM-TC Combined: | | 1,525 | | 217,697 | | 152,430 | | | |
Total New Holes Having Sol_Int TM-TC Combined: | | 1,091 | | 140,440 | | 113,085 | | | |
Note: Number of holes reported to current effective dates are actually completed
73
11.0 SAMPLING PREPARATION, ANALYSIS AND SECURITY
The sampling preparation, analysis, and security for the period of 1998 to 2009 are described in the NI 43-101 Technical Report on the Timmins West Mine Property by Darling et al (2009); by Powers (2009) in the Amended Technical Review and Report of the “Thunder Creek Property” Bristol and Carscallen Townships; and by Crick et al (2011) in the Technical Report on the Initial Mineral Resource Estimate for the Thunder Creek Property, Bristol Township. A Preliminary Economic Assessment Report and Updated Mineral Resource Estimate for the Timmins West Mine was released in March 2009 and provided updated protocols up to October 28, 2011 for Thunder Creek, and up to January 31, 2012 for the Timmins Mine property (Crick et al., 2012a). All of these reports are referenced in Item 27 and are filed on SEDAR.
11.1 SURFACE DIAMOND DRILL PROGRAMS
11.1.1 General Statement
Described herein are the protocols used for the surface exploration programs during the period from the last technical report to the current effective date.
11.1.2 Core Handling and Logging Protocols
For the surface drill programs, the diamond drill company employees secure the drill core boxes at the drill site and deliver them to the core logging facilities located at Lake Shore Gold’s exploration office at 1515 Government Road South, or at a second facility at 216 Jaguar Drive, Timmins Ontario. Under the direct supervision of Qualified Persons, Lake Shore personnel open the boxes, check the metre markers for accuracy, and label the boxes with metals tags noting hole number, box number, and footage. A geologist prepares a summary log or “quick log”, and the core is racked until it can be processed further. The core is then logged by a geologist, by entering data directly into custom Drill Logger software developed by GEMCOM GEMS. The logs are detailed, and describe geology, structure, alteration, and mineralization. Intervals to be sampled are indicated by the geologist, sample tags are inserted, rock quality designation measurements (RQD) and photographs are taken, and the log is printed, reviewed, and edited if required. The core is then given to a trained and supervised technician for sampling. Once the sampling is completed, all drill core is stored in racks or square piled in a secure compound at the core logging facilities or at the Timmins Mine compound.
11.1.3 Property Grids, Hole Collar and Downhole Attitude Surveys
All drill holes are planned in reference to a local field grid. On the Timmins Mine property, the grid lines are at 100 metre intervals and are oriented due north, with pickets at every 25 metre spacing. The origin of the Timmins Mine grid is the number one claim post of a surveyed claim (Claim P4040) which was assigned an arbitrary coordinate of 5000 east and 8000 north with an elevation of 1,000 metres. This point is actually 300.25 metres above Mean Sea Level and has been reassigned an elevation of 10,000 metres to ensure that underground elevations are not reported as negative numbers. By contrast, the Thunder Creek field grid is rotated by 40° with respect to the Timmins Mine field grid. It also consists of cut lines at 50 to 100 metre spacing with labeled pickets every 25 metres. The “false origin” of the grid is coincident with the number three post of patented claim P4040 (458,854.168 m east, 5,358,786.3 m north, NAD 83, Zone 17). The surveyed post is the departure point for the baseline coordinate 65+00E / 100+25N and corresponds to Timmins Mine co-ordinate 4645.777 east by 7508.233 north. The azimuth of the base line is 40° from true north. Grid line designation decreases southward.
74
An in-house grid transformation equation allows for the easy conversion between Timmins Mine, Thunder Creek, and UTM coordinates.
For surface drill programs, all drill hole locations are pegged on the ground in reference to the existing cut field grid or using a handheld GPS. The drill rig alignment is determined by placing front and back sights using a regular compass, or by using a differential GPS aligning device referred to as an APS (Reflex North Finder Azimuth Pointing System). As the holes are being drilled, changes in azimuth and inclination are monitored at 30 to 50 metre intervals using an EZ-Shot Reflex instrument. Upon completion of a relatively deep hole (500+ metres), it is common practice to have the holes resurveyed using a north-seeking gyro by Halliburton/Sperry Drilling Services of North Bay, Ontario. All collars are also surveyed by L. Labelle Surveys of Timmins for a final collar location.
11.1.4 Security
The secure chain of custody for diamond drill core and samples starts at the drill and is completed with the safe return of sample pulps in a locked storage facility on site. Unscheduled visits to the diamond drill sites are made to ensure safety, good working practices, and drill core security.
The core from surface drill programs is transported from the field to the core logging facility by the drill foreman. Core reception, logging, and sample preparation procedures are followed as previously described in Item 11.1.2. The samples are enclosed within sealed shipping bags, are transferred into larger shipping bins, and are directly delivered at the selected analytical labs by LSG employees. The lab employee that receives the sample shipment signs a chain of custody document that is returned to Lake Shore’s office for reference and filing. The return assay results are currently processed by database manager Morgan Verge, GIT, and are reviewed by Jacques Samson, P. Geo., and Kara Byrnes, P. Geo. Data is made available for viewing by selected members of the Lake Shore geological and management staff on a need to know basis.
11.1.5 Drill Core Sampling Method and Approach, Sample Preparation, Analysis and Analytical Procedures
Holmer 1996 to 2002:
All core was delivered by the contractor to a secured location at the Holmer core shack. The core was logged and samples marked on the basis of geological divisions. All core to be sampled, except for the quartz-tourmaline veins of the Main Zone and Hangingwall Zone mineralization, in which visible gold was observed was split mechanically. The suspected higher grade intercepts with visible gold were sent for assay as whole core.
During the period 1998 to 2002 sample length averaged 1.2 metres but was shorter in the well-mineralized sections. Prior to 1998, sample lengths ranged from 0.14 to 4 metres. The entire drill core was split, and half the core was submitted to the laboratory for holes 96-01 to 96-10 and 97-01 to 97-06. Sample intervals for holes 97-07 to 97-57 ranged between 0.14 and 1.75 metres in length. The samples remained at the secure site until delivery to the shipping company. The samples were then transported to Accurassay Laboratories (Div. of Assay Laboratory Services Inc.) (Accurassay) in Thunder Bay by BPX.
75
In 2002, analysis and analytical procedures are documented in a Summary of Work Report by Dave Beilhartz (2002), as follows:
For samples analysed by Regular Fire Assay:
· Jaw crush/cone crush samples to -10 mesh.
· -10 mesh material split.
· Rejects stored.
· Pulverize 200-300 gram sample to -150 mesh.
· Mix samples to produce a homogenous sample.
· Take ½ assay ton (15 grams) of pulverized material put in a crucible for fire assay.
For samples analysed by Pulp Metallics Method:
Owing to the coarse nature of gold in the main mineralized and Hangingwall Zones it was decided to carry out pulp metallics assay for those samples. The procedure followed is listed below:
· The sample is jaw crush/cone crush samples to -10 mesh, then a 750 gram to 1.0 kilogram sub-sample is riffled off. After weighing, sample is “stage” pulverized through a 150 mesh screen until about 20 to 40 grams of +150 mesh material is left on the screen.
· All of this +150 mesh material left on the screen is fire assayed to determine the weight of gold in that fraction.
· Two, 20 or 30 gram samples of the -150 mesh material are then assayed using standard fire assay procedure.
· The gold content of the total sample is then mathematically calculated.
Lake Shore Gold Corp. 2003 to 2012:
Intervals to be sampled are determined by the geologist, and are based upon lithology, alteration, percent sulphides, the presence of visible gold, and geological contacts. Sample lengths within the well-mineralized sections of core were 0.5 metres with minor variations determined on the basis of lithologies and vein contacts. Sample lengths were increased to as much as 1.5 metres where sparse mineralization was encountered. The sample intervals are marked on the core, and recorded in the drill log. The core is split by trained LSG technicians using a diamond saw. One half of the core is placed in a plastic sample bag, and the remaining half is returned to the core box. LSG uses sequentially numbered triplicate sample tags. One portion of the tag goes in the sample bag along with the split half of the sample, one portion of the tag is stapled into the core box at the end of the sample interval, and the third stays in the sample book for archiving. Once the sampling is completed, the core boxes are either placed in racks or cross-piled for future reference, within the gated area of the core shack. Over the years, most of the core was dumped except for selective exploration holes drilled outside of the resource area.
Prior to early 2007, the samples were transferred in security-sealed bags and transported by Manitoulin Transport to the ALS Chemex Prep Lab in Mississauga (2003 to 2005), and then to Sudbury (2006 to 2007) (Darling et al., 2009).
Since 2007, all samples from surface exploration programs have been delivered by LSG personnel directly to the ALS Chemex Prep Lab in Timmins. The pulps were created in Timmins and then shipped to the ALS Chemex Assay Laboratory in Vancouver, B.C., or Rouyn-Noranda, PQ.
76
Analytical procedures for surface diamond drill hole samples have remained fairly consistent since Lake Shore first started drilling on the Timmins Mine and Thunder Creek properties in 2003. These procedures have been described thoroughly in previous reports (Darling et al., 2009; Powers 2009; Crick et al, 2011). The following description outlines the method of treatment and procedures utilized by ALS Canada Ltd., to process and analyze those samples:
Lake Shore Gold Corp. employees are not involved in the sample preparation or analysis of samples once they have been delivered to the assay preparation laboratory in Timmins. Samples submitted to ALS Canada Ltd. (ALS) are assigned a separate client project number, corresponding to Timmins Mine or Thunder Creek properties. The laboratory is instructed to maintain the sample stream, the processing, and analysis by keeping the samples in sequential order as they are shipped to the lab. Samples are entirely crushed to 70% passing 2 millimetres mesh. The crushed samples are split and 250 gram sub-samples are pulverized to 85% passing less than 75 microns using a ring and puck pulverize (PREP-31). During the period of 2004 to 2007, a 50 gram aliquot was taken from the pulp and analyzed by fire assay and atomic absorption methods (Au-AA24). For samples that returned an assay value greater than 3.0 g/t Au, another pulp sample was taken and analyzed using a gravimetric finish (Au-GRAV22). In October 2007, the fusion weights for samples from Thunder Creek were reduced from 50 grams to 30 grams (Au-AA23 and Au-GRAV21), in order to avoid delays with occasional “incomplete fusions” reported by the lab. If visible gold is noted in the core sample, the samples may be analyzed by the Pulp Metallics Method (Au-SCR21). For the Timmins Mine property, all zones of significant mineralization intersected by surface holes were generally analysed by the Pulp Metallics Method. For this process, the entire samples are crushed to 70% passing 6 millimetres mesh, and the entire sample is then pulverized to 85% passing 75 microns (PREP-32). The pulp is passed through a 100 microns stainless steel screen and the entire (+) fraction is analyzed by fire assay and gravimetric finish. The (-) fraction is homogenized and two 30 gram aliquots are analyzed by fire assay and atomic absorption finish (Au-AA25 and Au-AA25D). The total gold content is then calculated by combining the weighted averages of the two fine fractions with the grade of the coarse fraction.
For surface drill core from the Timmins Mine property, most samples were analysed for arsenic (As) by Aqua Regia digestion and atomic absorption scanning (AA-45). This had been implemented since the sediment-hosted zones of mineralization (Hangingwall Veins, Main Zone, and the Deep Zone) often displayed a spatial association with arsenopyrite. For Thunder Creek, drill core from the first 50 holes (10,713 samples) were also analyzed for arsenic (As). Significant levels were not detected and the practice was abandoned in late 2007.
As part of ALS Canada Limited’s internal QA/QC program, a duplicate reject sample was prepared every 50 samples. The number of internal blanks, standards and duplicate control samples inserted into the sample stream depends upon rack size. For regular AAS, ICP-AES, and ICP MS methods the rack holds 40 positions, of which, there are two laboratory standards; one laboratory duplicate, and one laboratory blank. For regular fire assay methods the rack contains 84 positions, for which there are two laboratory standards, three laboratory duplicates, and one blank sample.
Lake Shore Gold Corp. blank samples are prepared from a 0.5 metre, known gold barren diamond drill core samples of diabase. These blank samples are blindly packaged as regular core samples with sequential to the sample stream assay tags and inserted into the sample stream at a random frequency of one every 1 to 20 samples. Blank samples, are used to check for possible contamination in the crushing circuit and are not placed after a standard sample.
77
Certified gold standards individually wrapped in 60 gram sealed envelopes were prepared by Ore Research and Exploration Pty. Ltd. of 6-8 Gatwick Road, Bayswater North, Victoria, Australia (OREA) and provided by Analytical Solutions Ltd. Several standards are used in order to vary the expected value and depending on availability of the standard. These Certified Standards are purchased from Ms. Lynda Bloom, Analytical Solutions Ltd., at 1214-3266 Yonge Street, Toronto, Ontario. Standard samples are inserted into the sample stream at a frequency of one per 20 samples and are used to check the precision of the analytical process. Table 11.1 lists the standards utilized by Lake Shore for both surface and underground drill programs.
Prior to May, 2010, ALS had been instructed to take one reject duplicate Lake Shore Gold sample for every 25 samples processed. This procedure was revised to take the duplicate sample immediately preceding the 25th sample and crush it to -6 mesh, run it through a riffle splitter to create two samples of approximately equal proportions. One of the halves was then assigned the sample number and the other duplicate sample was placed in a separate plastic bag and labeled with the same sample number and the suffix “dup”. The two samples were then treated as two entirely separate samples through the rest of the sample preparation and assaying process. The method of selecting reject duplicates was further modified starting May 2010 in order to make a “blind duplicate sample”; one reject duplicate was selected every 20 samples by the geologist logging the drill core. The geologist then gave the duplicate sample a numbered sample tag and placed it sequentially in an empty bag behind the sample from which it will be cut. When received by the lab, the preceding sample to the duplicate were crushed to -6 mesh, then run through a riffle splitter to create two samples of approximately equal proportions. One half was returned back into the original sample bag and the other half was placed into the empty bag, now as a separate sample with its own sample number. From this point on, the sample was “blind” to the analytical process. The insertion of a duplicate sample is to monitor the integrity of the assay results.
A list of the standards used by LSG is provided in Table 11.1.
Lake Shore Gold Corp. 2013 to Present:
There has been no diamond drilling carried out from surface at the Timmins West Mine since 2013.
11.2 UNDERGROUND DIAMOND DRILL PROGRAM
11.2.1 General Statement
Described herein are the protocols used for the underground during the period from the last technical report to the current effective date.
11.2.2 Core Handling and Logging Protocols
Up until spring 2013, all core from the underground drill programs was being delivered to the minesite core shack. Under the direct supervision of Qualified Persons, underground drill core was being processed by geologist and geological technicians in a similar fashion as described above (Item 11.1) for the surface drill programs. Samples from underground exploration holes were sawn, and all core boxes were cross piled on site for future reference. For stope definition drilling, the logs were generally less detailed but remained of good quality. In this case, the zones of mineralization were systematically whole-core sampled, and the rest of the hole was discarded.
Since May 2013, due to lack of space at the mine site and in an effort to provide closer supervision and further standardize all aspects of the logging and sampling process, all drill core is being transported by
78
LSG personnel and delivered at the Government Road central core logging facility. Supervision is currently provided by Kara Byrnes, P. Geo., and Jacques Samson, P. Geo.
11.2.3 Property Grids, Hole Collar and Downhole Attitude Surveys
All underground holes, including on Thunder Creek property, are planned in the Timmins Mine local coordinate system, discussed in Item 11.1.
For underground programs prior to 2013, most drill hole collar locations and starting azimuths were established by Lake Shore mine geologists by measuring from survey control stations. The first downhole azimuth and dip readings in each hole were initially recorded at 9 to 15 metre depth using “Reflex” or “EZ-Shot” instruments. If the reading was more than 3° from the desired azimuth, it was common practice for the drill to re-align and re-collar. Tests beyond the 15 metre mark were generally taken at 50 metre intervals. The magnetic susceptibility was assessed using the “total mag field” for each directional reading to determine if the apparent azimuth had not been made inaccurate by highly magnetic materials in proximity to the data point. Some holes were re-surveyed using a downhole north-seeking gyro or using a Maxibor instrument from Reflex Instruments in Timmins. After completion, drill holes were generally marked by inserting a wood peg in the collar, accompanied by an aluminum tag indicating the hole number. The collar locations were occasionally re-surveyed by the mine geologists or by the surveyors depending on availability.
In the spring of 2013, drilling protocols were re-evaluated, and some issues were identified. In particular, it was determined that the rock formations being drilled were a lot more magnetic than previously recognized, due to the presence of finely disseminated magnetite in the pyroxenite, and pyrrhotite in the volcanics. More stringent protocols were therefore implemented to ensure greater accuracy and better quality of the directional data. Drill hole collar locations are now predominantly established by trained surveyors. A line with a unique ID is painted on the walls, and spads are inserted in the walls when requested for further points of reference and in order to assist the drillers in lining up more accurately. In addition, in September 2013, a north-seeking gyroscope newly developed by Downhole Surveys (DHS) is being used by the drillers to line up on most of the holes. This instrument is easy to use, is not affected by magnetic interference, and provides continual output of both azimuth and dip, allowing the drillers to precisely manoeuver the drill rig to the correct planned azimuth and dip. Downhole EZ-Shot tests are still taken at 9 to 15 metres from the collar, but drillers are instructed to not re-collar, but to carry on taking tests on 50 metre intervals. Since June 2013, upon completion of a hole, a non-magnetic survey instrument (DeviFlex) is also used to track the curvature of the hole. Downhole north-seeking gyro surveys are occasionally done on selected holes, as an additional verification and for comparison. For Thunder Creek, drill holes are generally shorter and Reflex tests taken within the porphyry are believed to be sufficiently reliable as this rock formation is non-magnetic. Deviflex surveys are therefore not done regularly when drilling that deposit. For future reference, the hole identification number is stamped on an aluminum tag and is attached to an orange plastic cone which is then inserted in the collar. Except for Bazooka holes (i.e. short holes drilled by a small air-powered diamond drill), the final collar locations, starting azimuth and dip are then picked-up by the surveyors, using a custom-made aluminum rod which fits precisely in the collar. A geologist then reviews all collar surveys and all downhole directional data. The electronic memory of the Reflex tool is regularly downloaded, and the magnetic susceptibility readings are scrutinized “total mag field” in conjunction with the “magnetic dip” in order to assess the reliability of the data. The quality of the Deviflex data file is also reviewed for potential reading or technical errors using various parameters as recommended by the manufacturer. Finally, a directional data file containing a combination of the best collar and downhole Reflex and
79
Deviflex surveys is generated and forwarded to the Database Manager for importation. If downhole gyro data is available, it is normally considered as being the most accurate.
11.2.4 Security
The TWM secure chain of custody for diamond drill core and samples starts at the drill and is completed with the safe return of sample pulps in a locked storage facility on site. All underground core is transported from the mine site by LSG personnel. Core reception, logging, and sample preparation procedures are followed as previously described above. The samples are enclosed within sealed shipping bags, are transferred into larger shipping bins, and are directly delivered at the selected analytical labs by LSG employees. The lab employee that receives the sample shipment signs a chain of custody document that is returned to LSG’s office for reference and filing. The return assay results are currently processed by database manager Morgan Verge, GIT, and are reviewed by Jacques Samson, P. Geo., and Kara Byrnes, P. Geo. Data is made available for viewing by selected members of the LSG geological and management staff on a need to know basis.
11.2.5 Underground Diamond Drill Core Sampling Protocols
LSG 2008 to Spring 2013:
Since underground drilling at the TWM first started in 2008, drill core was delivered directly to the core logging facility located on site, and was processed for logging as discussed in Item 11.2.
Sample location and widths were based upon the distribution of sulphides, visible gold, lithology and alteration. Sample lengths vary from 0.3 to 1.5 metres, and generally do not cross lithological and alteration or mineralization boundaries. Samples were marked by the geologist using a marker. Three-part sample tags labelled with a unique ID number were used. One part of the tag stayed in the sample book and documents the hole number and interval being sampled. The second portion of the tag was stapled in the core box at the end of the sample, and the third portion was placed in the sample bag during sampling. Core sampling was performed by trained and supervised technicians. Core considered to be from production definition drilling was “whole-cored”, meaning the entire core from each specific sample interval was collected and sent to the lab and no representative equivalents were kept. The remaining non-sampled core was discarded. Core from underground exploration holes or from holes of particular interest were either split using a hydraulic splitter, or cut using a diamond core saw, and one half of each individual sample was sent to the lab. In this case, the remaining core was stored in core racks or was cross-piled on site, for future reference.
Sample bags were stapled shut, then placed in “rice” bags and sealed using a security tag. Attached to one of the bags was one copy of the “chain of custody” document on which the security tag and sample numbers included in the order have been entered.
At the time, samples were being transported from the mine site and delivered to various local labs, via “The Messenger Service” located at 108 Polaris Road, Timmins. This included delivery at ALS Canada Ltd Prep Lab (2090 Riverside Drive, Timmins), Cattarello Assayers Inc. (475 Railway Street, Timmins), and LSG’s own analytical lab located at the Bell Creek Complex, in South Porcupine. Samples were also regularly sent to Accurassay Laboratories prep lab in Timmins (150A Jaguar Drive) or to Accurassay Laboratories in Thunder Bay (1046 Gorham Street,) via Barry’s Freight Services.
80
LSG 2013 to Present:
In the spring of 2013, LSG started to progressively process all core from the Timmins West Mine at its central office and core logging facility located at 1515 Government Road South, Timmins. This was done due to a lack of space at the mine site, and in an effort to ensure standard core logging and sampling protocols, and to provide closer supervision by Kara Byrnes, P. Geo., and Jacques Samson, P. Geo. All drill core is transported from the mine site by LSG employees. Core handling, logging and sampling protocols are similar to those described above and in Item 11.1.2.
Since May 09, 2013, if a considerable splash or numerous pinheads of visible gold are noted within a sample it must be noted in the log using the “VG” check box, the sample must be flagged using orange tape, the letters “VG” must be clearly written using a red marker on the sample tag which will accompany the sample to the lab, and the sampler will note the sample number on a “VG Sample Tracker” sheet, which will then be reported on the corresponding Sample Submittal Form as a “Special Instruction” requesting a silica wash (WSH-22). The WSH-22 code for samples processed at ALS implies special instructions running silica sand ONCE in the crusher and TWICE in the pulverizer after the sample was processed, in order to avoid and/or minimize carry over contamination.
The samples are placed in plastic bins, and are directly delivered to various locals labs by LSG employees. This includes delivery at ALS Canada Ltd (2090 Riverside Drive, Timmins), Actlabs Timmins (1752 Riverside Drive), and LSG’s own analytical lab located at the Bell Creek Complex, in South Porcupine.
For the period from 2008 to March 18, 2013, the introduction of blank samples, certified gold standards, and blind coarse duplicates in the sample stream were generally done at a random frequency of one per every group of 20 samples, as previously described in Item 11.1.5, for surface samples collected by LSG. As of March 18, 2013, this protocol was changed to “one blank, one coarse duplicate, and one gold standard for every group of 40 samples”.
A list of the standards used by LSG is provided in Table 11.1.
TABLE 11.1: OREAS STANDARDS USED BY LAKE SHORE GOLD CORP.
| | Mean Au | | | | 1 Std. Dev. | | 2 Std. Dev. | | 3 Std. Dev. | |
Standard | | (g/t) | | Std. Dev | | Min | | Max | | Min | | Max | | Min | | Max | |
O-10c | | 6.600 | | 0.160 | | | | | | 6.270 | | 6.920 | | 6.110 | | 7.080 | |
O-15d | | 1.559 | | 0.042 | | | | | | 1.475 | | 1.643 | | 1.433 | | 1.685 | |
O-15h | | 1.019 | | 0.025 | | | | | | 0.970 | | 1.068 | | 0.945 | | 1.093 | |
O-15Pb | | 1.060 | | 0.030 | | 1.030 | | 1.090 | | 1.000 | | 1.120 | | 0.970 | | 1.140 | |
O-16a | | 1.810 | | 0.060 | | | | | | 1.680 | | 1.930 | | 1.620 | | 1.990 | |
O-16b | | 2.210 | | 0.070 | | | | | | 2.060 | | 2.360 | | 1.990 | | 2.430 | |
O-17c | | 3.040 | | 0.080 | | | | | | 2.870 | | 3.210 | | 2.790 | | 3.290 | |
O-18c | | 3.52 | | 0.11 | | | | | | 3.310 | | 3.730 | | 3.200 | | 3.840 | |
O-19a | | 5.490 | | 0.100 | | | | | | | | | | 5.190 | | 5.790 | |
O-202 | | 0.752 | | 0.026 | | | | | | 0.701 | | 0.804 | | 0.675 | | 0.830 | |
O-204 | | 1.043 | | 0.039 | | | | | | 0.966 | | 1.120 | | 0.927 | | 1.158 | |
O-205 | | 1.244 | | 0.053 | | | | | | 1.138 | | 1.350 | | 1.085 | | 1.402 | |
O-207 | | 3.472 | | 0.130 | | | | | | | | | | 3.082 | | 3.862 | |
81
| | Mean Au | | | | 1 Std. Dev. | | 2 Std. Dev. | | 3 Std. Dev. | |
Standard | | (g/t) | | Std. Dev | | Min | | Max | | Min | | Max | | Min | | Max | |
O-2Pd | | 0.885 | | 0.029 | | 0.855 | | 0.914 | | 0.826 | | 0.943 | | 0.797 | | 0.973 | |
O-502 | | 0.491 | | 0.020 | | | | | | | | | | 0.431 | | 0.551 | |
O-503 | | 0.687 | | 0.024 | | | | | | | | | | 0.615 | | 0.759 | |
O-61d | | 4.760 | | 0.140 | | | | | | 4.470 | | 5.040 | | 4.330 | | 5.190 | |
O-62c | | 8.790 | | 0.210 | | | | | | | | | | 8.160 | | 9.420 | |
O-65a | | 0.520 | | 0.017 | | | | | | 0.486 | | 0.554 | | 0.469 | | 0.571 | |
O-67a | | 2.238 | | 0.096 | | | | | | 2.046 | | 2.430 | | 1.950 | | 2.526 | |
O-6Pc | | 1.520 | | 0.065 | | 1.460 | | 1.590 | | 1.390 | | 1.660 | | 1.320 | | 1.720 | |
11.2.6 Underground Diamond Drill Core Sample Preparations and Analytical Procedures
Since the last technical report to the current effective date, a total of 145,959 drill core samples were taken and sent for gold analysis. The laboratory distribution of the samples was 36% to ALS Canada Ltd, 23.7% to Accurassay Laboratories Limited, 20.7% to LSG Bell Creek Lab., 12.8% to Cattarello Assayers Inc., and 6.8% to Actlabs. Assay results for 3,558 samples remained outstanding on the effective date of this report. Table 11.2 summarizes the sample distributions by labs. Detailed statistics are provided in Appendix 1.
TABLE 11.2: SUMMARY OF SAMPLE DISTRIBUTION BY ANALYTICAL LABORATORIES
Thunder Creek: 28 Oct 2011 - 08 Jan 2014 |
| | | | | | | | | | | |
Laboratory | | Drill Core Samples | | Standards | | Blanks | | Coarse Duplicates | | Total QA/QC Samples | |
Accurassay Laboratories | | 22,673 | | 1,214 | | 1,305 | | 1,181 | | 3,700 | |
Activation Laboratories | | 2,202 | | 50 | | 55 | | 49 | | 154 | |
ALS Canada Ltd. | | 28,367 | | 1,273 | | 1,302 | | 1,192 | | 3,767 | |
Bell Creek Laboratory | | 11,845 | | 442 | | 529 | | 437 | | 1,408 | |
Cattarello | | 6,871 | | 319 | | 353 | | 311 | | 983 | |
Sub-Total | | 71,958 | | 3298 | | 3,544 | | 3,170 | | 10,012 | |
| | | |
Timmins Mine: 31 Jan 2012 - 26 Nov 2013 |
|
Laboratory | | Drill Core Samples | | Standards | | Blanks | | Coarse Duplicates | | Total QA/QC Samples | |
Accurassay Laboratories | | 11,938 | | 600 | | 690 | | 559 | | 1,849 | |
Activation Laboratories | | 7,666 | | 143 | | 170 | | 158 | | 471 | |
ALS Canada Ltd. | | 24,199 | | 745 | | 830 | | 766 | | 2,341 | |
Bell Creek Laboratory | | 18,424 | | 679 | | 774 | | 693 | | 2,146 | |
Cattarello | | 11,774 | | 579 | | 645 | | 546 | | 1,770 | |
Sub-Total | | 74,001 | | 2,746 | | 3,109 | | 2,722 | | 8,577 | |
TOTAL | | 145,959 | | 6,044 | | 6,653 | | 5,892 | | 18,589 | |
ALS Canada Ltd.
The protocols and procedures for the preparation and analysis for diamond drill core samples sent to ALS Canada Ltd. are the same procedures as for surface diamond drill core samples (Item 11.1), with the
82
exception that the aliquot sample size was 50 grams rather than 30 grams. Since August 2011, the aliquot size was changed to 30 grams.
Accurassay Laboratories Limited
Accurassay Laboratories Limited, operate a preparation laboratory at 150A Jaguar Drive Timmins, Ontario. LSG’s samples were crushed to greater than 70% passing through -8 mesh (2 mm). A 500 gram split was taken and pulverized to 90% passing through -150 mesh (106 µm). Silica abrasive cleaning was routinely completed between each sample preparation. The samples were analyzed by fire assay for gold from a 30 gram aliquot using an atomic absorption finish (Code ALFA1). The detection limit was between 0.005 grams and 30 grams. Sample assay results greater than 10 grams per tonne gold were fire assayed again using a 30 gram aliquot from the original pulp portion of the sample and a gravimetric finish. The internal laboratory QA/QC program placed a duplicate sample every ten samples of an assay batch. The assay trays consist of 25 to 27 positions for samples. Standard and blank control samples were positioned at random by computer, for a position within the 25 — 27 sequence. As of May 10, 2013, LSG no longer sends samples to this lab.
Bell Creek Complex Mill Laboratory
The diamond drill core samples sent to the Bell Creek Mill laboratory are sorted, dried, and then individually crushed to greater than 85% passing 10 mesh [(Tyler) 1.68 mm]. A 150 gram to 200 gram sample split is pulverized to greater than 95% passing 200 mesh [(Tyler) 0.075mm]. All equipment is cleaned between samples using compressed air. A 30 gram aliquot is prepared and fire assayed with an AA finish. Assay results that exceed 10 grams per tonne are automatically re-run using a sample from the pulverized portion of the sample and a gravimetric finish.
Cattarello Assayers Inc.
Diamond drill core samples are sorted into numerical order and dried. Samples are then crushed using two terminator jaw crushers. A 200 gram sample is split out of the crushed fraction and pulverized using two vibrator ring pulverizers. A 30 gram aliquot is weighed out for Fire Assay with an AA finish. Sample results greater than 10 grams per tonne are re-fire assayed using a gravimetric finish from a sample of the pulverized sample portion. The sample rack holds 24 positions of which a laboratory standard is inserted on every 24 samples and one duplicate sample every 24 samples. Laboratory blank samples are inserted less frequently. LSG discontinued the use of this lab in October 2012.
Activation Laboratories Timmins
Activation Laboratories operates a full preparation and fire assay, atomic absorption, gravimetry, and ICP-OES analysis laboratory at 1752 Riverside Side, in Timmins, Ontario. LSG diamond drill core samples are scanned and sorted into numerical order and dried. A sample size of 10 to 50 grams can be used, but the routine 30 gram size is applied for rock pulps. The sample is then mixed with fire assay fluxes (borax, soda ash, silica, litharge) and Ag (as a collector), and the mixture is placed in a fire clay crucible. The mixture is preheated at 850°C, intermediate at 950°C, and finishes at 1,060°C. The entire fusion process lasts approximately 60 minutes. The crucibles are then removed from the assay furnace and the molten slag (the lighter material) is carefully poured from the crucible into a mold, leaving a lead button at the base of the mold. The lead button is then placed in a preheated cupel which absorbs the lead when cupelled at 950°C to recover the Ag (doré bead) +Au. The entire Ag doré bead is dissolved in aqua regia and the gold content is determined by AA finish. For gravimetric analysis, the Au is separated from the Ag doré bead using nitric acid. The resulting gold flake is annealed using a torch. The gold flake is then weighed gravimetrically on a microbalance.
83
11.3 UNDERGROUND FACE CHIP CHANNEL AND MUCK SAMPLES
11.3.1 Procedure for Taking Face Chip Channel Samples
Channel samples are taken across the development heading “face” honoring changes in rock type, alteration, vein style, vein intensity, and amounts and types of sulphides. The chip sample is designed to cross-cut a sub-vertical vein, sulphide mineralized envelope, or mineralized structures situated in the central portion of the 5 metre by 5 metre development heading at approximately 1.3 to 1.5 metres above the floor. Samples are taken from left to right of the left wall-face bracket, across the face, and ending with the right face-wall bracket. The maximum length of the wall rock (waste bracket) is 0.5 metres; another waste sample taken after the initial waste sample may have a length of up to 1 metre. Samples of mineralization have a maximum length of 0.5 metres. Each channel sample extends 0.5 metres above and 0.5 metres below the designated sample height resulting in a 1 metre wide panel. The resultant sample should weigh approximately 2 kilograms.
Descriptions of the samples are recorded and a photo is taken of the face illustrating the geology, mineralization, and sample panels.
Samples are submitted for assay as described in the diamond drill core protocols section of this report.
On the Timmins Deposit, channel samples are taken to aid in defining the footwall and or hangingwall contact of the mineralized zones. Both wall and face channel samples may be taken depending on the orientation and location of the zone with respect to the current face location in the ore zone. This helps in identifying any mineralized material which may need to be slashed (i.e. excavated) prior to establishing the final ore zone geometry. Channel sampling on the Timmins Deposit rarely represents the full mineralized zones as the zones are most often greater than the 5 metre development round width.
On the Thunder Creek Deposit, channel sampling is more representative of the mineralized ore zones. Wall channel sampling is done on both walls for each cross-cut that cuts through the Porphyry Zone. These samples are broken up to represent the individual rounds taken through the zone and ultimately represent a continuous line or string of sampling entering and exiting the Porphyry Zone on both walls in each of the cross-cuts. This protocol is copied on each of the levels driven through the mineralized Porphyry Zone. This is an excellent tool in identifying grade trends and locating the final ore contact through the zone on both overcut and undercut levels.
Sampling of the Rusk Shear Zone is done on almost every round of advance during development. Development is driven laterally on this zone offering the opportunity to sample every face. Previously, mining of the Rusk Zone which lies along the north hangingwall contact to the Porphyry Zone and striking NE-SW was integrated into the Porphyry Zone mining blocks. This did not allow for extensive sampling of this zone. The Rusk Shear Zone has a varying width of approximately 2.5 metres to 7.5 metres. Occasionally bazooka drilling may be required to test wider mineralized sections beyond 5 metres that have not been exposed through development.
11.3.2 Procedure for Taking Muck Samples
Underground development miners are required to take muck samples at the request of LSG’s geology department staff. Samples may be taken from either ore or waste headings. The mining department begins taking these samples once advance in the heading approaches the mineralized ore zones and the round has been given a number designation by the geology staff. Six muck samples representative of
84
one jumbo round taken “from the ground after dumping the bucket” at three time intervals are taken during the mucking cycle. Two samples are taken at the beginning of the cycle, two samples taken in the middle of the cycle, and two samples taken at the end of the mucking cycle. The muck samples taken during a shift along with the appropriately filled out sample description tags are brought up from underground and deposited in designated locations. The sample number, date, shift, workplace, employee, and comments are recorded and the information given to the geology department. This represents approximately one sample per 42 tonnes of mucked material in lateral development rounds.
When mining from longhole stopes, the LHD operator is instructed to take a sample every 33 tonnes of muck (i.e. each truckload, or 3rd or 4th bucket depending on equipment configuration).
Samples are submitted for assay as described in the diamond drill core protocols section of this report.
11.3.3 Security
All underground muck and chip samples are transported from the minesite in sealed shipping bags or larger shipping bins, and are directly delivered to LSG’s Bell Creek Analytical Lab. The samples are transported by LSG personnel and by courier. The lab employee that receives the sample shipment signs a chain of custody document that is returned to LSG’s office for reference and filing.
11.3.4 Data Management for Chips and Muck Samples
Chips, muck, and test holes are identified by sample tags. The sample tags are entered by a trained geological technician into a “Sample Number Tracker” Excel spreadsheet, and assays are imported in the Tracker as they are received from LSG’s Bell Creek Lab. The Tracker then sends out data queries which populate the face/wall or stope sheets with their corresponding assay results. The results are manually entered into a “Production Tracker”, which is used to generate various production and development grade reports.
11.4 DATA MANAGEMENT FOR SURFACE AND UNDERGROUND DIAMOND DRILL PROGRAMS
Copies of assay certificates are either downloaded from each lab’s external LIMS system and/or sent via mail and electronic mail to the LSG database manager, and to the project’s Qualified Person (QP). The digital assay data, in the form of “.csv” files are checked manually against the final paper assay certificates for clerical errors, and the results evaluated by a Lab Logger Version 2.0 program created by Gemcom for ALS Lab, and by an EXCEL query file for Accurassay, Actlabs, Bell Creek, and Cattarello Labs. The use of the software program ensures that the results from the QA/QC samples fall within the approved limits of the standard before this data is imported into the database.
The procedures for handling and managing the surface and underground assay data are discussed in detail below.
11.4.1 Accuracy Analysis - Standards and Blanks
Beginning in March 2009, sample results are entered into an Excel spreadsheet to determine if the assay value for the standards falls outside the control limits. If this occurs, the samples are highlighted for check analysis at Accurassay, Actlabs, ALS, Bell Creek, or Cattarello Labs. Since April 2010, this process has been handled using an ACCESS application developed by Gemcom Software International Inc. called Lab Logger (V.2.0) for ALS Lab. Sample assay results, internal QC information, certificate dates,
85
standards, and duplicate samples were each stored in separate QC database tables, and data can be merged into relevant plot files as needed.
The QC samples in each group are subjected to a specific pass or failure criteria, which determines whether a re-assay of the batch is required. A sample group failure is identified whenever the analytical result for any certified standard in the group of 20 is greater than three standard deviations (the control limit) from the certified mean value for the standard, or if an assay for any blank material is greater than 0.100 ppm. All failed groups of samples are investigated to attempt to determine the cause of the erroneous result (analytical or clerical). Potential clerical errors are sometimes reconciled by checking against original drill log records, sample books, or original laboratory data sheets. After the batch pass/failure criteria is applied, a geological override may be applied by the project QP on batches for which re-assay would be of no benefit (i.e. completely barren of gold assay values and mineralization indicators; see Table 11.2 footnote). Sample groups given a geological override are not re-assayed.
Sample groups in which the QC samples were outside the established control limits that did not receive a geological override are not imported into the database. Instead, these samples are requested to be re-run at the analytical lab.
In the case where a standard failed, a re-run on the pulp is requested back to either the last control sample that passed (blank or standard), or the first sample for the project in the sequence of samples being analyzed, or four samples above and below the failed standard, if the assay results for those samples were significant. In this case, a new standard is sent to the lab to be analyzed with the samples in question.
In the case of a blank failure, if the surrounding assay results are significant, all samples back to either the last blank or standard that passed, or the first sample for the project in the sequence of samples being analyzed, or four samples above and below the failed blank are re-analysed on the reject material, as this indicates contamination in the sample preparation stage.
11.4.2 Precision Analysis — Duplicates
Beginning in March 2009, internal laboratory pulp duplicate data and reject duplicate data were statistically followed and analyzed using Excel for Accurassay, ALS, Actlabs, Bell Creek, and Cattarello Labs. In April 2010, Lab Logger software was set up and used for comparative statistical analysis for ALS Lab. Comparison was made using descriptive statistics and scatter plots. These plots were used primarily to identify project specific problems in assay reproducibility (precision), and individual erratic results, indicating potential sampling problems or clerical errors in the sample order within the batch. When problems were identified in the data precision, the labs were notified and asked to investigate and report back their findings. Erratic sampling results are then noted in monthly reports so that the geologist would be aware of the uncertainty in the sample value and be able to check for potential clerical errors within the samples as per standard procedures.
11.4.3 Reporting and Plotting
Brief monthly reports are completed during the year to include the number of samples sent to each lab for each project, the number of QC samples that failed, together with the reason why. As well, on a monthly basis, graphs are generated of each individual blind standard and blank, as well as the non-blind reject pairs and pulp duplicate pairs to check for sample bias at the assay lab. All major projects are summarized individually, either at year end or at the end of the program, as soon as reasonably possible.
86
11.5 CHECK ASSAY PROGRAM
11.5.1 General Statement
For significant drilling periods, or for drill campaigns leading to resource or reserve calculations, a check assay program is implemented either during or following completion of drilling. Approximately 5% of the pulps from previously analyzed samples (excluding pulps from standards) were selected and sent for re-assay to various neutral labs. In order to make a selection, groups of samples that passed QC were picked randomly from various drill programs. The pulps were selected randomly by hole ensuring that a wide range of original assay values from trace to high grade were represented.
The samples selected for check analysis were sent to both ALS Canada and SGS Mineral Services. The pulps were initially analyzed using the fire assay with an AA finish method, and for results greater than 10 grams per tonne a re-assay was conducted by fire assay using a gravimetric finish.
11.5.2 Procedures
Pulps were selected by LSG project personnel and an electronic list of selected sample numbers was prepared for the samplers. The samples were submitted to the analytical facility in groups of 20, with the blind QC consisting of one standard and one previously analyzed blank pulp. For bazooka drill core, a new blank was inserted into the batches. The old and new sample numbers and the positions of the standard and blank pulps were recorded on the check assay Excel table as the samples were being packed for shipping to the labs. Once the analyses were completed, the assay lab provided results in the standard LSG assay file format, including all of their internal QC data as part of the electronic assay file. After all assays were received and were determined to have passed quality control checks, a comparative statistical analysis of the new data versus the original assays was undertaken by LSG, including an analysis on the performance of inserted QC samples, following a format previously used by external auditors.
A master report for each project was prepared, documenting the following statistics:
· Mean
· Maximum and minimum values
· Median
· Variance
· Standard deviation
· Coefficient of variation
· Correlation coefficient
· Percent difference between means
Three separate check assay programs were completed since the last 43-101 technical report, and all detailed results and statistics are provided in Appendix 1.
11.6 DISCUSSION
Table 11.3 summarizes the QA/QC statistics for the TWM, comprising surface and underground QA/QC programs for both the Timmins and Thunder Creek Deposits. Graphs of the QA/QC results for standards and blanks, and results for the check assay programs, including observations and recommendations are provided in Appendix 1.
87
TABLE 11.3: TIMMINS WEST MINE DIAMOND DRILL CORE QA/QC SAMPLE SUMMARY
| | THUNDER CREEK
28 Oct 2011 - 8 Jan 2014 | | TIMMINS MINE
31 Jan 2012 - 26 Nov 2013 | |
Sample Type | | Number | | Percent | | Number | | Percent | |
Total Blanks | | 3,544 | | 35.4 | % | 3,109 | | 36.2 | % |
Total Standards | | 3,298 | | 32.9 | % | 2,746 | | 32.0 | % |
Total Duplicates | | 3,170 | | 31.7 | % | 2,722 | | 31.7 | % |
Total QA/QC | | 10,012 | | | | 8,577 | | | |
Blank Overrides | | 30 | | 96.8 | % | 32 | | 97.0 | % |
Blanks Re-Assayed | | 1 | | 3.2 | % | 1 | | 3.0 | % |
Sub-Total Blank Failures | | 31 | | 0.9 | % | 33 | | 1.1 | % |
Standard Overrides | | 225 | | 76.3 | % | 164 | | 76.6 | % |
Standard Re-Assayed | | 70 | | 23.7 | % | 50 | | 23.4 | % |
Sub-Total Standard Failures | | 295 | | 8.9 | % | 214 | | 7.8 | % |
Total QA/QC Failures | | 326 | | 3.3 | % | 247 | | 2.9 | % |
Note*: Reasons for a geological override include:
1. If a standard or a blank fails by less than 0.05 grams per tonne as this is very close to the cut-off for a pass.
2. If a standard or a blank fails by more than 0.05 grams per tonne and there are no ore grade results, and no ore grade results were anticipated within the area of the QC failure, the failure is overridden as it is assumed that no significant assays results were affected.
3. Occasionally a failure relates to a data entry error (wrong standard being recorded as sent), or relates to two sequential samples being switched during sampling at the coreshack, or during sample preparation at the lab. If the error can be absolutely proven but corrections cannot be made, the failure is overridden.
4. In the situation of a standard or blank failing but the drill hole is in an area that is actively being mined or developed before a re-assay can be returned, the failure is overridden.
5. Occasionally, failure of a blank or a standard can be overridden if the Qualified Person believes the error is forgivable. In this case a comment stating the override is added to the database. An example of this is the QP noted that one standard was consistently failing by the same extent of an error. The error was overridden and the standard replaced in future sample shipments.
88
12.0 DATA VERIFICATION
12.1 DATABASE VALIDATION
Geological data is currently held in a Gemcom GEMS (Microsoft SQL) database which was compiled from data received from West Timmins Mining Inc., Holmer Gold Mines Ltd., and work completed by LSG since the acquisition of the properties. A review of all historical data available was completed to ensure all assay and survey (collar and downhole) information was properly imported and presented into the database. On a regular basis the following steps are taken to ensure the integrity of the database:
1. A monthly validation is run on the Gemcom drill hole data which searches for overlapping geological or assay intervals, incorrect drill hole lengths, missing geological intervals, etc. Any errors encountered are corrected when discovered.
2. Plotting of plans and sections to check for drill hole location, elevation, and downhole survey errors.
3. Due to the highly magnetic nature of the rocks, downhole survey data collected using a Reflex EZ-Shot instrument is checked by a geologist upon receipt and scrutinized for magnetic interference before being input into the database. A non-magnetic survey instrument, Deviflex, is also currently being used to assist in tracking the curvature of most holes being drilled at the Timmins Mine.
4. Selected historical drill holes are checked underground for collar labels, drill hole location, and collar azimuth and dip. Any discrepancies are examined and modified as required.
5. Downhole north-seeking gyro surveys are occasionally completed on select holes as additional verification and comparison.
For the purposes of this report, a random validation was completed on approximately 5% of the assay data in the drill logs, against the assay certificates.
Over the course of a three week period, a review of approximately 50% of the available drill logs from 2012 was completed on Timmins Mine and Thunder Creek drilling. Discrepancies were noted related to incorrect and missing entries for downhole surveys, drill dates, log dates, and townships. Where possible, these errors and omissions were corrected by the reviewer. A more stringent review of drill logs upon completion and logging geologist sign-off has minimized the presence of these types of errors in current drilling.
In spring 2013, some issues were identified regarding the accuracy of drill hole collar locations, and improper assessment of downhole surveys (see Item 11.2.3 for details). Previously, the collar locations were marked by a mine geologist, but the final locations were rarely re-surveyed. The collar location recorded in the database may not have always accounted for required “offsets” and other inaccuracies. Some rock formations are more magnetic than previously recognized due to the presence disseminated magnetite and pyrrhotite, which affected the reliability of the azimuth readings being taken with the EZ-Shot instrument. The intensity of magnetic interference (total mag field) recorded by the survey instrument was not systematically evaluated, and other parameters such as “magnetic dip” readings were not considered when assessing the validity of the azimuth readings. A review of the data for certain holes has led to a shift in the apparent trajectory of drill hole traces. In the past, drillers were asked to re-align and re-collar the drill hole if the first downhole tests were off by 3 degrees or more from the planned azimuth. This practice has been abandoned, and much more stringent protocols have been put in place. Most collars are now marked by trained surveyors, spads are commonly inserted in
89
the walls for better accuracy and as permanent points of reference, and all collars are eventually re-surveyed upon completion. In addition, in September 2013, a north-seeking gyroscope (Azimuth Aligner) is now being used by the drillers to line up on the holes. This instrument is not affected by magnetic interference, allowing the drillers to precisely manoeuver the drill rig to the correct planned azimuth and dip. Downhole EZ-Shot tests are still taken at 9 to 15 metres from the collar, but drillers are instructed NOT to re-collar and to keep taking tests at 50 metre intervals. Since June 2013, upon completion of a hole, a non-magnetic survey instrument (DeviFlex) is also used to track the curvature of the holes. Downhole north-seeking gyro surveys are occasionally done on selected holes, as an additional verification and for comparison. For Thunder Creek, drill holes are generally shorter and Reflex tests taken within the porphyry are believed to be sufficiently reliable as this rock formation is non-magnetic. A geologist then reviews all collar surveys and all downhole directional data. The magnetic susceptibility readings are scrutinized in conjunction with the “magnetic dip” in order to assess the reliability of the data. The quality of the Deviflex data file is also reviewed for potential reading or technical errors. Finally, a directional data file containing a combination of the best collar and downhole Reflex and Deviflex surveys is generated and forwarded to the Database Manager for importation. If downhole gyro data is available, it is normally considered as being the most accurate.
Whenever possible, the location and starting azimuths of old drill holes which appear problematic are re-surveyed by the company surveyors or using the Azimuth Aligner.
Two holes were excluded from the Thunder Creek resource estimate due to uncertainty of location and poor correlation with surrounding data. Remaining discrepancies in recent drilling are considered to be local in nature and are not likely to have a significant impact on the Global Mineral Resource estimate. It is suggested that close spaced drilling in conjunction with underground mapping should be used to help confirm hole locations for new mining blocks whenever possible. The database, in the writer’s opinion, is appropriate for reporting of the Timmins West Mine Resource.
90
13.0 MINERAL PROCESSING AND METALLURGICAL TESTING
13.1 HISTORICAL TEST WORK
Extensive metallurgical test work was completed prior to processing any material from the Timmins West Mine. The following companies were involved with various aspects of metallurgical evaluations.
· SGS Lakefield Research Limited, Lakefield, Ontario (SGS)
· EHA Engineering Ltd., Richmond Hill, Ontario (EHA)
· RPC Engineering, Fredericton, New Brunswick (RPC)
· Pocock Industrial, Inc., Salt Lake City, Utah, USA (Pocock)
· Golder Associates, Sudbury, Ontario (Golder)
RPC and SGS tested samples of the ore types as composites as well as individual samples. The test programs consisted of bottle rolls to determine the metallurgical response of the ore types to cyanide recovery along with tests to determine gravity concentration, pulp agglomeration, flotation, and cyanide leaching of the flotation tailings and concentrates. RPC performed crushing, grinding and abrasion indices determinations. Pocock and Golder performed flocculent screening, gravity sedimentation, and pulp rheology on leached tailings samples. SGS also performed preliminary sag mill testing. EHA evaluated work completed by RPC.
The test work results indicated that the ore will be very amenable to the Bell Creek Mill conventional gold milling processes. Specifically, the ore was free milling and the gold responded well to cyanide leaching and CIP recovery.
In general, there was found to be good correlation between the results expected based on test work and the actual operating results. In some cases, the actual results exceeded expectations.
13.2 RECENT TEST WORK
The Bell Creek Mill Phase 1 expansion was completed in October 2010. Planning for Phase 2 of the mill expansion (increasing throughput capacity to over 3,000 tonnes per day) was started in the first quarter of 2011. Part 1 of the expansion was completed by the end of of 2012 and increased the plant to a throughput of 2,500 tpd. The Phase 2 expansion was completed during the third quarter of 2013. Prior to launching the Phase 2 expansion project, more comprehensive test work was completed. The following companies were involved with this test work.
· G&T Metallurgical Services LTD. Kamloops, BC (G&T)
· Starkey & Associates Inc., Oakville, Ontario (Starkey)
· Xstrata Process Support, Falconbridge, Ontario (XPS)
· Outotec Canada Inc. (Outotec)
· FLSmidth Knelson, Langley, BC (Knelson)
91
G&T Metallurgical completed bond work indices on four different types of mineralized material from the Timmins West Mine. These samples included:
· Timmins Deposit — Shaft (material from the lower areas of the mine)
· Timmins Deposit — Ramp (material from the upper areas of the mine)
· Thunder Creek Deposit — Non-Porphyritic and Porphyritic
The bond ball mill work index for these ores ranged from 12.4 kWh/tonne for the shaft ore to 17.0 kWh/tonne for Non-Porphyritic Thunder Creek ore. Sag mill (SMC) tests were also completed on these samples with the test data indicating that the ore ranged in hardness from moderately hard to very hard. The objective of Starkey and Associates’ test work was to size a sag mill that would enable the throughput to be increased to 3,000 tonnes per day using the two existing mills. Starkey also verified that a mill (which was available on the market at the time) was suitable for 3,000 tonnes per day and also had the capability to process up to 6,000 tonnes per day. All the different material types were used for the test work. XPS used Starkey and Associates’ data and ran JKSimMet simulations of the sag circuit with tonnage set at 250 tonnes per hour and using the hardest of the four materials. These results were used to establish the best operating conditions and obtain circulating load, pulp density, cyclone feed, and cyclone overflow data which were used to help suppliers in the sizing of the cyclones. Outotec tested the material types for settling characteristics to size a new high efficiency thickener rated for 6,000 tonnes per day. Knelson tested the shaft and Thunder Creek material to establish data points for gravity recoverable gold (GRG). Shaft ore GRG was 78.6% and the Thunder Creek GRG was 53.5 percent. This information is being used as the basis for increasing the efficiency of the gravity circuit.
Test work was undertaken in 2013 by SGS Minerals to determine the effect of grind on recovery. It showed a slightly increasing recovery with finer grinds, as well as lower than expected gravity gold recoveries. Gravity gold recoveries were 25.7% for Thunder Creek ore, 18.3% for Timmins Deposit, and 38.7% for Bell Creek ore. This shows how variable the ore is within these orebodies.
In-house test work continues on a regular basis to confirm and increase the metallurgical performance of the plant, including stripping circuit and leaching circuits.
Overall, the combination of Lake Shore’s operating history and the extensive amount of test work conducted provides confidence that the process design and equipment selection will result in achieving the targeted recovery and throughput levels.
92
14.0 MINERAL RESOURCE ESTIMATES
14.1 SUMMARY
Lake Shore Gold (LSG) has prepared an updated Resource Estimate for the Timmins West Mine (TWM) which includes mineralized zones from the Timmins and Thunder Creek Deposits. The report updates the Timmins Mine Resource as reported by LSG in March 2013. The estimate for the TWM is based on historical diamond drilling dating back to March 1984 and drilling completed by LSG between July 2003 and the date of databases being closed for the current estimate. The database for the Timmins Deposit was closed November 26, 2013, and the database was for Thunder Creek was closed January 8, 2014. A total of 1,158 drill holes (totaling 215,997 metres) were used to estimate resources for the Timmins Deposit with 670 holes (120,053 metres) used in the Thunder Creek Estimate.
The TWM Resource totals 4.36 Mt at 5.09 g/t Au, amounting to 714,633 ounces of gold in the Indicated category and 2.94 Mt at 5.46 g/t Au amounting to 516,339 ounces of gold in the Inferred category. Subdivision of the resource into the Timmins Deposit and the Thunder Creek Deposit is shown in Table 14.1.
Resources are centered on 9700E (4425E mine grid) section and extend from 9900 to 8670 elevation (115 to 1,345 metres below surface) for the Timmins Deposit and are centered on 9550N (4675E mine grid) section extending from 9820 to 8980 elevation (190 to 1,040 metres below surface) for the Thunder Creek Deposit. The Mineral Resource for the Timmins Deposit has been modeled into 51 sub-zones which refine the broader mineralized Ultramafic, Footwall, and Vein Zones. The Thunder Creek Deposit has been modeled into 18 sub-zones which refine the broader Rusk and Porphyry Zones.
Resources were estimated using Inverse Distance Squared (ID2) grade interpolation with an anisotropic search. All gold assays were capped with capping limits varying between 50 and 90 g/t by zone. A minimum mining width of 2 metres was assumed and only samples within a mineralized zone were used for estimation of the zone. A weighted average gold price of $1,150 per ounce was assumed.
The mineralized zones defined and used for estimation of resources are focused on material grading 3.0 g/t with lower grade material included for internal continuity. For the purposes of this report, a base case using a cut-off grade of 1.5 g/t Au is reported in order to maintain continuity within each zone.
93
TABLE 14.1: TIMMINS WEST MINE RESOURCE ESTIMATE
Deposit | | Resource
Classification | | Tonnes | | Capped Grade
(g/t Au) | | Contained Gold
(ounces) | |
Timmins | | Indicated | | 1,893,497 | | 5.16 | | 314,153 | |
| | Inferred | | 2,075,079 | | 5.67 | | 378,516 | |
Thunder Creek | | Indicated | | 2,470,674 | | 5.02 | | 400,480 | |
| | Inferred | | 863,633 | | 5.02 | | 137,823 | |
Total Timmins West Mine | | Total Indicated | | 4,364,171 | | 5.09 | | 714,633 | |
| | Total Inferred | | 2,938,712 | | 5.46 | | 516,339 | |
(Prepared by Lake Shore Gold — Report Date February 21, 2014)
Notes:
1. Sums may not add due to rounding.
2. CIM definitions were followed for classification of Mineral Resources.
3. Capped gold grades are used in estimating the Mineral Resource average grade.
4. A minimum mining width of 2 metres was used.
5. The estimate includes low grade material which is not in the current mine plan.
6. Mineral Resources are reported at a cut-off grade of 1.5 g/t and include internal dilution to maintain zone continuity.
7. Weighted average gold price was assumed at $1,150 per ounce (approximately US$1,100).
8. Metallurgical recoveries are assumed to average 96.5 percent.
14.2 ESTIMATION METHOD
14.2.1 Procedures Summary
The following general procedure was used to develop the block model Mineral Resource estimate for the Timmins Deposit and Thunder Creek Deposit and includes:
· Database compilation in Gemcom (GEMS).
· Verification of data using the GEMS “validate data” feature.
· Interpretation of zones on vertical sections taking into account structure, lithology, alteration, veining and sulphide content. In addition to diamond drilling, underground development mapping and sampling were used as an aid but only diamond drill data was used for grade estimation.
· Section spacing for Timmins Deposit is 6.25 metres on north-south sections between 4500E and 4800E on the mine grid. Section spacing west of 4500E was increased to 25 metres due to limited diamond drilling at depth. East of 4800E, a section spacing of 12.5 metres was used.
· Section spacing for the Thunder Creek Deposit is 7.5 metres on rotated (33 azimuth) sections, excepting the area east of and below the 750 metre level where section spacing was increased to 15 metres due to limited diamond drilling.
· Limits of the zone were focused on drill intersections exceeding 3.0 g/t although assays below this grade are included as necessary to maintain continuity.
· A minimum mining width of 2 metres was used.
· Zones were defined by three or more intersections that form a continuous band of mineralization. The majority of the 69 zones were outlined using 20 to 60 drill holes. Only 16 were based on less than ten drill holes, while seven zones contained in excess of 100 drill holes.
· Closed 3D rings were constructed and assigned an appropriate rock type and stored with its section definition in the GEMS polyline workspace.
94
· Closed 3D rings were projected half the distance to the next section in areas where drilling closed off mineralization, or up to a maximum of 50 metres in areas with no drilling.
· 3D solids were created from the closed strings and were validated using the GEMS solid validation tools. A total of 51 domain solids were created for the Timmins Deposit and 18 solids for the Thunder Creek Deposit. Each solid was assigned a unique rock code identifier.
· Solid intersection composites were generated from all drill holes intersecting the 3D Mineral Resource Solids. Corresponding entry and exit points were saved to the drill hole workspace and back coded with a zone identifier.
· Individual 1 metre composites were generated from the assay table based on down-the-hole averaging within the limits of the solid intersection composites. Composites whose widths were less than 0.5 metres were removed from the composite table. The composites are stored in a GEMS point area table along with a corresponding rock code for each composite.
· Individual block models were created for the Timmins Deposit and the Thunder Creek deposit incorporating 2 metre x 2 metre x 2 metre blocks.
· Grade interpolation was completed using ID2 for estimation with anisotropic search and multiple estimation passes with increasing search ranges. Search ranges and orientation were evaluated individually by zone and deposit. Only samples from within each unique mineralized zone (solid) were used for the estimation of the zone.
· Level development and mined out blocks were removed from the block model by setting density and estimated grade values to zero. This was completed using 3D solids of the mine workings and surveyed or planned stope shape (where surveys were lacking).
· In conjunction with the engineering group, those blocks deemed to be non-mineable due to small size, low grade or limited access, and non-recoverable pillars were removed from the mineralization model (using a similar process to above).
· The remaining blocks were categorized by grouping of areas of predominately estimation Pass 1 and Pass 2 as Indicated and the remaining areas of largely Pass 3 or Pass 4 as Inferred Resources. A final category field was added to the block model to track this categorization.
14.2.2 Database
The database used for the current resource estimate is comprised of a Gemcom GEMS (Microsoft SQL) database which was compiled from data received from West Timmins Mining Inc., Holmer Gold Mines Ltd., and work completed by LSG since acquisition of the properties. The GEMS diamond drill hole database consists of tables including header, survey, lithology, and assay data with pertinent fields summarized in Table 14.2. Other tables and additional fields within the above tables are currently being utilized by LSG in logging of the drill core and final resource estimation.
Other data such as cross-sectional geological interpretation strings, section and level plan definitions, 3D geological solids, point area data of assays and composites, as well as the block model, are also stored within GEMS. Details on database validation are discussed in Item 12 of the report.
95
TABLE 14.2: SUMMARY OF GEMS SQL DRILL HOLE DATABASE
Table Name | | Table Description | | Fields |
Header | | Drill hole collar location data in local grid coordinates | | Hole-ID
Location X
Location Y
Location Z
Length
Collar_Az
Collar_Dip |
Survey | | Downhole survey data of direction measurements at downhole distances | | Hole-ID
Distance
Azimuth
Dip |
Assays | | Sample interval assay data with Au units grams per tonne | | Hole-ID
From
To
Sample_NO
Au_GPT_FIN
Au_GPT_AA
Au_GPT_GRA
Au_GPT PM |
Lithomaj | | Major logged rock type intervals downhole | | Hole-ID
From
To
Rocktype |
Lithomin | | Minor logged rock type intervals downhole | | Hole-ID
From
Rocktype |
14.2.3 Mineralized Domains
For estimation purposes, a total of 51 discreet mineralized domain solids have been created for the Timmins Mine Deposit with 18 domain solids created for the Thunder Creek Deposit. Many of these domains exhibit similar geologic setting and characteristics. A summary of these mineralized domains is presented in Table 14.3. Figure 14.1 illustrates a 3D view of the mineralization solids looking northeast.
96
TABLE 14.3: MINERALIZED DOMAINS
TIMMINS MINE
Vein Zones | | Description: Qtz-tm veins and stockworks zones, 1 metre to 5 metres wide, associated with pyrite, arsenopyrite, and coarse visible gold. The veins are generally emplaced near the volcanic-to-sediment contact zones | |
| | | |
Domain | | Rock Code | | Domain | | Rock Code | | Domain | | Rock Code | |
525_V1 | | 1 | | 525_V3AU | | 131 | | 525_V3BU | | 141 | |
525_V2U | | 21 | | 525_V3AM | | 132 | | 525_V3BL | | 142 | |
525_V2L | | 22 | | 525_V3AL | | 133 | | | | | |
525_V3 E | | 31 | | | | | | | | | |
525_V3 W | | 32 | | | | | | | | | |
| | | |
Main Zone | | Description: Similar to the qtz-tm veins and stockworks zones, associated with pyrite, arsenopyrite, and coarse visible gold; predominantly hosted by sediments | |
| | | |
Domain | | Rock Code | | Domain | | Rock Code | | Domain | | Rock Code | |
525_MZ1A | | 511 | | | | | | | | | |
525_MZ1B | | 512 | | | | | | | | | |
525_MZ1C | | 513 | | | | | | | | | |
525_MZ2 | | 502 | | | | | | | | | |
| | | |
Footwall Zones Above 525 | | Description: Sheared and mylonitized mafic volcanics rocks, associated with local quartz-albite veining, and pervasive silica, albite and pyrite alteration | |
| | | |
Domain | | Rock Code | | Domain | | Rock Code | | Domain | | Rock Code | |
525_FW1U | | 1401 | | 525_FW2 | | 402 | | 525_FW3 | | 403 | |
525_FW1L | | 1402 | | 525_FW2A | | 422 | | | | | |
| | | | 525_FW2B | | 423 | | | | | |
| | | | 525_FW2C | | 424 | | | | | |
| | | |
Footwall Zones Below 650 | | Description: Sheared and mylonitized mafic volcanics rocks, associated with local quartz-albite veining, and pervasive silica, albite and pyrite alteration | |
| | | |
Domain | | Rock Code | | Domain | | Rock Code | | Domain | | Rock Code | |
FW_1 | | 4001 | | FW_2 | | 4003 | | FW_4 | | 4007 | |
FW_1E | | 4101 | | FW_2A | | 4103 | | FW_5 | | 4009 | |
| | | | FW_2B | | 4203 | | FW_6 | | 4011 | |
| | | |
Ultramafic Zones | | Description: Quartz-tourmaline veining hosted by strongly altered (iron-carbonate, albite) pyroxenite, accompanied by up to 10-15% disseminated pyrite | |
| | | |
Domain | | Rock Code | | Domain | | Rock Code | | Domain | | Rock Code | |
UM_1 | | 6001 | | UM_2 | | 7001 | | UM_5 | | 6005 | |
UM_1A | | 6003 | | UM_2B | | 7007 | | UM_5B | | 6015 | |
| | | | UM_2C | | 7009 | | UM_6 | | 6007 | |
| | | | UM_2UE | | 7003 | | UM_7 | | 6009 | |
| | | | UM_2UW | | 7005 | | UM_8 | | 6011 | |
| | | | UM_3 | | 5001 | | UM_9 | | 6013 | |
| | | | UM_4 | | 5003 | | | | | |
97
D Zones | | Description: Altered pyroxenite hosted comparable to UM zone | |
| | | |
Domain | | Rock Code | | Domain | | Rock Code | | Domain | | Rock Code | |
D_2 | | 8005 | | | | | | | | | |
D_2A | | 8007 | | | | | | | | | |
D_3 | | 8009 | | | | | | | | | |
D1_FW | | 8003 | | | | | | | | | |
D1_HW | | 8001 | | | | | | | | | |
| | | |
S Zone | | Description: Highly altered and deformed pyroxenite; disseminated pyrite; mineralization wraps around sediment UM contact | |
| | | |
Domain | | Rock Code | | Domain | | Rock Code | | Domain | | Rock Code | |
S_1 | | 9001 | | | | | | | | | |
S_2 | | 9003 | | | | | | | | | |
| | | |
THUNDER CREEK | | | |
| | | |
Upper Thunder Creek | | Description: Rusk-style mineralization; highly sheared and carbonatized pyroxenite, intruded by syenite dykelets and qtz ±fldp-cb veinlets; strong disseminatd pyrite | |
| | | |
Domain | | Rock Code | | Domain | | Rock Code | | Domain | | Rock Code | |
UTC_1 | | 201 | | UTC_5 | | 209 | | | | | |
UTC_2 | | 203 | | UTC_6 | | 211 | | | | | |
UTC_3 | | 205 | | UTC_7 | | 213 | | | | | |
UTC_4 | | 207 | | UTC_8 | | 215 | | | | | |
| | | |
Rusk Zones | | Description: Strongly sheared and altered pyroxenite-to-sediment contact zone, with remnant mafic volcanic slivers/inclusions. Minor quartz veining and strong pyrite disseminations. RUSK is the main unit, RUSK_HW is similar shear hosted zone in Ultramafics hangingwall to the RUSK | |
| | | |
Domain | | Rock Code | | Domain | | Rock Code | | Domain | | Rock Code | |
RUSK | | 301 | | RUSK_HW | | 307 | | | | | |
RUSK_L | | 303 | | | | | | | | | |
RUSK_ U | | 305 | | | | | | | | | |
| | | |
Porphyry Zones | | Description: Syenite/qtz monzonite porphyry and extensional vein arrays, including visible gold and accessory pyrite, galena, sphalerite, and scheelite in the veins; POR is the main unit, POR_2 to 6 are splays | |
| | | |
Domain | | Rock Code | | Domain | | Rock Code | | Domain | | Rock Code | |
POR | | 401 | | POR_2 | | 403 | | | | | |
| | | | POR_3 | | 405 | | | | | |
| | | | POR_4 | | 407 | | | | | |
| | | | POR_5 | | 409 | | | | | |
| | | | POR_6 | | 411 | | | | | |
98
FIGURE 14.1: 3D VIEW OF RESOURCE SOLIDS, LOOKING NORTHEAST
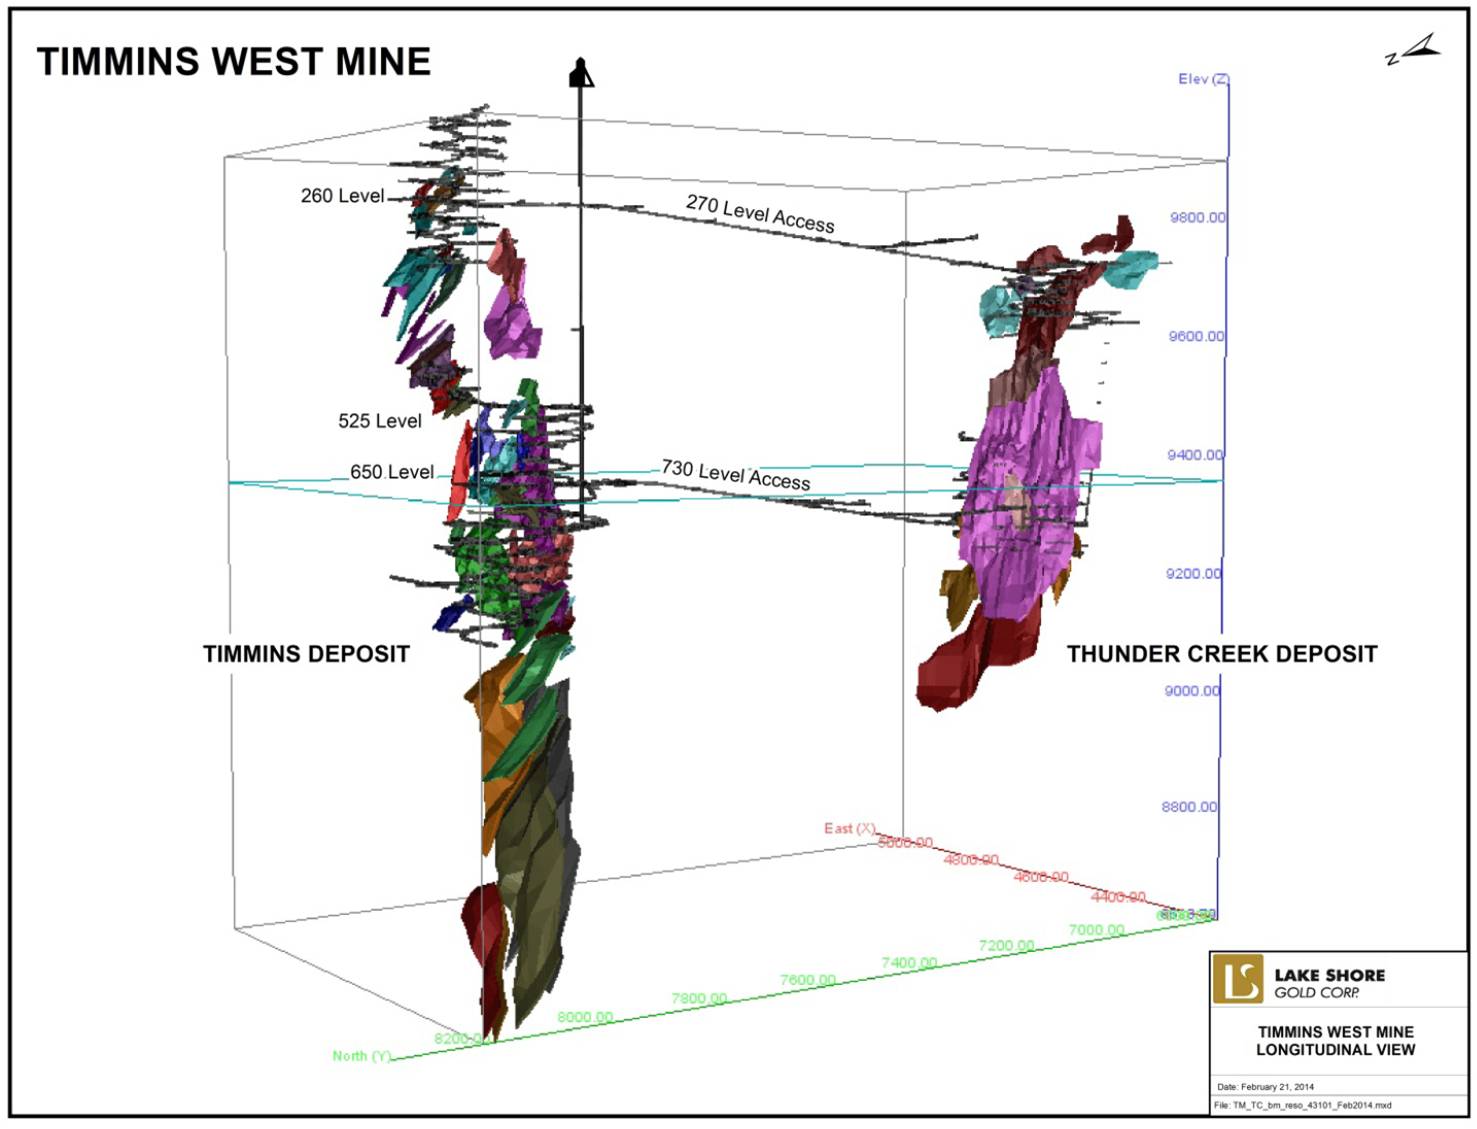
14.2.4 Grade Capping
LSG has utilized grade capping in its estimation of the Mineral Resources for the Timmins and Thunder Creek Deposit. To evaluate potential cutting factors, assay values were extracted from the drill hole database and flagged by zone according to the mineralized solid enclosing the drill hole assay. Individual statistical reports based on the raw gold assays were generated for each of the resource solids and are tabulated in Table 14.4 for the Timmins and Thunder Creek Deposits. Zones having a limited number of samples were grouped with those displaying similar mineralization characteristics for evaluation.
99
TABLE 14.4: BASIC STATISTICS OF RAW AU ASSAYS BY RESOURCE SOLID
Zone | | Total
Samples | | Minimum
(g/t Au) | | Maximum
(g/t Au) | | Mean
(g/t Au) | | 99th
Percentile | | Coefficient of
Variation | |
Timmins Deposit | | | | | | | | | | | | | |
Veins (V1 to V3) | | 890 | | 0.002 | | 394.908 | | 4.483 | | 71.133 | | 4.092 | |
Main Zone (MZ1 and 2) | | 1,015 | | 0.002 | | 879.439 | | 7.436 | | 107.500 | | 5.889 | |
All Vein Zones | | 1,905 | | 0.002 | | 879.439 | | 6.056 | | 79.000 | | 5.673 | |
FW above 525 Level | | 1,392 | | 0.002 | | 56.700 | | 3.086 | | 24.833 | | 1.577 | |
FW below 650 Level | | 4,703 | | 0.002 | | 102.000 | | 4.361 | | 34.700 | | 1.716 | |
UM 1 | | 4,428 | | 0.002 | | 1,340.000 | | 6.750 | | 72.600 | | 3.993 | |
UM Hangingwall | | 2,771 | | 0.002 | | 120.909 | | 4.000 | | 35.400 | | 1.900 | |
UM below 720 Level | | 5,129 | | 0.002 | | 5,010.000 | | 7.719 | | 72.300 | | 9.321 | |
D Zone (D1 to D3) | | 926 | | 0.002 | | 369.000 | | 5.312 | | 47.300 | | 3.403 | |
S1 and S2 | | 684 | | 0.003 | | 282.000 | | 4.525 | | 40.469 | | 2.920 | |
All Ultramafic Zones | | 13,938 | | 0.002 | | 5,010.000 | | 6.355 | | 66.267 | | 7.346 | |
Thunder Creek Deposit | | | | | | | | | | | | | |
UTC Zone | | 2,376 | | 0.002 | | 273.000 | | 4.309 | | 38.900 | | 2.797 | |
Porphyry Zones | | 14,144 | | 0.002 | | 1,600.000 | | 4.769 | | 56.100 | | 4.816 | |
Rusk Zones | | 4,240 | | 0.002 | | 166.000 | | 7.341 | | 58.500 | | 1.690 | |
To aid in determining appropriate capping limits histograms, cumulative frequency plots and log probablility plots were generated for individual and grouped zones. This evaluation was completed utilizing Snowden’s Supervisor software Visor+Analysor Version 8. All gold grades were capped prior to the creation of drill hole composites.
Cumulative frequency plots for the most significant zones are provided in Figure 14.2 and Figure 14.3, and the effect of capping the gold grade is illustrated in Table 14.5.
100
FIGURE 14.2: TIMMINS DEPOSIT CUMULATIVE HISTOGRAMS
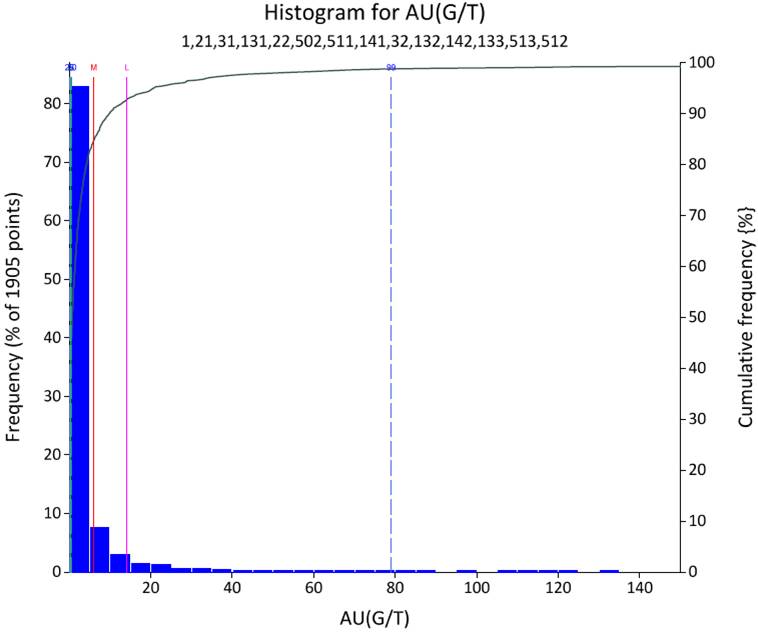
Vein Zones
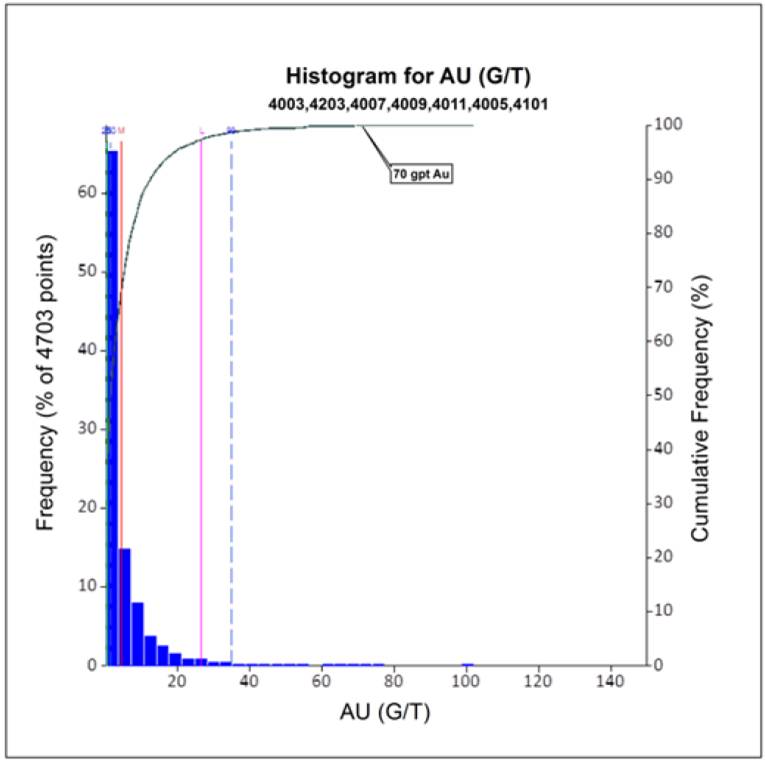
Footwall Below 650
101
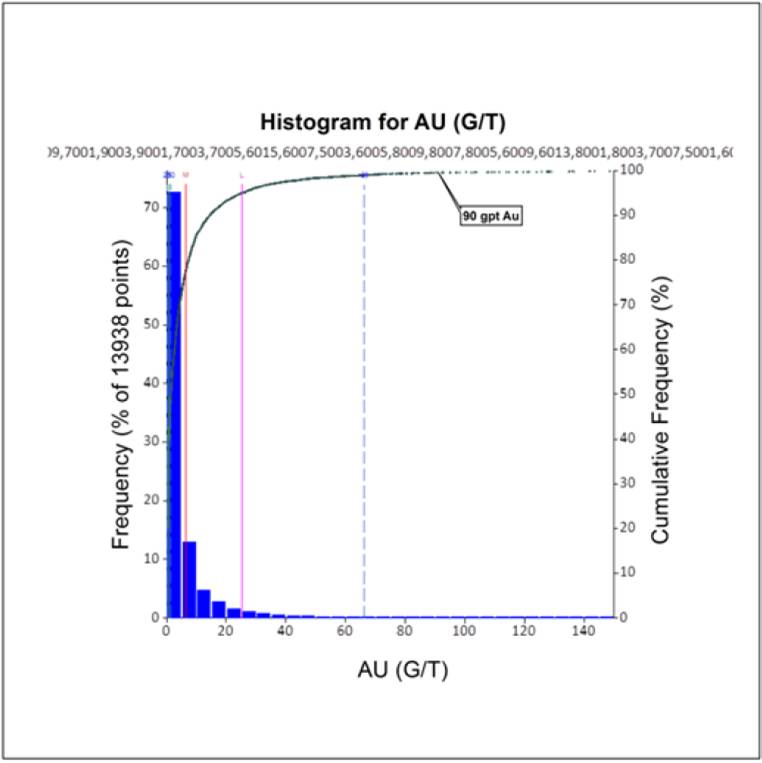
UM Zones
FIGURE 14.3: THUNDER CREEK CUMULATIVE HISTOGRAMS
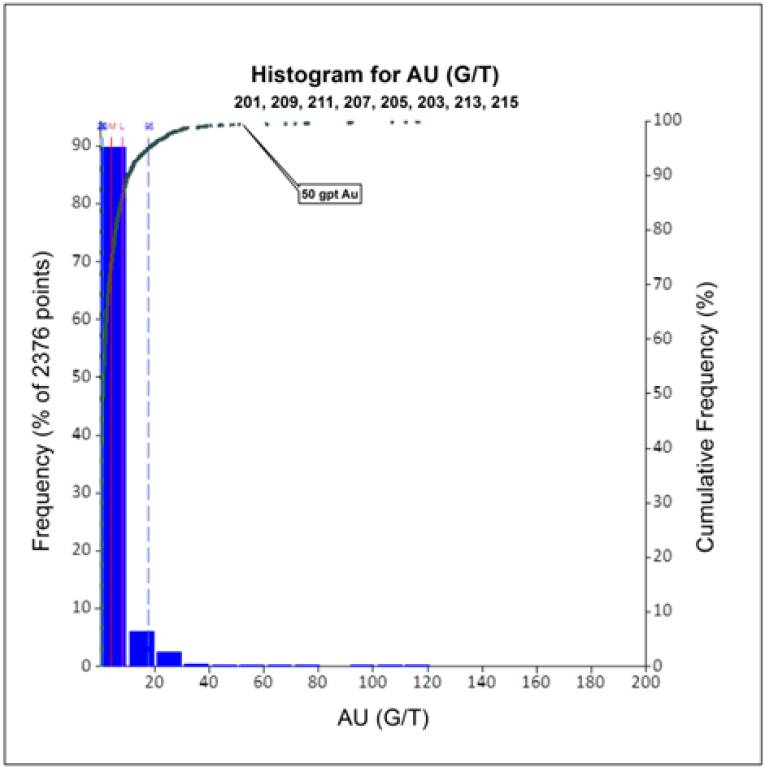
UTC Zones
102
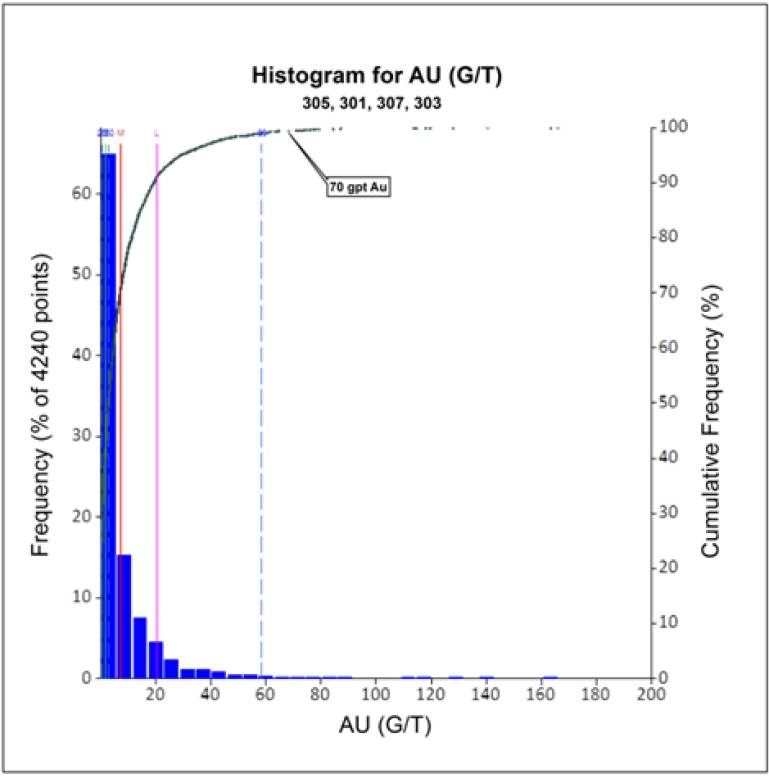
Rusk Zone
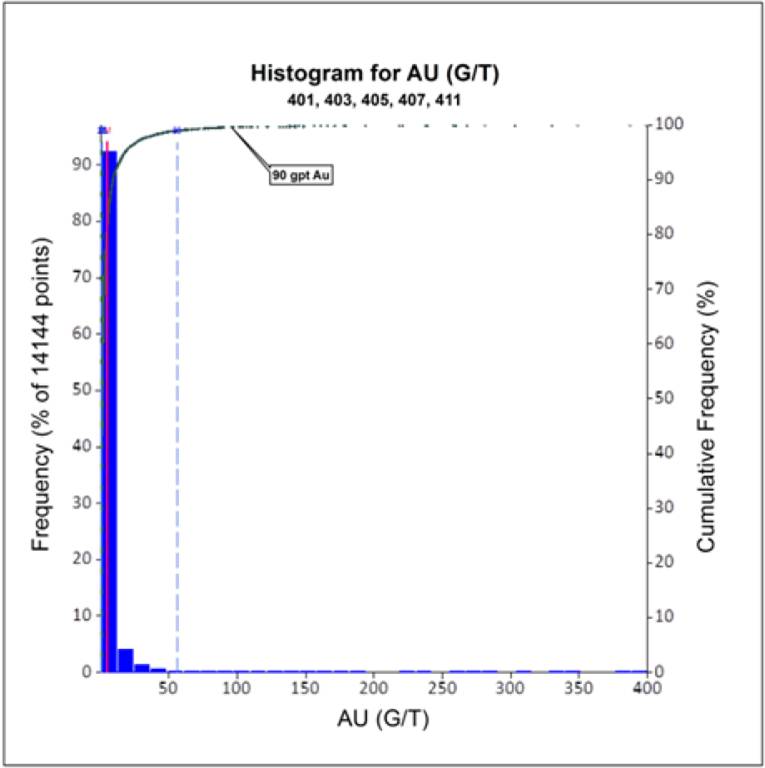
Porphyry Zone
103
TABLE 14.5: CAPPED AND UNCAPPED GOLD GRADES
Zone | | Total
Samples | | Maximum
(g/t Au) | | Mean
(g/t Au) | | Capping Value
(g/t Au) | | Sample Qty.
Removed | | Capped Mean
(g/t Au) | |
Timmins Deposit | | | | | | | | | | | | | |
Veins (V1 to V3) | | 890 | | 394.91 | | 4.48 | | 50 | | 12 | | 3.51 | |
Main Zone (MZ1 and 2) | | 1,015 | | 879.44 | | 7.44 | | 50 | | 24 | | 4.24 | |
All Vein Zones | | 1,905 | | 879.44 | | 6.06 | | 50 | | 36 | | 3.90 | |
FW above 525 Level | | 1,484 | | 567.00 | | 3.05 | | 50 | | 1 | | 3.04 | |
FW below 650 Level | | 4,703 | | 102.00 | | 4.36 | | 70 | | 1 | | 4.35 | |
UM 1 | | 4,356 | | 1,340.00 | | 6.70 | | 90 | | 29 | | 5.92 | |
UM 2 to UM 4 (hangingwall to UM 1) | | 2,843 | | 190.50 | | 4.14 | | 90 | | 3 | | 4.09 | |
UM below 650 Level (UM 5 to UM 9) | | 5,129 | | 5,010.00 | | 7.72 | | 90 | | 29 | | 6.44 | |
D Zone (D1 to D3) | | 926 | | 369.00 | | 5.31 | | 90 | | 5 | | 4.69 | |
S1 and S2 | | 684 | | 282.00 | | 4.52 | | 90 | | 1 | | 4.24 | |
All Ultramafic Zones | | 13,938 | | 5,010.00 | | 6.35 | | 90 | | 67 | | 5.57 | |
Thunder Creek Deposit | | | | | | | | | | | | | |
UTC Zone | | 2,376 | | 273.00 | | 4.31 | | 50 | | 16 | | 3.88 | |
Porphyry Zones | | 14,408 | | 1,600.00 | | 4.73 | | 90 | | 59 | | 4.12 | |
Rusk Zones | | 4,240 | | 166.00 | | 7.34 | | 70 | | 26 | | 7.18 | |
14.2.5 Assay Compositing
Each 3D solid was assigned a unique name and numeric rock code which was used to flag drill hole assays by solid intersections. This solid intersection table was used to generate a set of 1 metre long equal length composites within the limits of the 3D solid. Short composites of less than 0.5 metres in length created at the edge of a solid were deleted. The solid intersections and 1 metre composites are stored in a GEMS table and were extracted out to a point area file for interpolation purposes for each of the Deposits. Both capped and uncapped composite grades are stored in the point area file.
A total of 1,806 solid intersections from 1,158 unique holes were used in the Timmins Deposit to produce at total of 17,048 one metre composites.
For Thunder Creek a total of 1,048 solid intersections from 670 unique holes were used to generate 14,497-1 metre composites.
Basic statistics for the 1 metre composites were compiled for the solids used in the resource estimate and are tabulated in Table 14.6.
104
TABLE 14.6: BASIC STATISTICS OF 1 METRE COMPOSITES
Zone | | Total
Samples | | Minimum
(g/t Au) | | Maximum
(g/t Au) | | Mean
(g/t Au) | | 99th
Percentile | | Coefficient of
Variation | |
Timmins Deposit | | | | | | | | | | | | | |
Veins (V1 to V3) | | 727 | | 0.001 | | 50.000 | | 2.680 | | 27.900 | | 2.109 | |
Main Zone (MZ1 and 2) | | 772 | | 0.001 | | 43.066 | | 3.130 | | 31.467 | | 1.906 | |
All Vein Zones | | 1,499 | | 0.001 | | 50.000 | | 2.912 | | 31.050 | | 1.998 | |
FW Above 525 Level | | 1,091 | | 0.001 | | 32.955 | | 2.834 | | 20.780 | | 1.428 | |
FW Below 650 Level | | 3,368 | | 0.001 | | 62.223 | | 4.190 | | 29.306 | | 1.464 | |
UM 1 | | 3,770 | | 0.001 | | 90.000 | | 5.161 | | 48.440 | | 1.830 | |
UM Hangingwall | | 2,425 | | 0.001 | | 77.924 | | 3.479 | | 27.159 | | 1.703 | |
UM Below 720 Level | | 3,779 | | 0.001 | | 90.000 | | 6.102 | | 55.510 | | 1.787 | |
D Zone (D1 to D3) | | 488 | | 0.002 | | 72.214 | | 4.601 | | 40.158 | | 1.610 | |
S1 and S2 | | 553 | | 0.001 | | 76.118 | | 4.024 | | 35.183 | | 1.815 | |
All Ultramafic Zones | | 11,015 | | 0.001 | | 46.745 | | 5.032 | | 46.745 | | 1.834 | |
Thunder Creek Deposit | | | | | | | | | | | | | |
UTC Zone | | 1,900 | | 0.001 | | 49.986 | | 3.690 | | 28.974 | | 1.609 | |
Porphyry Zones | | 9,778 | | 0.001 | | 90.000 | | 3.913 | | 40.504 | | 1.983 | |
Rusk Zones | | 2,819 | | 0.000 | | 70.000 | | 6.700 | | 42.314 | | 1.340 | |
14.3 SPECIFIC GRAVITY
Specific gravity (SG) was determined on 994 samples representative of different styles of mineralization from the Timmins and Thunder Creek Deposits. SG measurements were completed at the LSG exploration office or Timmins Mine core shack using the conventional approach of weighing the samples dry and immersed in water.
Mineralized zones were grouped based on the dominant mineralization style within the solid. For example, the Upper Thunder Creek — UTC Zones were grouped individually as Rusk or Porphyry mineralization although trimming limits for the UTC Zones were evaluated separately. Similarly, the Timmins Deposit D Zones are grouped with the Ultramafic Zones in terms of SG.
Table 14.7 summarizes the specific gravity values that were used in the Resource estimate by deposit and zone.
TABLE 14.7: SPECIFIC GRAVITY BY ZONE
Deposit | | Zone | | Historical SG | | Readings
Quantity | | Reading
Average | | Final SG | |
Timmins | | Footwall | | 2.88 | | 231 | | 2.81 | | 2.81 | |
| | Veins | | 2.81 | | 19 | | 2.79 | | 2.81 | |
| | Ultramafic | | 2.92 | | 223 | | 2.90 | | 2.92 | |
| | | | | | | | | | | |
Thunder Creek | | Rusk | | — | | 284 | | 2.92 | | 2.92 | |
| | Porphyry | | — | | 521 | | 2.66 | | 2.66 | |
105
14.4 VARIOGRAPHY
Semi-variograms were created for the Resource solids using the capped 1 metre composites for the Timmins Deposit and the Thunder Creek Deposit. A spherical model with one or two structures was fitted to each variogram.
In general the variography confirmed the orientation of the models with the primary direction along the strike of the zones. The models are characterized by a high nugget and typically produced a short range for the primary structure of less than 20 metres with ranges between 25 to 35 metres for the secondary structure.
Insufficient data points were available to create suitable variograms for all zones at the Timmins Deposit. In these cases, ranges were assumed to be equivalent to mineralized zones having similar characteristics. Examples are presented below in Figure 14.4.
FIGURE 14.4: VARIOGRAMS — TIMMINS DEPOSIT — FW ZONE, UM BELOW 650ML
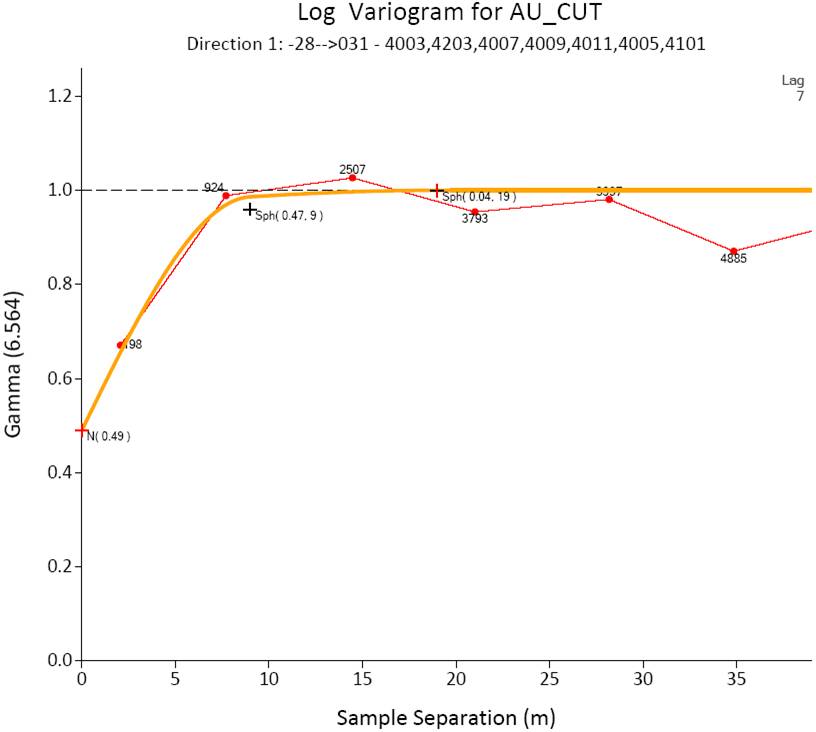
106
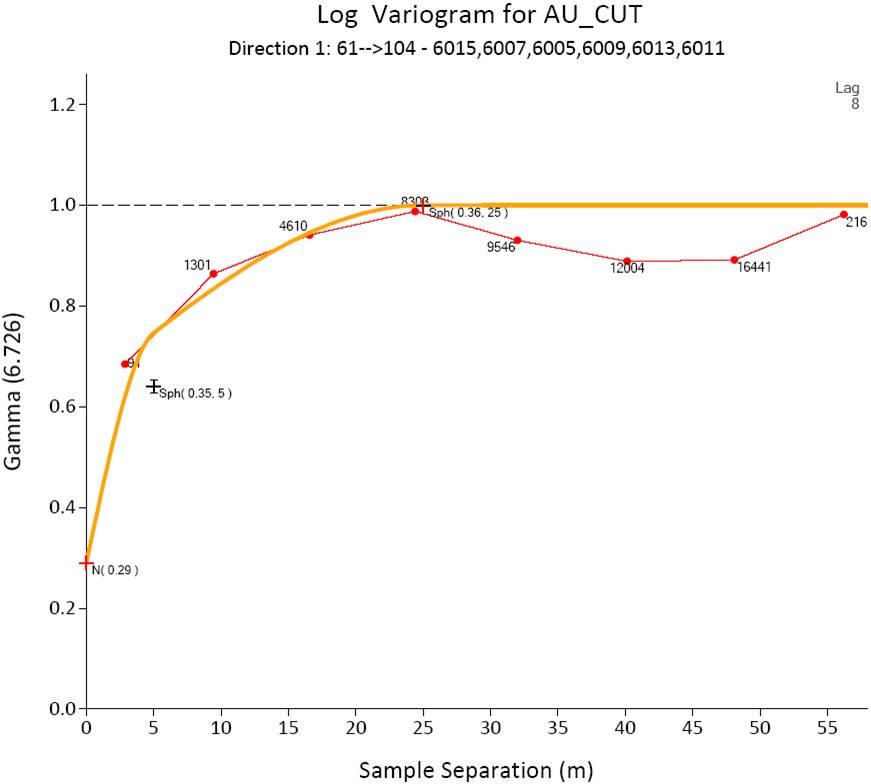
Variograms for the UTC and Rusk Zones are shown in Figure 14.5. No new variogram was created for the Porphyry Zone at Thunder Creek due to the extreme high nugget effect.
In general, the variography confirmed the general orientation of the Rusk models with the primary direction along the strike of the zone. The models typically produced ranges for the primary and secondary structures between 20 and 30 metres with a high nugget effect.
107
FIGURE 14.5: VARIOGRAMS FOR THUNDER CREEK DEPOSIT — UTC, RUSK ZONES

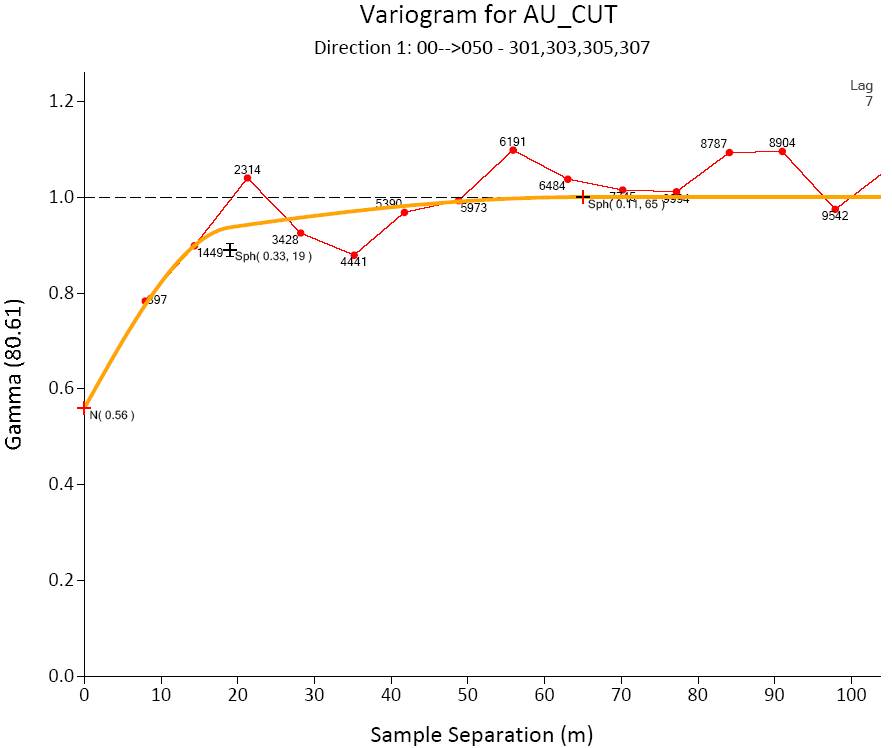
108
14.5 BLOCK MODEL MINERAL RESOURCE MODELING
14.5.1 General
The grade of the Mineral Resources for both Timmins Deposit and Thunder Creek deposit was estimated by using the ID2 interpolation with anisotropic weighting. This method interpolates the grade of a block from several composites within a defined distance range from the block. The estimation uses the inverse of the distance between a composite and the block as the weighting factor to determine the grade.
14.5.2 Block Model Parameters
Individual models were completed for the Timmins Deposit and the Thunder Creek Deposit. A summary of the model grid parameters are shown in Table 14.8.
TABLE 14.8: BLOCK MODEL GRID PARAMETERS
Model Origin | | Grid | | Model Dimension | | Block Dimension | |
Timmins Deposit | | | | | | | |
X | | 4200 E | | Columns | 450 | | Column Width | 2.0 m | |
Y | | 7750 N | | Rows | 280 | | Row Width | 2.0 m | |
Z | | 10020 el | | Levels | 700 | | Level Height | 2.0 m | |
| | | | Orientation | No Rotation | | | | |
Thunder Creek Deposit | | | | | | | | | |
X | | 4200 E | | Columns | 250 | | Column Width | 2.0 m | |
Y | | 6750 N | | Rows | 275 | | Row Width | 2.0 m | |
Z | | 98800 el | | Levels | 450 | | Level Height | 2.0 m | |
| | | | Orientation | No Rotation | | | | |
14.5.3 Grade Interpolation
Block grades within the Timmins and Thunder Creek block models were interpolated by a four pass system. The number of composites per drill hole was set such that a minimum of three drill holes were required to estimate a block for Runs 1 through 3. For Run 4, this was reduced to a minimum of two drill holes. It should be noted that Run 4 was completed in order to ensure no un-estimated gaps were created within a particular zone. Within the Thunder Creek block model, only 1,644 blocks within one domain (RUSK_L) were estimated using Run 4 out of 296,779 blocks estimated. Within the Timmins block model, 35,431 blocks within nine domains were estimated using Run 4 out of 405,795 blocks estimated.
The general geometry of zones, alteration, and mineralization observed in drill core and underground mapping was used in conjunction with log normal variograms of each mineralized zone to establish the search ellipse parameters. Zones lacking sufficient data points to generate meaningful variograms utilized search ranges based on zones with similar characteristics and setting. For the Porphyry Zones at Thunder Creek, the search orientation was based on the general outline of the Porphyry body and used ranges similar to those for the Rusk domain.
Search ellipse parameters for the Timmins and Thunder Creek Deposits are summarized in Table 14.9 and Table 14.10 respectively. For brevity, zones that were estimated using identical searches are
109
grouped together. In all cases the grade estimation was completed only using composites from within each individual zone.
TABLE 14.9: TIMMINS DEPOSIT SEARCH ELLIPSE PARAMETERS
| | | | Search Ellipse | | Search Ellipse Range | | | |
Zone | | | | Orientation (ZXZ) | | Orientation (ZXZ) | | Number of Samples | |
(Ellipse) | | Pass | | z | | x | | z | | x | | y | | z | | min | | max | | Max/hole | |
| | | | | | | | | | | | | | | | | | | | | |
Main Zone | | 1 | | 5 -70 | | | | -65 | | 15 | | 15 | | 8 | | 6 | | 12 | | 2 | |
(Pass_70) | | 2 | | 5 -70 | | | | -65 | | 30 | | 30 | | 15 | | 6 | | 12 | | 2 | |
| | 3 | | 5 -70 | | | | -65 | | 60 | | 60 | | 45 | | 6 | | 12 | | 2 | |
| | 4 | | 5 -70 | | | | -65 | | 90 | | 90 | | 60 | | 4 | | 12 | | 2 | |
| | | | | | | | | | | | | | | | | | | | | |
Vein Zone | | 1 | | 5 -60 | | | | -65 | | 15 | | 15 | | 8 | | 6 | | 12 | | 2 | |
(Pass_60) | | 2 | | 5 -60 | | | | -65 | | 30 | | 30 | | 20 | | 6 | | 12 | | 2 | |
| | 3 | | 5 -60 | | | | -65 | | 60 | | 60 | | 45 | | 6 | | 12 | | 2 | |
| | 4 | | 5 -60 | | | | -65 | | 90 | | 90 | | 60 | | 4 | | 12 | | 2 | |
| | | | | | | | | | | | | | | | | | | | | |
FW above 525 | | 1 | | 5 -48 | | | | -65 | | 15 | | 15 | | 8 | | 6 | | 12 | | 2 | |
(Pass) | | 2 | | 5 -48 | | | | -65 | | 30 | | 30 | | 20 | | 6 | | 12 | | 2 | |
| | 3 | | 5 -48 | | | | -65 | | 60 | | 60 | | 45 | | 6 | | 12 | | 2 | |
| | 4 | | 5 -48 | | | | -65 | | 90 | | 90 | | 60 | | 4 | | 12 | | 2 | |
| | | | | | | | | | | | | | | | | | | | | |
UM Zones | | 1 | | 15 -75 | | | | -65 | | 15 | | 15 | | 10 | | 6 | | 12 | | 2 | |
(UM) | | 2 | | 15 -75 | | | | -65 | | 30 | | 30 | | 20 | | 6 | | 12 | | 2 | |
| | 3 | | 15 -75 | | | | -65 | | 60 | | 60 | | 45 | | 6 | | 12 | | 2 | |
| | 4 | | 15 -75 | | | | -65 | | 90 | | 90 | | 60 | | 4 | | 12 | | 2 | |
| | | | | | | | | | | | | | | | | | | | | |
FW Zone | | 1 | | 10 -35 | | | | 55 | | 15 | | 15 | | 10 | | 6 | | 12 | | 2 | |
(FW) | | 2 | | 10 -35 | | | | 55 | | 30 | | 30 | | 60 | | 6 | | 12 | | 2 | |
| | 3 | | 10 -35 | | | | 55 | | 60 | | 60 | | 45 | | 6 | | 12 | | 2 | |
| | 4 | | 10 -35 | | | | 55 | | 90 | | 90 | | 60 | | 4 | | 12 | | 2 | |
| | | | | | | | | | | | | | | | | | | | | |
UM 4 Zone | | 1 | | 0 | | 0 | | 0 | | 12 | | 12 | | 12 | | 6 | | 12 | | 2 | |
| | 2 | | 0 | | 0 | | 0 | | 24 | | 24 | | 24 | | 6 | | 12 | | 2 | |
| | 3 | | 0 | | 0 | | 0 | | 48 | | 48 | | 48 | | 6 | | 12 | | 2 | |
| | 4 | | 0 | | 0 | | 0 | | 72 | | 72 | | 72 | | 4 | | 12 | | 2 | |
| | | | | | | | | | | | | | | | | | | | | |
D Zone | | 1 | | -10 | | 35 | | 55 | | 15 | | 15 | | 10 | | 6 | | 12 | | 2 | |
(D) | | 2 | | -10 | | 35 | | 55 | | 30 | | 30 | | 20 | | 6 | | 12 | | 2 | |
| | 3 | | -10 | | 35 | | 55 | | 60 | | 60 | | 30 | | 6 | | 12 | | 2 | |
| | 4 | | -10 | | 35 | | 55 | | 90 | | 90 | | 60 | | 4 | | 12 | | 2 | |
| | | | | | | | | | | | | | | | | | | | | |
S1 and S2 | | 1 | | 10 | | -65 | | 35 | | 15 | | 15 | | 10 | | 6 | | 12 | | 2 | |
(S1S2) | | 2 | | 10 | | -65 | | 35 | | 30 | | 30 | | 20 | | 6 | | 12 | | 2 | |
| | 3 | | 10 | | -65 | | 35 | | 60 | | 60 | | 30 | | 6 | | 12 | | 2 | |
| | 4 | | 10 | | -65 | | 35 | | 90 | | 90 | | 60 | | 4 | | 12 | | 2 | |
Note: | Main Zone - includes MZ1A, MZ1B, MZ1C and MZ2 |
| Vein Zone - includes V1, V2U, V2L, V3E, V3W, V3AU, V3AM, V3AL, V3BU and V3BL |
| FW above 525 - includes FW1U, FW1L, FW2, FW2A, FW2B, FW2C, FW3 |
| UM Zone - includes UM1, UM1A, UM2B, UM2C, UM2UE, UM2W, UM3, UM5, UM5B, UM6, UM7, UM8, UM9 |
| FW Zone - includes FW_1E, FW_2, FW_2A, FW_2B, FW_4, FW_5, FW_6 |
| D Zone - includes D1FW, D1HW, D2, D2A, and D3 |
110
TABLE 14.10: THUNDER CREEK SEARCH ELLIPSE PARAMETERS
| | | | Search Ellipse | | Search Ellipse Range | | | |
| | | | Orientation (ZXZ) | | Orientation (ZXZ) | | Number of Samples | |
Ellipse | | Pass | | z | | x | | z | | x | | y | | z | | min | | max | | Max/hole | |
| | | | | | | | | | | | | | | | | | | | | |
UTC | | 1 | | 40 -61 | | | | 0 | | 15 | | 15 | | 8 | | 9 | | 15 | | 3 | |
| | 2 | | 40 -61 | | | | 0 | | 30 | | 30 | | 20 | | 9 | | 15 | | 3 | |
| | 3 | | 40 -61` | | | | 0 | | 60 | | 60 | | 45 | | 9 | | 15 | | 3 | |
| | | | | | | | | | | | | | | | | | | | | |
Porphyry | | 1 | | 40 -61 | | | | 0 | | 15 | | 15 | | 8 | | 9 | | 15 | | 3 | |
| | 2 | | 40 -61 | | | | 0 | | 30 | | 30 | | 20 | | 9 | | 15 | | 3 | |
| | 3 | | 40 -61 | | | | 0 | | 60 | | 60 | | 45 | | 9 | | 15 | | 3 | |
| | | | | | | | | | | | | | | | | | | | | |
Rusk | | 1 | | 40 -61 | | | | 0 | | 15 | | 15 | | 8 | | 9 | | 15 | | 3 | |
| | 2 | | 40 -61 | | | | 0 | | 30 | | 30 | | 20 | | 9 | | 15 | | 3 | |
| | 3 | | 40 -61 | | | | 0 | | 60 | | 60 | | 45 | | 9 | | 15 | | 3 | |
| | 4 | | 40 -61 | | | | 0 | | 90 | | 90 | | 70 | | 6 | | 15 | | 3 | |
Note: · UTC is used for zones UTC_1, UTC_2, UTC_3, UTC_4, UTC_5, UTC_6, UTC_7, UTC_8
· Porphyry is used for zones POR, POR_1, POR_2, POR_3,POR_4. POR_5, POR_6
· Rusk is used for zones RUSK, RUSK_U, RUSK_L, RUSK_HW
14.6 BLOCK MODEL VALIDATION
Several steps were taken in order to review and validate the current block model and reported results which included: comparison of solid model and block model volumes, comparison of the block model against diamond drill results, checking with nearest neighbor estimates, and comparison with recent production data. A review was also carried out by SGS Canada to confirm new estimation as well as to help understand reasons for recent changes to the resource.
Volumes of the individual solids were compared to volumes of from the block model for the same domain to ensure proper coding of the model. No significant variances were encountered.
Plans and sections were cut through the block model and Resource solids to view overall trends and patterns as well as compare block grades and grade distribution to the drill hole data. Results of the review indicate a pattern for block grades which is consistent with drill hole assays, but more patchy than was evident in previous block models which were based on wider spaced drilling.
Plan views and sections showing block grade distribution and the original diamond drill data for both deposits are shown in Figure 14.6 through Figure 14.9.
111
FIGURE 14.6: TIMMINS MINE SECTION 4575 EAST — BLOCK MODEL AND DRILL HOLES
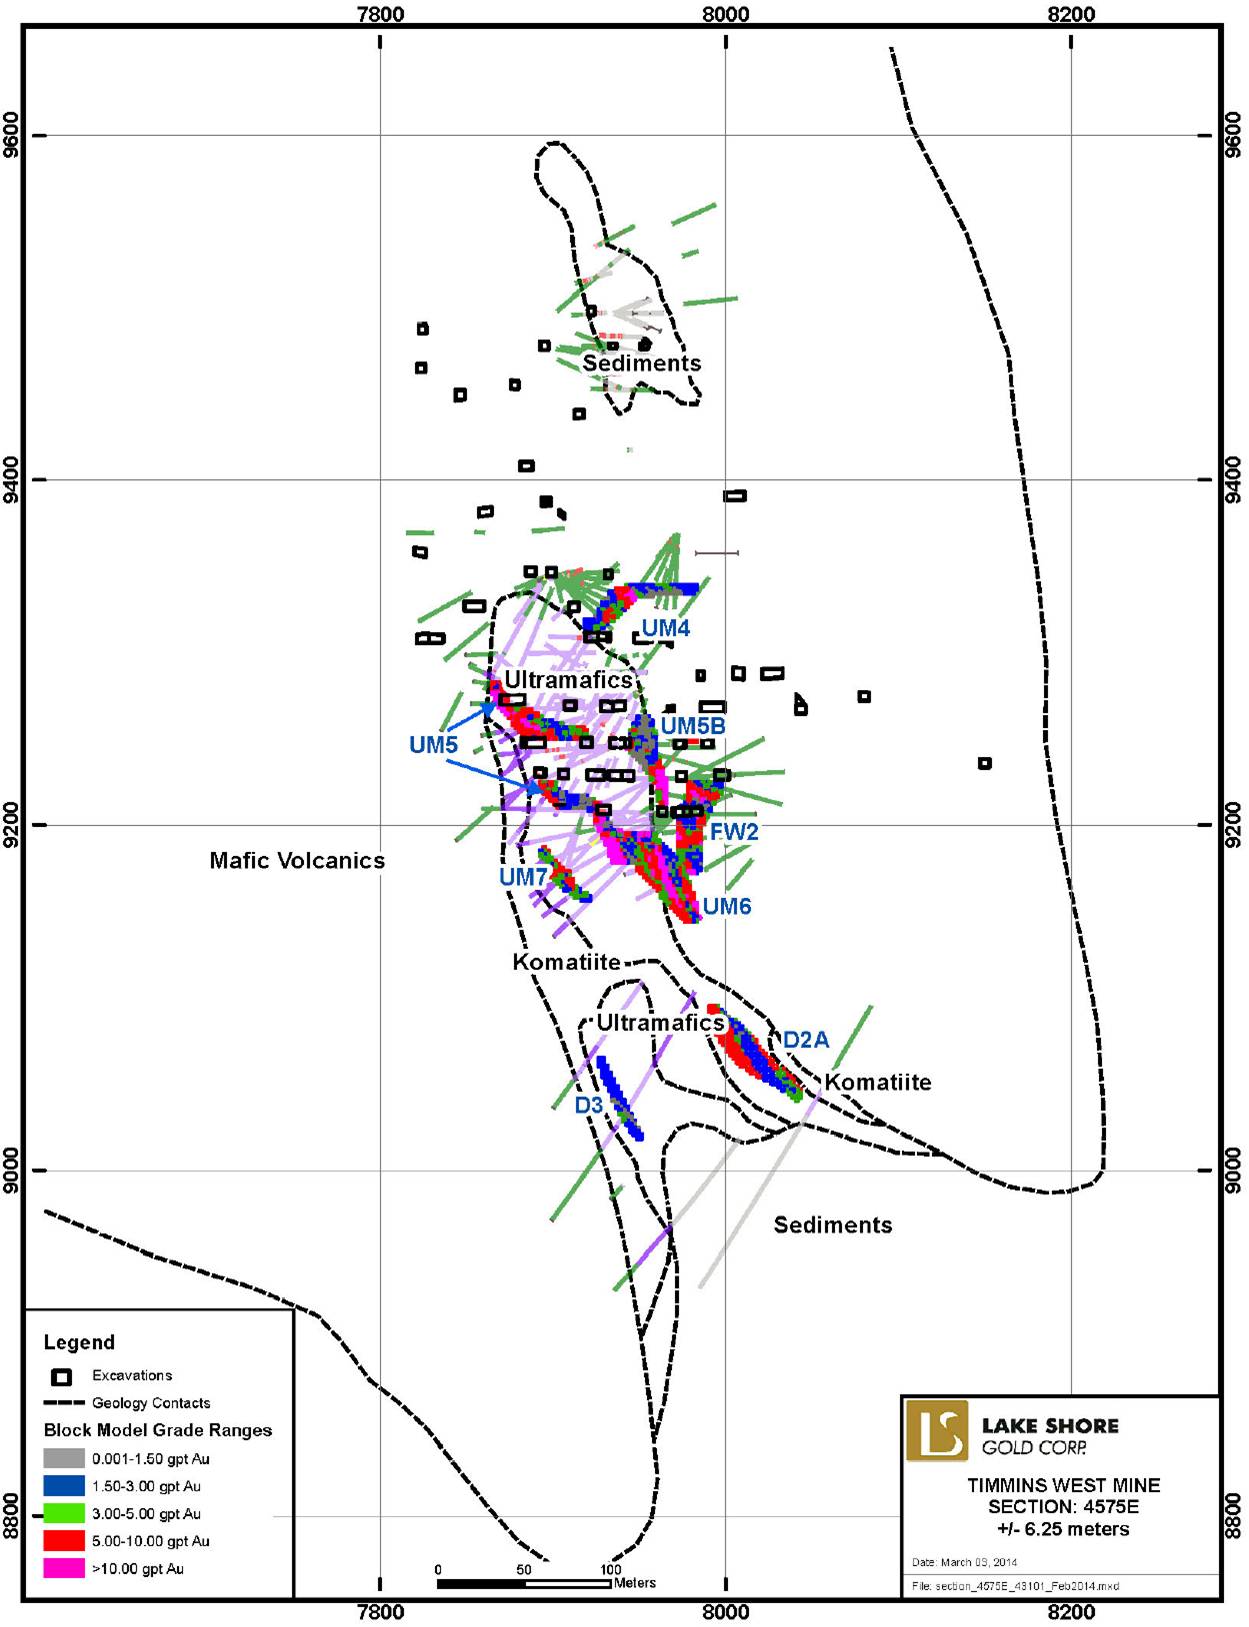
112
FIGURE 14.7: TIMMINS MINE PLAN FOR 790 LEVEL — BLOCK MODEL AND DRILL HOLES
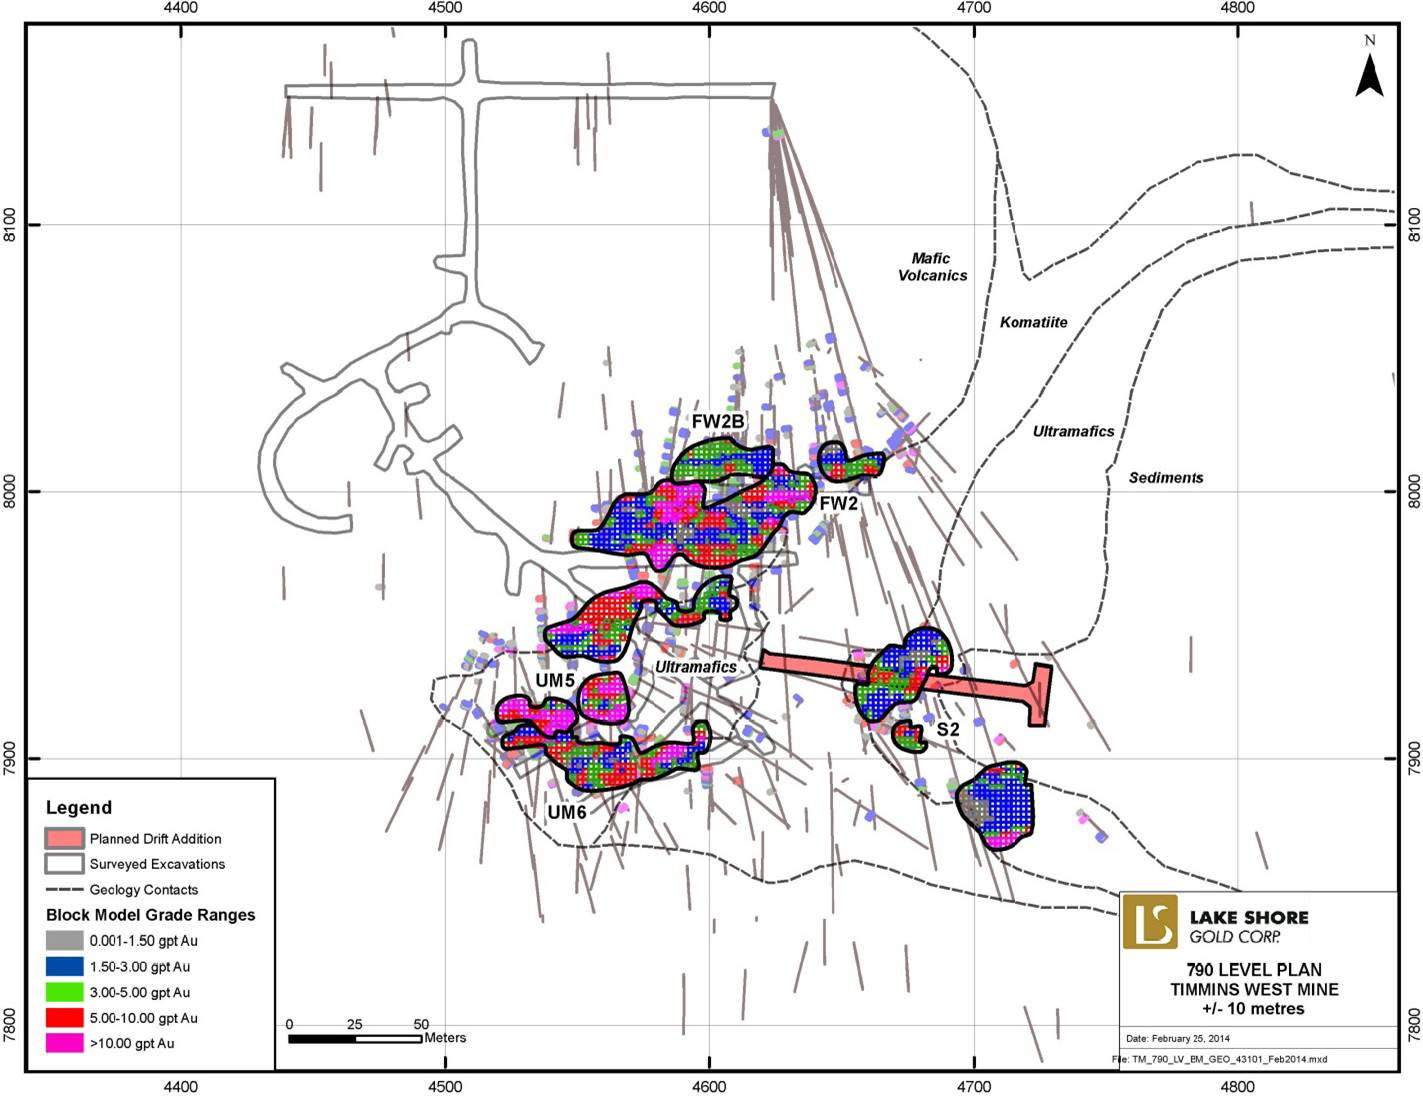
113
FIGURE 14.8: THUNDER CREEK DEPOSIT — SECTION 9550N — BLOCK MODEL AND DIAMOND DRILL HOLES
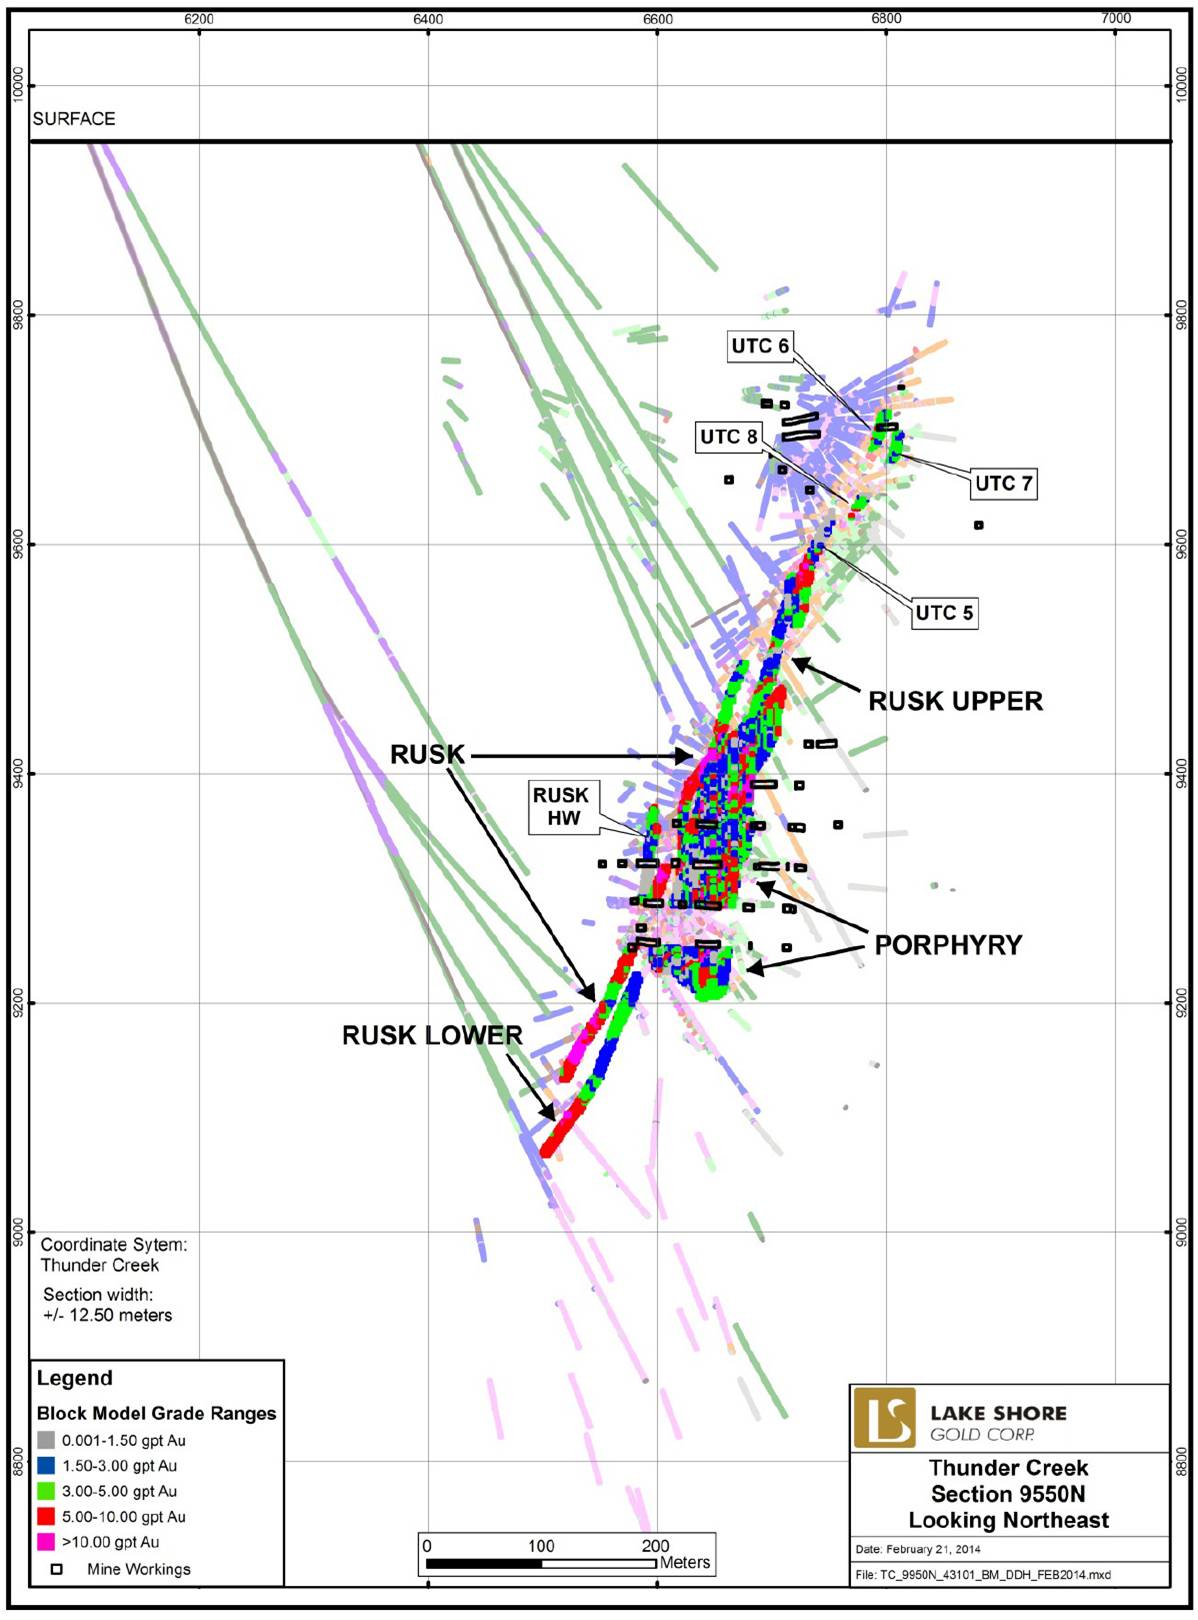
114
FIGURE 14.9: THUNDER CREEK DEPOSIT— PLAN VIEW AT 730 LEVEL-BLOCK MODEL AND DIAMOND DRILL HOLES
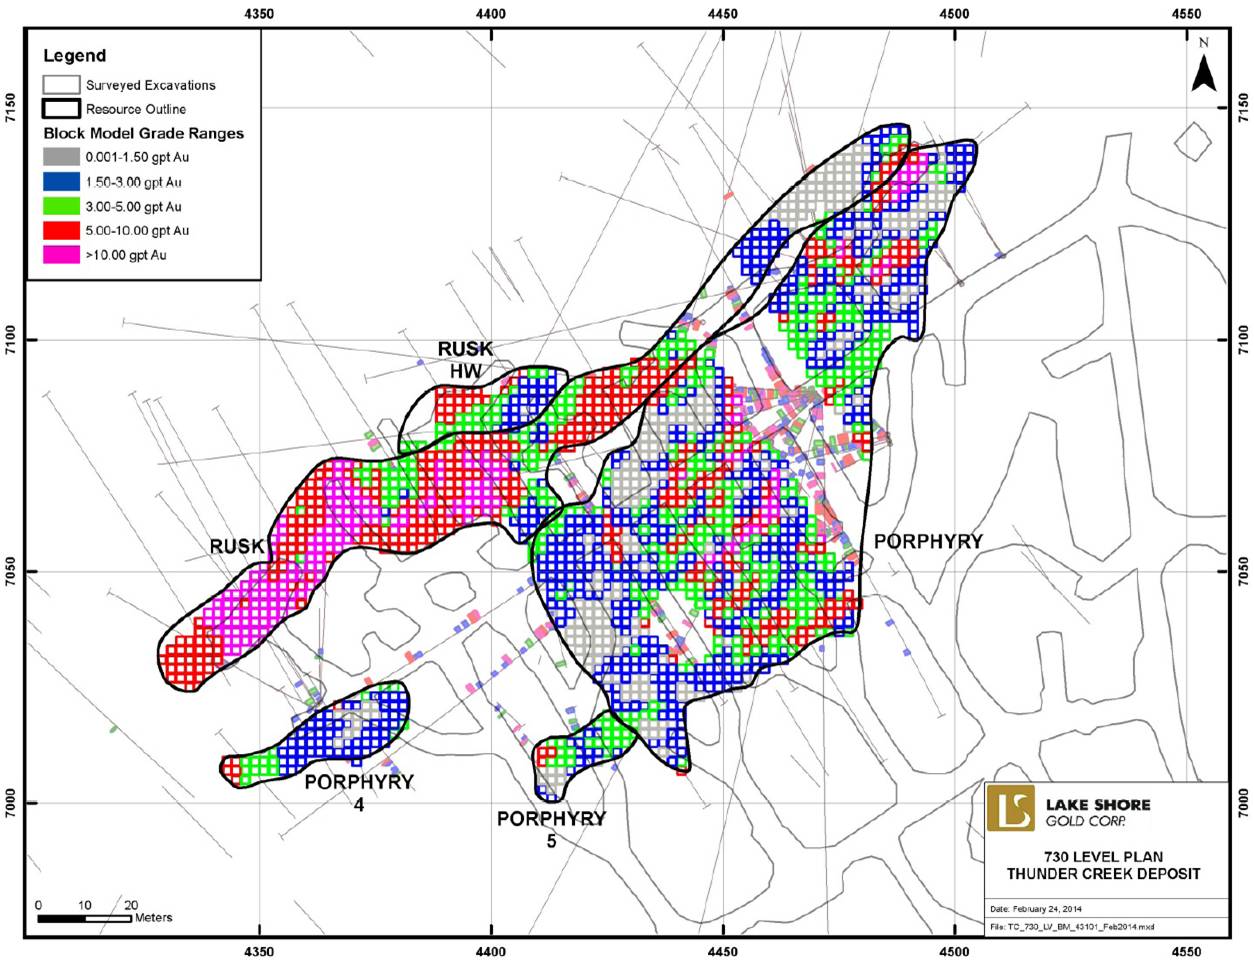
The checking with nearest neighbour estimates was completed using the same search ellipse as the ID² interpolation and indicates close correlation for the Indicated category at both deposits and lower correlation for the Inferred category (see Table 14.11). The lower correlation for the Inferred category is likely due to local effects stemming from wider spaced diamond drilling.
TABLE 14.11: COMPARISON OF ID2 AND NEAREST NEIGHBOUR INTERPOLATION
Resource Category | | ID2 (g/t Au) | | NN (g/t Au) | | Difference (g/t) | | Difference (%) | |
Timmins Deposit | | | | | | | | | |
Indicated | | 4.496 | | 4.562 | | -0.07 | | -1.4 | % |
Inferred | | 5.003 | | 4.744 | | 0.26 | | 5.5 | % |
Total | | 4.698 | | 4.635 | | 0.06 | | 1.4 | % |
Thunder Creek | | | | | | | | | |
Indicated | | 4.701 | | 4.855 | | -0.15 | | -3.2 | % |
Inferred | | 4.500 | | 6.284 | | -1.78 | | -28.4 | % |
Total | | 4.661 | | 5.141 | | -0.48 | | -9.3 | % |
115
Comparison of the results from block modeling with production grades from recently mined stopes indicates significant differences for individual stopes but with a reasonable overall comparison to mill reconciled figures. The presence of large differences on a stope scale is not unexpected and likely the result of several factors working together including complex zone geometries, sampling difficulties due to coarse gold and high variability for gold assays, uncertainties with tracking and assigning tonnage accurately back to individual stopes due to blending and milling ore from three sources in a common mill, uncertainties regarding final stope shapes, and quantities of rock extracted and uncertainties for mill grade and losses of gold to mill inventory during certain months surrounding the commissioning of the new mill. Efforts to address the above factors are being examined on an ongoing basis and some improvements have been noted in recent work.
The variability of gold grades for the zones being mined is illustrated in Figure 14.10 which plots the monthly correction factor for mine production sampling vs. corrected mill head grades. As indicated, typical corrections range between ±5% with the overall average being about -4 percent. There are some slightly larger corrections in August and September but these are believed to stem from the startup of the new mill circuit, and if these were excluded the average correction is reduced to -2% and improving with time. It should also be noted that approximately 8,000 ounces of gold was accumulated in the newly commissioned mill circuit from stopes mined in the last five months of 2013. Factoring this ounce accumulation back into the adjustments would make the adjustment factor be even more favorable.
FIGURE 14.10: MILL CORRECTION FOR GRADES FROM MINE PRODUCTION SAMPLING
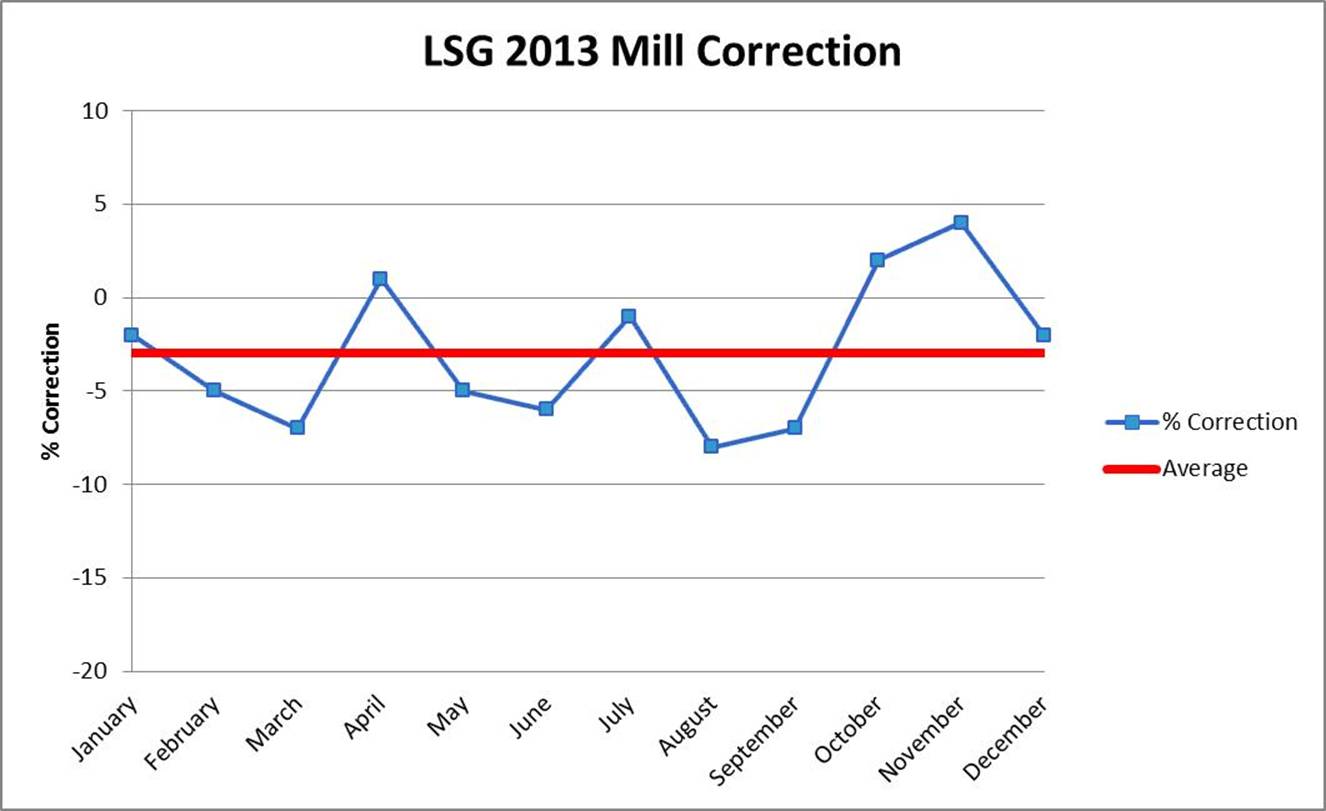
The review by SGS Canada was conducted in order to verify certain aspects of the resource estimate for the Timmins West and Thunder Creek deposits as well assist in understanding recent changes to the resource.
116
Based on the review of the resource estimate, SGS states that “No significant errors were detected and the methodology used by LSG appears to follow industry guidelines. The use of normal kriging is recommended for future resource estimations to reduce the error of block grade, particularly on the local scale.”
To review the recent changes in resource, some comparisons of resource shapes were completed from the new estimate as well as the estimate completed by LSG in 2012. Based on the review, SGS noted that “as expected with the addition of significant delineation drilling, the shapes of the ore bodies have changed along with the distribution of grade”. The Inferred category is most strongly affected.
“The result of the refinement of structures for Thunder Creek has had a negative effect on the tonnage and ounces. LSG and SGS feel that the difference is in part due to 2012 Inferred Resources having a relatively high geological risk; additionally, somewhat stricter modelling guidelines in 2014 have caused losses (mining constraints are applied at the early stage). The second point should translate into a more efficient transition of resources to reserves.
Full details for the review by SGS are available in Appendix 2.
14.7 MINERAL RESOURCES AND CLASSIFICATION
14.7.1 General
Mineral Resources are reported for both the Timmins Deposit and the Thunder Creek Deposit. At the Timmins Deposit, resources are located between 4250E and 5100E (Timmins Deposit grid), a horizontal distance of 850 metres. Vertically, the zones have been defined from the 9,900 metre elevation (115 metres below surface) to 8,670 metre elevation (1,345 metres below surface).
At the Thunder Creek Deposit, resources are located between 9325N and 9675N (Thunder Creek grid), a horizontal distance of 350 metres. Vertically, the zones have been defined from 9,820 metre elevation (190 metres below surface) to 8,980 metre elevation (1,040 metres below surface).
14.7.2 Mineral Resources
Mineral resources at the Timmins Deposit and the Thunder Creek Deposit are reported after the removal of all underground development and mining from the block model as well as the removal of all non-mineable material including low grade and non-recoverable pillars.
The removal of mined out blocks and development was completed by flagging blocks within mining shapes provided by the engineering department and setting the density and grade of these blocks to zero. A similar process was completed for non-mineable blocks. The removal of non-mineable blocks is affected by economic considerations as determined by the engineering and geology group and can be reviewed should economic conditions improve.
Resources were classified based primarily on estimation run. Those areas deemed to form a continuous zone with blocks of largely Pass 1 and 2 (30 metre search) were clipped out of the Domain Solid to create a solid for flagging resource category. These blocks were re-classified in the block model as Indicated, while the remaining blocks within the domain were classified as Inferred. This process was completed in long view while also displaying the solid intersections (drill hole pierce points) to avoid including blocks between drill hole intersections which should effectively be considered Inferred.
117
The TWM Resource totals 4.36 Mt at 5.09 g/t Au, amounting to 714,633 ounces of gold in the Indicated category and 2.94Mt at 5.46 g/t Au amounting to 516,339 ounces of gold in the Inferred category. Subdivision of the resource into the Timmins Deposit and the Thunder Creek Deposit is tabulated in Table 14.12.
Images of the block models are illustrated in Figure 14.11 and Figure 14.12.
TABLE 14.12: TIMMINS WEST MINE RESOURCE ESTIMATES
Deposit | | Resource
Classification | | Tonnes | | Capped Grade
(g/t Au) | | Contained Gold
(ounces) | |
Timmins | | Indicated | | 1,893,497 | | 5.16 | | 314,153 | |
| | Inferred | | 2,075,079 | | 5.67 | | 378,516 | |
Thunder Creek | | Indicated | | 2,470,674 | | 5.02 | | 400,480 | |
| | Inferred | | 863,633 | | 5.02 | | 137,823 | |
Total Timmins West Mine | | Total Indicated | | 4,364,171 | | 5.09 | | 714,633 | |
| | Total Inferred | | 2,938,712 | | 5.46 | | 516,339 | |
(Prepared by Lake Shore Gold — Report Date February 21, 2014
Notes:
1. Sums may not add due to rounding.
2. CIM definitions were followed for classification of Mineral Resources.
3. Capped gold grades are used in estimating the Mineral Resource average grade.
4. A minimum mining width of 2 metres was used.
5. The estimate includes low grade material which is not in the current mine plan.
6. Mineral Resources are reported at a cut-off grade of 1.5 g/t and include internal dilution to maintain zone continuity.
7. Weighted average gold price of $1,150 per ounce (approximately US$1,100).
8. Metallurgical recoveries are assumed to average 96.5 percent.
118
FIGURE 14.11: 3D VIEW OF NEW GRADE BLOCK MODEL FOR THE TIMMINS DEPOSIT, LOOKING NORTHWEST
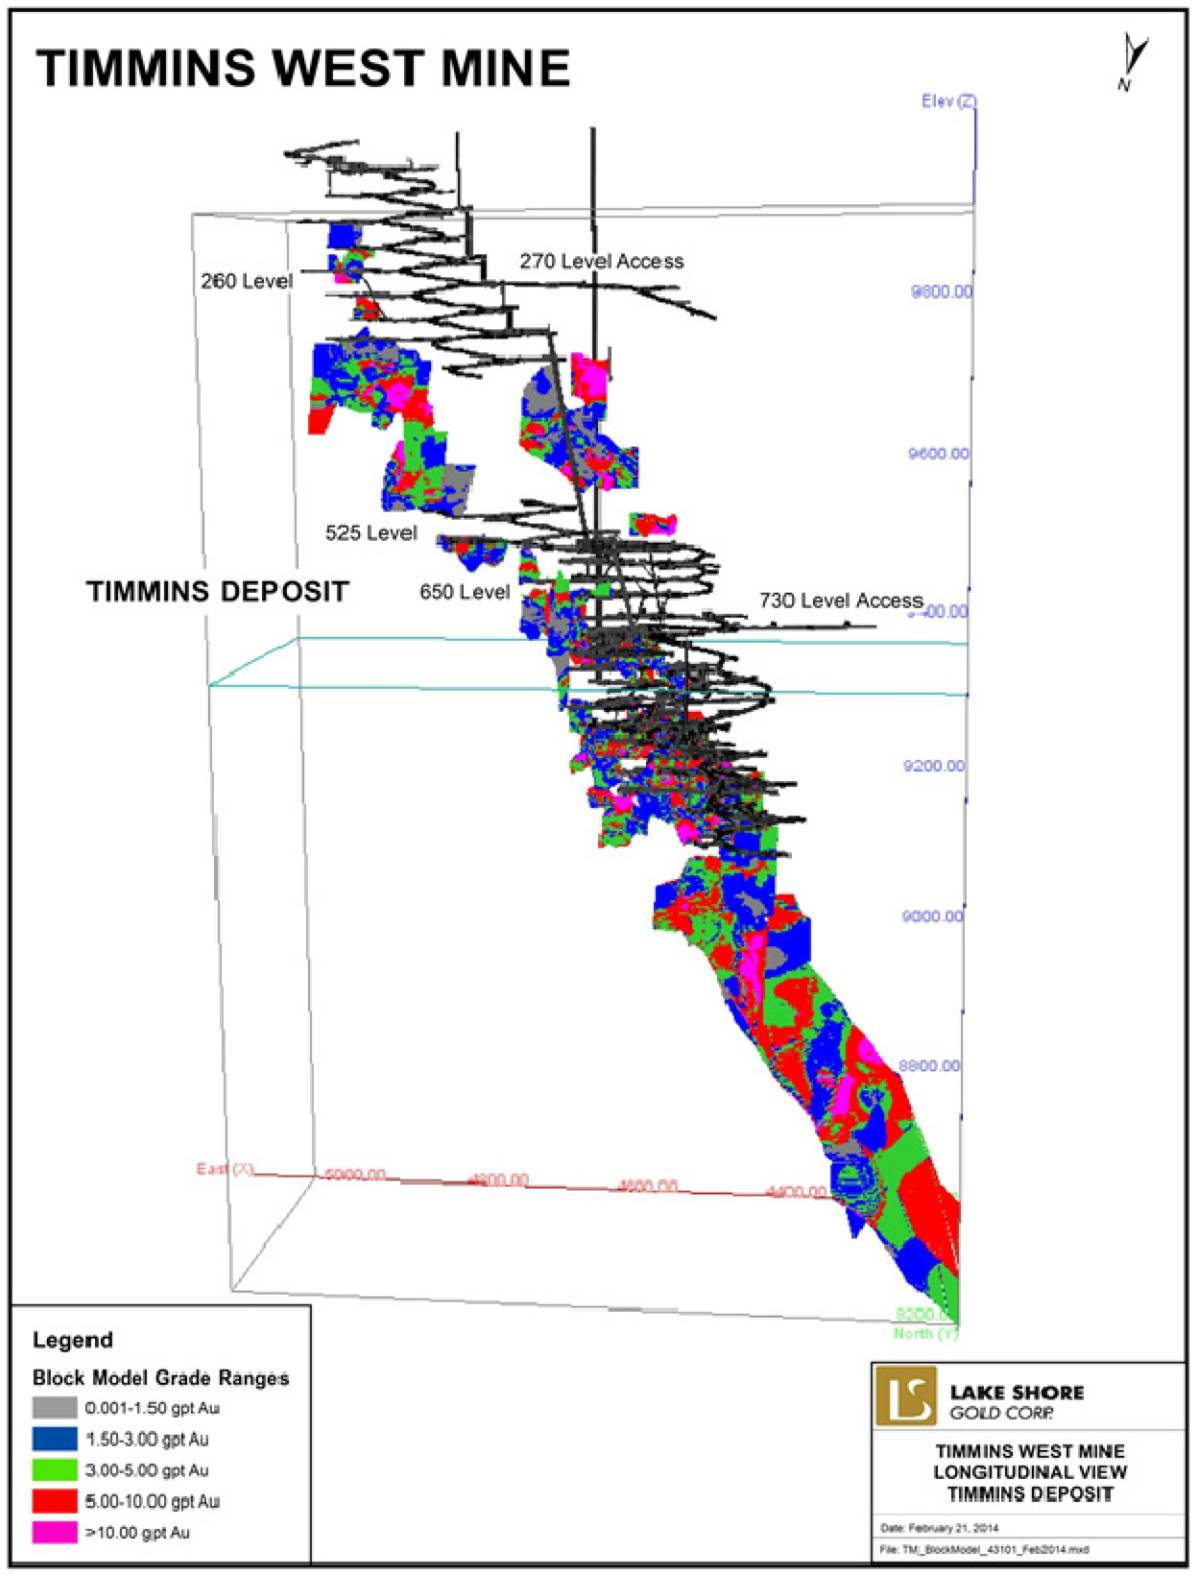
119
FIGURE 14.12: 3D VIEW OF NEW GRADE BLOCK MODEL FOR THE THUNDER CREEK DEPOSIT LOOKING NORTHWEST
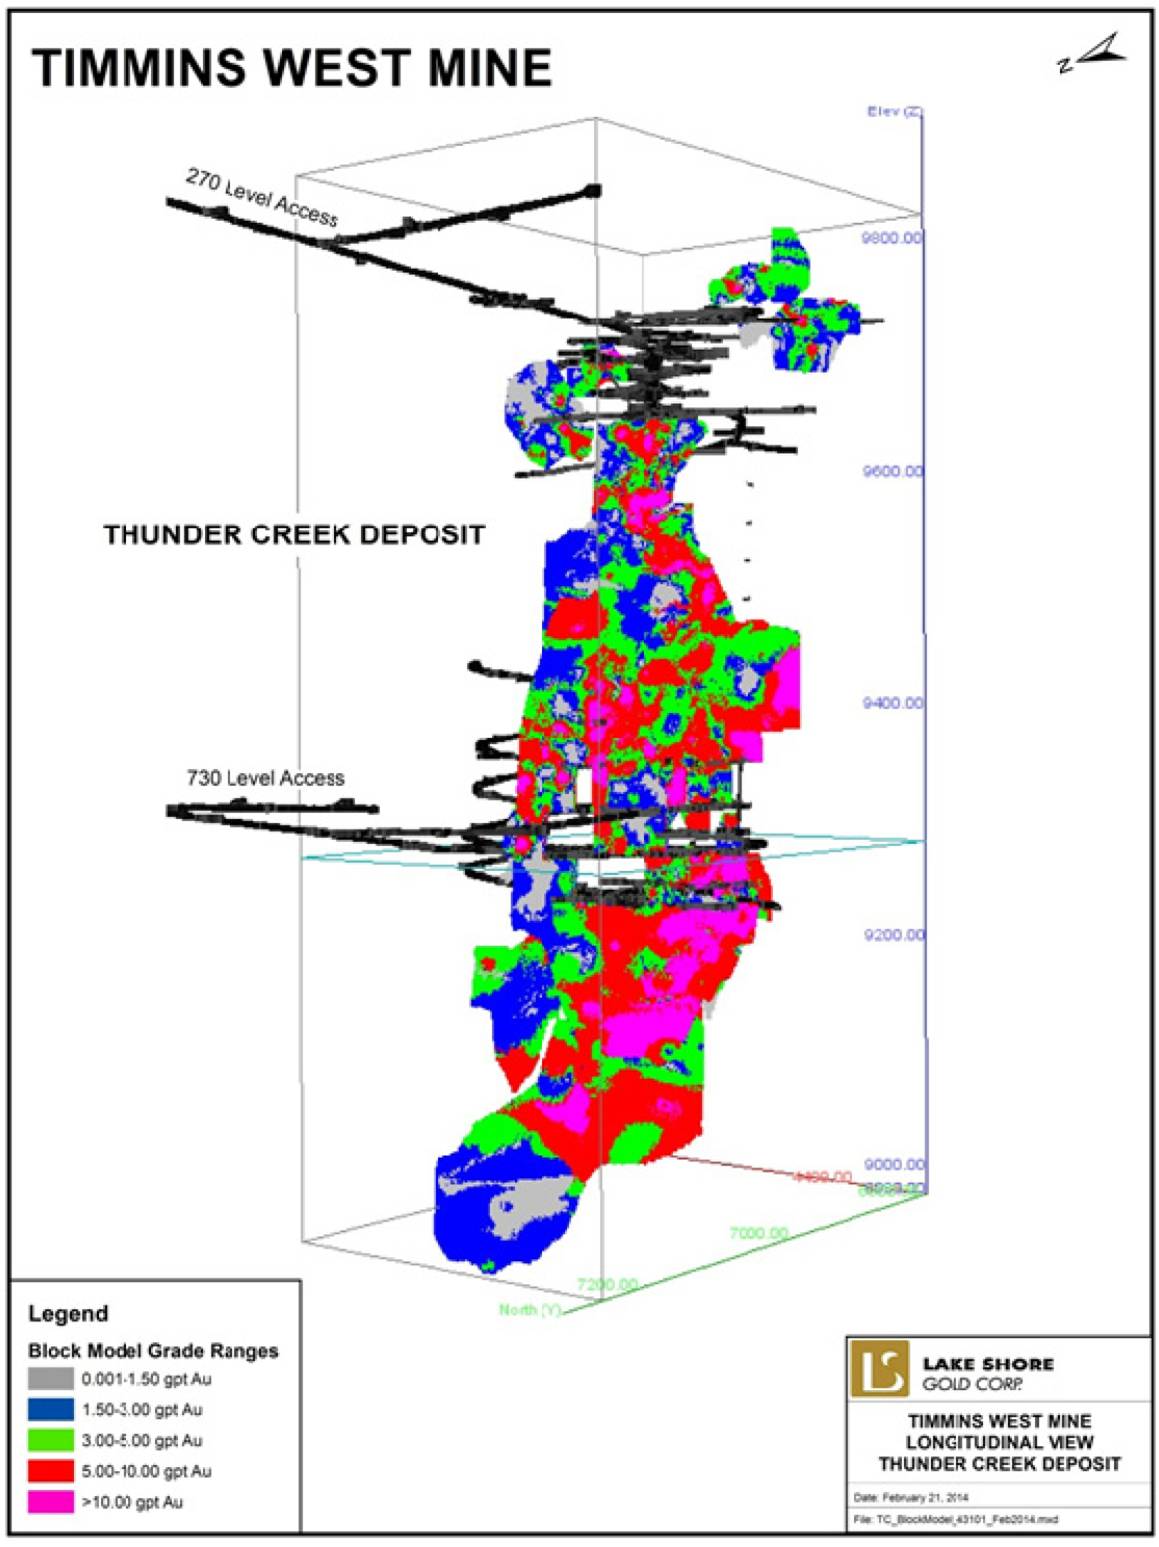
120
Sensitivities to cut-off were run at 0.50 g/t increments of gold grade from 0.00 g/t to 7.00 g/t and are summarized for unclassified Resources in Figure 14.13 and Figure 14.14. Both figures show unclassified tonnages and grades.
At the higher cut-offs, the zones become patchy and less continuous which implies a bulk mining approach could be the best method for ore extraction. The base case resource stated at a cut-off grade of 1.5 g/t, attempts to introduce some level of selectivity to the mining of the resource, yet maintain continuity of the zone. Recent work indicates that the sensitivity to cut off grade varies between zones.
FIGURE 14.13: TIMMINS DEPOSIT — GRADE TONNAGE CURVE
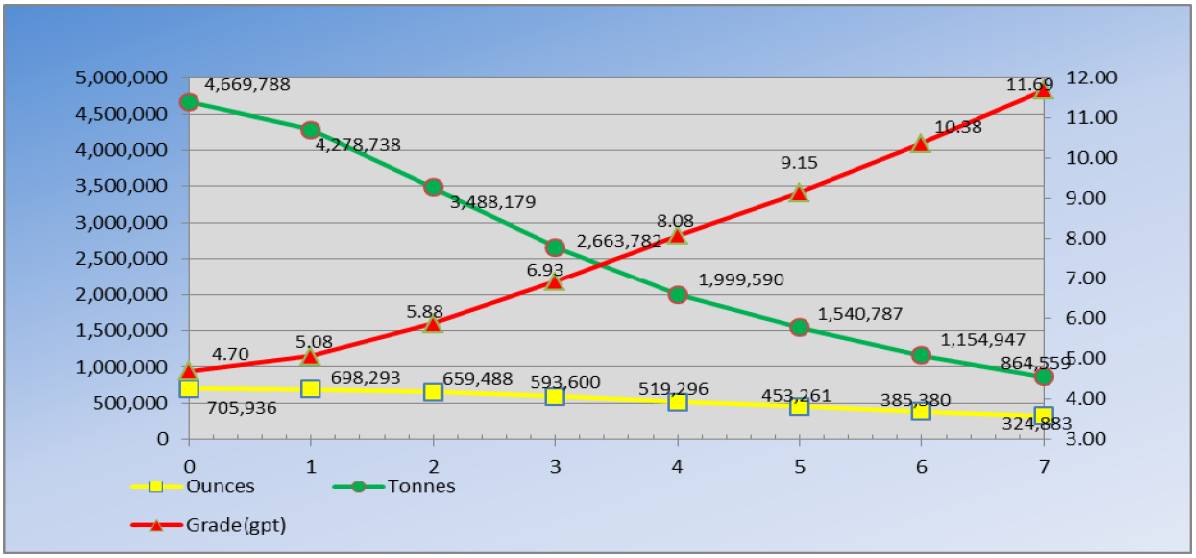
FIGURE 14.14: THUNDER CREEK — GRADE TONNAGE CURVE
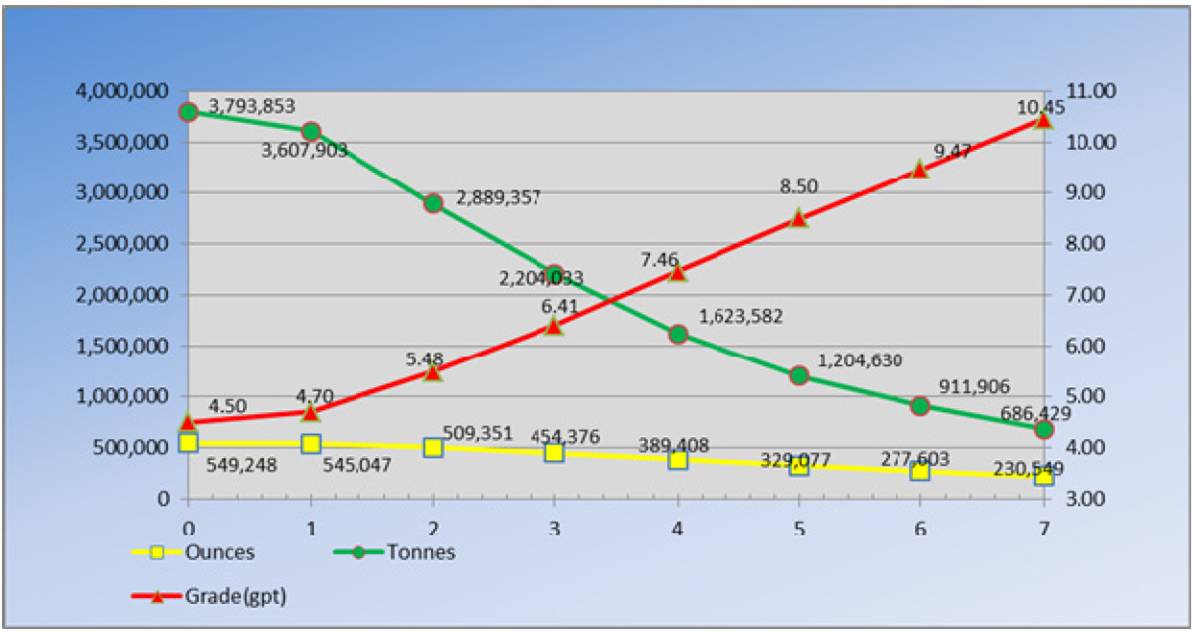
121
14.8 RECONCILIATION TO PREVIOUS RESOURCE TIMMINS DEPOSIT
Details for resources at TWM as estimated at the end of 2012 (reported March 2013) and from the new estimate are outlined below (Table 14.13).
TABLE 14.13: COMPARISON OF 2012 AND 2013 RESOURCE ESTIMATES
Deposit | | Category | | Tonnes | | Grade | | Ounces | | % Ounce | |
YE2012 Resource | | | | | | | | | | | |
Thunder Creek | | Indicated | | 3,216,000 | | 5.20 | | 535,100 | | | |
| | Inferred | | 1,752,000 | | 5.00 | | 281,200 | | | |
| | Total | | 4,968,000 | | 5.11 | | 816,300 | | | |
Timmins | | Indicated | | 2,762,451 | | 5.50 | | 525,752 | | | |
| | Inferred | | 1,797,218 | | 5.50 | | 333,462 | | | |
| | Total | | 4,559,669 | | 5.86 | | 859,214 | | | |
Total | | Indicated | | 5,978,451 | | 5.50 | | 1,060,852 | | | |
| | Inferred | | 3,549,218 | | 5.40 | | 614,662 | | | |
| | Total | | 9,527,669 | | 5.47 | | 1,675,514 | | | |
YE 2013 Resource | | | | | | | | | | | |
Thunder Creek | | Indicated | | 2,470,674 | | 5.04 | | 400,480 | | | |
| | Inferred | | 863,633 | | 4.96 | | 137,823 | | | |
| | Total | | 3,334,307 | | 5.02 | | 538,303 | | | |
Timmins | | Indicated | | 1,893,497 | | 5.16 | | 314,153 | | | |
| | Inferred | | 2,075,079 | | 5.67 | | 378,516 | | | |
| | Total | | 3,968,576 | | 5.43 | | 692,669 | | | |
Total | | Indicated | | 4,364,171 | | 5.09 | | 714,633 | | | |
| | Inferred | | 2,938,712 | | 5.46 | | 516,339 | | | |
| | Total | | 7,302,883 | | 5.24 | | 1,230,972 | | | |
Variance | | | | | | | | | | | |
Thunder Creek | | Indicated | | -745,326 | | -0.16 | | -134,620 | | -25 | % |
| | Inferred | | -888,367 | | -0.04 | | -143,377 | | -51 | % |
| | Total | | -1,633,693 | | -0.09 | | -277,997 | | -34 | % |
Timmins | | Indicated | | -868,954 | | -0.34 | | -211,599 | | -40 | % |
| | Inferred | | 277,861 | | 0.17 | | 45,054 | | 14 | % |
| | Total | | -591,093 | | -0.43 | | -166,545 | | -19 | % |
Total | | Indicated | | -1,614,280 | | -0.41 | | -346,219 | | -33 | % |
| | Inferred | | -610,506 | | 0.06 | | -98,323 | | -16 | % |
| | Total | | -2,224,786 | | -0.23 | | -444,542 | | -27 | % |
Based on data in the table, there has been a significant decrease in resource ounces between the two estimates including 346,200 to the Indicated category, 98,300 ounces to Inferred, and 444,500 on a combined basis.
Approximately 140,000 ounces (32%) of the total decrease in resource ounces is attributed to mining depletion with almost all being from the Indicated category. Fifty-five percent of total depletion is from the Thunder Creek Deposit and the remainder from the Timmins Deposit.
122
Approximately 180,500 ounces (40%) of the total decrease in resource ounces and 85,000 ounces (25%) of the decrease to the Indicated resource is attributed to lower grades, lower grade continuity, and refinements to resource models for certain zones based on new drilling. The key zones affected by these changes are the Rusk Zone and the Porphyry Zone at Thunder Creek. The Rusk Zone was affected due to local narrowing and the Porphyry Zone was affected by the local interfingering of mineralization with barren volcanic units. Slight affects to grade were also noted at the Timmins Deposit due to interfingering of some ultramafic with barren komatiite units.
Figure 14.15 and Figure 14.16 compare the grade block models from 2012 and the new estimate and illustrate changes to grades, grade distribution, and overall resource shapes for Timmins and Thunder Creek Deposits after incorporation of new diamond drilling.
FIGURE 14.15: LONG SECTION VIEW LOOKING NORTHWARDS COMPARING 2012 AND 2013 BLOCK MODELS FOR THE 790 FOOTWALL ZONE AT THE TIMMINS DEPOSIT
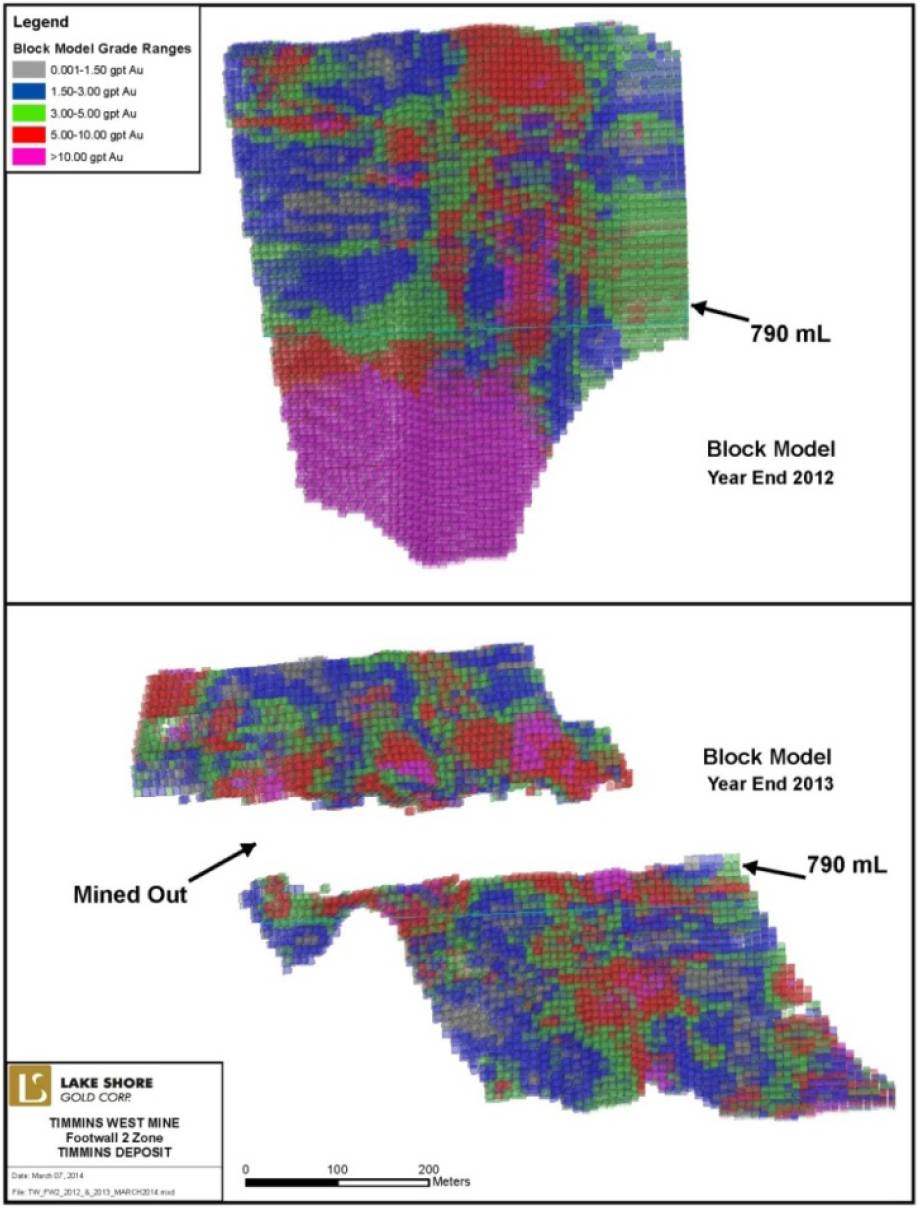
123
FIGURE 14.16: COMPARISON OF 2012 AND 2013 BLOCK MODELS FOR THE THUNDER CREEK DEPOSIT ON 730 LEVEL
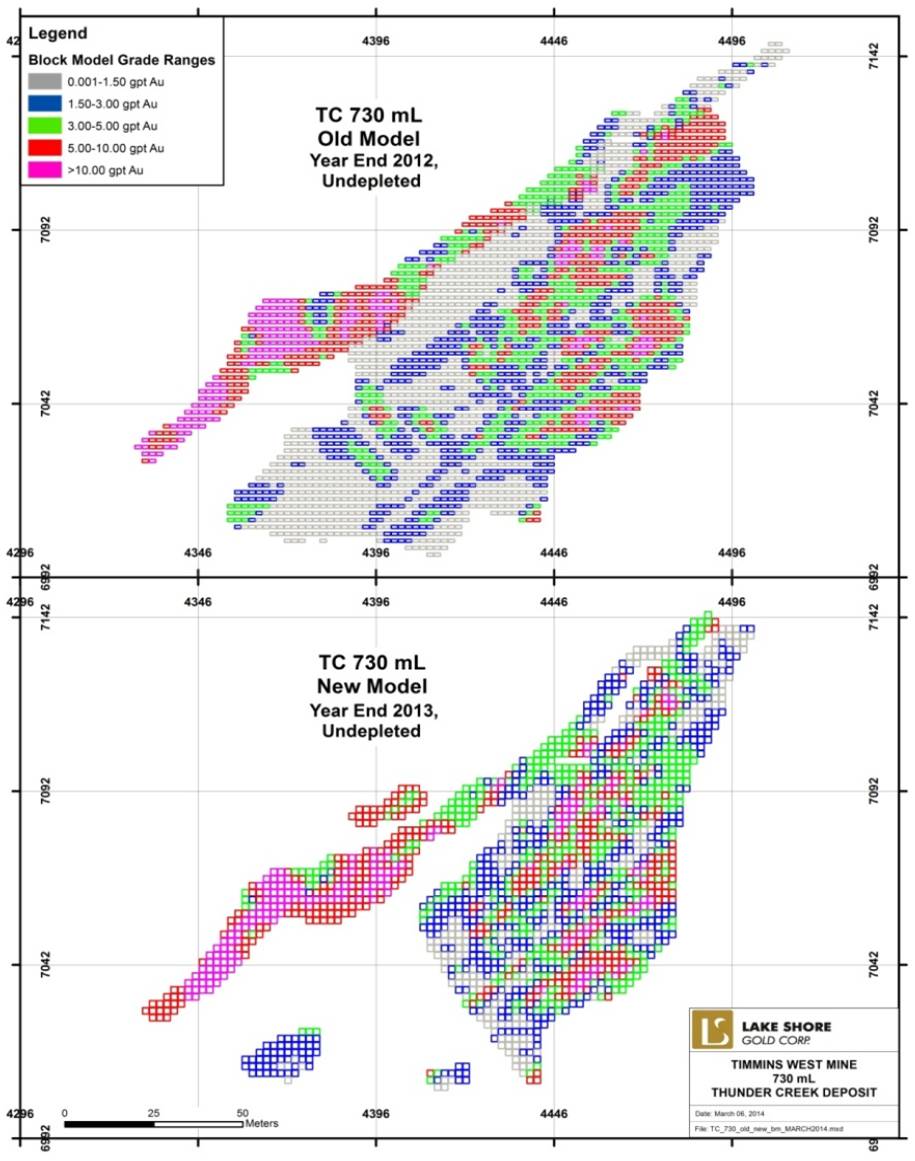
Approximately 120,000 ounces (28%) of the total decrease to resource ounces is attributed to the removal of material found to be unmineable for a variety of reasons incuding; poor economics, difficult access, problems defining mining shapes, and low grades. Most material removed is from the indicated category. The reported loss is considered higher than normal for the current update due to the use of cut-off grades above the base case of 1.5 g/t for some recently mined zones. Although continued mining at cut-off grades above 1.5 g/t could result in further losses of resources (reserves use a 3 g/t cut-off grade), the Company is evaluating ways to optimize stope designs and lower cut-off grades in some areas to minimize losses going forward.
Additional details regarding resources by zone and by level for the new estimate as well as comparison to the latest previous estimate in March 2012 are shown in Table 14.14 to Table 14.17. Stockpile
124
tonnages and grades are not included in these totals. Slight variances in sums may exist due to rounding error.
TABLE 14.14: THUNDER CREEK RESOURCES FROM 2012 AND 2013, LISTED BY ZONE
Year End 2013 Thunder Creek Fully Depleted Model at 1.5 GPT Cut-off By Zone
Level | | Grade Group | | Tonnage | | Au Cut | | Ounces | |
| | | | (tonnes) | | (gpt) | | (oz) | |
| | Indicated | | 867,576 | | 6.339 | | 176,812.0 | |
Rusk | | Inferred | | 245,335 | | 5.996 | | 47,295.0 | |
| | Total | | 1,112,911 | | 6.263 | | 224,107 | |
| | | | | | | | | |
| | Indicated | | 1,568,693 | | 4.318 | | 217,752.0 | |
Porphyry | | Inferred | | 618,297 | | 4.554 | | 90,528.0 | |
| | Total | | 2,186,990 | | 4.384 | | 308,280 | |
Year End 2012 Thunder Creek Fully Depleted Model at 1.5 GPT Cut-off By Zone
Level | | Grade Group | | Tonnage | | Au Cut | | Ounces | |
| | | | (tonnes) | | (gpt) | | (oz) | |
| | Indicated | | 1,357,222 | | 6.033 | | 263,262 | |
Rusk | | Inferred | | 592,929 | | 6.134 | | 116,926 | |
| | Total | | 1,950,151 | | 6.064 | | 380,188 | |
| | | | | | | | | |
| | Indicated | | 1,814,171 | | 4.521 | | 263,722 | |
Porphyry | | Inferred | | 1,151,261 | | 4.425 | | 163,770 | |
| | Total | | 2,965,432 | | 4.484 | | 427,492 | |
TABLE 14.15: TIMMINS MINE RESOURCES FROM 2012 AND 2013, LISTED BY ZONE
Year End 2013 Timmins Mine Fully Depleted Model at 1.5 GPT Cut-off By Zone
Level | | Grade Group | | Tonnage | | Au Cut | | Ounces | |
| | | | (tonnes) | | (gpt) | | (oz) | |
| | Indicated | | 278,048 | | 4.730 | | 42,283.0 | |
Vein | | Inferred | | 95,851 | | 5.437 | | 16,755.0 | |
| | Total | | 373,899 | | 4.911 | | 59,038 | |
| | | | | | | | | |
| | Indicated | | 724,185 | | 4.456 | | 103,757.0 | |
Footwall | | Inferred | | 152,764 | | 3.770 | | 18,518.0 | |
| | Total | | 876,949 | | 4.337 | | 122,275 | |
| | | | | | | | | |
| | Indicated | | 836,052 | | 5.910 | | 158,867.0 | |
Ultramafic | | Inferred | | 1,826,464 | | 5.845 | | 343,243.0 | |
| | Total | | 2,662,516 | | 5.866 | | 502,110 | |
Year End 2012 Timmins Mine Fully Depleted Model at 1.5 GPT Cut-off By Zone
Level | | Grade Group | | Tonnage | | Au Cut | | Ounces | |
| | | | (tonnes) | | (gpt) | | (oz) | |
| | Indicated | | 411,216 | | 5.263 | | 69,580 | |
Vein | | Inferred | | 41,269 | | 6.336 | | 8,407 | |
| | Total | | 452,485 | | 5.361 | | 77,987 | |
| | | | | | | | | |
| | Indicated | | 733,313 | | 4.768 | | 112,417 | |
Footwall | | Inferred | | 392,511 | | 3.639 | | 45,919 | |
| | Total | | 1,125,824 | | 4.374 | | 158,336 | |
| | | | | | | | | |
| | Indicated | | 1,636,581 | | 6.608 | | 347,710 | |
Ultramafic | | Inferred | | 1,358,611 | | 6.338 | | 276,849 | |
| | Total | | 2,995,192 | | 6.486 | | 624,559 | |
TABLE 14.16: THUNDER CREEK RESOURCES FROM 2012 AND 2013, LISTED BY LEVEL
Year End 2013 Thunder Creek Fully Depleted
Level | | Grade Group | | Tonnage | | Au Cut | | Ounces | |
| | | | (tonnes) | | (gpt) | | (oz) | |
| | Indicated | | 311 | | 3.639 | | 36.3 | |
130mL | | Inferred | | 13,638 | | 3.128 | | 1,371.6 | |
| | Total | | 13,948 | | 3.140 | | 1,407.9 | |
| | | | | | | | | |
| | Indicated | | 165,319 | | 4.461 | | 23,711.8 | |
330mL | | Inferred | | 49,693 | | 3.043 | | 4,861.9 | |
| | Total | | 215,013 | | 4.133 | | 28,573.7 | |
| | | | | | | | | |
| | Indicated | | 862,343 | | 4.862 | | 134,786.2 | |
530mL | | Inferred | | 209,819 | | 5.746 | | 38,758.8 | |
| | Total | | 1,072,162 | | 5.035 | | 173,545.0 | |
| | | | | | | | | |
| | Indicated | | 1,377,597 | | 5.157 | | 228,392.5 | |
730mL | | Inferred | | 203,314 | | 4.724 | | 30,876.5 | |
| | Total | | 1,580,910 | | 5.101 | | 259,269.0 | |
| | | | | | | | | |
| | Indicated | | 30,699 | | 7.738 | | 7,637.1 | |
930mL | | Inferred | | 386,879 | | 4.979 | | 61,926.3 | |
| | Total | | 417,579 | | 5.181 | | 69,563.4 | |
Year End 2013 Thunder Creek Fully Depleted
Level | | Grade Group | | Tonnage | | Au Cut | | Ounces | |
| | | | (tonnes) | | (gpt) | | (oz) | |
| | Indicated | | 33,730 | | 4.368 | | 4,737.0 | |
130mL | | | | | | | | | |
| | Total | | 33,730 | | 4.368 | | 4,737.0 | |
| | | | | | | | | |
| | Indicated | | 192,425 | | 4.112 | | 25,436.6 | |
330mL | | Inferred | | 172,032 | | 3.808 | | 21,060.5 | |
| | Total | | 364,457 | | 3.968 | | 46,497.0 | |
| | | | | | | | | |
| | Indicated | | 916,249 | | 4.378 | | 128,961.6 | |
530mL | | Inferred | | 384,887 | | 5.741 | | 71,041.5 | |
| | Total | | 1,301,136 | | 4.781 | | 200,003.1 | |
| | | | | | | | | |
| | Indicated | | 2,052,425 | | 5.596 | | 369,235.2 | |
730mL | | Inferred | | 622,866 | | 4.228 | | 84,660.0 | |
| | Total | | 2,675,291 | | 5.277 | | 453,895.2 | |
| | | | | | | | | |
| | Indicated | | 10,294 | | 10.124 | | 3,350.6 | |
930mL | | Inferred | | 530,676 | | 5.814 | | 99,197.1 | |
| | Total | | 540,970 | | 5.896 | | 102,547.7 | |
125
TABLE 14.17: TIMMINS MINE RESOURCES FROM 2012 AND 2013, LISTED BY LEVEL
Year End 2013 Timmins Mine Fully Depleted
Level | | Grade Group | | Tonnage | | Au Cut | | Ounces | |
| | | | (tonnes) | | (gpt) | | (oz) | |
50mL | | Indicated Total | | 9,731 9,731 | | 1.904 1.904 | | 595.7 595.7 | |
| | | | | | | | | |
250mL | | Indicated Inferred Total | | 201,041 60,749 261,791 | | 4.675 4.528 4.641 | | 30,217.2 8,843.2 39,060.4 | |
| | | | | | | | | |
450mL | | Indicated Inferred Total | | 297,189 61,232 358,421 | | 4.456 5.465 4.629 | | 42,579.6 10,759.5 53,339.1 | |
| | | | | | | | | |
650mL | | Indicated Total | | 336,366 336,366 | | 4.665 4.665 | | 50,447.3 50,447.3 | |
| | | | | | | | | |
850mL | | Indicated Inferred Total | | 897,613 243,922 1,141,535 | | 5.909 5.229 5.764 | | 170,528.1 41,007.1 211,535.3 | |
| | | | | | | | | |
1050mL | | Indicated Inferred Total | | 96,346 843,592 939,938 | | 3.402 6.164 5.881 | | 10,539.2 167,194.0 177,733.2 | |
| | | | | | | | | |
1250mL | | Indicated Total | | 820,316 820,316 | | 5.468 5.468 | | 144,224.0 144,224.0 | |
| | | | | | | | | |
1450mL | | Indicated Total | | 45,268 45,268 | | 4.458 4.458 | | 6,487.9 6,487.9 | |
Year End 2012 Timmins Mine Fully Depleted Model
Level | | Grade Group | | Tonnage | | Au Cut | | Ounces | |
| | | | (tonnes) | | (gpt) | | (oz) | |
50mL | | Indicated Total | | 23,527 23,527 | | 3.046 3.046 | | 2,304.3 2,304.3 | |
| | | | | | | | | |
250mL | | Indicated Inferred Total | | 315,493 23,437 338,931 | | 4.843 7.477 5.026 | | 49,128.9 5,634.3 54,763.2 | |
| | | | | | | | | |
450mL | | Indicated Inferred Total | | 407,571 17,831 425,402 | | 4.755 4.837 4.758 | | 62,305.2 2,773.0 65,078.2 | |
| | | | | | | | | |
650mL | | Indicated Total | | 716,766 716,766 | | 4.989 4.989 | | 114,960.2 114,960.2 | |
| | | | | | | | | |
850mL | | Indicated Inferred Total | | 824,854 437,704 1,262,557 | | 6.867 6.276 6.662 | | 182,112.9 88,323.1 270,436.0 | |
| | | | | | | | | |
1050mL | | Indicated Inferred Total | | 334,766 664,812 999,578 | | 5.912 6.884 6.558 | | 63,634.3 147,133.6 210,768.0 | |
| | | | | | | | | |
1250mL | | Indicated Inferred Total | | 158,135 603,404 761,539 | | 10.869 4.166 5.558 | | 55,261.2 80,817.6 136,078.8 | |
| | | | | | | | | |
1450mL | | Indicated Total | | 45,202 45,202 | | 4.468 4.468 | | 6,493.8 6,493.8 | |
14.9 ADDITIONAL DRILL HOLE INFORMATION
Subsequent to the closing of the Timmins Deposit database on November 26, 2013 until the report date of February 21, 2014, assay results were received for 102 diamond drill holes (total length of 10,318.8 metres). Thirty-six of these were short length “bazooka” drill holes completed strictly for use in short term planning and optimizing stope shape. These drill holes were completed from the 730 metre level (nine holes for 283 metres), 750 metre level (nine holes for 226.6 metres) and 810 metre level (18 holes for 539.3 metres).
Ten drill holes totaling 2,227 metres were completed from the 790 metre level between 4625 east and 4700 east in the sediment fold area below known mineralization. This drilling does not impact the resource estimate.
Nine drill holes totaling 1,502 metre were completed from the 830 metre level targeting the down plunge extension of the S1 and S2 Zones. Scattered values were intersected in this area. Three of the drill holes transected the 25 metre gap between the UM5 and D2A Zone indicating mineralization may be continuous between these two zones.
Forty-seven drill holes totaling 5,540.9 metres were completed from the 850 metre level targeting the limit of the FW_4 and FW_5 Zones west of 4500 east, presently in the Inferred category. Scattered values were intersected in this area consistent with the weak nature of the western end of these zones. Results show dip of the FW_5 to be slightly steeper than modeled.
An additional 16 drill holes totaling 3,390 metres have been completed for which assay results are not yet returned or logging is still in progress.
126
Subsequent to the closing of the Thunder Creek Deposit database on January 8, 2014 until the report date of February 21, 2014, assay results were received for 25 diamond drill holes, (total length of 2,661.4 metres). These drill holes were collared from two drill set-ups on the 625 metre level, one centered on 4434 east and one on 4428 east. Drilling was of an infill nature into an Inferred portion on the western limit of the Rusk Zone above the 625 metre level between sections 200T7 and 204T7, a strike length of 37.5 metres. Drill hole intersections on sections 202T7 to 204T7 are consistent with the Rusk Zone as modeled in terms of location, width, and grade. Results on section 201T7 and 200T7 are of greater than anticipated width and show a slight offset of approximately 10 metres to the north. Results for an additional five drill holes collared from the 625 metre level totaling 513 metres are still pending. No significant effect on the new resource is expected from the above additional holes.
127
15.0 MINERAL RESERVE ESTIMATES
The reserves estimated for the Timmins West Mine (TWM) have been based on the updated Indicated resource material included in the resource block models for the Thunder Creek Deposit and Timmins Deposit. The block models were prepared by LSG geology personnel. The estimated in-situ Indicated resource reported from the block models at a 3.0 gram per tonne (g/t) cut-off grade are summarized in Table 15.1.
TABLE 15.1: TIMMINS WEST MINE IN-SITU INDICATED RESOURCE AT 3.0 G/T CUT-OFF GRADE
Deposit | | Tonnes | | Grade (g/t) | | Ounces | |
Timmins Deposit | | 1,242,932 | | 6.7 | | 267,417 | |
Thunder Creek Deposit | | 1,641,057 | | 6.5 | | 341,326 | |
Total Timmins West Mine | | 2,883,989 | | 6.6 | | 608,743 | |
The mine design was updated to reflect the most likely LOM mining and production scenario. The mine design includes all sustaining development and construction required to access the Indicated resources, and the methods required to extract the ore using a combination of longhole and mechanized cut and fill techniques.
15.1 CUT-OFF GRADE
To develop the LOM plan and estimate the reserves for TWM, a stope cut-off grade (COG) using all-in operating costs has been estimated. The stope COG includes both planned and unplanned dilution. The assumptions for COG calculations are the same for both the Timmins Deposit and Thunder Creek Deposit and are summarized in Table 15.2.
TABLE 15.2: TWM COG ASSUMPTIONS
Item | | Operating
COG | |
Mining (includes general and administration) | | $71.00 /t | |
Ore Surface Transport to Bell Creek Mill | | $6.50 /t | |
Milling | | $22.00 /t | |
Total Cost | | $99.50 /t | |
Mill Recovery | | 96% | |
Gold Price $US | | US$1,100 /oz | |
Exchange Rate | | 1.045 | |
Gold Price $CDN | | CDN$1,150 /oz | |
Stope COG | | 2.80 g/t | |
The costs and mill recovery have been based on TWM operating experience. In addition to the stope COG, LSG mine planning personnel have considered sustaining capital costs and the overall economics in localized areas when evaluating sublevels and stoping blocks. As a result, a cut-off grade of 3 g/t was used to build the reserves. A higher grade is required for the final stope design and LOM plan, as LSG factors in a risk free rate of return and profitability.
128
15.2 TIMMINS DEPOSIT RESERVE ESTIMATE
Based on the in-situ Indicated Resource included in the Timmins Deposit block model, the following methodology was used to estimate the reserves.
The Timmins Deposit block model was reviewed in plan and in section to identify areas with concentrations of Indicated Resource material above 3.0 g/t cut-off grade and to determine the most appropriate mining method for each area.
Sublevels were established at 20 metre vertical intervals, and vertical sections were cut through the model at 5 to 10 metre intervals along strike. Mining shapes were designed on each section and each shape had an influence 2.5 to 5 metres east and 2.5 to 5 metres west of the section. The mining shapes were joined with shapes on adjacent sections to generate 3D stope wireframes. All reserves quoted are captured within these specific mining shapes.
The mining shapes were evaluated to determine average stope size, and stope geometry to identify MCAF stoping areas. The average stope size was used to estimate an external dilution factor (unplanned dilution) to apply to the in-situ stope resource. Based on historic stope reconciliation data, unplanned dilution has been estimated to be 8 percent. In addition, also based on historic stope reconciliation data, a 95 percent mining recovery factor has been applied.
The in-situ tonnes and grade contained within the stope wireframes were extracted from the block model Indicated Resource data, and external dilution and mining recovery factors have been applied to estimate the reserves. The results are summarized by mining level in Table 15.3.
TABLE 15.3: TIMMINS DEPOSIT ESTIMATED RESERVES
| | Stope Reserve | | Development Reserve | | Total Reserve | |
Level | | Tonnes | | Grade
(g/t) | | Ounces | | Tonnes | | Grade
(g/t) | | Ounces | | Tonnes | | Grade
(g/t) | | Ounces | |
230L | | 11,788 | | 4.6 | | 1,737 | | 0 | | 0.0 | | 0 | | 11,788 | | 4.6 | | 1,737 | |
335L | | 118,936 | | 4.4 | | 16,812 | | 22,470 | | 4.0 | | 2,916 | | 141,406 | | 4.3 | | 19,728 | |
415L | | 12,715 | | 4.8 | | 1,948 | | 4,970 | | 4.8 | | 761 | | 17,685 | | 4.8 | | 2,709 | |
435L | | 41,994 | | 6.0 | | 8,054 | | 10,430 | | 4.8 | | 1,622 | | 52,424 | | 5.7 | | 9,676 | |
455L | | 27,607 | | 4.0 | | 3,553 | | 5,670 | | 4.0 | | 730 | | 33,277 | | 4.0 | | 4,283 | |
475L | | 46,454 | | 3.0 | | 4,547 | | 2,380 | | 6.0 | | 459 | | 48,834 | | 3.2 | | 5,006 | |
525L | | 18,298 | | 5.3 | | 3,105 | | 3,500 | | 5.3 | | 594 | | 21,798 | | 5.3 | | 3,698 | |
540L | | 45,490 | | 2.8 | | 4,017 | | 0 | | 0.0 | | 0 | | 45,490 | | 2.8 | | 4,017 | |
565L | | 1,438 | | 3.9 | | 182 | | 0 | | 0.0 | | 0 | | 1,438 | | 3.9 | | 182 | |
585L | | 18,793 | | 3.3 | | 2,017 | | 0 | | 0.0 | | 0 | | 18,793 | | 3.3 | | 2,017 | |
610L | | 20,821 | | 4.0 | | 2,678 | | 5,600 | | 4.3 | | 782 | | 26,421 | | 4.1 | | 3,459 | |
650L | | 10,159 | | 4.1 | | 1,350 | | 0 | | 0.0 | | 0 | | 10,159 | | 4.1 | | 1,350 | |
670L | | 79,047 | | 3.9 | | 9,974 | | 0 | | 0.0 | | 0 | | 79,047 | | 3.9 | | 9,974 | |
690L | | 5,262 | | 8.3 | | 1,399 | | 0 | | 0.0 | | 0 | | 5,262 | | 8.3 | | 1,399 | |
710L | | 12,715 | | 4.3 | | 1,751 | | 0 | | 0.0 | | 0 | | 12,715 | | 4.3 | | 1,751 | |
730L | | 8,421 | | 3.4 | | 920 | | 0 | | 0.0 | | 0 | | 8,421 | | 3.4 | | 920 | |
750L | | 44,749 | | 5.1 | | 7,311 | | 9,030 | | 3.9 | | 1,136 | | 53,779 | | 4.9 | | 8,447 | |
770L | | 182,032 | | 4.5 | | 26,036 | | 3,570 | | 3.9 | | 450 | | 185,602 | | 4.4 | | 26,486 | |
790L | | 30,000 | | 6.1 | | 5,884 | | 0 | | 0.0 | | 0 | | 30,000 | | 6.1 | | 5,884 | |
810L | | 115,618 | | 4.8 | | 18,000 | | 0 | | 0.0 | | 0 | | 115,618 | | 4.8 | | 18,000 | |
830L | | 85,136 | | 4.1 | | 11,175 | | 19,880 | | 3.7 | | 2,393 | | 105,016 | | 4.0 | | 13,568 | |
850L | | 156,461 | | 5.4 | | 27,041 | | 16,870 | | 3.5 | | 1,883 | | 173,331 | | 5.2 | | 28,924 | |
870L | | 83,622 | | 5.8 | | 15,534 | | 8,680 | | 4.1 | | 1,136 | | 92,302 | | 5.6 | | 16,670 | |
890L | | 32,558 | | 3.5 | | 3,696 | | 13,860 | | 3.8 | | 1,695 | | 46,418 | | 3.6 | | 5,391 | |
910L | | 40,291 | | 4.2 | | 5,484 | | 12,110 | | 3.8 | | 1,483 | | 52,401 | | 4.1 | | 6,967 | |
930L | | 26,492 | | 4.8 | | 4,058 | | 10,545 | | 4.4 | | 1,488 | | 37,037 | | 4.7 | | 5,546 | |
950L | | 75,754 | | 5.5 | | 13,349 | | 8,820 | | 4.9 | | 1,381 | | 84,574 | | 5.4 | | 14,731 | |
*Inventory | | | | | | | | | | | | | | 29,308 | | 5.5 | | 5,187 | |
Total | | 1,352,651 | | 4.6 | | 201,612 | | 158,385 | | 4.1 | | 20,908 | | 1,540,344 | | 4.6 | | 227,707 | |
*Broken inventory on surface and underground
129
Some sublevels have an overall grade that is near the 2.8 g/t stope COG. In general, these sublevels already have capital development and infrastructure in place, and in some cases the operating development has also been completed.
A detailed development schedule, production profile, and mine design were created to estimate the capital and operating costs required to access, develop, and extract the Timmins Deposit reserves. A full cost estimate was also prepared to include all Timmins area general and administration costs and all operating and capital costs required to complete and operate essential site infrastructure at both the Timmins West Mine and Bell Creek Mill sites. No allowance (positive or negative) was made for mining operations at Bell Creek Mine.
15.3 THUNDER CREEK DEPOSIT RESERVE ESTIMATE
Based on the in-situ Indicated Resource included in the Thunder Creek block model, the following methodology was used to estimate the reserves.
The Thunder Creek block model was reviewed in plan and in section to identify areas with concentrations of Indicated Resources above 3.0 g/t, and to confirm the appropriateness of longhole mining methods. Sublevels were established at 35 metre vertical intervals and mining shapes were designed at 5 metre intervals along strike for each sublevel. The mining shapes on each section were meshed with shapes on adjacent sections to generate 3D stope wireframes. Individual stopes were designed at 15 metre wide intervals along strike on each sublevel. All reserves are included in a mining shape. External dilution parameters were developed and applied to each individual stope based on geometry and size and characteristics of neighboring stopes and sequencing.
The tonnes and grade contained within the stope wireframes were extracted from the block model Indicated Resource data, and external dilution and mining recovery factors were applied to estimate the reserves. The results have been summarized in Table 15.4.
130
TABLE 15.4: THUNDER CREEK DEPOSIT ESTIMATED RESERVES
| | Stope | | Development | | Total | |
Level | | Tonnes | | Grade
(g/t) | | Ounces | | Tonnes | | Grade
(g/t) | | Ounces | | Tonnes | | Grade
(g/t) | | Ounces | |
395L | | 45,601 | | 4.1 | | 6,011 | | 2,341 | | 5.7 | | 426 | | 47,942 | | 4.2 | | 6,437 | |
415L | | 19,623 | | 3.4 | | 2,112 | | 2,474 | | 3.6 | | 284 | | 22,097 | | 3.4 | | 2,397 | |
450L | | 46,579 | | 4.6 | | 6,907 | | 3,971 | | 5.8 | | 741 | | 50,550 | | 4.7 | | 7,648 | |
485L | | 68,453 | | 4.9 | | 10,788 | | 6,037 | | 5.3 | | 1,021 | | 74,490 | | 4.9 | | 11,808 | |
520L | | 26,281 | | 5.8 | | 4,877 | | 4,240 | | 4.3 | | 587 | | 30,521 | | 5.6 | | 5,464 | |
555L | | 78,193 | | 4.2 | | 10,566 | | 5,698 | | 4.7 | | 852 | | 83,890 | | 4.2 | | 11,418 | |
590L | | 121,395 | | 3.6 | | 14,066 | | 16,099 | | 3.9 | | 2,038 | | 137,494 | | 3.6 | | 16,104 | |
625L | | 279,944 | | 3.9 | | 35,327 | | 9,076 | | 5.8 | | 1,679 | | 289,020 | | 4.0 | | 37,006 | |
660L | | 319,614 | | 5.2 | | 53,334 | | 1,789 | | 5.3 | | 305 | | 321,403 | | 5.2 | | 53,639 | |
695L | | 241,482 | | 4.6 | | 36,013 | | 795 | | 3.7 | | 95 | | 242,277 | | 4.6 | | 36,108 | |
730L | | 148,565 | | 4.1 | | 19,390 | | 0 | | 0.0 | | 0 | | 148,565 | | 4.1 | | 19,390 | |
765L | | 75,204 | | 6.0 | | 14,560 | | 0 | | 0.0 | | 0 | | 75,204 | | 6.0 | | 14,560 | |
785L | | 132,146 | | 3.9 | | 16,591 | | 20,275 | | 6.0 | | 3,901 | | 152,421 | | 4.2 | | 20,491 | |
820L | | 53,163 | | 6.5 | | 11,046 | | 1,193 | | 3.0 | | 116 | | 54,356 | | 6.4 | | 11,162 | |
855L | | 28,300 | | 6.2 | | 5,630 | | 2,746 | | 9.8 | | 860 | | 31,046 | | 6.5 | | 6,490 | |
Inventory | | | | | | | | | | | | | | 30,545 | | 4.5 | | 4,416 | |
Total | | 1,684,542 | | 4.4 | | 247,217 | | 76,733 | | 5.2 | | 12,906 | | 1,791,821 | | 4.6 | | 264,539 | |
*Broken inventory on surface and underground
A detailed development schedule, production profile, and mine design was completed to estimate the capital and operating costs required to access, develop, and extract the Thunder Creek Deposit reserves.
15.4 TIMMINS WEST MINE COMBINED RESERVES
The Timmins Deposit and Thunder Creek Deposit combined reserves have been summarized in Table 15.5.
TABLE 15.5: TIMMINS WEST MINE COMBINED RESERVES
Deposit | | Tonnes | | Grade
(grams/tonne) | | Ounces | |
Timmins Deposit | | 1,540,344 | | 4.6 | | 227,707 | |
Thunder creek Deposit | | 1,791,821 | | 4.6 | | 264,539 | |
Timmins West Mine Total Reserves Mined to Surface | | 3,332,164 | | 4.6 | | 492,246 | |
The stope wireframes, LOM plan, and estimated reserves were reviewed by a third party mining consultant.
Additional details regarding the mine design, dilution and recovery, and mine operations are included in Item 16.
131
16.0 MINING METHODS
Overview
The Timmins West Mine (TWM) includes two mineralized gold resource deposits; the Timmins Deposit and nearby Thunder Creek Deposit.
The Timmins Deposit mineralized resource extends from near surface (surface is at 10,015 metre elevation) to approximately 1,340 metres below surface. There are three main geological mineralized zones; Vein Zone, Footwall Zone, and Ultramafic Zone. Each zone is further comprised of a number of smaller zones, separated by waste rock. The zones vary in transverse width from 1.5 metres to in excess of 30 metres. Generally, the mineralized resource strikes east-west and dips 55 degrees to the north, although locally individual zones may be shallower dipping.
The Thunder Creek Deposit mineralized resource is approximately 750 metres south of the Timmins Deposit and extends from 165 metres to 950 metres below surface. Thunder Creek consists of the Rusk Zone and the Porphyry Zone and is generally massive, striking east-west and dipping 60 degrees to the north. An isometric view of the Timmins Deposit and Thunder Creek Deposit Indicated Resource is shown in Figure 16.1.
FIGURE 16.1: TIMMINS DEPOSIT AND THUNDER CREEK DEPOSIT, LOOKING EAST
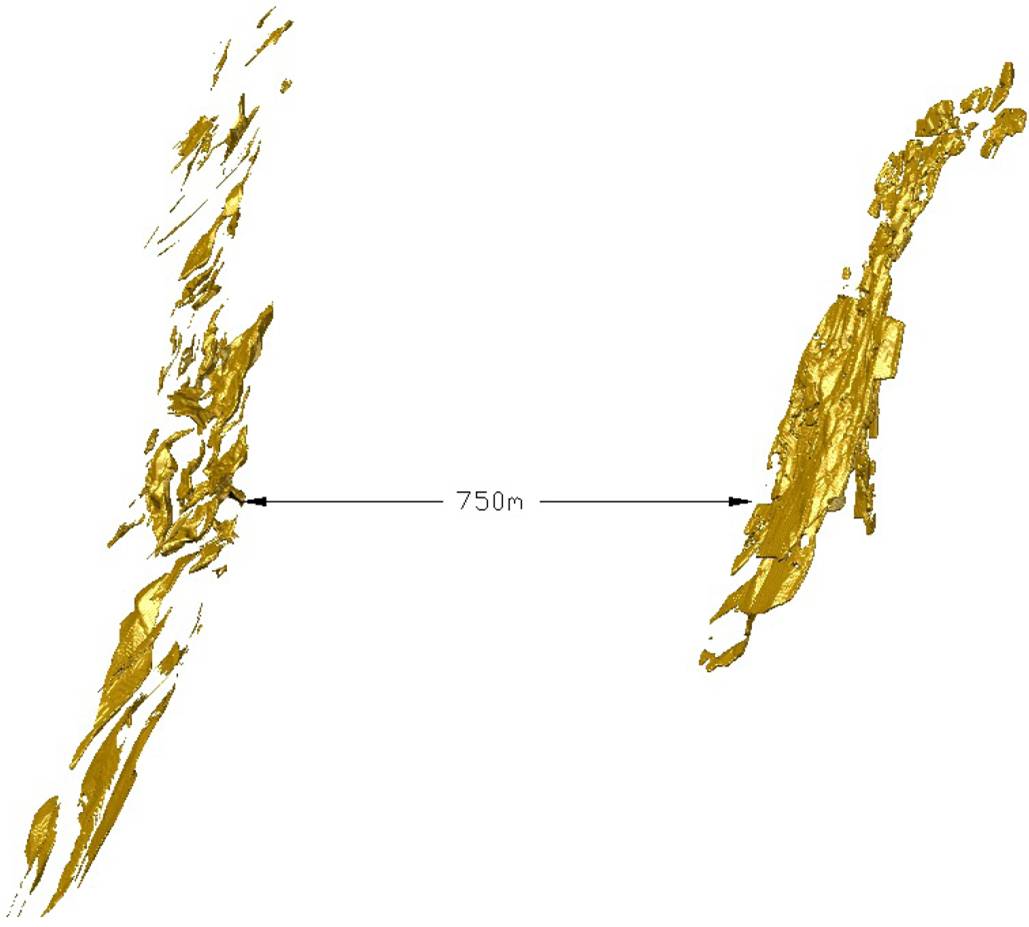
132
Lake Shore completed an advanced exploration program on the Timmins Deposit in 2010. The program included establishing surface facilities, sinking a 5.5 metre inside diameter, 710 metre deep shaft, completing an underground diamond drilling program, and developing/constructing required underground infrastructure to extract a bulk sample. Following the discovery of the Thunder Creek Deposit, two ramps were developed from the Timmins Deposit to access the Thunder Creek Deposit at 275 Level and 730 Level. Advanced exploration activities were completed at Thunder Creek (including extraction of a bulk sample) throughout 2011.
The majority of development and construction of the underground mine infrastructure and surface support facilities at the TWM has been completed, and the mine has been in commercial production since 2011.
The existing surface infrastructure at the TWM is shown in Figure 16.2 and includes:
· Access roads and site grading.
· Security gate house.
· Shaft headframe, collar house, and hoisting plant.
· Compressed air plant.
· Process water supply.
· A pastefill plant and distribution boreholes to underground.
· Portal and main ramp to underground.
· Electrical services infrastructure and distribution.
· Timmins Deposit main fresh air ventilation fans and mine air heaters.
· Thunder Creek main fresh air ventilation fans and mine air heaters.
· Administration, mine dry, and training facilities.
· Warehouse and maintenance facilities.
· Water treatment facilities and discharge water settling ponds.
133
FIGURE 16.2: TIMMINS WEST MINE SURFACE INFRASTRUCTURE
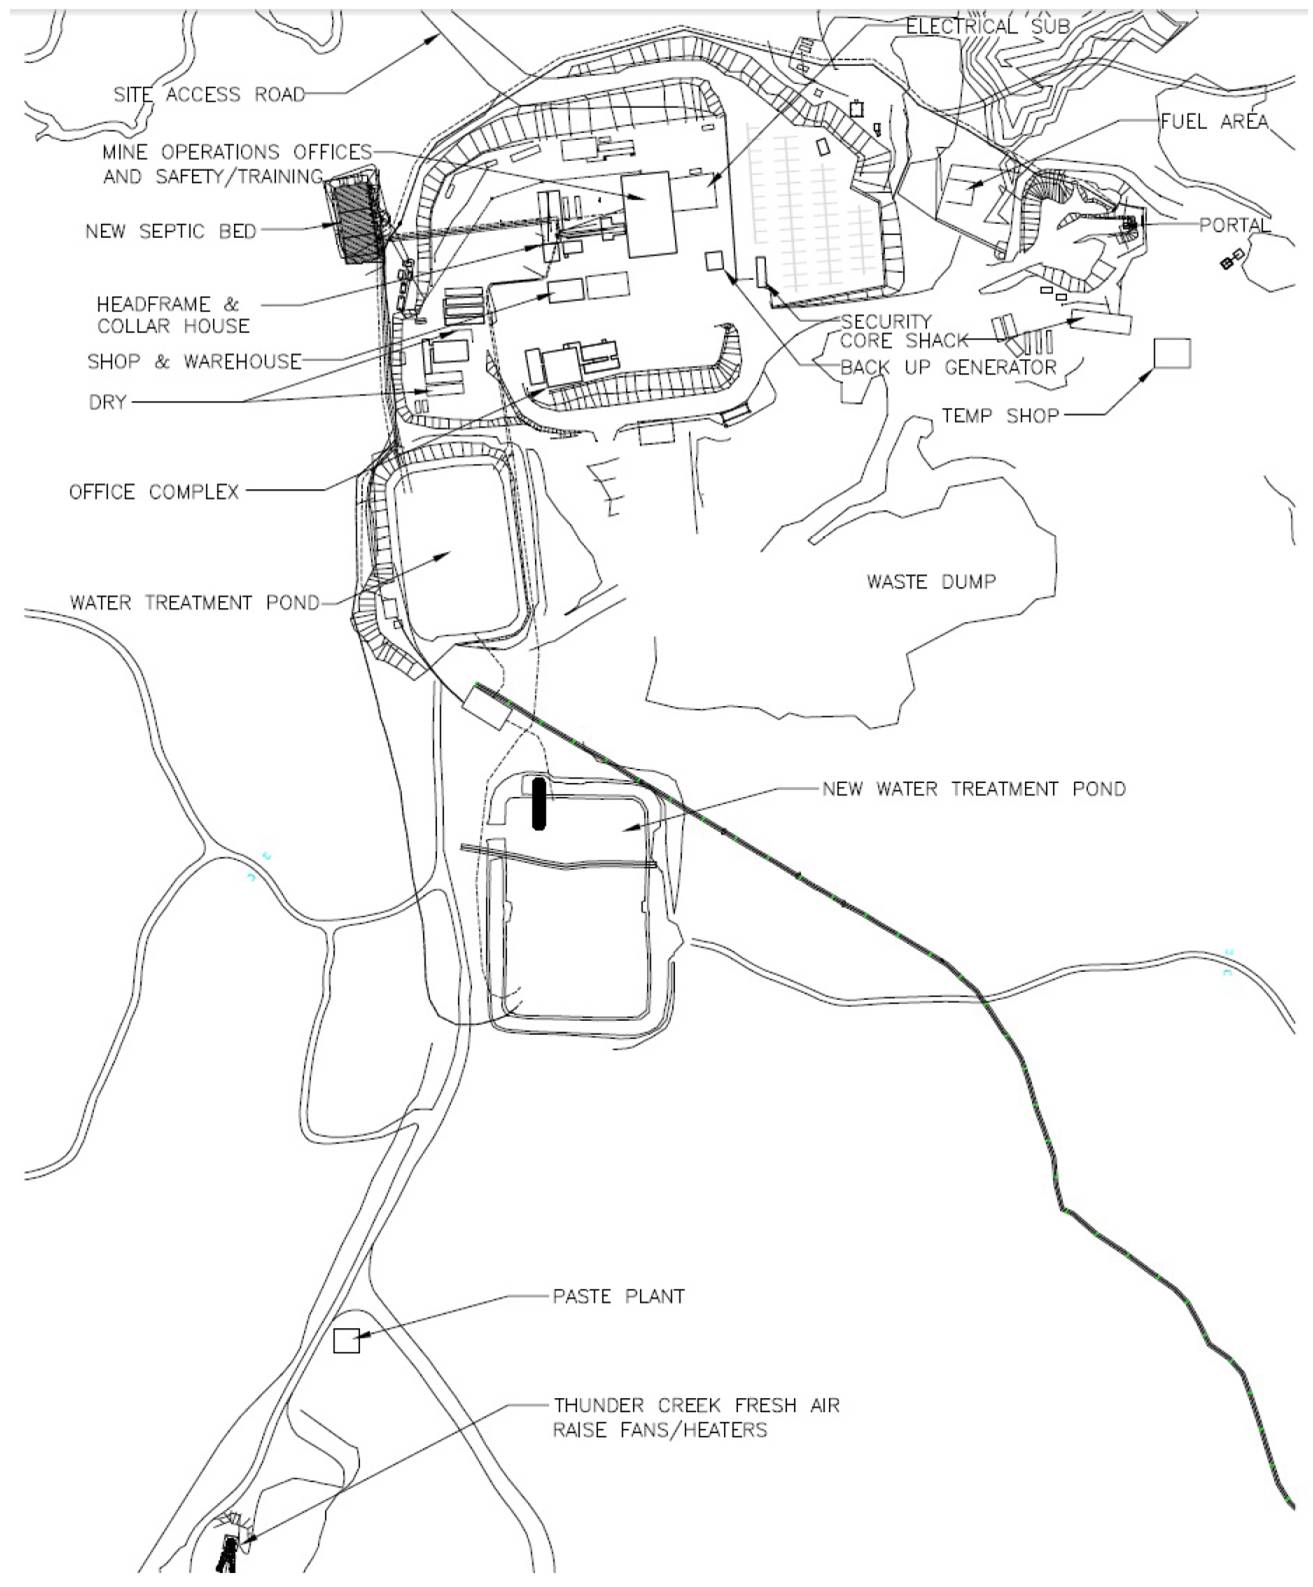
134
The existing underground infrastructure at the TWM is shown in Figure 16.3 and includes:
· The 5.5 metre diameter, 710 metre deep production shaft.
· Main shaft stations at 200 Level, 400 Level, 525 Level, and 650 Level.
· Ore and waste rockbreakers and bins at 650 Level, and a loading pocket at 670 Level.
· Ventilation raises to surface and internal ventilation raises underground.
· The main ramp from surface to approximately 300 Level.
· An internal ramp system to access existing sublevels.
· Mine dewatering facilities.
· Electrical distribution and communications.
· Compressed air and service water distribution.
· Maintenance facilities.
· Access to the Thunder Creek Deposit at 275 Level and 730 Level.
FIGURE 16.3: TIMMINS WEST MINE EXISTING UNDERGROUND INFRASTRUCTURE
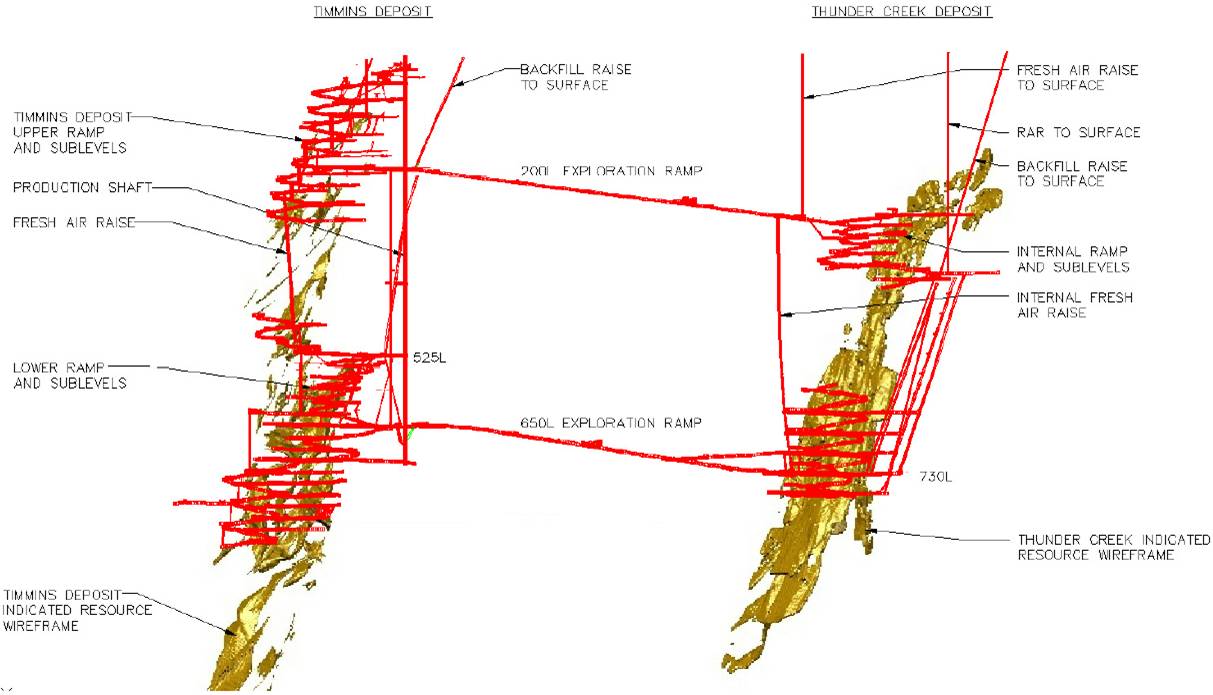
The updated reserve estimate for the TWM has been based on the Indicated Resource material included in the resource block models for the Thunder Creek Deposit and Timmins Deposit. The block models were prepared by Lake Shore Gold (LSG) geology personnel. The estimated in-situ Indicated Resource reported from the block models at 3.0 grams per tonne (g/t) cut-off grade are summarized in Table 16.1.
TABLE 16.1: TIMMINS WEST MINE IN-SITU INDICATED RESOURCE AT 3.0 G/T CUT-OFF GRADE
Deposit | | Tonnes | | Grade (g/t) | | Ounces | |
Timmins Deposit | | 1,242,932 | | 6.7 | | 267,417 | |
Thunder Creek Deposit | | 1,641,057 | | 6.5 | | 341,326 | |
Total Timmins West Mine | | 2,883,989 | | 6.6 | | 608,743 | |
135
Engineering and cost estimate work has been completed on this material as part of the LOM planning process in order to substantiate the updated reserves for the mine. The mine design has been based on the in-situ Indicated Resources included in the block models, existing surface and underground infrastructure, and operating experience at the TWM.
16.1 UNDERGROUND ACCESS
The Timmins Deposit and Thunder Creek Deposit Indicated Resource will continue to be extracted using underground mining methods and are accessed via the existing 5.5 metre diameter shaft and portal/ramp (5 metre x 5 metre) from surface.
16.1.1 Primary / Secondary Access
The primary access to the underground workings will continue to be via the existing TWM shaft, and ore and waste rock will be trucked to the 650 Level rockbreaker for sizing and subsequent skipping to surface.
The Thunder Creek Deposit will be accessed via existing ramps originating at the Timmins Deposit 200 Level (accessing Thunder Creek at 275 Level) and 650 Level (accessing Thunder Creek at 730 Level).
An existing portal and ramp from surface currently extends to the Timmins Deposit 300 Level. Development of an internal ramp system at each deposit is ongoing and will connect to each production level in the mine (i.e. no captive levels).
Secondary access/egress to/from the underground will be via the existing portal and ramp to surface, and internal raises equipped with escapeways.
16.2 SHAFT AND HOISTING FACILITIES
The primary access to the underground workings and transfer of ore and waste rock to surface will continue to be via the existing production shaft (sunk in close proximity to the Timmins Deposit). The shaft collar is at 10,015 metre elevation and shaft bottom at 9,305 metre elevation (710 metres deep). Main shaft stations have been constructed at 200 Level (200L), 400L, 525L, and 650L. The naming of underground levels has been expressed as metres below the shaft collar (i.e. 650L is 650 metres below collar).
The shaft is concrete lined with a 5.5 metre inside diameter. The shaft includes two skip compartments (12 tonne capacity bottom dump skips), a service cage compartment (42 person capacity double deck cage), and service compartment for piping and electrical services. The shaft does not have a manway compartment.
The existing steel headframe is 47 metres tall and includes a collar house and chute to dump ore and waste to an outside pad.
16.2.1 Hoisting Plant
The hoisting plant includes a production hoist for skipping operations and a service hoist for cage operations.
136
Production Hoist
The existing production hoist is a Nordberg, 3.6 metre (12 foot) diameter double drum with 2 x 862 kW (2 x 1,150 hp) AC motors. Combined with the 12 tonne skips, the plant has capacity to hoist 5,378 tonnes per day. This capacity will be sufficient to meet ore production and waste rock hoisting requirements.
Service Hoist
The existing service hoist is a 2.7 metre (9 foot) diameter single drum unit with an 862 kW (1,150 hp) AC motor. Combined with the 42 person double deck cage, the capacity will be suitable to meet personnel and material transfer requirements.
16.2.2 Shaft Services
The existing pipe services in the shaft include a 100 mm diameter service water pipeline, 152 mm diameter dewatering pipeline, two 203 mm diameter slick lines, and a 305 mm diameter compressed air line. The shaft services will have sufficient capacity to supply the mine.
16.2.3 Ore / Waste Handling System and Loading Pocket
Broken ore and waste rock are hauled to separate ore and waste dumps/rockbreaker arrangements near the shaft at 650L. Broken material is dumped onto grizzlies and sized with stationary hydraulic rockbreakers. The sized ore material feeds a 1,200 tonne capacity ore bin and the sized waste material feeds an 800 tonne capacity waste bin.
The bins feed a conventional gravity fed loading pocket. Chains and pneumatic cylinders are used to control the flow of material. For the ore system, ore feeds from the bin to a splitter to divert the material into the two measuring flasks. The waste material feeds from one side, but a moveable (by cylinder) chute allows both flasks to be filled. The existing skip loading system has been fully automated.
16.3 STOPING METHODS
Longhole with delayed backfill stoping, using both consolidated (cemented rockfill and pastefill) and unconsolidated fill, has been the primary mining method used to date at the TWM. Longhole is a widely used and proven mining method that involves common industry equipment and labour skillsets.
Varying resource geometry will require more than one mining method to extract the resource. Areas with narrow, flatter dipping geometry at the Timmins Deposit will require a combination of longhole and Mechanized Cut and Fill (MCAF) methods, while the wider, steeper dipping geometry at Thunder Creek will support the use of primarily bulk transverse longhole mining.
16.3.1 Timmins Deposit
The mineralized zones at the Timmins Deposit vary in transverse width and dip. Mining shapes (i.e. stope wireframes) have been designed for all in-situ Indicated Resources that have been included in the reserve estimate.
Mechanized Cut and Fill
Where mineralized zones dip less than 55 degrees, MCAF will be the preferred mining method. MCAF stope blocks will be accessed by an attack ramp (or “V” ramp). Sublevels for MCAF mining areas will be
137
developed at 20 vertical metre intervals (floor to floor) and there will be four, 5 metre high cuts taken from each sublevel. The cuts will be mined using 2-boom Jumbos, 6 cubic yard class LHDs, with ground support installed using handheld drills from the deck of a scissor lift, or a mechanical bolter.
Mined cuts will be backfilled. To maximize sill pillar recovery, backfill that will be mined under (i.e. exposed as a back) may include up to 7% binder content. Where available (and without compromising backfill quality or schedule), mined out stopes will be used to dispose of waste rock from development activities (as opposed to skipping this material and stockpiling on surface).
Longhole
The longhole method has been used successfully at the TWM during bulk sample extraction and commercial production.
Where resource geometry is favourable (i.e. the footwall dips 55 degrees or steeper), the longhole mining method will be the preferred stoping approach.
Sublevels will be established at 20 metre vertical intervals. The resource will generally be accessed in the centre (along strike) and stope undercut and overcut sills developed to the east and west extents. Stope lengths will be 20 metres along strike and mining will retreat from the extremities toward the initial access point.
The longitudinal longhole mining method is shown in the sketches in Figure 16.4.
FIGURE 16.4: LONGITUDINAL LONGHOLE MINING METHOD
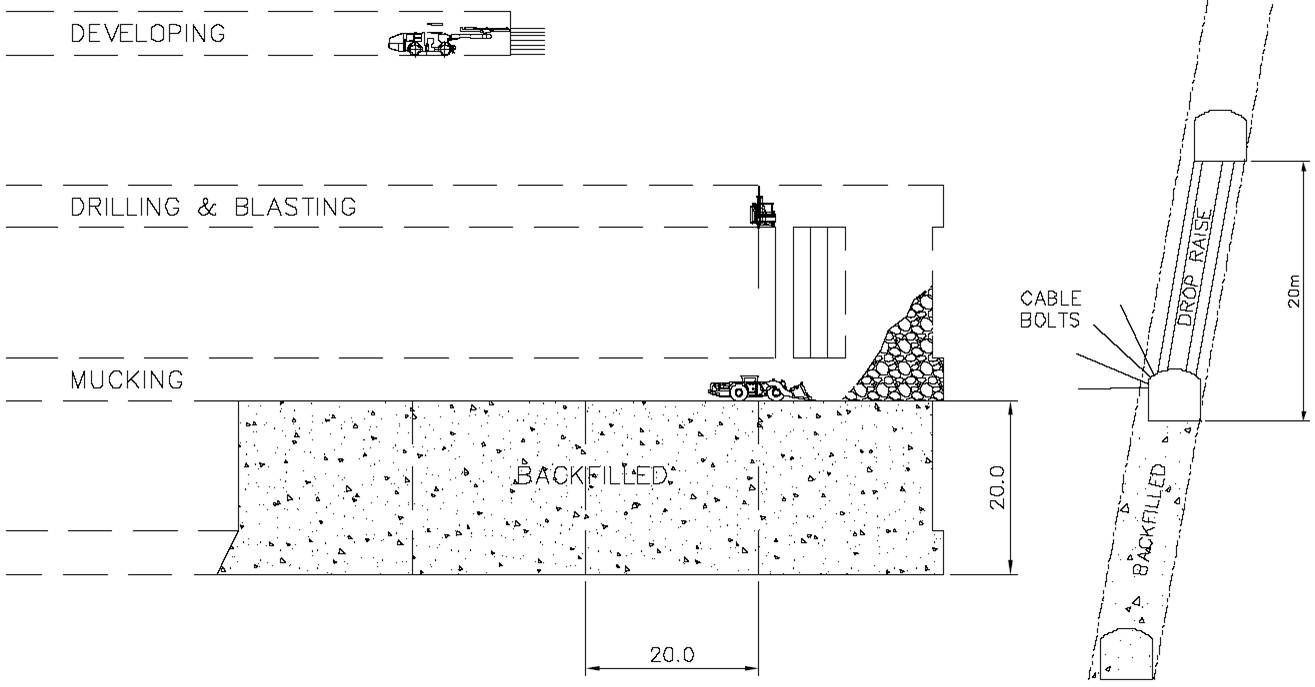
138
Ore sills will be developed along the strike of the resource under geological control (i.e. under the direction of mine geologists). Where ore widths are less than 8 metres, the entire sill from the hangingwall to footwall contacts will be developed. Where ore widths exceed 8 metres, the hangingwall contact will be followed, with crosscuts developed at preset intervals to expose the footwall contact. Where ore widths allow, a sill drift will be developed along each contact, with a pillar left between. Ore sills will be developed at a minimum of 4 metres wide to accommodate 6 cubic yard LHDs for stope mucking.
Longholes will be drilled with a pneumatically powered top hammer drill (current practice). Longholes will be drilled down from the overcut sill with some holes breaking through into the undercut, and others fanned as required to contour the stope limits. A drop raise will be drilled and blasted to create the initial void for production blasting. When mining a sill pillar (below a backfilled stope), uppers drilling will be completed from the stope undercut sill.
Longholes will be loaded with emulsion explosives. The emulsion will be detonated with non-electric blasting caps and boosters.
Broken ore will be extracted from stopes using 6 cubic yard LHDs. When the stope drawpoint brow is closed with muck, the LHD will be operated manually (i.e. with the operator in the seat). When the drawpoint brow is open, the LHD will be operated via remote control with the operator located a safe distance from the stope and away from the moving LHD. The LHD will tram to a remuck or load directly into a haul truck. Any ore dumped into a remuck will subsequently be remucked and loaded into a 42 tonne class haul truck and hauled to the 650L rockbreaker.
Mined out stopes will be backfilled. Where backfill will be mined against (i.e. exposed as a vertical wall) the binder content will be up to 3 percent. To maximize sill pillar recovery, backfill that will be mined under (i.e. exposed as a back) may include up to 7% binder content. Where available (and without compromising backfill quality), mined out stopes will be used to dispose of waste rock from development activities (as opposed to skipping this material and stockpiling on surface).
16.3.2 Thunder Creek Deposit
The Indicated mineralized zones at the Thunder Creek Deposit average 12 to 15 metres wide and dip approximately 70 degrees to the north in the Rusk and 40 to 55 metres wide and dipping 60 degrees to the north in the Porphyry. The geometry of the resource zones at Thunder Creek will be suitable for the transverse longhole mining method with a primary/secondary stoping sequence, with some longitudinal stoping in narrower areas. The longhole method has been successfully used throughout the mining industry to mine ore bodies with similar geometry.
The pre-feasibility study mine design completed for the Thunder Creek Deposit included 35 metre sublevel intervals. This interval has been successfully used for production in 2012 and 2013 and will continue to be used.
Longhole Stoping
Longholes will be drilled using an ITH drill (for greater accuracy with the higher sublevel interval). Longholes will be drilled down from the overcut sill with some holes breaking through into the undercut, and others fanned as required to contour the stope limits. A drop raise will be drilled and blasted to create the initial void for production blasting. Longholes will be loaded with emulsion explosives (current practice). The emulsion will be detonated with non-electric blasting caps and boosters.
139
Broken ore will be extracted from stopes using 6 and 8 cubic yard class LHDs. When the stope drawpoint brow is closed with muck, the LHD will be operated manually (i.e. with the operator in the seat). When the drawpoint brow is open, the LHD will be operated via remote control with the operator located a safe distance from the stope and away from the moving LHD. The LHD will tram on the level and dump into an ore pass finger raise. The ore pass will gravity feed a truck loadout at 765L. For stopes mucked at or below 750L, ore will be mucked to a remuck and/or loaded directly into a haul truck.
Ore will be hauled via the ramp in 50 tonne class haul trucks to the 650 Level rockbreaker at the production shaft.
Mined out stopes will be backfilled. Where backfill will be mined against (i.e. exposed as a vertical wall) the binder content will be 3 percent. To maximize sill pillar recovery, backfill that will be developed through and mined under (i.e. exposed as a back) may include up to 7% binder content.
The transverse longhole mining method is shown in the sketch in Figure 16.5.
FIGURE 16.5: TRANSVERSE LONGHOLE MINING METHOD
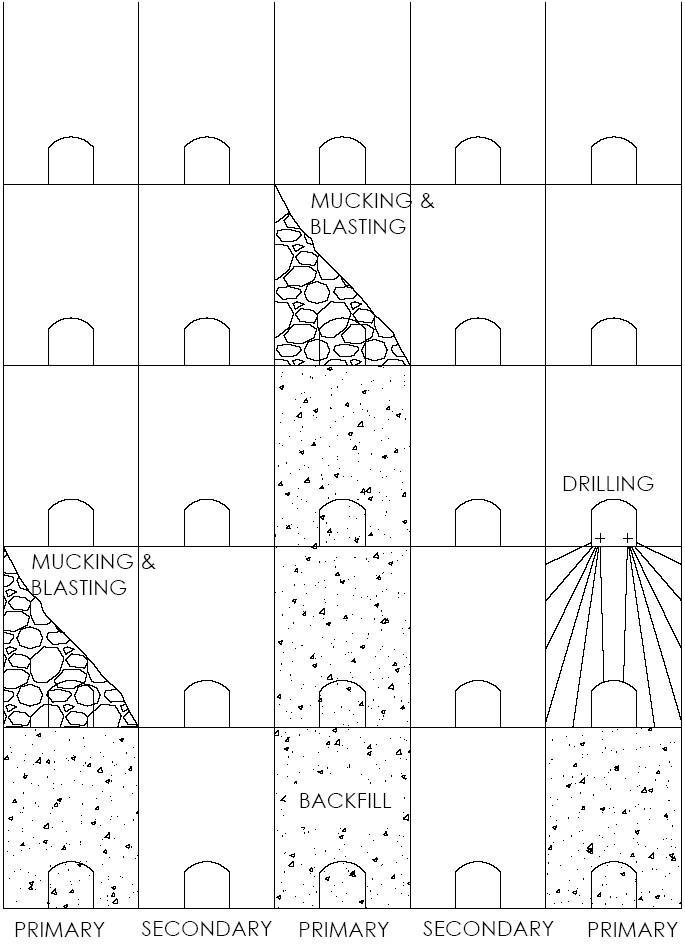
140
16.4 RESOURCE ANALYSIS (DILUTION AND RECOVERY)
16.4.1 Mining Dilution and Recovery
Mining Dilution
Two sources of dilution have been considered in estimating the reserves.
Planned dilution includes low grade material and/or waste rock that will be mined and will not be segregated from the ore. Sources of planned dilution include:
· Waste rock or low grade material that is drilled and blasted within the drift profile of ore sills and the overall grade of the “muck” justifies delivery to the mill.
· Waste rock or low grade material within the confines of the stope limits. This includes internal waste pockets and footwall and/or hangingwall rock that has been drilled and blasted to maximize ore recovery and/or maintain favourable wall geometry for stability.
Planned dilution is directly reported from block model data and waste rock within stope wireframes.
Unplanned dilution includes low grade resource, waste rock, and/or backfill from outside the planned drift profile or stope limits that overbreaks or sloughs and is mucked with the ore and delivered to the mill.
The estimated planned and unplanned dilution for the deposits is outlined in Items 16.4.3 and 16.4.4.
Mining Recovery
Two recovery factors have been considered in establishing the probable reserves.
Planned recovery includes the in-situ block model resource that will be accessed, developed, and mined. Any Indicated Resource not included in the mining shapes (i.e. stopes) has not been included in the reserves. Reasons that some block model in-situ resource will not be recovered may include:
· The resource includes a small volume that is separate from the main mining area and does not support the cost to develop and mine.
· The resource terminates between sublevels and would require mining excess dilution to recover.
· Random blocks within the block model that cannot be mined as part of an economic stope.
· Resource left in pillars adjacent to previously mined stopes that have been backfilled with unconsolidated rockfill.
A mining recovery factor has been applied to account for material that is planned to be mined within the confines of the stope limits, but will not be recovered due to factors such as:
· Poor ground.
· Blasting difficulties (ground does not break properly and cannot be recovered).
· Ore geometry.
· Broken ore that cannot be extracted (i.e. resting on the footwall or around corners).
· Unplanned ore pillars left in place.
141
A 95% mining recovery (based on historic data) has been considered in estimating the probable reserves mined to surface.
16.4.2 Stope Cut-Off Grade
To develop the LOM plan and estimate the reserves for TWM, a stope cut-off grade (COG) using all-in operating costs has been estimated. The stope COG includes both planned and unplanned dilution. The assumptions for COG calculations are the same for both the Timmins Deposit and Thunder Creek Deposit and are summarized in Table 16.2.
TABLE 16.2: TWM COG ASSUMPTIONS
Item | | Operating
COG | |
Mining (includes general and administration) | | $71.00 /t | |
Ore Surface Transport to Bell Creek Mill | | $6.50 /t | |
Milling | | $22.00 /t | |
Total Cost | | $99.50 /t | |
Mill Recovery | | 96% | |
Gold Price $US | | US$1,100 /oz | |
Exchange Rate | | 1.045 | |
Gold Price $CDN | | CDN$1,150 /oz | |
Stope COG | | 2.80 g/t | |
The operating costs and mill recovery have been based on TWM operating experience. The assumed weighted average gold price (CDN$1,150) is lower than in previous COG calculations and has resulted in a more conservative reserve estimate.
In addition to the stope COG, LSG mine planning personnel have considered sustaining capital costs and the overall economics in localized areas when evaluating sublevels and stoping blocks. As a result, a cut-off grade of 3 g/t was used to build the reserves. A higher grade is required for the final stope design and LOM plan, as LSG factors in a risk free rate of return and profitability.
16.4.3 Timmins Deposit Reserve Estimate
Based on the in-situ Indicated Resource included in the Timmins Deposit block model, the following methodology was used to estimate the reserves.
The Timmins Deposit block model was reviewed in plan and in section to identify potential mining areas with concentrations of in-situ Indicated Resource above 3.0 g/t and to determine appropriate mining methods.
Sublevels were designed at 20 metre vertical intervals, and vertical sections were cut through the model at 5 metre to 10 metre intervals along strike (depending on the complexity of the resource). Mining shapes were designed on each section and each shape had an influence of 2.5 metres to 5 metres east and west of the section. The mining shapes were joined with shapes on adjacent sections to generate wireframes.
142
The in-situ resource contained within the wireframes was retrieved from block model data and includes:
· Higher grade material grading above 3.0 g/t.
· Low grade material grading below 3.0 g/t (planned internal dilution).
· Waste rock grading 0.0 g/t (planned internal dilution).
Stope reconciliation data has been used to estimate unplanned dilution and mining recovery factors for the Timmins Deposit. Based on this analysis, 8% unplanned dilution (grading 0.0 g/t) and 95% mining recovery has been used to estimate the reserves.
The in-situ tonnes and grade contained within the wireframes were extracted from the block model Indicated Resource data, and unplanned dilution and mining recovery factors have been applied to estimate the reserves. The results are summarized by mine level in Table 16.3.
TABLE 16.3: TIMMINS DEPOSIT ESTIMATED RESERVES
| | Stope Reserve | | Development Reserve | | Total Reserve | |
Level | | Tonnes | | Grade
(g/t) | | Ounces | | Tonnes | | Grade
(g/t) | | Ounces | | Tonnes | | Grade
(g/t) | | Ounces | |
230L | | 11,788 | | 4.6 | | 1,737 | | 0 | | 0.0 | | 0 | | 11,788 | | 4.6 | | 1,737 | |
335L | | 118,936 | | 4.4 | | 16,812 | | 22,470 | | 4.0 | | 2,916 | | 141,406 | | 4.3 | | 19,728 | |
415L | | 12,715 | | 4.8 | | 1,948 | | 4,970 | | 4.8 | | 761 | | 17,685 | | 4.8 | | 2,709 | |
435L | | 41,994 | | 6.0 | | 8,054 | | 10,430 | | 4.8 | | 1,622 | | 52,424 | | 5.7 | | 9,676 | |
455L | | 27,607 | | 4.0 | | 3,553 | | 5,670 | | 4.0 | | 730 | | 33,277 | | 4.0 | | 4,283 | |
475L | | 46,454 | | 3.0 | | 4,547 | | 2,380 | | 6.0 | | 459 | | 48,834 | | 3.2 | | 5,006 | |
525L | | 18,298 | | 5.3 | | 3,105 | | 3,500 | | 5.3 | | 594 | | 21,798 | | 5.3 | | 3,698 | |
540L | | 45,490 | | 2.8 | | 4,017 | | 0 | | 0.0 | | 0 | | 45,490 | | 2.8 | | 4,017 | |
565L | | 1,438 | | 3.9 | | 182 | | 0 | | 0.0 | | 0 | | 1,438 | | 3.9 | | 182 | |
585L | | 18,793 | | 3.3 | | 2,017 | | 0 | | 0.0 | | 0 | | 18,793 | | 3.3 | | 2,017 | |
610L | | 20,821 | | 4.0 | | 2,678 | | 5,600 | | 4.3 | | 782 | | 26,421 | | 4.1 | | 3,459 | |
650L | | 10,159 | | 4.1 | | 1,350 | | 0 | | 0.0 | | 0 | | 10,159 | | 4.1 | | 1,350 | |
670L | | 79,047 | | 3.9 | | 9,974 | | 0 | | 0.0 | | 0 | | 79,047 | | 3.9 | | 9,974 | |
690L | | 5,262 | | 8.3 | | 1,399 | | 0 | | 0.0 | | 0 | | 5,262 | | 8.3 | | 1,399 | |
710L | | 12,715 | | 4.3 | | 1,751 | | 0 | | 0.0 | | 0 | | 12,715 | | 4.3 | | 1,751 | |
730L | | 8,421 | | 3.4 | | 920 | | 0 | | 0.0 | | 0 | | 8,421 | | 3.4 | | 920 | |
750L | | 44,749 | | 5.1 | | 7,311 | | 9,030 | | 3.9 | | 1,136 | | 53,779 | | 4.9 | | 8,447 | |
770L | | 182,032 | | 4.5 | | 26,036 | | 3,570 | | 3.9 | | 450 | | 185,602 | | 4.4 | | 26,486 | |
790L | | 30,000 | | 6.1 | | 5,884 | | 0 | | 0.0 | | 0 | | 30,000 | | 6.1 | | 5,884 | |
810L | | 115,618 | | 4.8 | | 18,000 | | 0 | | 0.0 | | 0 | | 115,618 | | 4.8 | | 18,000 | |
830L | | 85,136 | | 4.1 | | 11,175 | | 19,880 | | 3.7 | | 2,393 | | 105,016 | | 4.0 | | 13,568 | |
850L | | 156,461 | | 5.4 | | 27,041 | | 16,870 | | 3.5 | | 1,883 | | 173,331 | | 5.2 | | 28,924 | |
870L | | 83,622 | | 5.8 | | 15,534 | | 8,680 | | 4.1 | | 1,136 | | 92,302 | | 5.6 | | 16,670 | |
890L | | 32,558 | | 3.5 | | 3,696 | | 13,860 | | 3.8 | | 1,695 | | 46,418 | | 3.6 | | 5,391 | |
910L | | 40,291 | | 4.2 | | 5,484 | | 12,110 | | 3.8 | | 1,483 | | 52,401 | | 4.1 | | 6,967 | |
930L | | 26,492 | | 4.8 | | 4,058 | | 10,545 | | 4.4 | | 1,488 | | 37,037 | | 4.7 | | 5,546 | |
950L | | 75,754 | | 5.5 | | 13,349 | | 8,820 | | 4.9 | | 1,381 | | 84,574 | | 5.4 | | 14,731 | |
*Inventory | | | | | | | | | | | | | | 29,308 | | 5.5 | | 5,187 | |
Total | | 1,352,651 | | 4.6 | | 201,612 | | 158,385 | | 4.1 | | 20,908 | | 1,540,344 | | 4.6 | | 227,707 | |
*Broken inventory on surface and underground
143
Some sublevels have an overall grade that is near the 2.8 g/t stope COG. In general, these sublevels already have capital development and infrastructure in place, and in some cases the operating development has also been completed.
A development schedule, production profile, and mine design has been completed to estimate the capital and operating costs required to access, develop, and extract the Timmins Deposit reserves. A LOM cash flow analysis has been completed to demonstrate that the probable reserves support major capital infrastructure. The costs are included in Item 21 of this report.
16.4.4 Thunder Creek Deposit Reserve Estimate
Based on the in-situ Indicated Resource included in the Thunder Creek block model, the following methodology was used to estimate the reserves.
The Thunder Creek block model was reviewed in plan and in section to identify concentrations of Indicated Resource material above 3.0 g/t, and to confirm the longhole mining method. Sublevels were established at 35 metre vertical intervals and mining shapes were designed at 5 metre intervals along strike for each sublevel. The mining shapes on each section were meshed with shapes on adjacent sections to generate stope wireframes.
Stope reconciliation data has been used to estimate the mining recovery factor for the Thunder Creek Deposit.
Based on this analysis, 95% mining recovery has been used to estimate the reserves. Although the data also indicates dilution values below 4%, smaller stopes are anticipated for future mining and this value was considered too low. Based on geotechnical data required, more conservative unplanned dilution parameters have been developed and applied to each individual stope based on geometry and size. The unplanned dilution parameters are summarized in Table 16.4.
TABLE 16.4: THUNDER CREEK UNPLANNED DILUTION PARAMETERS
| | Dip | |
Source | | 50° - 60° | | 60° - 70° | | 70° - 80° | | 80° - 90° | |
Hangingwall Dilution (m) | | 0.85 | | 0.65 | | 0.50 | | 0.45 | |
Footwall Dilution (m) | | 0.20 | | 0.30 | | 0.40 | | 0.50 | |
In addition, backfill dilution parameters have been developed and applied to each individual stope (where required) based on geometry and size. Where the mucking floor of a stope will be backfilled, a 0.5 metre backfill dilution depth has been added. When mining against backfilled stopes, the estimated backfill dilution depth varies depending on the wall span as summarized in Table 16.5.
TABLE 16.5: THUNDER CREEK UNPLANNED BACKFILL DILUTION PARAMETERS
| | Backfill Wall Span | |
Source | | 15 m | | 20 m | | 30 m | | 40 m | | 50 m | |
Backfill Dilution Depth | | 0.3 m | | 0.4 m | | 0.6 m | | 0.8 m | | 1.0 m | |
The in-situ tonnes and grade contained within the stope wireframes were extracted from the block model Indicated Resource data and unplanned dilution and mining recovery factors have been applied to estimate the reserves. The results have been summarized in Table 16.6.
144
TABLE 16.6: THUNDER CREEK DEPOSIT ESTIMATED PROBABLE RESERVES
| | Stope | | Development | | Total | |
Level | | Tonnes | | Grade
(g/t) | | Ounces | | Tonnes | | Grade
(g/t) | | Ounces | | Tonnes | | Grade
(g/t) | | Ounces | |
395L | | 45,601 | | 4.1 | | 6,011 | | 2,341 | | 5.7 | | 426 | | 47,942 | | 4.2 | | 6,437 | |
415L | | 19,623 | | 3.4 | | 2,112 | | 2,474 | | 3.6 | | 284 | | 22,097 | | 3.4 | | 2,397 | |
450L | | 46,579 | | 4.6 | | 6,907 | | 3,971 | | 5.8 | | 741 | | 50,550 | | 4.7 | | 7,648 | |
485L | | 68,453 | | 4.9 | | 10,788 | | 6,037 | | 5.3 | | 1,021 | | 74,490 | | 4.9 | | 11,808 | |
520L | | 26,281 | | 5.8 | | 4,877 | | 4,240 | | 4.3 | | 587 | | 30,521 | | 5.6 | | 5,464 | |
555L | | 78,193 | | 4.2 | | 10,566 | | 5,698 | | 4.7 | | 852 | | 83,890 | | 4.2 | | 11,418 | |
590L | | 121,395 | | 3.6 | | 14,066 | | 16,099 | | 3.9 | | 2,038 | | 137,494 | | 3.6 | | 16,104 | |
625L | | 279,944 | | 3.9 | | 35,327 | | 9,076 | | 5.8 | | 1,679 | | 289,020 | | 4.0 | | 37,006 | |
660L | | 319,614 | | 5.2 | | 53,334 | | 1,789 | | 5.3 | | 305 | | 321,403 | | 5.2 | | 53,639 | |
695L | | 241,482 | | 4.6 | | 36,013 | | 795 | | 3.7 | | 95 | | 242,277 | | 4.6 | | 36,108 | |
730L | | 148,565 | | 4.1 | | 19,390 | | 0 | | 0.0 | | 0 | | 148,565 | | 4.1 | | 19,390 | |
765L | | 75,204 | | 6.0 | | 14,560 | | 0 | | 0.0 | | 0 | | 75,204 | | 6.0 | | 14,560 | |
785L | | 132,146 | | 3.9 | | 16,591 | | 20,275 | | 6.0 | | 3,901 | | 152,421 | | 4.2 | | 20,491 | |
820L | | 53,163 | | 6.5 | | 11,046 | | 1,193 | | 3.0 | | 116 | | 54,356 | | 6.4 | | 11,162 | |
855L | | 28,300 | | 6.2 | | 5,630 | | 2,746 | | 9.8 | | 860 | | 31,046 | | 6.5 | | 6,490 | |
*Inventory | | | | | | | | | | | | | | 30,545 | | 4.5 | | 4,416 | |
Total | | 1,684,542 | | 4.4 | | 247,217 | | 76,733 | | 5.2 | | 12,906 | | 1,791,821 | | 4.6 | | 264,539 | |
*Broken inventory on surface and underground
A development schedule, production profile, and mine design has been completed to estimate the capital and operating costs required to access, develop, and extract the Thunder Creek Deposit reserves. A LOM cash flow analysis has been completed to demonstrate that the probable reserves support major capital infrastructure. The capital and operating costs are included in Item 21 of this report.
16.4.5 Timmins West Mine Combined Reserves
The combined TWM reserves are summarized in Table 16.7.
TABLE 16.7: TIMMINS WEST MINE COMBINED RESERVES
Deposit | | Tonnes | | Grade (g/t) | | Ounces | |
Timmins Deposit | | 1,540,344 | | 4.6 | | 227,707 | |
Thunder Creek Deposit | | 1,791,821 | | 4.6 | | 264,539 | |
Total Timmins West Mine | | 3,332,164 | | 4.6 | | 492,246 | |
16.5 HAULAGE
All ore and waste rock that will be skipped to surface will be hauled by trucks to the existing production shaft, 650L grizzly/rockbreaker stations.
145
16.5.1 Timmins Deposit Underground Truck Haulage
Ore mined above 650L will be loaded into 42 tonne capacity haul trucks and hauled via the ramp to either 525L and dumped into an ore pass, or to 650L and dumped on the grizzly. Waste rock from development activities will be dumped into open stopes (as backfill) or dumped into a waste pass that will gravity feed to 650L.
Below 650L, an LHD will load ore and waste rock into 42 tonne capacity haul trucks that will haul the material up the ramp and dump on the 650L grizzly.
As mining progresses deeper, additional trucks will be added to the fleet to maintain production. Up to four 42 tonne trucks will be required for ore haulage, with additional capacity provided by the 36 tonne truck fleet (for hauling development waste rock).
16.5.2 Thunder Creek Deposit Underground Truck Haulage
Ore mucked from stopes above 765L will be trammed using LHDs and dumped directly into an ore pass dump on each sublevel. The ore pass will gravity feed to a truck loadout chute at 765L. At the 765L truck loadout, 50 tonne class underground haul trucks will be loaded and will haul up the internal ramp to 730L and across the connecting ramp to the 650L rockbreakers at the TWM. The one-way haul distance will be approximately 1,400 metres. Ore mucked from stopes at 765L and below will be loaded into trucks using the LHD. The trucks will also haul up to 730L and across to the TWM 650L rockbreaker.
Waste rock from development will be handled through the waste pass system and will also be loaded into haul trucks through a truck chute at 765L. Where possible, waste rock will be dumped directly into mined out stopes (as opposed to hauling and skipping to surface).
Two 50 tonne class trucks will be required to haul ore and waste rock from Thunder Creek to the rockbreakers at the TWM with spare capacity provided by the 42 tonne truck fleet.
16.6 DEVELOPMENT
Table 16.8 and Table 16.9 summarize the estimated LOM development quantities for the Timmins Deposit and Thunder Creek Deposit. Annual development will average 7,600 metres during 2014 and 2015 and will reduce to approximately 1,465 metres in 2016 when all development will essentially be completed.
TABLE 16.8: TIMMINS DEPOSIT ESTIMATED LOM DEVELOPMENT QUANTITIES
Item | | Total (m) | |
Capital | | | |
Ramp | | 2,155 | |
Lateral Waste | | 1,598 | |
Subtotal Capital | | 3,753 | |
Operating | | | |
Lateral Waste/Ore | | 4,501 | |
Subtotal Operating | | 4,501 | |
Total Development | | 8,254 | |
Raises (Conventional/Drop Raise) | | 585 | |
146
TABLE 16.9: THUNDER CREEK DEPOSIT ESTIMATED LOM DEVELOPMENT QUANTITIES
Item | | Total (m) | |
Capital | | | |
Ramp | | 1,980 | |
Lateral Waste | | 2,716 | |
Subtotal Capital | | 4,696 | |
Operating | | | |
Lateral Waste/Ore | | 3,715 | |
Subtotal Operating | | 3,715 | |
Total Development | | 8,411 | |
Raises (Conventional/Drop Raise) | | 1,305 | |
An estimated 0.9 million tonnes of waste rock will be generated from development activities. Where possible, waste rock will be dumped into mined out stopes as backfill, otherwise waste rock will be hauled to the 650L rockbreaker and subsequently skipped to surface (and possibly later returned underground for backfilling). The waste rock generated from development activities is summarized in Table 16.10.
TABLE 16.10: WASTE ROCK GENERATED FROM DEVELOPMENT
Deposit | | Waste Rock
(tonnes) | |
Timmins Deposit | | 414,000 | |
Thunder Creek Deposit | | 512,000 | |
Total | | 926,000 | |
The planned LOM development and infrastructure is shown in Figure 16.6.
147
FIGURE 16.6: PLANNED MINE INFRASTRUCTURE
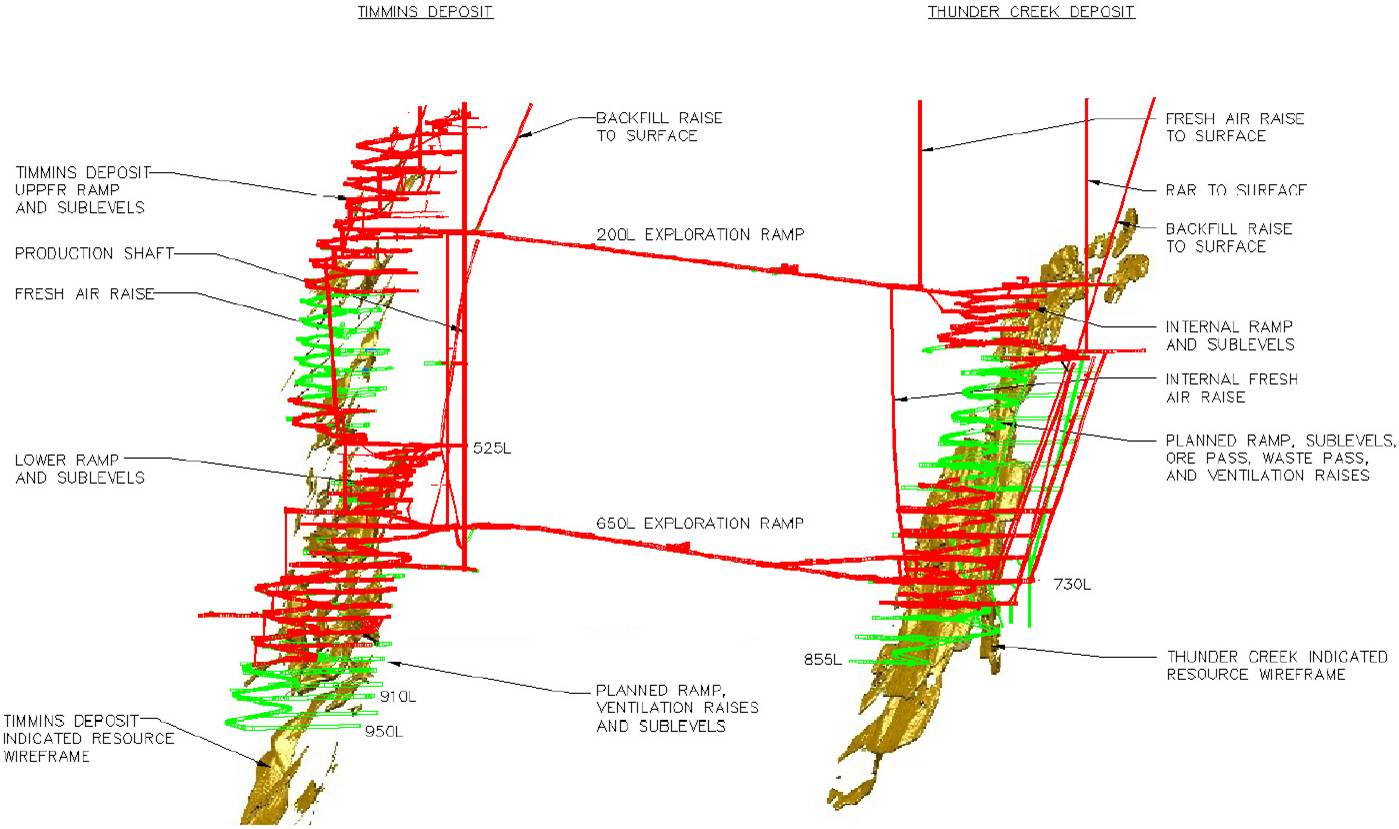
16.6.1 Timmins Deposit
Ramp
The existing ramp extends from surface to 300L and from 480L to 850L. The ramp connection between 300L and 480L will be completed and the ramp will extend to 950L as mining progresses downward.
The ramp profile is 5 metres wide by 5 metres high (arched back) at a maximum gradient of 15 percent. The ramp floor includes a layer of ballast material and the roadway is maintained using a grader to help reduce equipment maintenance requirements.
Sublevel Infrastructure Development
The main access to sublevels will be developed 5 metres wide by 5 metres high to accommodate haul trucks. Ancillary development such as electrical substations will be developed off the level access and will have dimensions to suit the purpose and/or to accommodate the size of the development gear. The infrastructure on sublevels will generally include:
· Sublevel access drift.
· Sump.
· Electrical cut-out (for load centres, starters, communications etc.).
· Remucks and truck turning/loading areas.
· Material storage bays (on some levels).
· Ore sill accesses.
148
· Fresh air raise access drives.
· Return air raise access drives.
· Refuge Stations (on some levels).
The existing sublevel infrastructure at 650L is shown in Figure 16.7.
FIGURE 16.7: EXISTING 650L INFRASTRUCTURE
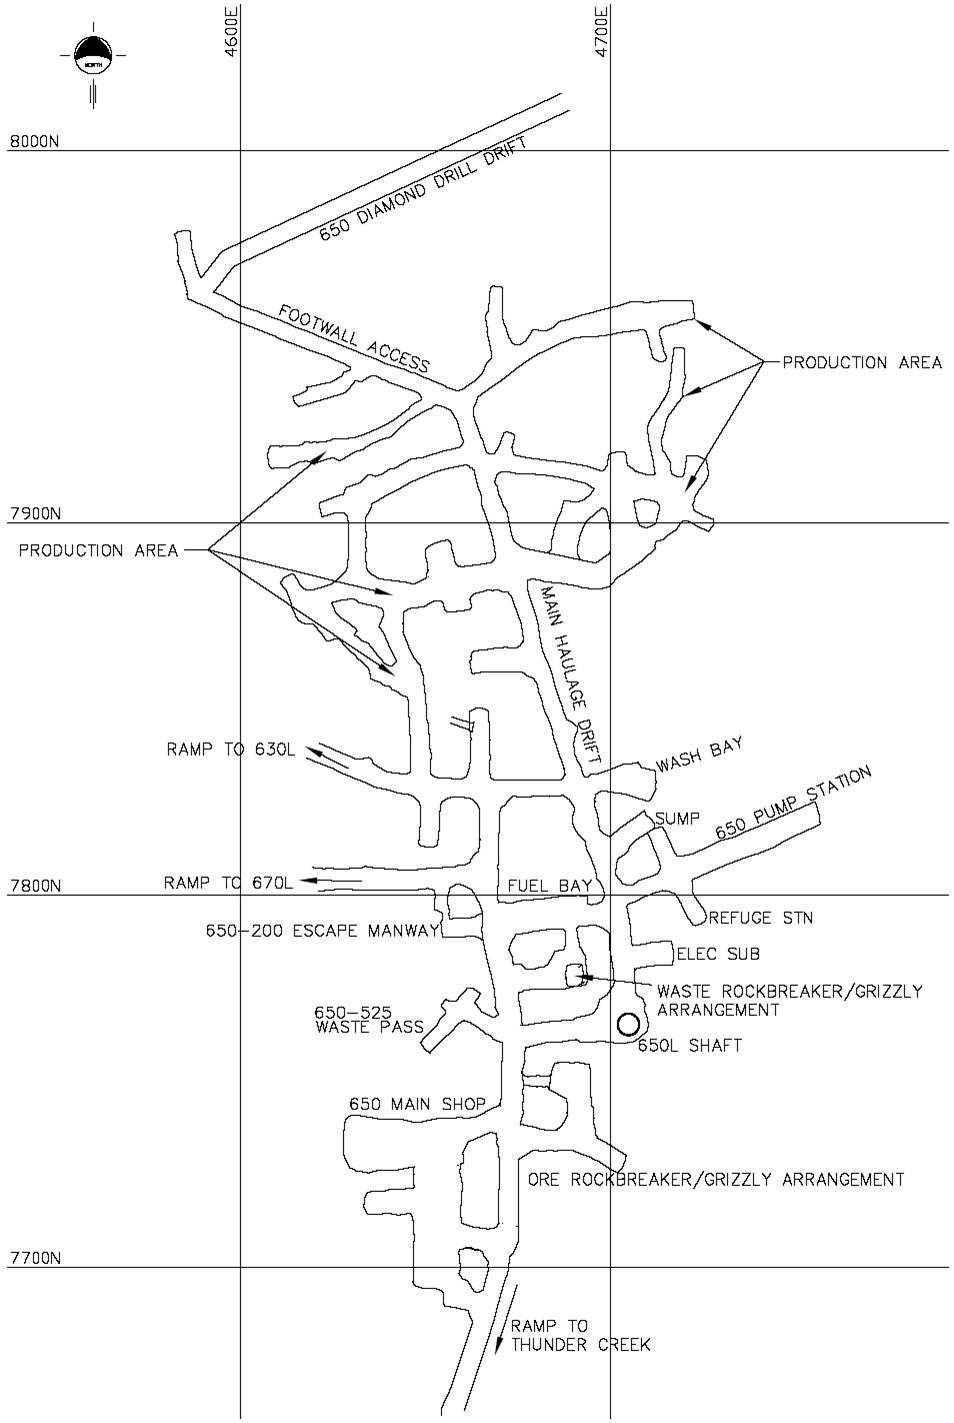
149
16.6.2 Thunder Creek Deposit
Ramp
The main access to the Thunder Creek Deposit will be via the two existing connecting ramps from the Timmins Deposit at 275L and 730L. The Thunder Creek Deposit internal ramp currently extends from 280L to 395L in the upper mine and from 590L to 765L in the lower part of the mine. The ramp will eventually connect through and will extend down to 855L.
The ramp will continue to be developed 5 metres wide by 5 metres high (arched back) at a maximum gradient of 15 percent. The ramp floor will include a layer of ballast material and the roadway will be maintained using a grader to help reduce equipment maintenance requirements.
The existing haulage ramp from Thunder Creek Deposit (730L) to Timmins Deposit (650L) will require some roadbed (ballast) material and regular grading to provide an appropriate travelway for the haul trucks.
Sublevel Infrastructure Development
The main access to sublevels will be developed 5 metres wide by 5 metres high. Ancillary development, such as electrical substations will be developed off the level access and will have dimensions to suit the purpose and/or to accommodate the size of the development gear. The infrastructure on sublevels will generally include:
· Sublevel access drift.
· Sump.
· Electrical cut-out (load centres, starters, communications, etc.).
· Footwall haulage drift.
· Stope drawpoints and crosscuts.
· Material storage bays (on some levels).
· Fresh air raise access drives.
· Return air raise access drives.
· Ore and waste pass accesses and finger raise dumps.
· Refuge stations (on some levels).
The existing sublevel infrastructure at 730L is shown in Figure 16.8.
150
FIGURE 16.8: EXISTING 730L INFRASTRUCTURE
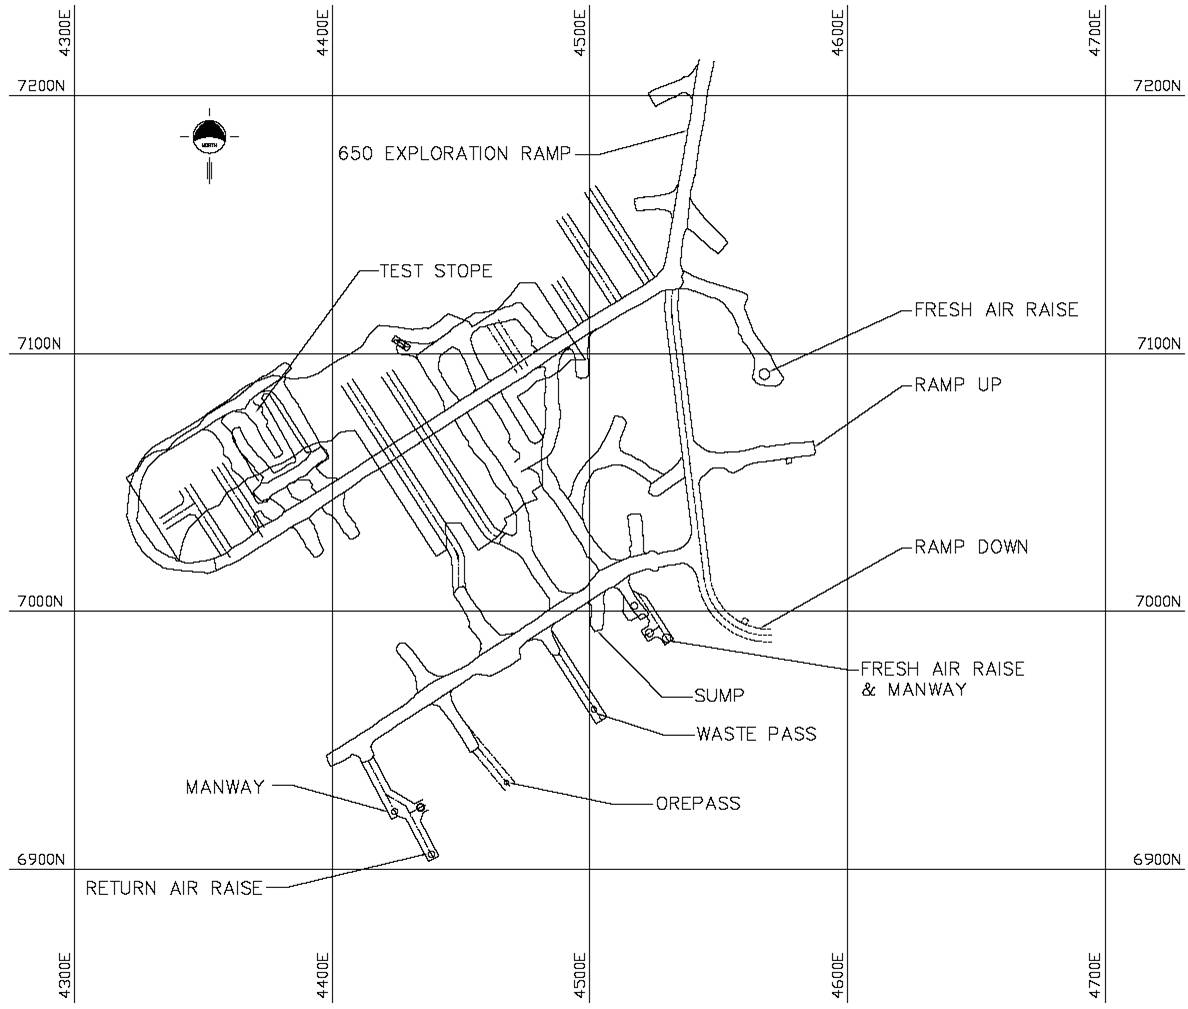
16.6.3 Ground Support
Primary Ground Support
Ground support will be installed in all underground excavations and will remain consistent with current practices. Additional ground support details are included in Item 16.17.
Secondary Ground Support
Geotechnical study work has concluded that under certain conditions secondary ground support (generally referring to as cable bolting) may be required. Stope wall dimensions have been designed in the “stable” region using the Stability Graph Analysis method (Hoek et al. 1995). This is consistent with current practices at the operation.
16.7 DEVELOPMENT SCHEDULES
Development schedules have been completed for the Timmins Deposit and Thunder Creek Deposit using MS Project. Mining activities are resourced in the schedule and dumped into MS Excel spreadsheets for reporting.
151
16.8 BACKFILL
Construction of a paste backfill plant on surface was completed in Q3 2013. The pastefill plant capacity is 3,000 tonnes per day of a paste mixture consisting of:
· Classified tailings,
· Sand, and
· Binder.
The pastefill distribution system consists of two pairs of 150 millimetre (6 inch) diameter boreholes located within or adjacent to the paste plant. Only one of the boreholes can be used to distribute paste during a pour (i.e. paste cannot be poured at two locations simultaneously). The boreholes break through into receiving station excavations near the Timmins Deposit and Thunder Creek. Pastefill is delivered to stopes via a network of boreholes and piping in the ramp and on sublevels. An underground pastefill crew installs and removes pipes as required to suit production requirements.
In instances where cemented rockfill (CRF) is deemed appropriate, slurry is delivered from surface via a pipeline in the shaft (Timmins Deposit) or borehole (Thunder Creek) to a transmixer. The transmixer delivers the slurry to a mixing station where slurry is mixed with waste rock and subsequently placed in the stope.
16.9 PRODUCTION
The mine will continue to operate two shifts per day, seven days per week. Underground crews and maintenance workers will work 10 hour shifts. Annual production has been based on 365 days per year.
16.9.1 Timmins Deposit Production
Production from the Timmins Deposit will include a combination of ore development, longitudinal longhole stoping, and Mechanized Cut-and-Fill (MCAF). Production will remain steady averaging approximately 1,280 tonnes per day from 2014 through 2016 before ramping down and ending in Q3 2017.
Approximately 72% of the Timmins Deposit reserves will be mined from below 650L. Mining below 650L will progress in blocks as ramp development and sublevel infrastructure advances and the ventilation system expands. Mining blocks will generally be 80 vertical metres (i.e. four sublevels) high. Mining will commence at the bottom sublevel within a block and progress upwards within the block. Stopes at the top sublevel in a block will be mined up to the backfilled stopes of the previously mined block above.
Production will rely on prioritizing down ramp development to bring new mining blocks into production before depleting reserves in previously developed blocks (i.e. multiple blocks in production simultaneously). Approximately 147,300 tonnes (9.5%) of the Timmins Deposit reserve will be mined via MCAF.
16.9.2 Thunder Creek Deposit Production
Production at Thunder Creek will be from a combination of ore development and longhole stoping (transverse and longitudinal). Production will be approximately 1,350 tonnes per day in 2014, then ramp up and average 1,730 tonnes per day for the remainder of the mine life.
152
16.9.3 Timmins West Mine Production
Production from TWM will average approximately 2,600 tpd in 2014 and increase to average 2,890 during 2015 and 2016, before ramping down and ending in 2017.
The combined LOM tonnage profile is summarized in Table 16.11.
TABLE 16.11: TWM ANNUAL PRODUCTION TONNES
Item | | 2013
Year-End
Inventory | | 2014 | | 2015 | | 2016 | | 2017
(Q3) | | Total | |
Tonnes | | 59,853 | | 955,774 | | 1,056,244 | | 1,053,338 | | 206,955 | | 3,332,164 | |
Average TPD | | | | 2,618 | | 2,894 | | 2,886 | | | | | |
Annual ounce production is presented as a range (Upper and Lower). The range is based on a ±10% variance from the LOM plan to reflect potential differences in the combination of stopes that may be mined during each year. Ultimately, the combination of stopes will result in an estimated 3,332,164 tonnes at an average grade of 4.6 g/t Au, for 492,246 ounces.
TABLE 16.12: TWM ANNUAL OUNCES MINED TO SURFACE
Item | | 2013
Year-End
Inventory | | 2014 | | 2015 | | 2016 | | 2017
(Q3) | | Total | |
Average Grade | | 5.0 | | 4.7 | | 4.5 | | 4.7 | | 4.0 | | 4.6 | |
Ounces — Upper Range | | | | 159,500 | | 168,400 | | 174,000 | | 29,100 | | | |
Ounces — LOM Plan | | 9,603 | | 144,993 | | 153,087 | | 158,123 | | 26,440 | | 492,246 | |
Ounces — Lower Range | | | | 130,500 | | 137,800 | | 142,400 | | 23,800 | | | |
The LOM ounce production profile is shown graphically in Figure 16.9.
FIGURE 16.9: LOM OUNCE PRODUCTION
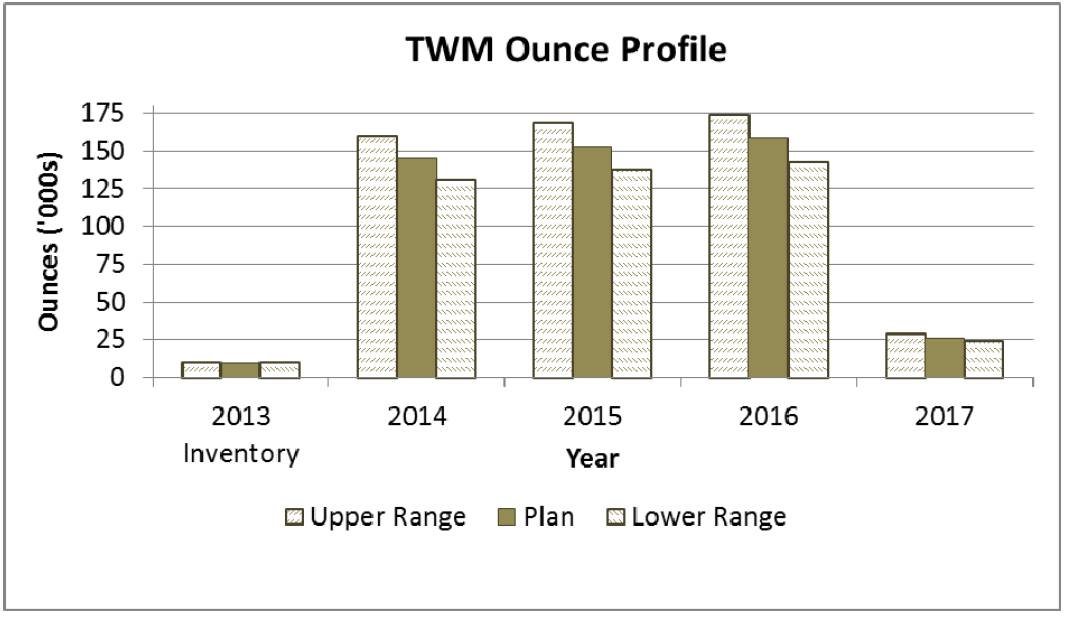
153
16.10 PRODUCTION EQUIPMENT
The existing development, production, and auxiliary underground equipment fleet will continue to be used (where applicable), with equipment purchased and rebuilt as required to meet production demands. The mobile equipment fleet (including spares) is summarized in Table 16.13.
TABLE 16.13: UNDERGROUND MOBILE EQUIPMENT FLEET
Equipment Type | | Fleet | |
2-Boom Jumbo | | 6 | |
1-Boom Jumbo | | 2 | |
LHD — 8 yd | | 2 | |
LHD — 6 yd | | 10 | |
LHD — 3.5 yd | | 2 | |
LHD — 1.25 and 2 yd | | 3 | |
30 Tonne UG Haul Truck | | 1 | |
42 Tonne UG Haul Truck | | 3 | |
50 Tonne UG Haul Truck | | 2 | |
Scissor Lift | | 9 | |
Mechanical Bolter | | 1 | |
Flat Deck Boom Truck | | 2 | |
Grader | | 2 | |
Tractor/Minecat | | 6 | |
Kubota RTV | | 7 | |
Toyota UG Pick-Up | | 11 | |
Blockholer | | 1 | |
Transmixer | | 1 | |
Total | | 70 | |
16.11 VENTILATION
The main core of the ventilation system has been installed and will service the remainder of the mine life.
16.11.1 Timmins Deposit Ventilation
An estimated 170 cubic metres per second (cms) of fresh ventilation air is required for mining activities at the Timmins Deposit. The Timmins Deposit surface ventilation arrangement includes two 450 kW (600 hp) Alphair 8400AMF5000 fans (total capacity 200 cms) regulated by variable frequency drives (VFDs). Fresh ventilation air is delivered to the Timmins Deposit underground workings via a series of existing offset 4.1 metre diameter equivalent fresh air raises (FAR) to the current working face at 830L. Approximately 60 cms transfers from the Timmins Deposit to the Thunder Creek Deposit across the 650L connecting ramp (to Thunder Creek 730L) to ventilate for Thunder Creek haulage trucks.
Gradual expansion of the ventilation system will occur as mining progresses to 950L. As ramp development advances, a FAR will facilitate ventilating ramp development and subsequent production and will be equipped with an escapeway to provide a second egress to 650L.
154
Below 650L, return air exhausts from sublevels via the ramp to 650L. Return air will split between the shaft, return air raise, and ramp/portal and exhausted to surface. The Timmins Deposit steady state ventilation system is shown in Figure 16.10.
16.11.2 Thunder Creek Ventilation
Thunder Creek requires an estimated 165 cms of fresh ventilation air. The existing Thunder Creek surface ventilation system includes two 450 kW Alphair 8400AMF5000 fans (total capacity 200 cms) regulated by VFDs. Fresh ventilation air will continue to be delivered to the Thunder Creek underground workings via the existing 4.1 metre diameter FAR from surface to 275L and the existing 4.1 metre diameter FAR from 275L to 730L. Auxiliary ventilation fans direct air to mine workings as required.
Gradual expansion of the ventilation system will occur as mining progresses to 855L. As ramp development advances a FAR will facilitate ventilating ramp development and subsequent production and will be equipped with an escapeway to provide a secondary egress to 730L.
A return air raise system to surface exhausts Thunder Creek used ventilation air. Return air from below 730L will exhaust to 730L via the ramp and a small return air raise. Some ventilation air will transfer from Thunder Creek to the Timmins Deposit via the connecting ramp at 275L. The Thunder Creek steady state ventilation system is also shown in Figure 16.10.
FIGURE 16.10: TIMMINS WEST MINE VENTILATION SYSTEM
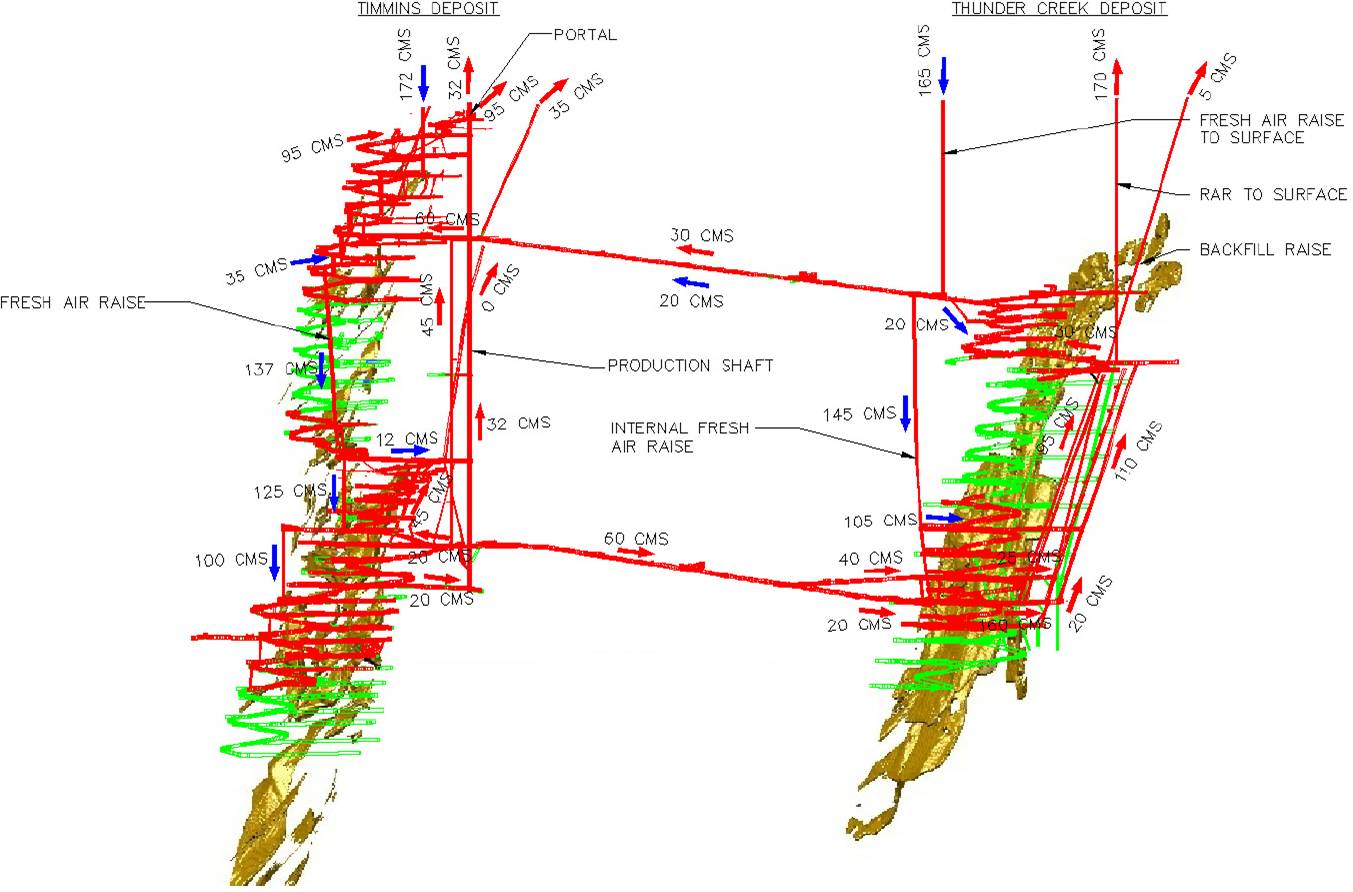
155
16.11.3 Mine Air Heating and Cooling
The existing surface fresh air ventilation plants at the Timmins Deposit and Thunder Creek each include two ACI-Canefco mine air heaters. Each heating unit has 22.5 MMBH of heating capacity.
The mine design extends to 950 metres below surface. Mine air cooling will not be required.
16.12 PERSONNEL
An existing core group of management, environmental, technical services (engineering/geology), administration, maintenance, supervisory, and production personnel will continue to operate the site. The personnel required to sustain the operation will reduce as activities reduce toward the end of the mine life.
The personnel required on payroll are summarized in Table 16.14.
TABLE 16.14: PERSONNEL ON PAYROLL
Classification | | Persons | |
Site Management | | | |
Mine General Manager | | 1 | |
Electrical Superintendent | | 1 | |
Maintenance Superintendent | | 1 | |
Mine General Foreman | | 2 | |
Administration Staff | | | |
HR Administrator | | 1 | |
Reception | | 1 | |
Warehouse Coordinator | | 1 | |
Warehouse Clerk | | 1 | |
Mine Clerk | | | |
Engineering Staff | | | |
Chief Mine Engineer | | 1 | |
Senior Mine Engineer/Projects Engineer | | 1 | |
Mine Engineer | | 2 | |
Mine Planners | | 3 | |
Longhole Planner/Coordinator | | 1 | |
Surveyors | | 2 | |
Ventilation Planner and Technician | | 2 | |
Geology Staff | | | |
Chief Geologist | | 1 | |
Mine Geologist/Geotechnician | | 6 | |
Senior Geologist — Mining/Resources | | 1 | |
Senior Exploration/Drill Geologist | | 1 | |
Drill Geologist | | 3 | |
Database/Drill Geologist | | 1 | |
Contract Geologist | | 1 | |
Core Technicians | | 5 | |
156
Classification | | Persons | |
Health and Safety | | | |
Safety Coordinator | | 1 | |
Trainer | | 2 | |
Environmental | | | |
Environmental Coordinator | | 1 | |
Environmental Technician | | | |
Mine Operations Staff | | | |
UG Shift Supervisor | | 8 | |
Surface Supervisors | | 2 | |
Construction/Drill/Blast Supervisor | | 2 | |
Maintenance Staff | | | |
Maintenance Supervisor | | 2 | |
Hoist Mechanical General Foreman | | 1 | |
Hoist/Electrical Planner | | | |
Maintenance Planner | | 1 | |
Maintenance Clerk | | 1 | |
Subtotal Staff | | 61 | |
Mine Construction/Services | | | |
Construction Miner | | 10 | |
Pastefill System Construction Miner | | 4 | |
Underground Labourer | | 4 | |
Rockbreaker Operator | | 4 | |
Mine Rehab Worker | | 8 | |
Surface Yard Mntce Loader/Truck Operator | | 13 | |
Ammonia Treatment Plant Operator | | 4 | |
Dry/Janitorial | | 1 | |
Shaft | | | |
Hoistperson | | 5 | |
Shaftperson | | 2 | |
Cage/Skip Tender | | 5 | |
Deckperson | | 2 | |
Maintenance | | | |
Lead Mechanic | | 4 | |
Mechanic | | 20 | |
Welder | | 1 | |
Drill / Pump Mechanic | | 2 | |
Mill Wright | | 6 | |
Lead Electrician | | 6 | |
Electrician | | 8 | |
Instrumentation | | 1 | |
Cap Lamp Maintenance | | 1 | |
157
Classification | | Persons | |
Mine Development / MCAF Stoping | | | |
Lead Development Miner | | 16 | |
Development Miner 1 | | 28 | |
Raise Miner | | | |
Mine Production | | | |
Longhole/Cable Bolt Driller (contractor) | | 16 | |
Longhole Blaster/Cable Bolt Installer (contractor) | | 16 | |
LHD Operator | | 20 | |
Haul Truck Operator | | 20 | |
Subtotal Hourly | | 227 | |
Total Personnel | | 288 | |
16.13 UNDERGROUND MINE SERVICES
The underground mine services will include electrical power distribution and communications, compressed air, service water, and dewatering.
16.13.1 Electrical Distribution and Communications
Power is delivered underground at 4,160 V via electrical cables installed in the shaft. Once installed, the power supply will be sufficient for expansion of the mine into new productions areas. Electrical substations (mine load centres) have been located at shaft stations and as required in electrical cut-outs on sublevels.
Communication has been established throughout the mine via an underground radio network (leaky feeder). In addition, a fiber optic network provides communications for control of pumps, monitoring cameras, refuge station dial phones, and fan automation. Underground shaft stations, electrical substations, some remote workplaces, and refuge stations will have direct communications to surface via pager.
The core of the electrical and communications systems have already been put in place and will expand accordingly as the mine develops into new production areas.
16.13.2 Compressed Air
The existing surface compressed air plant includes four Sullair 225 kW, 698 litre/second (1,480 cfm) compressors, and one Sullair 150 kW, 472 litre/second (1,000 cfm) compressor. The overall plant capacity is 3,264 litres/second (6,920 cfm). The existing plant capacity will be sufficient for future development and production activities.
Compressed air will be delivered underground via the existing 305 mm diameter pipe in the shaft. The underground compressed air distribution system will consist of steel piping installed in the ramps and sublevels. Compressed air will be required to power pneumatic equipment and/or activities including:
· Jackleg and stoper use.
· Pneumatic Anfo loaders.
· Blasthole/bootleg cleaning for development rounds.
158
· Pneumatic longhole drills.
· Longhole cleaning.
· Refuge station ventilation (pressurizing).
· Pneumatic cylinders for door controls.
· Pneumatic pumps for local dewatering.
· Main shop (pneumatic tools).
16.13.3 Service Water
Currently, all service water required for underground drilling operations, dust suppression, and washing work places is supplied from recycled water inflow from the surrounding rock mass. Additional service water will be available (if needed) from surface sources. Service water is supplied to the main levels via the existing 100 mm diameter pipe in the shaft and in the ramp. Service water will be distributed underground via steel pipe in the ramp and on sublevels. Service water will not be potable (i.e. not for drinking).
16.13.4 Mine Dewatering
Water inflow from the surrounding rockmass and water used for drilling activities and dust suppression is currently collected in local sumps and directed to main sumps/pump stations at the Timmins Deposit (200L and 650L) through a network of drain holes and small pumps/dewatering lines (including a shaft bottom pump). The inflow water is recycled and used for service water in the mine.
The 650L pump station includes two 225 kW (300 hp) pumps (one duty and one spare). From the 650L pump station, clean (settled) water is pumped up the existing 152 mm diameter pipe in the shaft to the 200L pump station. The 200L pump station includes two 150 kW (200 hp) pumps (one duty and one spare). From the 200L pump station, a portion of the water is pumped to surface via piping in the ramp and in the shaft while the remaining water is returned to the service water supply piping network (in the shaft and ramp). The current dewatering system capacity is approximately 102 cubic metres per hour (450 usgpm).
A full water balance study has been completed. The current estimated mine dewatering rate ranges from 500 cubic metres per day to 800 cubic metres per day depending on the season (i.e. heavier water inflow during spring months).
As the mine expands into new production areas (including deeper), additional pump stations will be constructed and will feed into the existing dewatering system.
16.13.5 Roadbed Material
The maintenance of roadways will be essential in reducing the mobile equipment operating and maintenance costs and achieving high haulage truck availability.
Crushed/screened rock will be sourced from local contractors for use underground and will be delivered underground and distributed via production equipment and spread using the existing grader.
16.14 MATERIALS SUPPLY
The TWM is well positioned in the established Timmins mining district. Consumable materials and external services required to support the mining operation will continue to be sourced from local
159
businesses or from other nearby mining centres (such as Sudbury, Kirkland Lake, North Bay, and Rouyn-Noranda). A number of contracts have been established to support current site activities and these will be amended as required.
16.15 MAINTENANCE
There are existing maintenance facilities on surface to support maintenance of surface equipment and smaller fixed plant equipment brought to surface from underground.
An underground maintenance shop has been constructed and equipped at the Timmins Deposit 650L. Mobile equipment will be brought to the shop for servicing, preventive maintenance, and repairs. A mechanic will be available (each shift) to service certain mobile equipment (such as longhole drills and jumbos) and tend to minor breakdowns in the field. Fueling and lubricant facilities will be available at 650L, 525L, and 200L.
16.16 SAFETY
The site has existing health and safety programs in place as required by the Ontario Occupational Health and Safety Act and Regulations for Mines and Mining Plants. There is an existing Joint Health and Safety Committee, Mine Rescue Team, and training facilities.
There is currently a full time Safety Coordinator on site and this position will remain filled for LOM operations. The Safety Coordinator will maintain site safety programs and initiatives. There will be two trainers on staff.
16.17 GEOTECHNICAL
A geotechnical engineering consultant; Mine Design Engineering (MDEng) has been providing geotechnical support to LSG for TWM since the start of development. MDEng has completed underground field work to assess rock mass properties and conditions and visits the mine annually to update the data collection database as new mining areas are developed. Geotechnical data collection has been used for classifying the rockmass and evaluating stope stability [primarily using the Stability Graph Analysis Method (Hoek et al. 1995)]. In general, stopes have been designed to be stable without the requirement for secondary ground support.
Recent geotechnical work has focused on a review of the current minimum ground support standards at TWM. The review has been based on an updated structural analysis and rock mass classification completed subsequent to a Timmins Deposit (650 Level to 790 Level) geotechnical mapping program in March 2013.
Assessment of geotechnical scanline mapping data, acquired by MDEng during the March 2013 mapping campaign, has resolved that:
· Two structural domains occur; these correspond to the major lithological units which have been mapped.
· Mafic volcanic unit: Major joint sets include A/A’ (a bi-polar set dipping steeply to the north-northwest) and C (an inclined set dipping to the southeast). Minor joint sets include B’ (inclined dipping southwest) and C’ (shallow dipping to the south). Joint set C was observed only on levels 710 and below, and joint set C’ observed only above level 710.
160
· Ultramafic (Pyroxenite) unit: Major joint sets include A/A’ (a bi-polar set dipping steeply to the north-northwest) and B (steeply dipping to the east-southeast). There is a marked increase in random jointing in the ultramafic unit compared to the mafic unit.
· A fold was identified within the data and occurs within all structural domains. The orientation of observed shears, faults and foliation structures are almost exclusively related to the orientation of this folding. Jointing appears to be strongly related to this fold event; poles to sets A, A’ and B’ all plot along the great circle to the fold hinge, and set C is roughly perpendicular to the fold axis.
· Ground conditions at Timmins Mine range from very poor to good, and are typically poor. This classification is in part influenced by the assigned Strength Reduction Factor (SRF = 7.5, corresponding to “mild rockbursting” and σ1/UCS = 2.5 to 5). No significant stress induced damage has been observed at Timmins Mine to date, however strain bursting and minor mine induced stress damage have been observed at the Thunder Creek deposit at similar depths. It is reasonable to expect similar behaviour in the 650 — 790 levels at Timmins West as the extraction ratio increases.
In reviewing the minimum ground support standards for Timmins Mine, it has been found that:
· Current support standards for spans not exceeding 5.5 metres are adequate.
· Current support standards for spans 5.5 to 7.3 metres are adequate.
· Current support standards for 7.3 and 11 metre spans are deemed adequate. Based on recommendations from MDEng, super swellex (PM24 Swellex) or cable bolts (2 metre x 2 metre pattern) are being used (instead of spin cables) as secondary support.
· Current standards for bolting patterns on sidewalls not exceeding 5.5 metres high are adequate. It is recommended that screen be brought down to within 1.5 metres of the floor rather than the current standard which is to 1 metre past the shoulder. This screen practice has been applied.
· Based on recommendations from MDEng, welded wiremesh screen overlap has been increased to three squares (from two squares).
· Current support standards for raises are adequate, with the exception of hangingwall support in raises plunging towards 285°N to 045°N. In this case the hangingwall support pattern should be reduced to 1.2 metres x 1 metre (horizontal x vertical).
Current support systems include grouted rebar and spin cables. These provide stiff support, which is reasonable for moderate induced mining stresses. As mining progresses, higher mining induced stresses may lead to the requirement of dynamic support systems in various developments. It is recommended that three dimensional stress modelling be completed for Timmins Mine to assess the potential for high mine-induced stress magnitudes.
Routine geotechnical mapping is the fundamental basis for developing and maintaining a mine-wide geotechnical model of rock mass conditions. It is recommended that geotechnical mapping be continued for new development as mining operations continue to depth.
It is also recommended that routine inspections of the rock mass and ground support be completed in order to observe, and document changing conditions over the LOM.
The existing minimum ground support requirements at TWM are summarized in Table 16.15 and Table 16.16.
161
TABLE 16.15: SUMMARY OF GROUND SUPPORT MINIMUM REQUIREMENTS — LATERAL DEVELOPMENT
Span | | Surface | | Bolt Type | | Pattern | | Screen |
Less than 5.5 m | | Back | | 1.8 m #6 Rebar | | 1.2 m x 1.2 m | | #9 AWG Screen. 3 squares overlap. All rebar within screen. Screen must extend 1 metre past shoulders. |
| Wall | | 1.8 m #6 Rebar
Bottom row 1.5 m x 35 mm Friction Bolt | | 1.2 m x 1.2 m | | Screen must extend 1 metre past shoulders. Use 0/0 straps on brows/corners. |
5.5 m to 7.3 m | | Back | | 2.4 m #6 Rebar | | 1.2 m x 1.2 m | | #9 AWG Screen. 3 squares overlap. All rebar within screen. Screen must extend 1 metre past shoulders. |
| Wall | | 1.8 m #6 Rebar
Bottom row 1.5 m x 35 mm Friction Bolt | | 1.2 m x 1.2 m | | Screen must extend 1 metre past shoulders. Use 0/0 straps on brows/corners. |
7.3 m to 11 m | | Back | | 2.4 m #6 Rebar
3.7 m PM24 Swellex | | 1.2 m x 1.2 m
2.0 m x 2.0 m | | #9 AWG Screen. 3 squares overlap. All rebar within screen. Screen must extend 1 metre past shoulders. |
| Walls | | 1.8 m #6 Rebar
Bottom row 1.5 m x 35 mm Friction Bolt | | 1.2 m x 1.2 m | | Screen must extend 1 metre past shoulders. Use 0/0 straps on brows/corners. |
TABLE 16.16: SUMMARY OF GROUND SUPPORT MINIMUM REQUIREMENTS — RAISES
Type | | Surface | | Bolt Type | | Pattern | | Screen/Straps |
Conventional Raise (up to 2.5 m span) | | HW | | 1.2 m #6 Rebar | | 1.2 m x 1.2 m | | #0 Gauge Straps. 2 rows. |
| Wall | | 1.2 m Mechanical Bolts | | 1.2 m x 1.2 m | | None |
| Face | | 1.2 m Mechanical Bolts | | 1.2 m x 1.2 m | | None |
Alimak Raises (up to 2.5 m span) | | HW | | 1.5 m #6 Rebar | | 1.2 m x 1.2 m | | #9 Gauge welded wire mesh.
3 squares overlap. |
| Wall | | 1.5 m #6 Rebar | | 1.2 m x 1.2 m | | #9 Gauge welded wire mesh.
3 squares overlap. |
| Face | | 1.5 m x 35 mm Friction Bolt | | 1.2 m x 1.2 m | | #9 Gauge welded wire mesh.
3 squares overlap. |
16.18 BELL CREEK TAILINGS FACILITY
Ore mined to date from TWM has been milled at LSG’s existing Bell Creek Mill. All future ore mined from the TWM will also be processed at the Bell Creek Mill (refer to Item 17.0).
The Bell Creek tailings facility is part of the Bell Creek complex. The facility first received ore from the Bell Creek Mine in 1986 at an initial rate of 300 tonnes per day (tpd) and later increased to 1,500 tpd by 2002. Production from the Bell Creek Mine ceased in 2002 and the tailings facility was placed in a state of inactivity (care and maintenance) from 2002 to 2008. The Bell Creek Mill resumed operation in the last quarter of 2008 and the tailings facility was reactivated. The Bell Creek Mill currently processes ore from both the Bell Creek advanced exploration project and TWM at a nominal rate of over 3,000 tpd.
162
The tailings facility is located west of the Bell Creek Mill, covers an area of approximately 75 ha, and includes the following:
· Two tailings cells (Phase 1/2 cell, Phase 3 cell).
· Two clear water ponds (Clear Water Pond 2 constructed in 2013).
· Effluent treatment plant.
· North and south diversion ditches.
Tailings are pumped in a conventional slurry stream (40% to 45% solids) from the mill to the tailings facility for deposition.
The Bell Creek Mill has undergone an expansion to increase throughput capacity to over 3,000 tpd and commissioning started in August 2013. An additional clear water pond was constructed in 2013 to accommodate the increase in water demand of the mill. The Phase 4 tailings expansion is scheduled to begin in 2014. The newly expanded tailings facility will accommodate approximately 2Mt of storage and can be internally lifted for additional storage.
The Bell Creek Tailings facility is shown in Figure 16.11.
163
FIGURE 16.11: BELL CREEK TAILINGS FACILITY
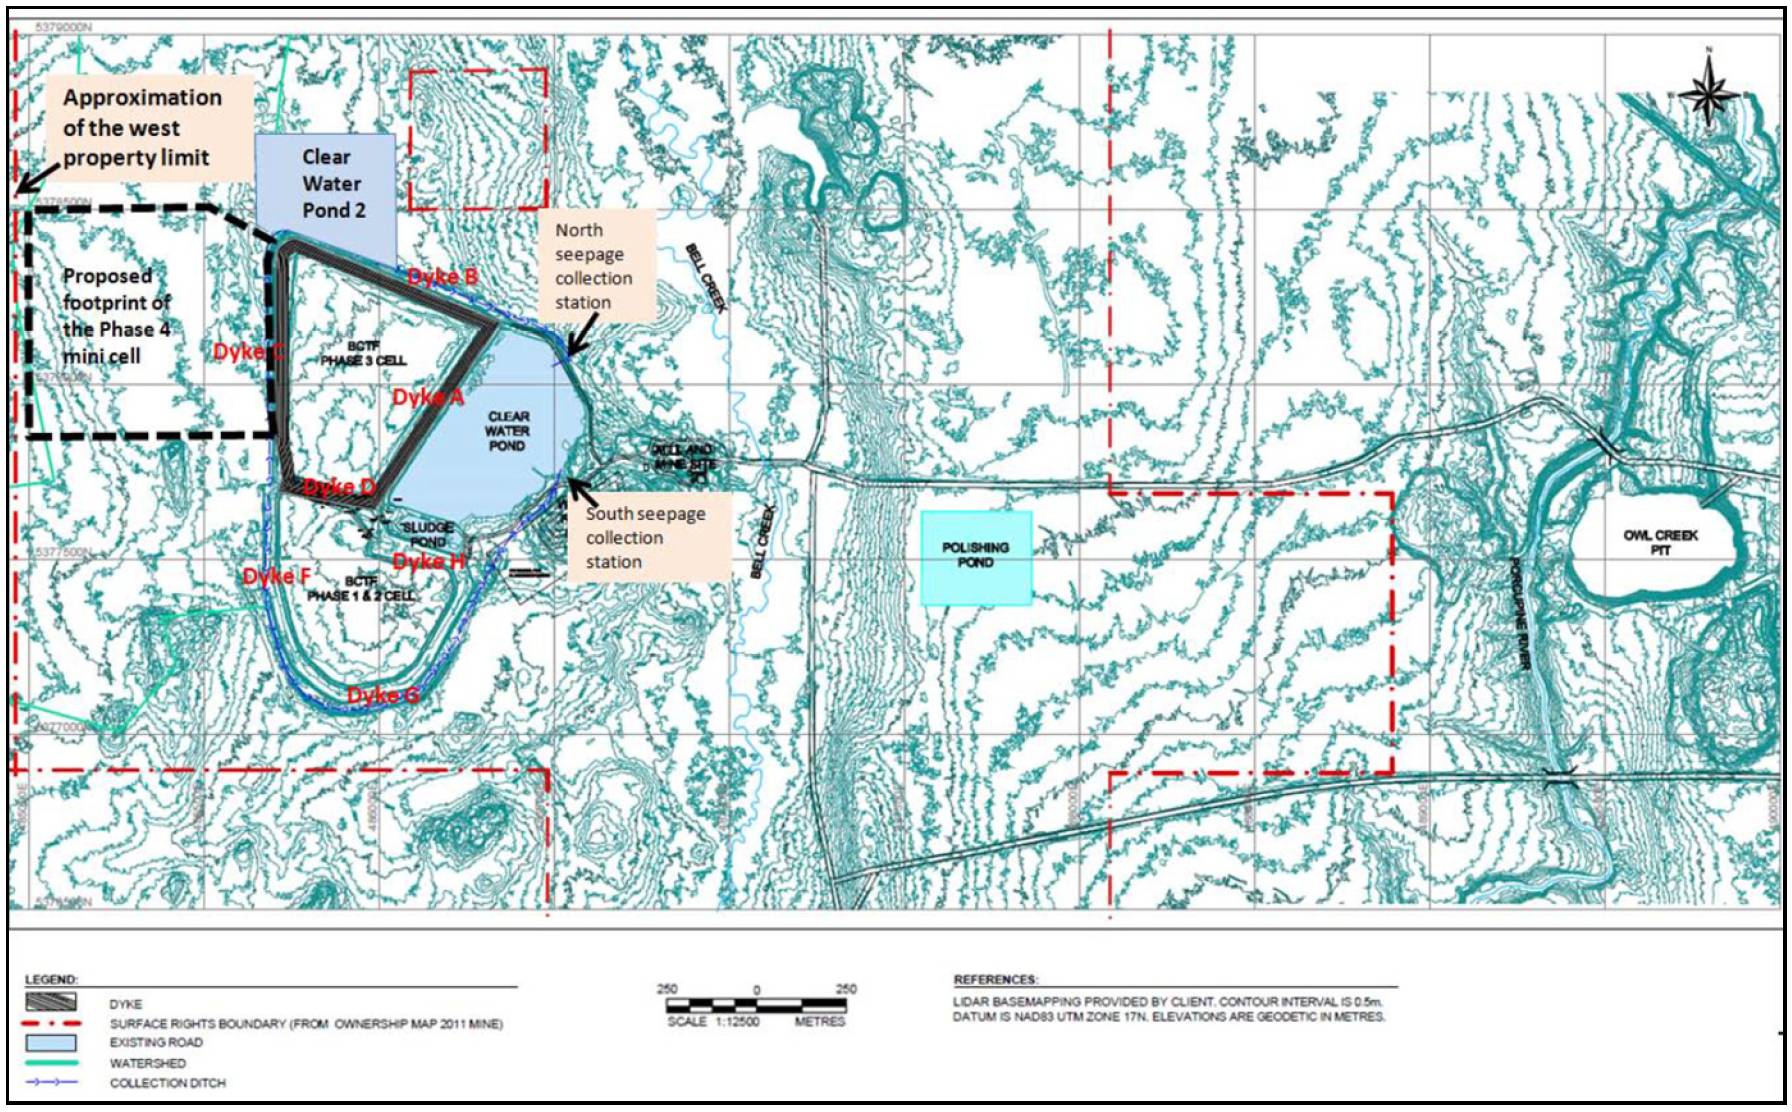
164
17.0 RECOVERY METHODS
Mineralized rock from the TWM is milled exclusively at the Bell Creek Mill located approximately 6.5 kilometres north of Highway 101 in South Porcupine, Ontario. The current over 3,000 tonne per day processing plant consists of a crushing circuit, two-stage grinding circuit, gravity recovery, pre-oxidation, cyanidation, CIL and CIP carbon adsorption, carbon stripping, and induction furnace refining. Ore from the TWM is trucked to the Bell Creek Milling facility. The round trip haul distance is approximately 112 kilometres.
17.1 HISTORY
The Bell Creek Mill was established as a conventional gold processing plant utilizing cyanidation with gravity and CIP recovery. Between 1987 and 1994 the mill processed 576,017 short tonnes of Bell Creek ore grading 0.196 ounce per short tonne Au (112,739 recovered ounces). The historical gold recovery was approximately 93 percent. Additional tonnage from the Marlhill Mine, Owl Creek open pit, and Hoyle Pond Mine was processed prior to the mill being placed on care and maintenance in 2002. During this period several improvements and additions were implemented to increase tonnage throughput from the original 350 tonnes per day to 1,500 tonnes per day. LSG purchased the mill in 2008 and re-commissioned the mill for operation in 2009 at 1,000 tonnes per day. The mill was expanded to 2,000 tonnes per day in the fourth quarter of 2010. The mill was again expanded to over 3,000 tonnes per day in during the third quarter 2013 and is currently operating at this level.
17.2 BELL CREEK MILL PROCESS DESCRIPTION
Mineralized rock is trucked to the Bell Creek Mill site from the TWM and is dumped directly onto a 16 inch grizzly, equipped with a rockbreaker to handle the oversized material. The ore is fed with an apron feeder to a C110 Metso jaw crusher, which crushes to a closed side setting of 6 inches. The discharge from the crusher is conveyed to the storage dome. The storage dome has a storage capacity of approximately 20,000 tonnes, approximately 6,000 tonnes of which is a live load. Ore is fed from the storage dome to the grinding circuit via three apron feeders which feed a single conveyor belt.
The grinding circuit consists of a 22 ft. diameter by 36.5 ft. length SAG mill, and a 12.5 ft. diameter by 14.5 ft. length regrind ball mill. The SAG mill is fed from the storage dome and is operated in closed circuit with a bank of four 20 inch cyclones, and a 30 inch Knelson concentrator. The SAG cyclone underflow (UF) returns to the SAG mill and a portion is fed to the 30 inch Knelson. The SAG cyclone overflow (OF) reports to the SAG cyclone OF box, which pumps to a set of four 10 inch dewatering cyclones. The dewatering cyclone UF goes to the regrind mill, while the dewatering cyclone OF goes to the thickener feed pump box. The regrind mill operates in closed circuit with a bank of ten 10 inch cyclones. The OF reports to the thickener feed pumpbox, while the UF reports back to the regrind mill, and a portion of the UF reports to the 20 inch Knelson. The gravity gold from the two Knelson concentrators reports to the gravity gold hoppers, which get pumped to the refinery for further processing. Target grind from the grinding circuit is 80% passing 200 mesh (74µm).
Flocculent is added to the combined cyclone overflow from both circuits and the slurry is pumped to the 20 metre diameter thickener, which thickens the slurry from approximately 30% solids by weight to approximately 55% solids by weight. The excess water is recycled back to the process. The thickened slurry is pumped to the leach circuit. The leach circuit consists of five agitated tanks in series with a total volume of 1,870 cubic metres. Cyanide is added to the fourth tank, the first three are used as pre-
165
oxidation tanks which have pure oxygen pumped into them, maintaining a high dissolved oxygen level in the slurry, which is required for the cyanide to dissolve the gold.
From the leach tanks, the slurry is pumped up to the three carbon-in-leach (CIL) tanks. The two newer tanks are approximately 2,800 m3, while the third is 2,950 m3. The first CIL tank has no carbon in it, while the last two contain 12 grams of carbon per litre of slurry. At a tonnage of 3,500 tonnes per day, the leaching retention time (Leach Tanks 4 and 5, as well as the CIL tanks) is 44 hours. Typically, the grade of the loaded carbon is in excess of 4,500 grams per tonne. Loaded carbon is pumped from #2 CIL tank, screened, washed, and then transferred to the loaded carbon tank. The strip vessel is located in the CIP circuit.
The slurry from the CIL tank reports to the carbon-in-pulp (CIP) circuit which consists of two parallel trains of three tanks with approximately 4 tonnes of activated carbon in each tank. The retention time is three hours based on a milling rate of 3,500 tonnes per day of ore. Recovery of the gold from the carbon is a batch process with carbon being stripped at a rate of 3.3 tonnes per batch. The turnaround time between batches is 24 hours. Carbon is cleaned with acid, or reactivated with the kiln or sent back to the CIP circuit.
The loaded solution from the strip circuit is passed through the two electrowinning cells in the refinery. The gold collects on the cathodes in a sludge form. The cell is washed weekly and the sludge is collected in filter bags and dried. The dried sludge is then mixed with reagents and melted in the induction furnace. Gold bullion bars are poured when the melt is completed.
The gravity gold material collected from the Knelson concentrator is transferred to the refinery and a shaker table is used to increase the gold content. The concentrate is then dried, reagents are added, and the material is melted in the induction furnace. The gravity concentrate and the CIP gold sludge are melted separately due to the differing amounts of reagents used in each.
17.3 METALLURGICAL BALANCE
A metallurgical balance is conducted daily based on the tonnage from the double toggle belt weightometer. The total tonnage, corrected for moisture, gravity gold weight, and assays from the daily sampling are used to produce the balance. All samples are assayed in accordance with typical assay standards and a QA/QC program is in place to ensure the integrity of the assay lab processes. The main components used to calculate the daily balance are the thickener underflow solids and solution, the weight of gravity gold collected, the estimated grade, and the tailings sample solids and solution. The daily metallurgical balance is a best estimate of daily production which must then be reconciled with the circuit inventory and bullion poured (this reconciliation is performed on a monthly basis). Only designated personnel perform the mill reconciliation. All areas of the circuit are sampled and percent solids are recorded for each slurry tank. Levels are recorded for all carbon bins and pregnant and barren tanks. As the carbon contains the majority of the gold in inventory, strict care is taken to ensure sampling is performed correctly.
The final clean out of the electro-winning cell is completed by the refiner or his designate, under security control. All sludge is collected and dried. The washed, dry cathodes from the cell are weighed and the weights are recorded to determine whether any plating buildup is occurring. The dried cell sludge and the gravity concentrate collected over the same period are smelted and bullion bars are poured. The
166
bars are stamped and weights are recorded and verified. Bullion samples are assayed at the Bell Creek Lab. These sample results are used in the metallurgical balance.
The simplified milling process and the sampling points are shown in Figure 17.1.
FIGURE 17.1: SIMPLIFIED MILLING PROCESS AND SAMPLING POINTS
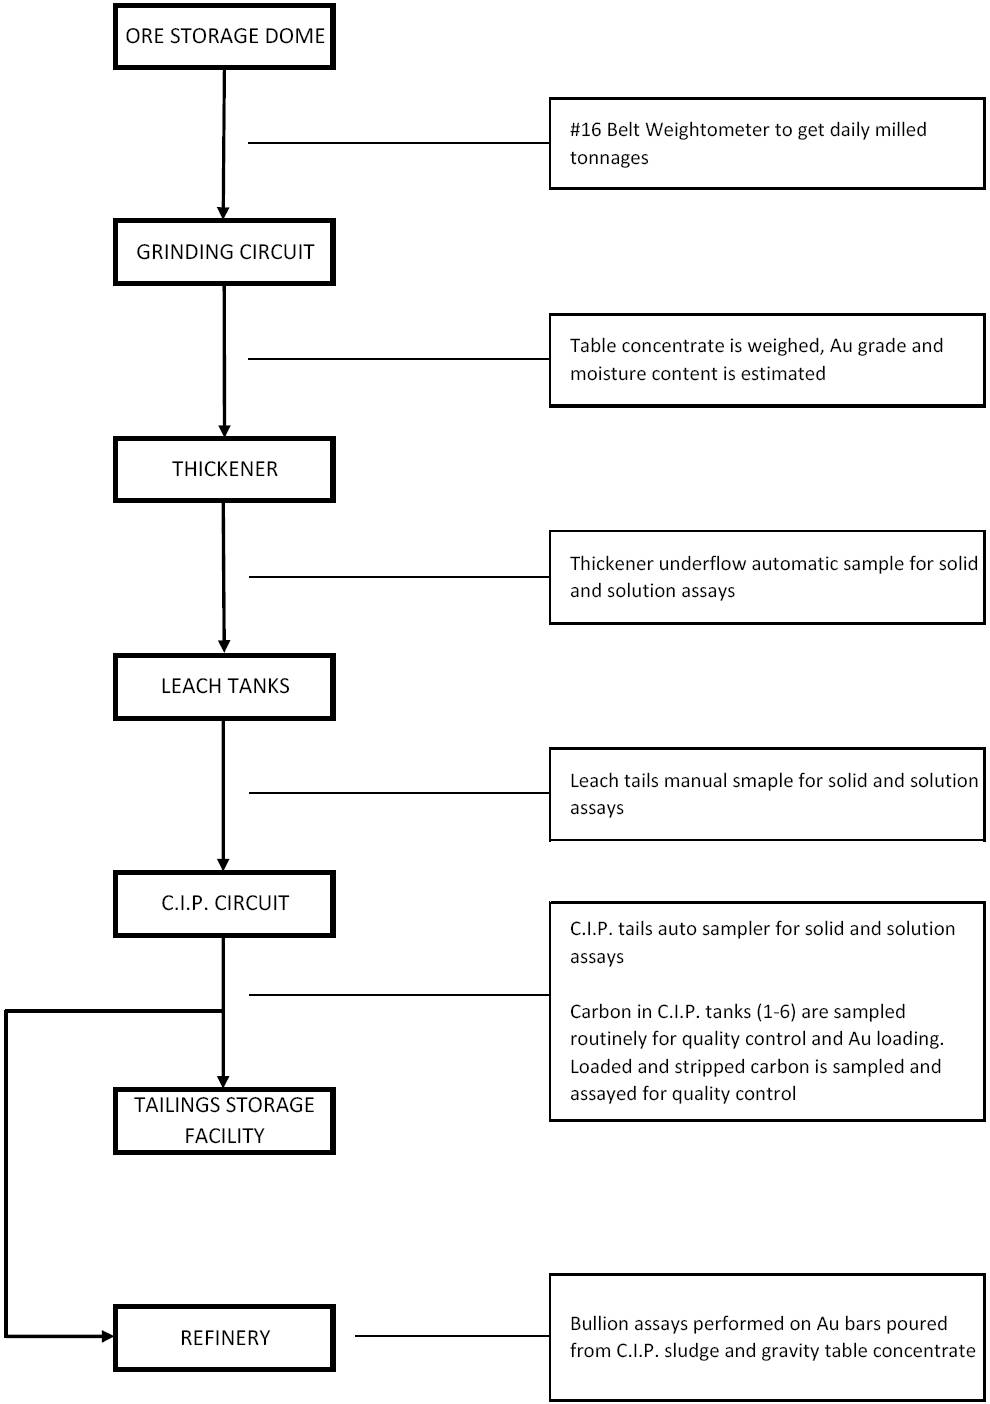
167
18.0 PROJECT INFRASTRUCTURE
18.1 TIMMINS WEST MINE SITE
The existing surface and underground infrastructure at the TWM site has been described in Item 16.
18.2 BELL CREEK MILL SITE
The existing infrastructure at the Bell Creek Mill site has been described in Item 16.18 (Bell Creek Tailings Facility) and Item 17.0 (Recovery Methods).
168
19.0 MARKET STUDIES AND CONTRACTS
Markets for the gold produced by the Company are readily available. These are mature, global markets with reputable smelters and refiners located throughout the world. Markets for doré are readily available.
According to the World Gold Council, the average gold price declined from 2012 to 2013 as investors in western markets exited their positions in gold exchange traded funds. Strong demand in jewelry from growing incomes in the emerging markets has continued to provide price support over the year.
The Company has numerous contracts with external third party entities, none of which are considered individually material to the overall economics of the Company.
169
20.0 ENVIRONMENTAL STUDIES, PERMITTING AND SOCIAL OR COMMUNITY IMPACT
20.1 REGULATORY AND FRAMEWORK
This section provides an overview of the environment related authorizations that are required for the operation of Timmins West Mine. Legislation related to routine operational monitoring, reporting, and notifications is not discussed herein.
20.1.1 Provincial Environmental Assessments
Mining projects, normally being private projects, are generally not subject to the Environmental Assessment Act unless designated. If a project becomes designated, then the project must complete an Individual Environmental Assessment (EA) prior to any permits being issued.
The provincial environmental assessment process is often triggered by specific components of a project rather than the entire project itself.
A Class EA process may apply to the project as a result of approvals under the Ministry of Natural Resources (MNR). Typically, Class EAs are required for work on roads and dikes, roads and water crossings, stream bank rehabilitation work, and related construction including dredging and filling activities. The Class EA must be completed prior to the issuance of the Land Use Permit or Work Permit under the Public Lands Act and the Lakes and Rivers Improvement Act, respectively.
Class EAs may also be triggered for approvals issued by the Ministry of Transportation (MTO) as a result of construction or re-alignment of a provincial highway during the development of a mining project. Some transmission lines and transformer station projects are also subject to review under the Class EA for minor transmission facilities.
20.1.2 Federal Environmental Assessments
The Canadian Environmental Assessment Act (CEAA) applies to mining projects for which the federal government exercises authority on some aspect of the Project. For the Timmins West Mine, these regulations are not applicable due to production being under the 4,000 tpd limit.
20.1.3 Provincial Permits
Ministry of Northern Development and Mines
Provincially, the Ministry of Northern Development and Mines (MNDM) is the lead agency for mining projects in Ontario. Mine production triggers requirements under Part VII of the Mining Act. These requirements include notifications, public and First Nations consultation, closure plans and financial assurance. Approval of a closure plan provides rights for the company to proceed under the Mining Act. Mine production is not allowed on unpatented mining claims and public notice is mandatory for mine production.
This process was brought to the forefront in October of 2010. During this time Lake Shore Gold conducted all the requirements mentioned in the above paragraph to obtain approval from the MNDM for their submission of a Production Closure Plan for the Timmins West Mine.
170
Ministry of the Environment
The Ministry of the Environment (MOE) issues permits to take water (both surface and groundwater), emissions of noise, dust, and discharge into the atmosphere. The MOE will administer the following permits for the Timmins West Mine Project:
· Wastewater treatment and effluent discharge from the mine process water, including construct and operate tailings impoundment — Ontario Water Resources Act (OWRA).
· Water taking permits — OWRA.
· Industrial Sewage Works Permit — OWRA.
· Solid waste management (waste generator registration) — Ontario Environmental Protection Act (EPA).
· Noise/air emissions — EPA.
Currently, the Timmins West Mine is operating under the following permits issued by the Ontario Ministry of the Environment:
· Permit to Take Water 6841-82UQ75 issued February 22, 2010.
· Certificate of Approval # 5028-89PJTR issued September 29, 2010.
· Certificate of Approval for Air and Noise # 3055-6WVLMG.
· Waste Generator # ON6594555.
Ministry of Natural Resources
The Ministry of Natural Resources (MNR) issues land use permits and work permits under the Public Lands Act and the Lakes and Rivers Improvement Act, respectively. The MNR will administer the following permits for the Timmins West Mine Project:
· Forest Resource Licence for the cutting of crown owned timber.
· Land use permits for such things as effluent ditches/pipelines, access roads, camps, etc., where the acquisition of crown lands is required — Public Lands Act (PLA).
· Work permits for such things as creek crossings or impoundment structures (dams) Lakes and Rivers Improvement Act (LRIA).
Ministry of Transportation
A private entrance permit was required from the Ministry of Transportation (MTO) for the entrance to the site which connects onto provincial Highway 101 West. This permit was approved in July 2008 and is currently active.
20.1.4 Federal Permits
Environment Canada
Environment Canada (EC) involvement in the permitting process begins with the submission of a production closure plan. At that time, they receive a copy of the plan for information purposes. EC does not usually comment on the production closure plan. When the mine began commercial production the Metal Mining Effluent Regulations (MMER) and Environmental Effect Monitoring came into force. This requires the operation to conduct additional monitoring of the discharge effluent as well as detailed aquatic, benthic, and sediment investigation on the receiver, in this case the Tatachikapika River.
171
20.2 ENVIRONMENTAL IMPACTS
Water management and protection of the cold water systems on and adjacent to the Timmins West Mine site were recognized from the onset of the project as primary environmental concerns. Preliminary design for Timmins West Mine includes the concept of managing rock that can be an acid generating risk within a containment facility and treating runoff in accordance with regulatory requirements before release to the environment. Timmins West Mine is regulated under both provincial and federal legislation.
The waste rock containment pad is designed to receive and contain rock from the underground workings that are identified as acid generating. All runoff from the site waste rock piles is contained within the footprint of the operation and treated through the treatment process prior to discharge to the natural environment. Mine water from the underground workings will also be directed to ponds and treated through the effluent treatment plant (ETP) prior to discharge. The treatment process will ensure that all COA criteria are met prior to discharging into the natural environment.
To protect Thunder Creek, and maintain flows within the system, un-impacted storm water is diverted away from Thunder Creek. Storm water is captured and treated prior to discharge to the natural environment.
The development of the mine will create a disturbance footprint on the terrestrial environment. Baseline work did not identify the possibility of provincially or federally listed fauna species on the site that will trigger concern. The Closure Plan will reduce this disturbance area at closure and disturbed areas will be rehabilitated with the intent of returning the site to a productive use (i.e. forestry) resulting in limited long-term impact to the area. The Timmins West Mine water management plan has been summarized in Figure 20.1, and the site plan is shown in Figure 20.2.
172
FIGURE 20.1: TIMMINS WEST MINE WATER MANAGEMENT PLAN
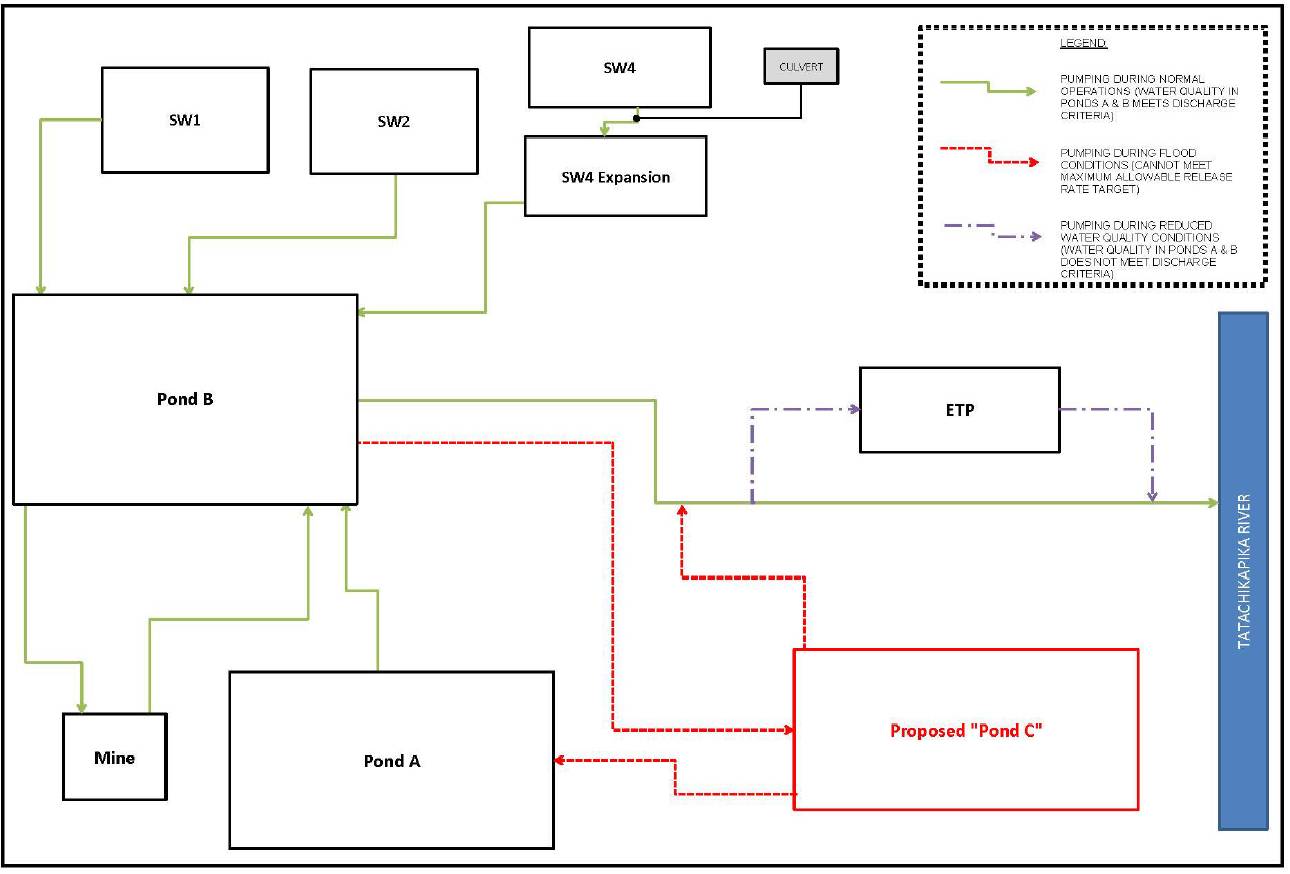
20.3 ENVIRONMENTAL MONITORING PROGRAM
Environmental monitoring will be conducted in accordance with regulatory and due diligence requirements. The monitoring program will be compiled in a Management System. General components of the environmental monitoring program are described in the bullets below.
· Thrice weekly sampling as per the Municipal Industrial Strategy for Abatement (MISA) and Certificate of Approval (COA) # 5028-89PJTR.
· Regular sampling and analyzing of storm water.
· Thrice weekly sampling of water collected from the mine water ponds.
· Semi-annual sampling and analysis of groundwater at the monitoring wells that have been installed at the site.
· Monthly water samples at reference and exposure areas on the Tatachikapika River as well as Thunder Creek as required by the COA # 5028-89PJTR.
· Annual updates to air dispersion model as changes are made to infrastructure at the site that discharges to air as required by COA # 1745-7WMRSZ.
· Annual calibrations of flow monitoring devices for effluent discharge.
· Assessment of sediment quality, benthic, and fish communities as required through the Metal Mining Effluent Regulation and Environmental Effects Monitoring.
· Recording and reporting of daily flows associated to Permits to Take Water for the underground workings.
173
FIGURE 20.2: SITE PLAN
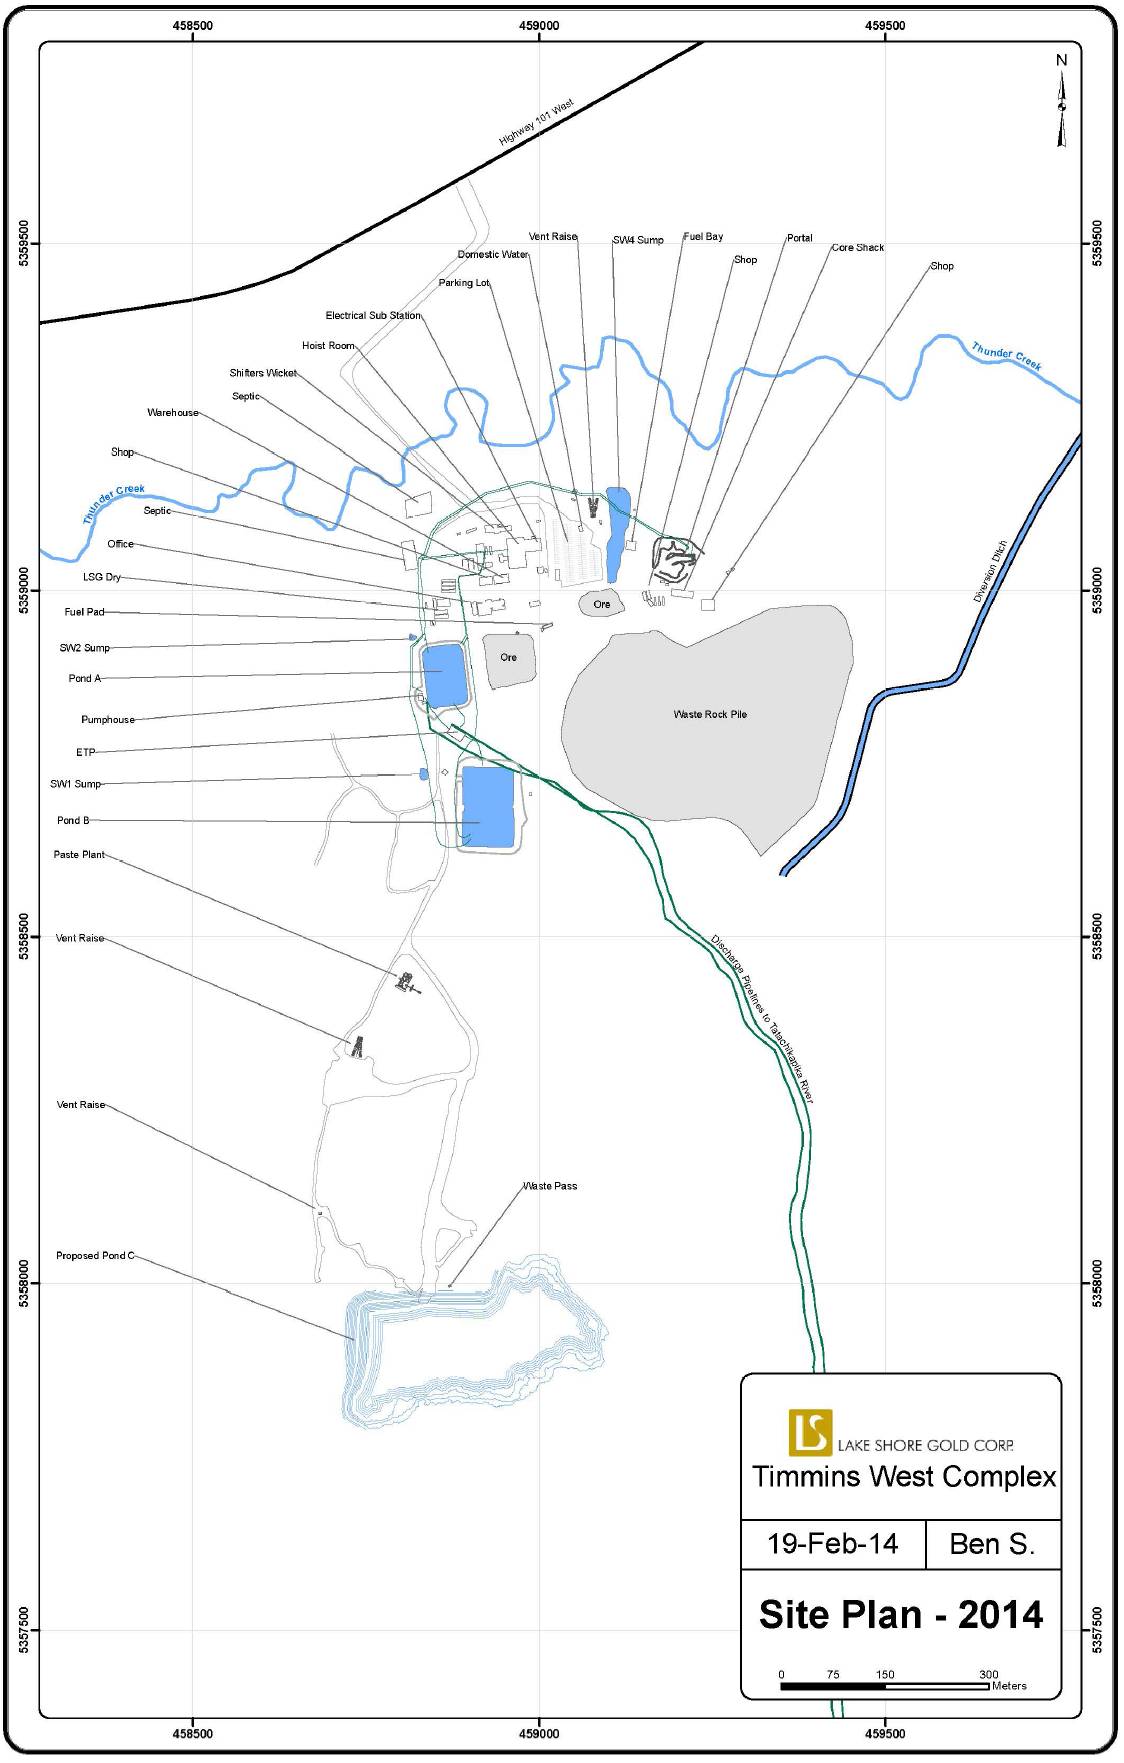
174
20.4 HAZARDOUS MATERIALS HANDLING
Effluent treatment reagents (i.e. acid, flocculent, carbon dioxide) will be stored in designated areas. Currently these materials are stored within the ETP and in accordance with their respective Material Safety Data Sheets (MSDS).
Drinking water treatment reagents (i.e. liquid sodium hypochlorite, alum, citric acid) will be stored within the water distribution plant on site and in accordance with their MSDS.
Bulk containers of petroleum products are stored in designated areas adjacent to the Maintenance Garage and hoist room. Spill trays are utilized for containment.
Fuel will be stored and handled in accordance with the Liquid Fuels Handling Code. Gasoline and diesel fuel will be stored in the tank farm and in portable, double-hulled tanks that are in accordance with TSSA. Propane is stored in above ground tanks.
There are no PCBs on any Lake Shore Gold properties.
With the exception of silica dust from development rock, there will be no designated substances at Timmins West Mine, as defined in the Occupational Health and Safety Act.
Explosives will be brought to Timmins West Mine on an as-needed basis. If it is necessary to store explosives at Timmins West Mine on surface, storage magazines will be contractor-owned and these will be accessed using existing secondary roads in the vicinity of the site. The storage location will be in accordance with requirements from Natural Resources Canada (i.e. minimum permissible distances, Explosives Act requirements) and the Ministry of Labour (i.e. Occupational Health and Safety Act requirements).
20.5 SPILL AND EMERGENCY RESPONSE PLAN
As part of the Safety and Environment Program, Lake Shore has prepared a Consolidated Spill Prevention Contingency and Response Plan (SPCR) for the Timmins West operations. This document provides a practical guide for preventing, controlling, and responding to spills. It has been prepared using guidelines provided by the Liquid Fuels Handling Code, the Canadian Environmental Protection Act, the Ontario Environmental Protection Act, the North American Emergency Response Guidebook, as well as standardized response procedures from petroleum product suppliers. Copies of this document are available in the Safety, Health, and Orientation Manuals, which are available in the field office, in Lake Shore vehicles, and from contractor supervisors. The SPCR is reviewed annually and updated as required.
20.6 CLOSURE PLANNING
Mine closure is the orderly safe and environmental conversion of an operating mine to a “closed-out” state.
The development of a walk-away, no active management scenario is a primary environmental management goal for this project. The long-term environmental management issues associated with the project have been identified in the Mining Act and relate to ore hoisted to surface, waste rock dumps, open holes to surface and overall construction of permanent structures. Other secondary
175
issues, such as returning the site to a productive use (i.e. forestry) will be accommodated within the context of the Closure Plan.
Should Lake Shore identify and require an area to store rock which poses a metal leaching risk, this will be conducted on the waste-rock containment pad during the life of the mine. Runoff from this low permeability pad will be directed to the containment pond, preventing a release of water with potentially high concentrations of metals. Water from the containment pond will be recycled for use as process water with the excess being treated and released to the environment in accordance with regulatory requirements. However, with the extensive sampling program initiated by the Timmins West Mine facility, the analytical data collected does not identify any potential acid generating or metal leaching issues.
At the conclusion of the mine life, the closeout rehabilitation measures summarized below will be implemented.
· Removal of surface buildings and associated infrastructure.
· Dewatering the ponds by pumping treated effluent through the approved discharge location.
· Breaching of existing ponds to all natural flows and remediated site drainage to their background watersheds.
· Allowing the underground workings to naturally submerge with local groundwater.
· Securing of mine openings in accordance with regulatory requirements.
· Contouring of waste rock.
· Contouring, covering, and re-vegetating disturbed areas using available overburden.
Infrastructure will be removed from the site and any other disturbed areas associated with the project will be re-vegetated, mainly through natural regeneration using seed banks in the overburden stored on site.
20.7 CONSULTATION
Consultation is being undertaken with regulatory agencies, the general public, the Métis Nation of Ontario, Wabun Tribal Council and the First Nation communities of Flying Post First Nation and Mattagami First Nation, who are represented by Wabun Tribal Council. Consultation provides an opportunity to identify and address the impacts of Lake Shore’s activities on external stakeholders, and to expedite the authorization process.
The consultations have been held in order to comply with Lake Shore corporate policy and the provincial requirements of Ontario Regulation 240/00 and the Environmental Bill of Rights.
An Impact and Benefits Agreement (“IBA”) has been negotiated and signed (February 17, 2011). The IBA outlines how Lake Shore Gold Corp. and the First Nations communities will work together in the following areas: education and training of First Nation community members, employment, business and contracting opportunities, financial considerations and environmental provisions.
176
21.0 CAPITAL AND OPERATING COSTS
The estimated capital and operating costs are presented in 2014 Canadian dollars and have been based on operating experience at the Timmins West Mine (TWM). The costs for 2014 have been developed through the TWM 2014 annual budget exercise and the estimated costs from 2015 through 2017 comprise the remaining life-of-mine (LOM) plan.
21.1 CAPITAL COSTS
The remaining LOM capital costs are generally sustaining capital and include the development, infrastructure, construction, equipment purchases/rebuilds, and an allocation of indirect costs required to support ongoing mining and expansion of the mine into new production areas for the LOM operation. The capital costs also include costs at the Bell Creek Milling facilities. The estimated LOM capital costs are summarized in Table 21.1.
TABLE 21.1: TIMMINS WEST MINE ESTIMATED LOM CAPITAL COSTS
Item | | Total
(‘000s) | |
TWM Capital | | | |
Environmental Projects | | $ | 4,000.0 | |
Ventilation Related | | $ | 445.2 | |
Raise Development | | $ | 4,476.8 | |
Underground Construction | | $ | 3,246.4 | |
Pastefill System | | $ | 339.8 | |
Electrical Related | | $ | 4,559.9 | |
Geology & Diamond Drilling | | $ | 23,060.7 | |
Fixed Plant | | $ | 410.0 | |
Critical Spares | | $ | 230.0 | |
Mobile Equipment | | $ | 9,311.0 | |
Ramp Development | | $ | 7,675.4 | |
Lateral Development | | $ | 7,668.8 | |
Indirect Costs Allocated to Capital | | $ | 17,964.4 | |
Contingency (15%) Infrastructure Projects | | $ | 999.0 | |
Subtotal TWM Capital | | $ | 84,387.5 | |
Subtotal Bell Creek Mill Related Projects | | $ | 9,388.1 | |
Total Estimated Capital Costs | | $ | 93,775.6 | |
Environmental Projects
Environmental projects include construction of an additional water pond on surface.
Ventilation Related
Ventilation related capital costs include ventilation bulkheads, doors, ventilation fans, and accessories.
Raise Development
Raise development quantities include all vertical development to support the mine design (conventional raises and drop raises developed for ventilation, egress, and material handling purposes). Raise
177
development will be completed by qualified mining contractors by either Alimak or Raise Boring methods, or for shorter raises, drop-raising.
The estimated unit cost for raise development has been based on recent experience at the TWM. The unit costs include contractor mobilization and demobilization, and the contractor’s indirect fees and profit.
Underground Construction
LSG personnel have planned and estimated the costs associated with certain capital projects related to the TWM (such as truck chutes, refuge stations, storage locations, rockbreakers, loading pocket, etc.). The estimated costs were developed by LSG operations and projects personnel with experience in the area, and have been based on operating experience and/or interaction with vendors/contractors.
Pastefill System
Capital costs related to the pastefill system include expansion of the main trunk of the system (boreholes and piping) as the mine expands into new production areas. Stope specific pastefill related costs are included in the operating costs.
Electrical Related
Capital costs related to electrical infrastructure include additional underground substations and main electrical cables into expanded areas of the mine.
Geology and Diamond Drilling
Diamond drilling and related labour and consumables for drilling Inferred resource (for potential conversion to Indicated) has been included in the capital costs.
Fixed Plant
Fixed plant includes replacement of skips, hoist rope, and dewatering pumps.
Critical Spares
Critical spares include replacement components for the hoisting system and main ventilation system.
Mobile Equipment
The capital costs related to mobile equipment includes purchase of new equipment to replace current fleet, rebuilds to current fleet, and any equipment leases.
Ramp Development
Ramp development quantities have been based on 3D mine design drawings prepared for the Timmins Deposit and Thunder Creek. Each production level in the mine will be accessed by the ramp system.
The estimated unit cost for ramp development has been developed from TWM operating experience using current labour rates (including wages and overhead), estimated mobile equipment operating costs, consumable materials quantities and costs, services materials, and anticipated productivities. The unit costs do not include haulage of the waste rock (identified separately).
Waste Infrastructure Development
Waste infrastructure development quantities have been based on 3D mine design drawings prepared for the Timmins Deposit and Thunder Creek. Waste development will include the initial sublevel access and
178
ancillary development (sumps, electrical substations, ventilation raise access, etc.), any footwall haulage drifts and the waste portion of access to the stopes (i.e. drawpoints).
The estimated unit cost for waste development has been developed from TWM operating experience using current LSG labour rates (including wages and overhead), mobile equipment operating costs, consumable materials quantities and costs, services materials, and anticipated productivities. The unit costs do not include haulage of the waste rock (identified separately).
Indirect Costs Allocated to Capital
Indirect costs include supervision labour, maintenance labour, mine services/construction labour, auxiliary mobile equipment operation/maintenance, power, propane, surface facilities operation/ maintenance, and hoisting plant operation/maintenance. A portion of indirect costs has been allocated to capital based on the percentage of tonnage resulting from capital development activities (including ramp, lateral, and raising), versus overall tonnes mined.
Bell Creek Mill Related
LSG personnel have identified and estimated the costs associated with mill site related initiatives at the Bell Creek Mill and tailings facilities. The estimated costs were developed by LSG operations and projects personnel with experience in the area, and have been based on operating experience and/or interaction with vendors/contractors.
21.2 OPERATING COSTS
The LOM operating costs will include both direct and indirect costs. The costs have been based on LSG’s operating experience at the TWM from 2011 through 2013.
Direct operating costs include waste development to access specific stopes, ore sill development, and stope production activities. All costs not directly related to mine construction, development, and production activities, have been included in the indirect operating costs.
The operating costs are summarized in Table 21.2.
TABLE 21.2: OPERATING COST SUMMARY
Item | | Total
(‘000s) | |
Surface General and Administration | | $ | 28,017.2 | |
Timmins Administration | | $ | 7,734.7 | |
Ammonia Treatment Plant | | $ | 622.3 | |
Power, Propane, Diesel Fuel | | $ | 26,637.7 | |
UG Indirect Labour (Supervision, Plant Maintenance, Services) | | $ | 24,830.0 | |
Hoist Plant related Labour and Maintenance | | $ | 5,152.6 | |
Electrical Materials | | $ | 1,495.7 | |
General Equipment Operation and Maintenance | | $ | 16,304.9 | |
Geology and Diamond Drilling | | $ | 9,465.7 | |
Ore Silling and Waste Rock Development | | $ | 14,236.5 | |
Stope Production | | $ | 48,485.8 | |
Backfill | | $ | 40,722.5 | |
Ore and Waste Rock Haulage | | $ | 9,546.6 | |
Surface Truck Haul to Bell Creek Mill | | $ | 22,292.0 | |
Milling at Bell Creek Mill | | $ | 74,550.4 | |
Total Operating Costs | | $ | 330,094.6 | |
Total Operating Costs (based on 3,332,164 tonnes mined) | | $ | 99.1/tonne | |
179
LSG Budgeted 2014 Operating Costs
LSG has prepared a 2014 budget and operating plan for the TWM. The operating plan includes the estimated direct and indirect operating costs to achieve production targets. This budget has been based on experiences gained through commercial production from 2011 through 2013 and evaluation of LOM mining requirements.
Surface General and Administration
Surface General and administration costs (GA) include:
· Site management (managers, superintendents, and support staff).
· Health and safety, mine rescue, engineering and environment, and surface support labour. The costs also include consumable materials for daily operations and training.
· Security personnel, insurance, rentals, laundry services, freight, etc.
· First Nations related.
Timmins Administration
Timmins administration includes off-site personnel located in Timmins. The Timmins administration group provides purchasing, contracts, human resources, and accounting support to the operation.
Ammonia Treatment Plant
Costs related to the operation of the Ammonia Treatment Plant (ATP).
Power, Propane, and Diesel Fuel
Costs related to power, propane, and diesel fuel.
Underground Indirect Labour (Supervision, Plant Maintenance, Services)
Wages and overhead costs related to underground supervision, fixed plant maintenance (electricians, millwrights, underground labourers, and shaft personnel).
Hoist Plant Related Labour and Maintenance
Wages and overhead costs related to hoistpersons and hoist maintenance personnel.
Electrical Materials
Primary electrical installations and consumables related to operating activities.
General Equipment Operation and Maintenance
Costs related to operation and maintenance of mobile and fixed plant equipment. The costs include mobile equipment maintenance labour.
180
Geology and Diamond Drilling
All labour, equipment operating/maintenance, consumables, and assaying/sampling related to mine geology.
Ore Silling and Waste Rock Development
The direct costs related to waste and ore sill development including:
· Direct labour.
· Drilling consumables (drill steel, bits, hammers, etc.).
· Explosives.
· Ground support supplies.
· Direct equipment operating costs (fuel and lubricants, tires, and spare parts) for the jumbo, scissor lift, and LHD.
· Services material and installation including pipe and ventilation duct.
· Miscellaneous materials required to support development activities.
Stope Production
The direct costs related to longhole and Mechanized Cut-and-Fill (MCAF) stoping including the labour, consumable materials, and equipment operating and maintenance associated with:
· For MCAF; developing the attack ramp to access mining cuts and each mining cut (similar to development).
· For longhole; drilling, loading, and blasting longholes (including drop raises) by a drilling contractor.
· For both mining methods; mucking from the stope with an LHD and tramming to a remuck or truck loading area or ore pass dump.
Ore and Waste Rock Haulage
Ore and waste rock haulage costs include labour and haul truck operating and maintenance costs associated with hauling to the Timmins Deposit rockbreaker station or (in the case of waste rock) to a stope for use as backfill.
Backfill
The operating costs related to the pastefill plant and underground distribution system as well as use of rockfill.
Surface Ore Haulage and Milling
Surface ore haulage costs from TWM to the Bell Creek Mill have been based on actual experience at the mine. A hauling contract is currently in place with a local contractor.
Bell Creek milling costs have been estimated based on actual milling cost experience.
181
22.0 ECONOMIC ANALYSIS
Lake Shore Gold Corp. (LSG) is a producing issuer as defined by NI 43-101.
The TWM is currently in production and this technical report does not include a material expansion of current production. An economic analysis has been excluded from this technical report.
182
23.0 ADJACENT PROPERTIES
23.1 GENERAL STATEMENT ABOUT ADJACENT PROPERTIES
The TWM is surrounded and contiguous with other LSG properties. In the immediate area of the TWM there is only one advanced project, Explor Resources Inc.’s Timmins Porcupine West Property.
The mineralized zones of the TWM within Bristol Township are situated between 20 to 38 kilometres southwest of the historical producing and past producing gold mines of the Porcupine Gold Camp. Table 23.1 summarizes the distance from the TWM headframe to a selected list of mines within the Timmins area.
TABLE 23.1: DISTANCE FROM THE TIMMINS WEST MINE HEADFRAME TO SIGNIFICANT TIMMINS AREA MINING LANDMARKS
Mine | | Distance (kilometres) | | General Direction |
Kidd Creek Mine | | 36.7 | | north-northeast |
Hoyle Pond Mine | | 37.2 | | north-northeast |
Dome Mine | | 24.8 | | northeast |
McIntyre Mine | | 22.1 | | north-northeast |
Hollinger Mine | | 20.4 | | north-northeast |
Bell Creek Mine Complex | | 33.7 | | north-northeast |
Gold River Project | | 3.5 | | south-southeast |
23.2 PELANGIO EXPLORATION INC. — POIRIER OPTION — BRISTOL TOWNSHIP
Two staked mineral claims with an area of 64 hectares are situated between the Meunier 144 property — Timmins Mine property and to the north of the Thunder Creek property portion of the TWM. The claims are underlain by mafic metavolcanic rocks belonging to the Tisdale assemblage. The MDI does not describe or locate a mineral occurrence on this property. On the company website, Pelangio report completing prospecting, and an MMI soil geochemical survey. The website states quartz veining and sulphides where noted on the property during the surveys. The location of the quartz veins and sample results are not available.
23.3 NEWCASTLE MINERALS LIMITED — WEST TIMMINS GOLD PROJECT — CARSCALLEN TOWNSHIP
The property consists of nine freehold patent claims covering an area of approximately 118 hectares in Carscallen Township. Newcastle Minerals Limited optioned the patents which have both mineral and surface rights, from Timmins Forest Products Limited in 2009. In May 2010, SGX Exploration entered into an agreement with Newcastle Minerals Limited to acquire an option to earn 75% interest in the nine patents. The east boundary of the Newcastle claims is situated 4 kilometres west of the Timmins Mine headframe.
The western portion of the claim group is underlain by mafic to intermediate metavolcanics belonging to the Deloro assemblage rocks. The central portion of the claims are underlain by felsic to intermediate metavolcanic rocks belonging to the Kidd-Munro Upper assemblage, and the southeastern portion of the claim group contains Tisdale assemblage mafic metavolcanic rocks.
183
The MDI does not locate a mineral occurrence on this property.
Work completed by Newcastle Minerals Inc. is summarized in Table 23.2. Diamond drilling targeted an explanation for geophysical anomalies. No assays greater than 1.0 gram were reported in the NI 43-101 report “Technical Report on the West Timmins Gold Project Carscallen Township, Porcupine Mining District, Ontario” authored by D.C. Leroux P.Geo. A.C.A. Howe International Ltd., September 26, 2011.
TABLE 23.2: SUMMARY OF WORK COMPLETED BY NEWCASTLE MINERALS LIMITED
Year | | Survey Type | | Comments |
2010 | | Total field magnetic response | | 13.7 kilometres |
| | Induced polarization and resistivity | | 13.7 kilometres |
| | MMI soil geochemistry | | 72 samples from 7 lines |
| | 7 BQ (35 mm diameter) diamond drill holes | | 1,516 metres |
| | Core samples for gold analysis | | 420 samples |
2011-09-30 | | 9 BQ diamond drill holes | | 2,032 metres |
| | Core samples for gold analysis | | 817 samples |
23.4 RICHMONT MINES INC. — CRIPPLE CREEK PROPERTY — DENTON TOWNSHIP
The northeast corner of the Cripple Creek property is approximately 5 kilometres southwest of the TWM headframe. Richmont acquired the project in 2002 and explored the property until 2005. Exploration activities resumed in 2010 over the project that consists of 26 staked claims, 43 claim units (688 hectares). The Ontario Mineral Deposits Inventory indicates four occurrences are located within the property. Gold was first discovered in the 1950s by R.E. Halpenny and the showing that bears his name (also known as Mahoney Creek-1984, MDI42A05SE00005). The local stratigraphic, as it is currently understood, is composed of a series of intercalated mafic and ultramafic and mafic metavolcanic flow units belonging to the Tisdale assemblage. Gold bearing quartz-carbonate veins occur within alteration zones at the mafic-ultramafic metavolcanic contact as well as in strained section of the mafic metavolcanics. Since the discovery of gold on the property the following companies have tested the property by means of diamond drilling, stripping, trenching overburden sampling, geophysical and geochemical surveys: Hollinger Consolidated Gold Mines Limited, Gambit Exploration, Gowest Amalgamated Resources Limited, Noranda Exploration Company Limited, Hemlo Gold Mines Inc., and Battle Mountain Gold. Three gold bearing areas have been identified: MDI42A05SE00056, the Cripple Creek Zone 16 referenced to Battle Mountain’s drill collar cc96-16; MDI42A05SE00057, the Cripple Creek Zone 17 also referenced to as Battle Mountain drill collar cc96-17; MDI42A05SE00058, the Mahoney Creek Zone reference with Hemlo Gold drill collar cc93-1.
Richmont Mines Inc., report that they have completed a two phase diamond drill program for a total of 8,032 metres of drilling. No resource estimate is reported for this property.
23.5 EXPLOR RESOURCES INC. — TIMMINS PORCUPINE WEST (ONTARIO) PROPERTY — BRISTOL AND OGDEN TOWNSHIPS
Explor Resources Inc. has 120 claims (204 claim units) totaling 3,264 hectares registered to their name in the area of the Timmins Porcupine West Project located in Bristol and Ogden Townships. The southwest corner of the claim group is situated approximately 4 kilometres from the TWM headframe. The 2010
184
provincial mineral deposits inventory locates nine mineral occurrences adjacent to the claim line or within the property boundary. These gold mineral occurrences are:
1. MDI42A06NW00055 – Mineral Estates Ltd (Waterhen Group) – 1930 (also known as: Torburn ddh no 2 – 1931; P. Hubert Claim P8504 – 1911; Hulcano Porcupine – 1946)
2. MDI42A06NW00195 – Cominco DDH BR-87-1 – 1987
3. MDI42A06NW00196 – Placer Dome DDH ###-## -####; (also known as: Cameco South Zone – 2002 and Cameco DDH BRS02-19-2002)
4. MDI42A06NW00197 – Cameco DDH BRS02-12 – 2002; (also known as: Cameco SW Zone – 2002)
5. MdI42A06NW00198 – Hoyle Mining DDH No. 1 – 1945; (also known as: Cameco DDH BRS02-14 – 2002)
6. MDI42A06NW00199 – Cameco Main Zone – 2002; (also known as: Bristol Project – 1998, and Placer Dome Project 246 – 1985)
7. MDI42A06NW00200 – Cameco DDH BRS02- 16 – 2002, or Cameco East Zone – 2002
8. MDI42A06NW00208 – Hollinger DDH B.O. # 3 – 1959
9. MDI42A05NE00024 – Foley-Obrien Claim 15462 – 1928 or the Wright Ventures Group – 1939
Cameco Gold Inc. geologists Babin, Samson, and Koziol (2002) describe the property geology as follows: “The property geology is marked by a southwest striking package of sediments which are bounded to the north by mafic volcanics and intruded in the central part of the property by a variably altered quartz-feldspar-porphyritic intrusion. The margins of the main porphyry body consist of porphyry dyke swarms of similar composition intruding the sediments. Recent age dating suggests that the mafic volcanic rocks on the north side of the property belong to the Tisdale Group (Ayers et al, 1999). The sediments consist of moderately chloritic interbedded sandstones and ±argillaceous mudstones, exhibiting well defined Bouma sequences away from the porphyry. The sandstone beds are more massive, crudely bedded and contain an appreciable percentage of quartz grains and granule size siliceous clasts. Some sediment horizons close or in contact with the porphyry contain up to 70% variably altered and deformed, granule to cobble size porphyry clasts similar to the main porphyry intrusion, surrounded by a sandstone matrix. The mafic volcanic/sediment contact is marked by graphitic argillite and interpreted to dip north based on limited drill hole information in that area of the property. Because of its generally coarse nature and its composition (rich in quartz grains and siliceous clasts), the sediment package is interpreted to be transitional between the Krist formation and the Porcupine Group sediments described in the Timmins area stratigraphy. Numerous late north-northwest trending diabase dykes of variable width crosscut all units.”
Langton et al. (2012) describe the property as marked by a southwest striking series of steeply north-dipping faults and zones of high-strain (Shear Zones) that parallel a moderate to strong foliation present in all the rocks except the diabase dykes. A quartz-feldspar porphyry intrudes the central part of the property and is itself intruded by a smaller, linear syenite body. The quartz-feldspar porphyry (QFP) is locally strongly altered by sericitic, chloritic, and carbonaceous alteration, and local silicification, where it is transected by high-strain zones.
The mineralization as being hosted by a series of strongly foliated, parallel structural zones interpreted to be striking southwest and dipping about 70 degrees northwest. Gold values are spatially associated with disseminated, fine-to-coarse grained subhedral pyrite. Chloritized bands of pyrite, chalcopyrite, and red sphalerite are locally cored by quartz-carbonate veins, which have been subsequently boudinaged. Not all pyrite is associated with gold mineralization. Visible gold has been recognized
185
occurring as free grains in chlorite, and quartz-carbonate veins, and as inclusions in pyrite and chalcopyrite (but not with sphalerite).
The area south and southwest of the QFP hosts several gold-anomalous zones associated with pyrite-pyrrhotite-red sphalerite stringers. This gold and zinc anomalous mineralization is distinct from the main pyrite-chalcopyrite mineralization seen in the central part of the main porphyry.
The chlorite alteration overprints the (earlier) sericite alteration, and late, quartz-chlorite-hematite-tourmaline veinlet stockworks locally crosscut the QFP, but there is no apparent correlation between the veinlets and the gold. Where the QFP is less deformed and sericitized the feldspar phenocrysts are preferentially epidotized, and the rock is generally more siliceous, highly fractured and blocky.
Explor Resources Inc. recently filed an updated NI 43-101 Technical Report in September 2013. The report has an effective date of July 1, 2013 and states an open pit resource of 4,283,000 tonnes grading at 1.6 g/t Au (213,000 oz Au) of Indicated and 1,140,000 tonnes grading at 2.1 g/t Au (77,000 oz Au) of Inferred Resource. The deposit also contains an underground component containing 4,420,000 tonnes grading at 2.8 g/t Au (396,000 oz Au) of Indicated and 5,185,000 tonnes grading at 2.4 g/t Au (393,000 oz Au) of Inferred Resource.
186
24.0 OTHER RELEVANT DATA AND INFORMATION
No additional information or explanation is necessary to make this Technical Report understandable and not misleading.
187
25.0 INTERPRETATION AND CONCLUSIONS
An updated resource estimate has been completed for the Timmins Mine since the last estimate in March 2013, using new information from drilling, development, and mining since that time.
The Timmins West Mine Resource totals 4.36 Mt at 5.09 g/t Au, amounting to 714,633 ounces of gold in the Indicated category and 2.94 Mt at 5.46 g/t Au amounting to 516,339 ounces of gold in the Inferred category. The base case resources are estimated at a 1.5 g/t Au cut-off for both the Timmins Deposit and the Thunder Creek Deposit, which includes internal dilution to maintain zone continuity.
The drilling, development and mining completed since the last resource/reserve update in March 2013, indicates a significant decrease in resource and reserve ounces. The decrease results from a number of factors including mining depletion, a lack of new exploration drilling over the past two years, and a reduction in the assumed average weighted gold price ($1,150 per ounce versus $1,500 per ounce in the March 2013 update). The decrease also reflects the results of extensive definition drilling which have indicated lower grades and changes in the interpretation in the geology in some areas. The effect of the lower grades is changes to resource shapes and the removal of certain low grade sections of the new models. The estimate also reflects the removal of zones from the resource model which are considered unmineable or uneconomic as well as the use of more conservative projection of grades, especially near zone boundaries.
Sensitivities to cut-off were run at 0.50 g/t Au increments from 0.00 g/t Au to 7.00 g/t Au and are summarized for unclassified Resources in Figure 25.1 and Figure 25.2. Both figures show unclassified tonnages and grade for the fully depleted resource. Stockpiled tonnages and grades are not included.
At the higher cut-offs, the zones become patchy and less continuous which implies the best approach to use for mining is a reduced cut-off grade. The base case resource stated at a grade of 1.5 g/t Au, attempts to introduce some level of selectivity to the mining of the resource, yet maintain continuity of the zone. The company is conducting additional work to optimize this cut-off, as well as grade and mining recovery for all zones mined.
188
FIGURE 25.1: GRADE-TONNAGE GRAPH AS A FUNCTION OF CUT-OFF GRADE (TIMMINS DEPOSIT)
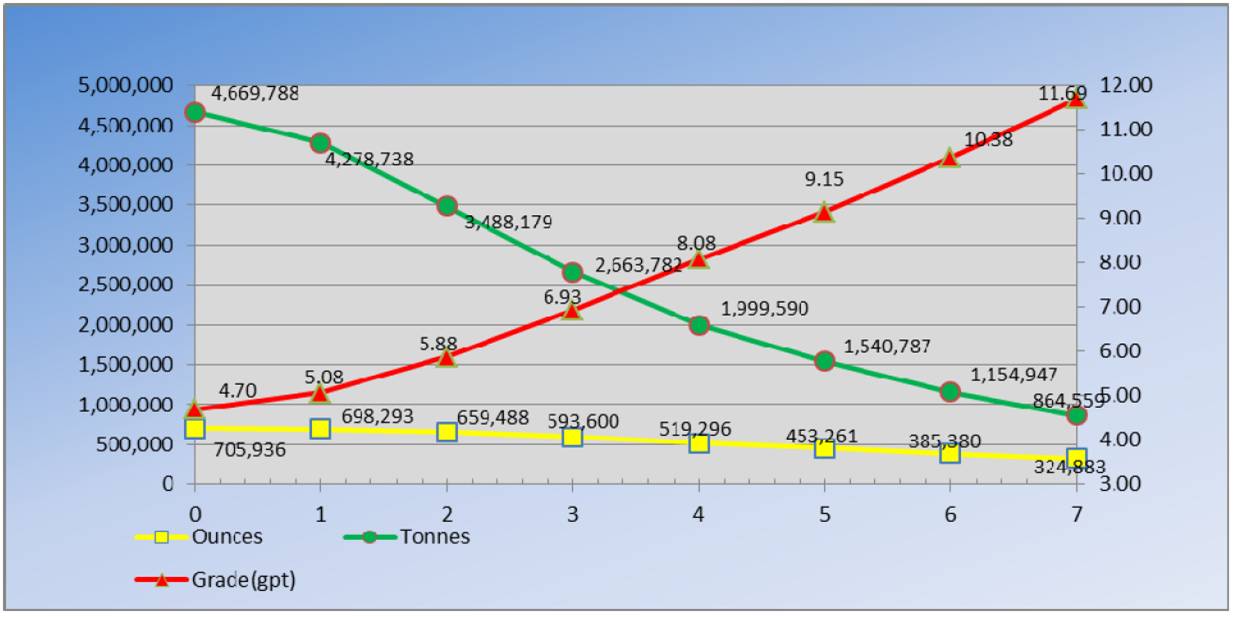
FIGURE 25.2: GRADE-TONNAGE GRAPH AS A FUNCTION OF CUT-OFF GRADE (THUNDER CREEK)
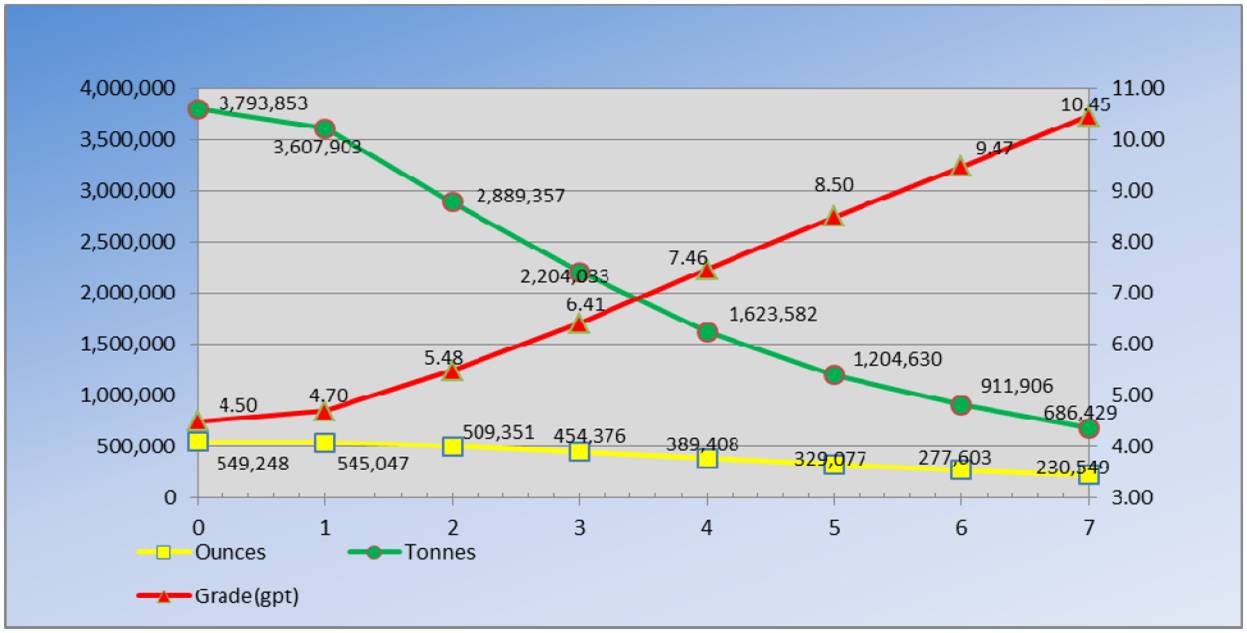
A review of the QA/QC samples routinely introduced into the drill hole sample stream, has concluded that the quality of the assaying introduced into the block model is satisfactory demonstrating no significant bias and adequate precision and reproducibility.
Several steps were taken in order to review and validate the current block model and reported results which included: comparison of solid model and block model volumes, comparison of the block model against diamond drill results, checking with nearest neighbor estimates and comparisons against recent production data. A review was also carried out by SGS Canada to confirm new estimation as well as help understand reasons for recent changes to the resource. Based on the work done internally and by SGS
189
Canada, the estimation shows high variability of grades on a local scale within the resource model but contains no significant errors and follows industry guidelines.
Subsequent to the closing of the Timmins Mine and Thunder Creek databases, additional drilling was completed. This drilling is not likely to have a significant effect on the overall resource reported.
The mine design used for the updated reserve estimate has been based on concepts presented in the PFS (completed in May 2012), existing surface and underground infrastructure, and operating experience gained since commercial production commenced in 2011. The majority of the main mine infrastructure (surface and underground) is in place, most equipment has been purchased, and the Bell Creek Mill expansion project has been completed to meet current production requirements. TWM successfully uses the longhole mining method which is commonly used worldwide for deposits with similar geometry and conditions. The operation also uses common, proven mining equipment and has experienced management and mine operations personnel. The Timmins area has a significant, well-established mining service/supply industry to support the operation.
Through three years of operating experience, TWM has implemented the systems and programs (i.e. health and safety, environment, training, maintenance, operating procedures, etc.) necessary to sustain production. This experience has also provided a solid basis for estimating the capital and operating costs used in preparation of the LOM plan.
To estimate the reserves, the following steps (summarized at a high-level) were used by mine planning personnel. The Indicated Resources were isolated (from Inferred material) from the resource models and assessments were made of the geometry and continuity of each of the mineralized zones. Geotechnical evaluations completed over the last three years were taken into account in the assessment and assignment of appropriate mining methods and stope sizes. Individual stope designs (wireframes) were then created in three dimensions. These stope wireframes were queried against the block models to determine the in-situ resource. This allowed for fair inclusion of internal dilution from both low grade and barren material. Additional factors were assigned for external dilution (with or without grade) dependent on the specific mining method and geometry of each stoping unit being evaluated. Finally, a recovery factor was assigned to the overall reserves to allow for in-stope and mining process losses. Stope cut-off grades were estimated to determine which stopes to include in the reserves. Detailed mine development layouts and construction activities were assigned to provide access to each of the stoping units. A detailed LOM development and production schedule was prepared to estimate the annual tonnes, average grade, and ounces mined to surface. Development, construction, and production costs were estimated to allow an economic assessment to be made comparing the capital and operating expenses required for each area to the expected revenue stream to ensure economic viability.
It should be noted that all capital costs required for all surface and underground facilities at TWM and the Bell Creek Mill facility have been included in the LOM plan. It should also be noted that no contributions from the Bell Creek mining operations (positive or negative) have been considered.
Key outcomes of the LOM plan include an updated reserves estimate of approximately 3.3 million tonnes grading grading 4.6 g/t (approximately 492,250 ounces). The reserves support a mining plan at a production rate of approximately 2,800 tonnes per day through 2016, before ramping down and ending in 2017. The reserves can be extracted at an estimated average operating cost of $99.1 per tonne with estimated sustaining capital costs of approximately $93.8 million.
190
25.1 RISKS
The resource base for the engineering and cost estimates used to develop the 2014 budget and LOM plan to support the updated reserve statement in this report includes material in the Indicated Resource category only.
The realized grade in any mining plan has the greatest impact on financial returns. Ongoing diamond drilling programs are planned and will need to be funded to reduce this risk going forward.
Gold prices are subject to significant fluctuation and are affected by a number of factors which are beyond the control of LSG. Lower than predicted gold prices could increase the stope cut-off grade and reduce the reserves.
Currency fluctuations are also affected by factors which are beyond the control of LSG. Stronger than predicted Canadian dollar (versus the US dollar) could increase the stope cut-off grade and reduce the reserves.
Operating and capital costs determined as the basis for estimating the reserves have been based on actual performance metrics of the operation in 2011 through to 2013. These factors are considered low risk elements and have intrinsically less impact on financial returns.
Social, political, and environmental factors are all considered to be low risk factors for the Timmins West Mine.
191
26.0 RECOMMENDATIONS
Based on work carried out during the new resource update, a number of recommendations have been identified and are listed below:
1. The company will conduct a study to assess the opportunity to increase the conversion of resources to reserves going forward, by mining at a lower cut-off grade.
2. Recent data validation has indicated some issues with collar and downhole survey information for diamond drill holes completed prior to March 2013 due to interference from magnetic rocks. Work was completed to check and re-survey holes and new tools implemented for areas affecting near-term mining. Additional work should be conducted to check holes in other areas.
3. Review of S.G. data indicates the number of readings is still quite low and that there can be large variations between different zones. As a result, it is recommended that the company undertake an immediate program to collect a larger database of information of S.G. data.
4. Comparison of the block model against production data indicates several factors which could be contributing to local large variations for individual stopes including high variability of gold distribution within zones being mined, uncertainties with tracking and assigning muck accurately back to individual stopes due to blending and milling ore from multiple sources at the Bell Creek Mill and local uncertainties regarding final stope shapes blasted and quantities of muck extracted. Work should be carried out to address the above items should be carried out going forward.
5. The new resource estimation shows large variations in grade distribution within resource solids. Work should be completed to implement alternative estimation methods such as ordinary kringing, as well as ways of optimizing cutoff grades and local grade estimates.
6. Successful mining will be highly dependent on the timely completion of drilling to support both delineation and exploration. A list of some of the key targets to be tested as well as a reasonable cost estimate to complete is provided below:
Timmins Deposit (Total Cost Estimate $9.4 million, Total 74,300 Metres of Drilling)
1. Delineation between 810 and 900 metre levels - 39,300 metres, $4,205,100 (@$107/metre)
2. Exploration below 900 metre level -5,000 metres, $535,000 (@$107/metre)
3. Exploration from 790 S2 fold nose Exploration Drift - 12,000 metres, $1,080,000 (@$90/metre)
4. Exploration from 830 metre level Drill Drift to test favorable Ultramafic/Mafic and Sediment contact between Timmins Mine and Thunder Creek -8,000 metres, $720,000 (@$90/metre)
5. Exploration surface drilling to test the deep extension of the Timmins Mine resource below the 1,340 metre level – 5,000 metres, $2,250,000 (@$450/metre).
6. Exploration surface drilling to the northeast of the Timmins Mine Deposit – 5,000 metres, $625,000 (@$125/metre).
Thunder Creek (Total Cost Estimate $4.2 million, Total 38,000 Metres of Drilling)
1. Delineation drilling Rusk and Porphyry Zones between 660 and 520 metre level – 11,000 metres, $1,177,000 (@$107/metre)
2. Delineation drilling Rusk and Porphyry Zones above 520 metre level – 4,000 metres, $428,000 (@$107/metre)
3. Delineation drilling Rusk and Porphyry Zones between 765 and 1,030 metre level – 10,000 metres, $1,070,000 (@$107/metres)
4. Exploration drilling west Thunder Creek Deposit from 710 metre level Exploration Drift – 3,000 metres, $321,000 (@$107/metre)
192
5. Exploration drilling west Thunder Creek Deposit from surface – 10,000 metres, $1,250,000 (@$125/metre)
In addition to the above, closer spaced definition drilling for stope design will be locally required as mining is progressing.
193
27.0 REFERENCES
27.1 REPORTS AND SCHEDULES
Accurassay Laboratories Ltd., 2011; Schedule of Services and Fees
ALS Laboratory Group, 2009 (CAD); Schedule of Services and Fees, ALS Minerals.
ALS Laboratory Group, 2011 (CAD); Schedule of Services and Fees, ALS Minerals.
Anglin, C. D., 1992; Sm-Nd and Sr Isotope Studies of Scheelite from some Superior Province Gold Deposits; a thesis submitted to the Faculty of Graduate Studies and Research in partial fulfillment of the requirements for the degree of Doctor of Philosophy, Ottawa-Carleton Geoscience Centre and Department of Earth Science, Carleton University, Ottawa, Ontario.
Ayer, J., Berger, B., Johns, G., Trowell, N., Born, P., Mueller, W.U., 1999; Late Archean Rock Types and Controls On Gold Mineralization In The Southern Abitibi Greenstone Belt Of Ontario; Field Trip B3 Guidebook, Geological Association of Canada (GAC), Mineralogical Association of Canada (MAC), Joint Annual Meeting, 1999, Sudbury, Ontario, Canada.
Ayer, J.A., Baker, C.L., Kelly, R.I., Stott, G.M., Thurston, P.C., 1999; Summary of Field Work and Other Activities 1999; Ontario Geological Survey, Open File Report 6000, Queen’s Printer of Ontario.
Ayer, J.A., Trowell, N.F., Madon, Z., Kamo, S., Compilation of the Abitibi Greenstone Belt in the Timmins-Kirkland Lake Area; revision to stratigraphy and new geochronological results; p. (4) 1-14.
Ayer, J.A., Dubé, B., Trowell, N.F. 2009; NE Ontario Mines and Minerals Symposium, PowerPoint Presentation: Stratigraphic and Metallogenic Comparison of the Detour Burntbush area with the Southern Abitibi.
Ayer, J., Trowell, N., (OGS); Amelin, Y., Kamo, S. and Kwok, Y., (ROM), 2000; PowerPoint Presentation: Deep Crustal Structures in the Abitibi Greenstone Belt and their Prolonged Control on the Distribution of Stratigraphy and Mineral Deposits; Toronto, January 2000.
Ayer, J., Barr, E., Bleeker, W., Creaser, R.A., Hall, G., Ketchum, J.W.F., Powers, D., Salier, B., Still, A., Trowell, N.F, 2003; Discovery Abitibi, new geochronology results from the Timmins Area: Implications for the Timing of Late-Tectonic Stratigraphy, Magmatism and Gold Mineralization. Summary of field work and other activities, Ontario Geological Survey, Open File Report 6120, p. 33-1 to 33-11.
Ayer, J.A., Thurston, P.C., Bateman, R., Dubé, B., Gibson, H.L., Hamilton, M.A., Hathaway, B., Hocker, S.M., Houlé, M.G., Hudak, G., Ispolatov, V.O., Lafrance, B., Lesher, C.M., MacDonald, P.J., Péloquin, A.S., Piercey, S.J., Reed, L.E., Thompson, P.H., 2005; Overview of Results from Greenstone Architecture Project; Discovery Abitibi Initiative, Open File Report 6154, Ontario Geological Survey.
Barrie, C.T., 1992; Geology of the Kamiskotia Area, Ontario Geological Survey Open File Report 5829. P.33.
194
Bateman, R., Ayer, J.A., Dubé, B, Hamilton, M.A., 2005; the Timmins-Porcupine Gold Camp, Northern Ontario: The Anatomy of an Archean Greenstone Belt and its Gold Mineralization: Discovery Abitibi Initiative, Open File Report 6158, Ontario Geological Survey.
Brisbin, D.I., 1986; Geology of The Owl Creek and Hoyle Pond Gold Mines, Hoyle Township, Ontario, an independent project submitted to the Department of Geological Science Queen’s University, Kingston, Ontario, in conformity with the requirements of the Non-Research Masters of Science Degree in Mineral Exploration.
Brisbin, D.I., 1997; Geological Setting of Gold Deposits in the Porcupine Camp, Timmins, Ontario, a thesis submitted to the Department of Geological Science in conformity with the requirements for the degree of Doctor of Philosophy, Queens University, Kingston, Ontario.
Brisbin, D.I., 2000; World Class Intrusion Related Archean Vein Gold Deposits of the Porcupine Gold Camp, Timmins, Ontario, Geology and Ore Deposits 2000, The Great Basin and Beyond, Proceedings, Geological Society of Nevada Symposium Volume 1, p. Brisbin-19-35.
Burrows, A.G., 1911; the Porcupine Gold Area, Twentieth Annual Report of the Bureau of Mines, 1911, Vol. XX, Part II.
Burrows, A.G., and Rogers, W.R., 1912; Map of the Porcupine Gold Area, District of Temiskaming, Ontario; First Edition, July 1910; Second Edition, April 1911. Scale: 1:63,360. To accompany the Twentieth Report of the Bureau of Mines 1911.
Burrows, A.G., and Rogers, W.R., 1912; Map of the Porcupine Gold Area, District of Temiskaming, Ontario; First Edition, July 1910; Second Edition, April 1911; Third Edition June 1912. Scale: 1:63,360. To accompany the Twenty-first report of the Bureau of Mines, 1912.
Camier, J., 2009; Geological Mapping of the Peralkaline Syenite Intrusion and Host Rocks on the Thunder Creek Property, Lake Shore Gold Corp., Timmins, Ontario.
Cattarello Assayers Inc., 2011 Standard Operating Procedures, personal correspondence.
Cavey, G., 2004; Summary Geological Report On The Thorne Property, Bristol, Carscallen, Denton and Thorneloe Townships, Porcupine Mining Division, Ontario, for Band-Ore Resources Ltd. (December 04, 2004).
Cavey, G., 2006; Summary Geological Report On The Thorne Property, Bristol, Carscallen, Denton and Thorneloe Townships, Porcupine Mining Division, Ontario, for Band-Ore Resources Ltd. (March 30, 2006).
CIMM Standing Committee on Reserve Definitions, 2010; CIM Definition Standards — For Mineral Resource and Mineral Reserves, November 27, 2010.
Coad, P.R., Brisbin, D.I., Labine, R.J., Roussain, R.,1998; Geology of Owl Creek Gold Mine, Timmins, Ontario, CIMM Exploration and Mining Geol. Vol. 7, No. 4, p. 271-286.
195
Crick, D., Kusins, R., Powers, D., 2011; Technical Report on the Initial Mineral Resource Estimate for the Thunder Creek Property, Bristol Township, West of Timmins, Ontario, Canada, prepared for Lake Shore Gold Corp and West Timmins Mining Inc.
Dagbert, Michel: 2011; Statistical Analysis of QA/QC Assay Data, A Review and Report by SGS Canada Inc. Geostat.
Dagbert, Michel: 2011; Resource Modeling and Estimation of the Thunder Creek Gold Deposit, SGS Canada Inc. — Geostat, December 14. 2011.
Darling, G., 2007; Pre-feasibility Study Report, The Lake Shore Gold Timmins West Project, Timmins, Ontario, Lake Shore Gold Corp., SRK Consulting Canada Inc., SRK Project Number 5CL001.001, July 31st, 2007.
Darling, G., Kociumbas, M., Sullivan, J.R., Lavigne, J., Hayden, A.S., Small, A.S., Butler, D., Kordgharochorloo, F., Hall, R.A., Schmidt, P.R., 2007; NI 43-101 Technical Report, Lake Shore Gold Corp., Timmins West Project, Timmins, Ontario, Report Prepared for Lake Shore Gold Corp. by SRK Consulting Engineers and Scientists (October 12, 2007).
Darling, G., Fayram, T., Kusins, R., Samson, J., Miree, H., 2009; Updated NI 43-101 on the Timmins Mine Property, Ontario, Canada, prepared for: Lake Shore Gold Corp.
Dubois, M., and Brown, C., 2010; Lake Shore Gold Corp. Resistivity/Induced Polarization and Ground Magnetic Field Survey, Timmins West Mine Complex, Tailings Condemnation, Bristol and Thorneloe Townships, Ontario, Canada., Abitibi Geophysis
Easton, R.M., 2000; Geochronology of Ontario; Ontario Geological Survey, Miscellaneous Release Data 75.
Eastwood, A.M., 2004; 2004 Diamond Drill Program, Vogel Project, an internal memo Glencairn Gold Corporation.
Ferguson, S.A., 1957; Geology of Bristol Township, Sixty-Sixth Annual Report of the Ontario Department of Mines, being Volume LXVI, Part 7.
Ferguson, S.A., 1957; Bristol Township, District of Cochrane, Ontario; Ontario Department of Mines, Map 1957-7, scale 1:12,000.
Ferguson, S.A., 1968; Geology and Ore Deposits of Tisdale Township, Geological Report 58, Ontario Department of Mines.
Ferguson, S.A., Groen, H.A., Haynes, R., 1971; Gold Deposits of Ontario, Part 1, Districts of Algoma, Cochrane, Kenora, Rainy River and Thunder Bay, Ontario Department of Mines, Mineral Resources Circular No. 13, p. 49 — 50, 123 — 124.
Fyon, J.A., Breaks, F.W., Heather, K.B, Jackson, S.L., Muir, T.L., Stott, G.M., Thurston, P.C. 1991; Geology of Ontario, Special Volume 4, Part 2, Chapter 22,Metallogeny of Metallic Mineral Deposits in the Superior Province of Ontario, Ontario Geological Survey, p. 1091 to 1174.
196
Geldart, J., Bousfield, J., Dymov, I., 2005; An Investigation of The Recovery of Gold from Samples From the Timmins Property, prepared for Lake Shore Gold, LR 10669-001-Report No. 1, SGS Lakefield Research Limited.
Gray, D. Mathew, 1994; Multiple Gold Mineralizing Events In The Porcupine Mining District, Timmins Area, Ontario, Canada; A thesis submitted to the faculty and the Board of Trustees of the Colorado School of Mines in partial fulfillment of the requirements for the degree of Doctor of Philosophy (Geology).
Hawley, J.E., 1926; Thirty-Fifth Annual Report of the Ontario Department of Mines being Vol. XXXV, Part VI, 1926, p. 1 to 36.
Hawley, J.E., 1926; Map No. 35g, The Townships of Carscallen, Bristol and Ogden, District of Cochrane, Ontario, scale: 1:47520.
Hawley, J.E., 1926; ARM35G, The Townships of Carscallen, Bristol, and Ogden, District of Cochrane, Ontario, Map 35g, scale: 1:47,520, Ontario Department of Mines.
Hodder, R.W., Petruk, W., 1980; Geology of Canadian Gold Deposits, Proceedings of the CIM Gold Symposium, published for the Geology Division of CIM, Special Volume 24, The Canadian Institute of Mining and Metallurgy, p. 101 to 170.
Jackson, S.L., Fyon, J.A., 1991; Geology of Ontario, Special Volume 4, Part 1, Chapter 11, the Western Abitibi Subprovince in Ontario, Ontario Geological Survey p. 405 to 482.
Jackson, S.L., Fyon, J.A., 1991; Geology of Ontario, Special Volume 4, Part 2, Chapter 22, The Metallogeny of Metallic Mineral Deposits in the Superior Province of Ontario, Ontario Geological Survey, p. 1149.
Kerrich, R., 1983; Geochemistry of Gold Deposits in the Abitibi Greenstone Belt, Special Volume 27, Canadian Institute of Mining and Metallurgy.
Krikham, R.V., Sinclair, W.D., Thorpe, R.I., Duke, J.M., (editors) 1993; Mineral Deposit Modeling, Geological Association of Canada Special Paper 40, p. 465 to 479, and 635 to 678.
Lake Shore Gold Corp., 2011; Bell Creek Mill Laboratory Standard Operating Procedures.
Lake Shore Gold Corp., 2011; Internal Memo Regarding Permitting, T. Ternes; September 22.
Langton, J., Puritch, E., Yassa, A., Armstrong, T., 2112; National Instrument 43-101 Technical Report for Explor Resources Inc., on Timmins Porcupine West Property, Bristol and Ogden Townships, Ontario, MRB & Associates, and P&E Mining Consultants.
Leroux, D.C., 2011; Technical Report on the West Timmins Gold Project, Carscallen Township, Porcupine Mining District, Ontario; A.C.A. Howe International Limited; for Newcastle Minerals Limited.
Lo, Bob, 2011; Tailings IP Results, an internal Lake Shore Gold Corp. memo.
197
Lucas, S.B., and St-Onge, M.R. Coordination, 1998; Geology of Canada No. 7, Geology of the Precambrian Superior and Grenville Provinces and Precambrian Fossils in North America; Geological Survey of Canada, Geology of North America, Volume C-1.
Macdonald, A. James, Editor, 1986; Proceedings Volume, Gold 86; an International Symposium of the Geology of Gold Deposits:
Burrows, D.R., and E.T.C. Spooner, McIntyre Cu-Au Deposit, Timmins, Ontario, Canada; p. 23-40.
Mason, R., and Melnik, N., the Anatomy of an Archean Gold System — The McIntyre-Hollinger Complex at Timmins, Ontario, Canada; p. 40-56.
Wood, P.C. et al., the Hollinger-McIntyre Au-Quartz Vein System, Timmins, Ontario, Canada; Geological Characteristics, Fluid Properties and Light Stable Isotope Geochemistry; p. 56-81.
Melnik-Proud, Nadia, 1992; The Geology and Ore Controls in and Around the McIntyre Mine at Timmins, Ontario, Canada; a thesis submitted to the Department of Geological Sciences in conformity with the requirements for the degree of Doctor of Philosophy, Queen’s University, Kingston, Ontario, Canada.
Miller, A., 2004; Contribution to the Geology of the Holmer Gold Deposit: Orogenic Mesothermal Lode Gold Hosted in a Lake Archean Alkaline Intrusive Complex: Lithologies, Metamorphism and Overprinting Hydrothermal Alteration Assemblages Northern Volcanic Zone, Abitibi Subprovince, Canada, Volume 1 of 2, for Lake Shore Gold Corp. Miller and Associates.
Miller, A., 2008; A Contribution to the Geology of the Thunder Creek Property, Northern Volcanic Zone, Abitibi Subprovince, Canada: Lithologies, Metamorphism, Overprinting, Hydrothermal Alteration Assemblages, Precious Metal Mineralogy Based on Petrography, Ore Microscopy and Scanning Electron Microscope Investigation of Selected Drill Core Samples from Drill Holes TC04-13, TC07-27, -30, -36, -37 with Comparison of the West Timmins Gold Property (formerly Holmer Gold Deposit); Internal Report for Lake Shore Gold Corp. by Miller & Associates, Ottawa, Ontario, Canada.
Miller, A., 2009; Rusk Horizon and Rusk Showing, Thunder Creek Project, Northern Volcanic Zone, Abitibi Subprovince, Canada: Mineralogy of Selected Drill Core Samples from Drill Holes TC-08-51, TC-08-52, TC08-54, TC-1891 utilizing Scanning Electron Microscope with Petrography and Ore Microscope. Parts A-C-D; Internal Report for Lake Shore Gold Corp. by Miller & Associates, Ottawa, Ontario, Canada.
Miller, A., 2009; Rusk Horizon and Rusk Showing, Thunder Creek Project, Northern Volcanic Zone, Abitibi Subprovince, Canada: Mineralogy of Selected Drill Core Samples from Drill Holes TC-08-51, TC-08-52, TC08-54, TC-1891 utilizing Scanning Electron Microscope with Petrography and Ore Microscope. Part B; Internal Report for Lake Shore Gold Corp. by Miller & Associates, Ottawa, Ontario, Canada.
198
Miller, A., 2009; Part A — Petrography and Ore Microscopy addendum to January 11, 2009 Report entitled Rusk Horizon and Rusk Showing, Thunder Creek Project, Northern Volcanic Zone, Abitibi Subprovince, Canada: Mineralogy of Samples TC08-54 (663), TC-08-54 (668) utilizing Part A — Scanning Electron Microscope, Part B — Petrography and Ore Microscope, Internal Report for Lake Shore Gold Corp. by Miller & Associates, Ottawa, Ontario, Canada.
Miller, A., 2009; Part B — Scanning Electron Microscopy addendum to January 11, 2009 Report entitled Rusk Horizon and Rusk Showing, Thunder Creek Project, Northern Volcanic Zone, Abitibi Subprovince, Canada: Mineralogy of Samples TC08-54 (663), TC-08-54 (668) utilizing Part A — Scanning Electron Microscope, Part B — Petrography and Ore Microscope, Internal Report for Lake Shore Gold Corp. by Miller & Associates, Ottawa, Ontario, Canada.
Neczakar, E., Kociumbas, M.W., Sullivan, J.R., 2004; A Technical Review of the Holmer Gold Property in Bristol Township, Timmins Area, Ontario, Canada, for Lake Shore Gold Corp., Watts, Griffis, and McQuat limited, September 07, 2004.
Placer Dome, 2005; Canadian Operations, Sustainability Report.
Pyke, D.R., 1982; Geology of the Timmins Area, District of Cochrane, Report 219, Ontario Geological Survey.
Poulsen, K.H., 1996; Geology of Canadian Mineral Deposit Types, Geology of Canada, No. 8, Geological Survey of Canada, Chapter 15, Lode Gold, p. 323 to 392.
Powers, D., 2009; Amended Technical Review and Report of the “Thunder Creek Property” Bristol and Carscallen Townships, Porcupine Mining Division, Ontario, Canada prepared for Lake Shore Gold Corp. and West Timmins Mining Inc.
Pressacco, R., 1999; Special Project: Timmins Ore Deposit Descriptions, Ontario Geological Survey, Open File Report 5985.
Ross, K., 2003; Petrographic Study of Twenty Five Samples from the Holmer Gold Deposit, Timmins, Ontario, Internal Lake Shore Gold Corp. Report by Panterra Geoservices Inc., Surrey, British Columbia.
Ross, K., 2010; Petrographic Study of the Timmins Gold Mine and Thunder Creek Area, Timmins, Ontario, Prepared for Lake Shore Gold Corp., March 12, 2010.
Rhys, D.A., 2003; Structural Mapping Study of the Surface Outcrops of the Holmer Gold Deposit, Timmins, Ontario, Internal Lake Shore Gold Corp. Report by Panterra Geoservices Inc, Surrey, British Columbia.
Rhys, D., Lewis, P., 2004; Gold Vein Deposits: Turning Geology into Discovery, BC & Yukon Chamber of Mines, Cordilleran Exploration Round-Up, short course notes.
Rhys, D., 2010; Structural Study of Gold Mineralization in Portions of the Timmins Mine and Thunder Creek Projects, Porcupine Mining District, Ontario. Report prepared for Lake Shore Gold, March 12, 2010.
199
Rhys, D., 2010; an Internal Lake Shore Gold Corp. Memo: Golden River East Zone: Observations and Interpretation from Brief Field Review, December 10, 2010.
Rhys, D., 2010; Thunder Creek — Rusk Zone: Assessment of Structural Controls Through Examination of Initial Underground on 300 and 315 Levels, Memo dated December 21, 2010.
Rhys, D., 2011; an Internal Lake Shore Gold Corp. Memo: Golden River East Zone Drill Core Review: Summary of Geological Observations and Recommendations, September 06, 2011.
Rocque, P., Mah, S., Hamilton, R., Wilson, G., Kilpatrick, R., 2006; Review of Porcupine Joint Venture Operation, Ontario, Canada, NI 43-101 Technical Report, prepared for Goldcorp Inc., prepared by AMEC Americas Limited.
Samson, J., 2005; the 2003 — 2005 Diamond Drill Program on the Thunder Creek Property, Bristol Township, Lake Shore Gold Corp., Report.
Samson, J., 2008; the 2006 Stripping and Trenching Program on the Thunder Creek Property, Bristol Township, Lake Shore Gold Corp., Report.
Samson, J., 2009; the 2007-2008 Diamond Drill Program (Phase 4) on the Thunder Creek Property, Bristol Township, Lake Shore Gold Corp., Report.
Sullivan, J.R., Lavigne, J.G., Kociumbas, M.W., 2007; a Technical Review of the Timmins West Gold Project in Bristol Township, Timmins Area, Ontario, Canada, for Lake Shore Gold Corp., Watts, Griffis and McOuat Limited, Consulting Geologists and Engineers (January 03, 2007).
Thompson, P.H., 2002; Toward a New Metamorphic Framework for Gold Exploration in the Timmins Area, Central Abitibi Greenstone Belt, Ontario Geological Survey, Open File Report 6101.
Wagner, D.W., 2008; Technical Report of the Thunder Creek Gold Property, Bristol Township, Timmins, Ontario, Canada, for West Timmins Mining Inc. (June 27, 2008).
Webster, B., 2010; Report on Borehole Induced Polarization Surveys, Thunder Creek Property, Timmins, Ontario, JVX Limited, Geophysical Surveys and Consulting.
Wilson, G.C., Rucklidge, J.C., 1986; Grant 262; Geoscience Research Grant Program, Summary of Research 1985-1986; Lithological Features and Economic Significance of Reduced Carbonaceous Rocks in Gold Deposits, Ontario Geological Survey, Miscellaneous Paper 130, p. 177-189.
Wilson, G.C., Rucklidge, J.C., 1987; Grant 262; Geoscience Research Grant Program, Summary of Research 1986-1987; Geology, Geochemistry, and Economic Significance of Carbonaceous Host Rocks in Gold Deposits of The Timmins Area, Ontario Geological Survey, Miscellaneous Paper 136, p. 66-76.
Winter, L.D.S., 2004; National Instrument 43-101 Technical Report, Lake Shore Gold Corp., Timmins Gold Project, Timmins, Ontario (September 28, 2004).
Winter, L.D.S., 2004; National Instrument 43-101 Technical Report, Lake Shore Gold Corp., Timmins Gold Project, Timmins, Ontario (November 26, 2004).
200
Winter, L.D.S., 2006; National Instrument 43-101 Technical Report, Lake Shore Gold Corp., Timmins Gold Project, Timmins, Ontario (January 25, 2006).
27.2 ASSESSMENT RESEARCH IMAGING FILES (AFRI)
Allan, J.E., 1974; Diamond Drill Logs, Allerston Gold Property, Bristol Twp., Ducanex Resources, AFRI No. 42A05NE8449.
Anderson, S.D., 1994; Work Report on the Bristol Lake Property, Trenching and Sampling Program for R.J. Poirier by Rayan Exploration Ltd., AFRI No. 42A05NE0079.
Anderson, S.D., 1995; Report on an Induced Polarization Survey on the Bristol Township Properties, Porcupine Mining Division, Ontario, for R.J. Poirier by Rayan Exploration Ltd., AFRI No. 42A05NE0078.
Anderson, S.D., 1996; Geophysical Report on the Bristol Township Property, Induced Polarization Survey Located in Bristol Township, Porcupine Mining Division, for Marl/Pelangio Larder J.V., Rayan Exploration Ltd., AFRI No. 42ANE0165.
Anderson, S.D., 2003; Geophysical Report on the Magnetometer Survey, Bristol Lake Property, Bristol Township, Porcupine Mining Division for Rolly Poirier, Vision Exploration, AFRI No. 42A05NE2049.
Bald, R., 1987; Diamond Drill Logs, Bristol Township, Highwood Resources. AFRI No. 42A05NE8428.
Barnett, E.S., 1985; Diamond Drill Report, Bristol Township, Kidd Creek Mines Ltd. AFRI No. 42A05NE8489.
Begauskas, J., Vamos, P.J., 1996; Report on the Allerston Project (Portion of the Allerston Option) in Bristol Township, West Timmins Area, Prospectors Alliance Corp. AFRI No. 42A05NE0167.
Benham, W., 1984; Diamond Drill Report, Allerston Option, Rio Algom Exploration Inc., Bristol Township, AFRI No. 42A05NE8473.
Bradshaw, R.J., 1973; Magnetic — Electromagnetic Survey on the Property of Holmer Gold Mines Limited, Bristol Township, Ontario, AFRI No. 42A05NE8495.
Bradshaw, R.J., 1973; Magnetic — Electromagnetic Survey on the Property of Mill Hill Mines Limited, Bristol, Denton, Carscallen and Thorneloe Townships, Ontario, AFRI No. 42A05SE0024.
Bradshaw, R.J., 1974; Magnetic — Electromagnetic Survey on the Shield Group, Bristol Township, Ontario, AFRI No. 42A05NE8463.
Bradshaw, R.J., 1978; Magnetic — Electromagnetic Survey on the Property of Holmer Gold Mines Limited, Bristol Township, Ontario, AFRI No. 42A05NE8439.
Bradshaw, R.J., 1978; Geological Report on Part of the Property of Holmer Gold Mines Limited, Bristol Township, Ontario, AFRI No. 42A05NE8494.
201
Burns, J.G., 1996; Evaluation Report on Claims Located in Bristol Township, Porcupine Mining Division for Copper Dome Mines Ltd., AFRI No. 42A05NE0095.
Calhoun, R., 1994; Diamond Drill Hole Summary, Mahoney Creek Project (No. 507), Noranda Exploration Company Limited, Claims 1177808, 1177809, AFRI No. 42ANE0075.
Calhoun, R., 1995; Summary of Induced Polarization Survey, Mahoney Creek Project (No. 507), Hemlo Gold Mines Inc., AFRI No. 42ANE0084.
Calhoun, R., Edwards, J., 1997; Battle Mountain Gold, Diamond Drill Logs, Mahoney Creek, Project 507, AFRI No. 42A05NE0169.
Calhoun, R., Edwards, J., 1997; Battle Mountain Gold, Diamond Drill Logs, Thunder Creek, Project 506, AFRI No. 42A05NE2007.
Calhoun, R., 1998; Diamond Drill Logs, Allerston Option, Bristol Township, Falconbridge Ltd., AFRI No. 42A05NE2019.
Calhoun, R., 2000; Diamond Drill Logs, KM-2 Project, Bristol Township, Falconbridge Ltd., Explorers Alliance Corp., AFRI No. 42A05NE2030.
Calhoun, R., 1999; Diamond Drill Logs, Wallingford South Project, Bristol Township, Pelangio Mines Inc., Prospectors Alliance Inc., AFRI No. 42A05NE2034.
Calhoun, R., 2001; Summary Report of Fugro MegaTem® Survey, Timmins West Area by GeoCal Exploration Services, for Explorers Alliance Corp., AFRI No. 42A06NW2026.
Chataway, R.T., 1981; Diamond Drilling 1981, Preussag Canada Limited, Timmins West Project, Timmins, Ontario, AFRI No. 42A05NE8478.
Clark, D., 1989; Report on Magnetic Survey, Southwestern Poirier Block, Holmer Project, Bristol Township, Ontario, M588, AFRI No. 42ANE8648.
Croxall, J.E., 1979; Magnetic and Electromagnetic Surveys, Claims No. 495307, 495309, 515901, North Part of the Croxall-Miller Property, Southwestern Pare of Bristol Township, Porcupine Mining Division, AFRI No. 42A05NE8447.
Croxall, J.E., 1992. Mechanical Overburden Stripping, Bristol Township, AFRI No. 42A05NE8488.
Daigle, R.J., 1994; Noranda Exploration Co. Ltd., Geophysical Assessment Report, Project 507, Induced Polarization Survey, Bristol, Carscallen, Denton, Thorneloe, Townships, Ontario, N/.T.S. 42A-SW, Porcupine Mining Division, AFRI No. 42A05NE0083.
Daigle, R.J., 1994; Noranda Exploration Co. Ltd., Total Field Magnetic Assessment Report, Project 507, Bristol, Carscallen, Denton, Thorneloe, Townships, Ontario, N/.T.S. 42A-05, Porcupine Mining Division, AFRI No. 42A05NE0081.
Daigle, R.J., 1994; Noranda Exploration Co. Ltd., Assessment Report, Project 144, Porcupine Mining Division, AFRI No. 42A05SE0011.
202
Daigle, R.J., 1995; Line Cutting, TFM and I.P. Surveys, Bristol Township, Hemlo Gold Inc., N.T.S. 42-A-05, Porcupine Mining Division, AFRI No. 42ANE0080.
Daigle, R.J., 1997; Report of Work for Band-Ore Resources Ltd. on Carstol Property, Carscallen and Bristol Townships, 1997 Line Cutting, TFM, and I.P. Surveys, AFRI No. 42A05NE0131.
Daigle, R.J., 1997; Report of Work for Band-Ore Resources Ltd. on West Porcupine Project 1996-1997, Geophysical Surveys, Line Cutting, I.P., TFM., AFRI No. 42A06SW0025.
Deevy, A.J., 1985; Report on Bristol Township Property, Project 404, Allerston Option, Westfield Minerals Ltd., AFRI No. 42A05NE8498.
Dionna, R.J., 1965; Diamond Drill Report, Claim P55903, Bristol Township, United Buffadison, AFRI No. 42A05NE8650.
Diorio, P., 1984; Assessment Report on Magnetic and VLF-EM Surveys Conducted on Claims 724587-724591, 740864-740873, 752195-752205, 779457-779461, 79509-779515, 825436-825440 Located in the Bristol Township in Porcupine Mining District, Ontario., Utah Mines, AFRI No. 42A05NE8491.
Diorio, P., 1985; Assessment Report on Induced Polarization Conducted on Claims 724587-724591, 740864-740873, 752195-752205, 779457-779461, 779509-779515, 825436-825440 Located in the Bristol Township in Porcupine Mining District, Ontario, Utah Mines, AFRI No. 42A05NE8456.
Duess, R., 1997; Diamond Drill Logs and Sections, Bristol Property, Sedex Mining Corp./Band-Ore Resources Ltd., Joint Venture, Bristol and Thorneloe Townships, Porcupine Mining Division, AFRI No. 42A06NW0042.
Fedikow, M., 2011; Preliminary Results of Mobile Metal Ions Soil Geochemical Orientation Surveys, Timmins Area, Ontario. Prepared for Lake Shore Gold Corp.
Filo, J.K., 1997; Diamond Drill Report for Pelangio Larder Mines Limited and Copper Dome Mines Ltd., on the Poirier Joint Venture within Bristol Township, Northern Ontario, AFRI No. 42A05NE0168.
Fumerton, S., Clark, D., 1988; Geological and Geochemical Assessment Report, Bristol Township, M588, Chevron Minerals Ltd., AFRI No. 42A05NE8459.
Fumerton, S., 1988; Report of Work Done in 1987 on the Holmer Property, Bristol Township, M588, Chevron Minerals Ltd., AFRI No. 42A05NE8490.
Gasteiger, W.A., 1981; Report on Geophysical Work, Bristol Township, Allerston Claims and Bristol 66, Texasgulf Inc., AFRI No. 42A06NW8486.
Gasteiger, W.A., 1981; Report on Geophysical Work, Bristol, Denton, Carscallen, Thorneloe Townships, Airborne EM and Airborne Mag., Texasgulf Canada Ltd., AFRI No. 42A06NW0303.
George, P.T., 1973; Report on the property of Holmer Gold Mines Ltd., Bristol Township, Ontario, AFRI No. 42A05NE8475.
203
George, P.T., 1975; Diamond Drill Report, for Geonex Limited (Ralph Allerston), Bristol Township, Ontario, AFRI No. 42A05NE8436.
Glenn, W.E., 1987; Airborne Geophysical Survey, Bristol Township, Chevron Canada Resources Limited, AFRI No. 42A05NE8705.
Grant, J.C., 1997; Geophysical Report for Copper Dome Mines Ltd. on the Poirier Option, Bristol Township, Porcupine Mining Division, Northeastern Ontario, AFRI No. 42ANE0104.
Grant, J.C., 1997; Geophysical Report for Pelangio Larder/Copper dome Mines Ltd. on the Poirier Option Bristol Township., Porcupine Mining Division, Northeastern Ontario, AFRI No. 42A05NE0158.
Grant, J.C., 2004; Geophysical Report for Probe Mines Limited, Bristol Project, Bristol Township, Porcupine Mining Division, Northeastern Ontario, AFRI No. 42A06NW2046.
Hendry, K.N., 1987; 1986 Geophysical assessment Report, Bristol Property, Cominco Ltd., AFRI No. 42A06NW8427.
Hiava, M., 1987; Diamond Drill Logs, Allerston Property, Bristol Township, AFRI No. 42A05NE8432.
Holmer Gold Mines Ltd., 1969; Diamond Drill Log Report, Bristol Township, AFRI No. 42A05NE8500.
Holmer Gold Mines Ltd., 1980; Diamond Drill Log Report, Bristol Township, AFRI No. 42A05NE8460.
Johnston, Matthew, 2000; Report of Work on the Bristol Property, Bristol Township, Ontario, NTS 42A/SW, Porcupine Mining Division, for Mike Caron, AFRI No. 42A05NE2037.
Jones, W.A., 1958; Diamond Drill Report, Hollinger Mines Ltd., Bristol Township, AFRI No. 42A05NE8454.
Klein, J., 1987; 1986 Geophysical Assessment Report on Claims P835909-835916, P871660 and P871661, Bristol Property, Cominco Ltd., AFRI No. 42A06NW8423.
Kilpatrick, J.M., 1973; Report on the Property on the Boundary of Townships of Carscallen, Bristol, Denton and Thorneloe, Mill Hill Mines Limited. AFRI No. 42ASE0025.
Lebaron, P.S., 1984; Report on Reverse Circulation Overburden Drilling, Croxall Option, Bristol and Thorneloe Townships, Noranda Exploration Company Limited, AFRI No. 42A05SE0010.
Lebaron, P.S., 1985; Diamond Drill Report, Croxall Option, Bristol Township, Noranda Exploration Company Limited, AFRI No. 42A05SE0001.
Legault, J.M., Williston, C., Warne, J., 1997; Geophysical Survey Logistical Report, Quantec, regarding the Gradient-Realsection TDIP\Resistivity Survey over the Bristol Property, Bristol Twp., ON., on behalf of Prospectors Alliance Corp., Toronto, Quantec IP Incorporated, AFRI No. 42A05NE2018.
Mackenzie, C.D, 1995; Ground Magnetometer Survey and VLF Survey for the Ralph Allerston Property, Bristol Twp., Block 1190579, 4 Units, District of Cochrane, Timmins, Ontario, AFRI No. 42A05NE0077.
204
MacPherson, J., 1988; Report on Linecutting, and Ground Magnetometer on Bristol #1 and 2, Mattagami River and Hwy 144 Grids, Thorneloe and Bristol Townships, District of Cochrane, Esso Minerals Canada, AFRI No. 42A06NW0317.
Manchuck, B., 1989; Diamond Drill Report, Chevron Minerals Ltd., AFRI No.42A05NE8649.
McCann, S., 1995, Hemlo Gold Mines Inc., Diamond Drill Logs, Mahoney Creek Project (507), AFRI No. 42ANE0085.
McCann, S., 1995, Hemlo Gold Mines Inc., Diamond Drill Logs, Mahoney Creek Project (507), AFRI No. 42ANE0087.
McLeod, C.C., 1979; Reverse Circulation Overburden Drilling, Texasgulf Inc., AFRI No. 42A05NE8457.
McLeod, C.C., 1981; Reverse Circulation Overburden Drilling, Texasgulf Inc., AFRI No. 42A05NE8464.
Meikle, R.J.; 1994; Geophysical Report on a Magnetometer Survey for Band-Ore Resources Ltd., on Claim 1177822, Bristol Twp., Porcupine Mining Division, Ontario, by Rayan Exploration, AFRI No. 42A05NE0070.
Meikle, R.J.; 1994; Geophysical Report on a Magnetometer Survey for Band-Ore Resources Ltd., on the Thunder Creek Property, Bristol/Carscallen Twp., Porcupine Mining Division, Ontario, by Rayan Exploration, AFRI No. 42A05NE2062.
Meikle, R.J.; 1994; Geophysical Report on a Magnetometer Survey for Band-Ore Resources Ltd., on the Thunder Creek Property, Bristol/Carscallen Twp., Porcupine Mining Division, Ontario, by Rayan Exploration, AFRI No. 42A05NE8701.
Meikle, R.J.; 1995; Geophysical Report on the, Bristol Township Property Magnetometer Survey Located in Bristol Township., Porcupine Mining Division, Ontario, for Pelangio Larder Mines Ltd., AFRI No. 42A05NE0092.
Moore, D.D., 1987; Diamond Drill Logs BR87-1, 87-2, 87-6, Cominco Ltd., AFRI No. 42A06NW8424.
Muir, J.E., 1980; Mineralogical Examination of Jim Croxall’s Sample, Falconbridge Metallurgical Laboratories, AFRI No. 42A05NE8430.
Mullen, D., 1979; Diamond Drill Logs, Allerston Option, Bristol Township, Texasgulf Ltd., AFRI No. 42A05NE8479.
Newsome, J.W., 1986; Assessment Report on Diamond Drilling Conducted on Claim 779509, Bristol Township, Porcupine Mining Division, Ontario, for Utah Mines Ltd., AFRI No. 42A06NW8426.
Perry, J., 1977; Magnetic Survey Report, Bristol Township, M-264, Porcupine Mining Division, District of Cochrane, Canadian Nickel Company, AFRI No. 42A06NE8435.
Perry, J., 1977, Geological Report, Allerston Option, Bristol Township, Canadian Nickel Company Limited, AFRI No. 42A06NW8485.
205
Robinson, G.D., 1958; Diamond Drill Report, Hollinger Mines Ltd., Bristol and Thorneloe Townships, AFRI No. 42A05NE8477.
Roth, J., 1988; Report on Magnetic and Induced Polarization Surveys, Holmer Project, Bristol Township for Chevron Canada Resources Ltd., AFRI No. 42A05NE8492.
Vamos, P.J., 1998; Report on the Exploration Program Conducted by Prospectors Alliance Corp., during 1996 and 1997, on the East Portion of the Allerston Option, AFRI No. 42A05NE2012.
Van Hees, E.H., 1989, Diamond Drill Log and Assay Results, Chevron Minerals Ltd., AFRI No. 42A06NW8429.
Wamtech Pty, Ltd., 2004; MMI Manual for Mobile Metal Ion Geochemical Soil Survey, Version 5.04.
Warren, T.E., 1981; Timmins west Project, Geophysical Surveys, 1981, Mag., VLF, HEM, Preussag Canada Limited, AFRI No. 42A06SW0206.
Webster, B., 1977; Induced Polarization and Resistivity Survey Report, Bristol Township (M-264), Porcupine Mining Division, District of Cochrane, for R. Allerston, AFRI No. 42A06NW8471.
Webster, B., 1977; Magnetic Survey Report, Bristol Township (M-264), Porcupine Mining Division, District of Cochrane, for Canadian Nickel Company Ltd., AFRI No. 42A06NW8431.
Webster, B., 1997; Logistical and Interpretive Report, Spectral Induced Polarization Surveys, Timmins West Project, The Allerston Grid, Prospectors Alliance Corp., Bristol Twp., Northern Ontario, AFRI No. 42A05NE2001.
27.3 PRESS RELEASES
2003-05-27; Innes, D.G., Lake Shore Options Timmins Area High Grade Gold Property.
2003-07-17; Innes, D.G., Lake Shore Commences Drilling Program on Timmins High-Grade Gold Project, Ontario.
2003-09-05; Innes, D.G. Lake Shore Adds More Drills to and Doubles the Budget at the Timmins Gold Project, Ontario.
2003-10-08; Innes, D.G., First Drill Assays Positive Ultramafic Zone Returns Excellent Grades and Widths Timmins Gold Project, Ontario.
2003-11-11; O’Connor, W.J., Lake Shore and Band-Ore Ink Timmins, Ontario Deal.
2003-11-12; Innes, D.G., Lake Shore Options Thunder Creek Property Adjoining The Timmins Gold Project, Ontario.
2003-12-03; Innes, D.G., Lake Shore Gold Reports More Timmins Gold Property Results and Updates from the Thunder Creek-Bazooka-Highway Projects Ontario-Quebec.
206
2004-01-08; Innes, D.G, Lake Shore Gold Corp. Drilling Expands Timmins Gold Resources High Grade Gold Recoveries from Metallurgical Testing.
2004-02-17; Innes, D.G. Lake Shore Gold Corp. More Drilling Results from the Timmins Gold Project Summary of 2003 Drilling.
2004-03-24; Innes, D.G., Lake Shore Confirms Gold Mineralization on Thunder Creek Property Timmins, Ontario.
O’Connor, W.J., Gold Mineralization Confirmed on Thunder Creek Property. Band-Ore Resources Ltd.
2004-03-30; Innes, D.G., Lake Shore Gold Corp., More Positive Results from Resource Expansion Drilling Timmins Gold Project, Ontario.
2004-06-01; Innes, D.G., Lake Shore Gold Corp., Resource Expansion and Drilling Update, Timmins Gold Project, Ontario.
2004-07-19; Innes, D.G., Lake Shore Gold Corp. First Phase Resource Expansion Drilling Completed, New Zone Discovered, Timmins Gold Project, Ontario.
2004-08-25; Innes, D.G., Lake Shore Gold Corp. Initiates Second Phase 3.000 Metre drilling Program Thunder Creek Property, Timmins, Ontario.
O’Connor, W.J., Lake Shore Gold Corp., Initiates Second Phase 3,000 Metre Drill Program Thunder Creek Gold Property, Band-Ore Resources Ltd., Timmins, Ontario.
2004-09-10; Innes, D.G., Lake Shore Gold Corp., Resources Expansion Program Triples Resources on the Timmins Gold Project.
2004-09-21; Innes, D.G., Lake Shore Completes Earn In, Timmins Gold Property, Ontario.
2004-10-05; Innes, D.G. Lake Shore Gold Corp., Step Out Drilling Continues to Expand Gold Mineralization, Timmins Gold Project , Ontario.
2004-10-20; Innes, D. G., Raman, K., Lake Shore and Holmer Announce Business Combination.
2004-12-29; Innes, D.G., Raman K., Lake Shore and Holmer Announce Shareholder Approval for Business Combination.
2004-12-31; Innes, D.G., Raman K., Lake Shore and Holmer Announce Complete Business Combination.
2005-01-06; Innes, D.G., Lake Shore Gold Exploration Update, 2005 Resource Expansion Drilling Pre-Feasibility to Start on Timmins Gold Project, Ontario.
2005-02-14; Innes, D.G., Thunder Creek Project Update, Timmins, Ontario.
O’Connor, W.J., Thunder Creek Project Update, Band-Ore Resources Ltd., Timmins, Ontario.
207
2005-05-30; Booth, B.R., Lake Shore’s Timmins Gold Project Intersects High-Grade Gold up to 24.3 Grams Per Tonne Over 11.1 Metres and Expands Mineralization 450 Metres Down Plunge Beyond the Current Indicated Resource.
2005-08-15; Booth, B.R., Lake Shore Gold Intersects 18.09 Grams/Tonne Gold over 5.70 Metres, Timmins West Gold Project, Ontario.
2005-11-04; Booth, B.R., Lake Shore Gold Intersects 24.35 Metres Grading 9.28 Grams Per Tonne Gold, Timmins West Gold Property, Ontario.
2005-12-08; Booth, B.R., Lake Shore Starts Drilling At Desantis and Continues Drilling At Timmins West, Ontario.
2006-02-07; Booth, B.R., Summary of Gold Resources And An Exploration Update for Lake Shore’s Timmins Area Properties.
2006-03-03; Booth, B.R., Seven Drills Operating In March, Lake Shore Gold Corp. Exploration Update.
2006-04-17; Booth, B.R., Lake Shore Gold Intersects 6.0 Metres Grading 32.52 Grams Per Tonne Gold As Sectional Resource Drilling Continues At Timmins West Gold Project, Ontario.
2006-05-23; Booth, B.R., Lake Shore Initiates Permit Process for Advanced Underground Exploration Programs At Timmins West And Vogel-Schumacher Gold Projects, Timmins, Ontario.
2006-06-21; O’Connor, W.J., Exploration Update, Thunder Creek Property, Band-Ore Resources Ltd., Timmins, Ontario.
2006-08-11; Booth, B.R., Lake Shore Gold Quarterly Project Update.
2006-08-16; Booth, B.R., Lake Shore Gold continues To Expand The Resource and Extends The Main Zone On The Timmins West Gold Project, Ontario.
2006-09-14; Wagner, D.W., West Timmins Mining Inc. To Begin Trading Sept. 18, Amalgamation of Sydney And Band-Ore Receives Final Approvals.
2006-09-26; Notice of Change in Corporate Structure, Report Date: 2006-09-26; Amalgamation Became Effective on September 13, 2006. (Sydney Resources Corporation and Band-Ore Resources Limited) - New - West Timmins Mining Inc.
2006-09-18; Wagner, D.W., Canadian Gold Company Launched on Toronto Stock Exchange — West Timmins Mining Inc. to Focus on Large Projects in West Timmins Camp and Sierra Madres of Mexico.
2006-10-30; Wagner, D.W., West Timmins Commences 12,000 Metre Drill Program on West Timmins Gold Project.
2006-10-31; Booth, B.R., Lake shore Reports Latest Results At Timmins West, Including Four Metres Grading 65.65 Grams Gold Per Tonne, And Provides Update At Vogel-Schumacher.
208
2006-11-09; Booth, B.R., Lake Shore Third Quarter Project Update.
2006-11-20; Booth, B.R., Lake Shore Gold Increases The Indicated Mineral Resource to 3.27 Million Tonnes at 12.29 Grams Gold Per Tonne (Uncut) at Timmins West).
2007-03-12; Booth, B.R., Lake Shore Gold Files Application for Advanced Exploration Permit At Timmins West.
2007-04-11; Wagner, D.W., West Timmins Mining Exploration Update: 5 Drills Turning on WTM Gold Projects; 8,000 metres, 10-12 holes, Thunder Creek Property, Timmins, funded by Lake Shore Gold.
2007-04-30; Booth, B.R., Lakeshore Recieves Approval to Initiate Advanced Underground Exploration at Timmins West.
2007-05-10; Booth, B.R. Lake Shore Gold First Quarter Project Update.
2007-07-09; Wagner, D.W., West Timmins Mining Inc. Annual Report 2006.
2007-07-11; Wagner, D.W. West Timmins Gold Project Exploration Update.
2007-07-19; Booth, B.R., Lake Shore Provides Update on Timmins West Pre-Feasibility Study.
2007-08-01; Booth, B.R., Lake Shore Intersects New High-Grade Gold Mineralization at Thunder Creek, Ontario.
Wagner, D.W., High Grade Gold Intersected on West Timmins’ Thunder Creek Property, Ontario.
2007-08-15; Booth, B.R., Lake Shore Second Quarter Project Update.
2007-08-28; Booth, B.R., Lake Shore Reports Mineral Reserves and Positive Pre-Feasibility Study Results for Timmins West.
2007-09-05; Booth, B.R., Lake Shore Reports Additional High-Grade Gold Intersection at Thunder Creek.
2007-09-06; Wagner, D.W., West Timmins Reports New High Grade Gold Discovery at Thunder Creek Property, Timmins, Ontario.
2007-11-13; Booth, B.R., Lake Shore Reports Third Quarter Results.
2007-11-17; Wagner, D.W., West Timmins to Initiate Drilling on Highway 144 Gold Property, Timmins, Ontario.
2007-11-29; Booth, B.R., Lake Shore Transition into Mining -Plans Management Changes.
2007-12-04; Booth, B.R., Lake Shore Intersects 24.61 Grams Gold Per Tonne over 7.0 Metres at Thunder Creek Property in Ontario.
Wagner, D.W. 24.61 Grams Gold Per Tonne Intersected Over 7.0 Metres On West Timmins’ Thunder Creek Property, Timmins, Ontario.
209
2008-02-07; Wagner, D.W., Drilling extends Pond and West Gold Zones, West Timmins Gold Project, Ontario.
2008-03-31; Makuch, T., Lake Shore Intersects 8.57 g/t Gold Over 9.0 Metres at Thunder Creek Property in Ontario.
Wagner, D.W., WTM Reports 8.57 g/t Gold over 9.0 Metres for Follow-Up Drilling at Thunder Creek.
2008-04-21; Wagner, D.W., WTM To Test Northern Extension of Thunder Creek — Timmins West Trend.
2008-05-15; Makuch, T., Lake Shore Gold Announces First Quarter 2008 Results.
2008-07-10; Wagner, D.W., West Timmins Mining Inc. Annual Report 2008.
2008-07-18; Makuch, T., Lake Shore Gold Corp Announces Timmins West Exploration Agreement with Flying Post and Mattagami First Nations.
2008-08-05; Makuch, T., Lake Shore Gold Provides Update on Thunder Creek Exploration.
Wagner, D.W., 22,000 Metre Diamond Drill Program Commences on WTM’s Thunder Creek Property in Timmins, Ontario.
2008-08-12; Makuch, T., Lake Shore Gold on Track to Achieve 2008 Targets.
2008-08-13; Wagner, D.W., WTM Completes $1,950,000 Non Brokered, Flow Through Private Placement — proceeds to fund the announced 22,000 metre diamond drill program on the Thunder Creek Property.
2008-09-11; Makuch, T., Lake Shore Gold Commence Ramp Development at Timmins West, Shaft Sinking Progressing on Schedule and Budget.
2008-11-10; Makuch, T., Lake Shore Gold Reports Timmins West on Schedule for Production in First Quarter 2009.
2008-12-02; Wagner, D.W., WTM Reports New High Grade intercepts from the Golden River West Zone.
2008-12-16; Makuch, T., Lake Shore Gold Significantly Extends Rusk Zone and Announces New High-Grade Gold Intercepts at Thunder Creek.
Wagner, D.W., WTM Reports 11.20 g/t Gold over 10.4 metres at Thunder Creek, Timmins, Ontario.
2009-01-21; Wagner, D.W., Drilling Program Accelerated on WTM’s Thunder Creek Gold Property, Timmins, Ontario.
2009-02-18; Wagner, D.W., WTM Discovers Large New Gold System on HWY 144, Property, Timmins, Ontario.
2009-02-23; Makuch, T., Lake Shore Gold Provides Corporate Update.
2009-03-26; Makuch, T., Lake Shore Commences Processsing At Bell Creek Mill.
210
2009-03-31; Makuch, T., Lake Shore Gold Announces 19.55 g/t over 6.0 Metres and Discovery of Second Mineralized Horizon in Porphyry at Thunder Creek.
Wagner, D.W., WTM Reports 8.86 g/t (0.26 oz/t) Gold over 24.85 Metres (81.58 feet) from Rusk Zone — Is History Being Repeated in Timmins, Ontario?
2009-04-16; Wagner, D.W., WTM Reports High-Grade Results from 100% Owned Thorne Property: District Scale Potential of the West Timmins Gold Project Continues to Expand.
2009-05-05; Makuch, T., Lake Shore Gold Continues To Advance Projects on Schedule and Budget and to Achieve Exploration Success In First Quarter of 2009.
2009-05-05; Makuch, T., Lake Shore Gold Reports Additional High-Grade Intercepts at Thunder Creek, Confirms 175 Metre minimum Strike Length for Rusk and Porphyry Zones and Identifies New Sub-Zone at Depth.
Wagner, D.W., WTM Reports 7.95 g/t (0.23 oz/t) Gold over 19.45 Metres (63.80 feet) as Thunder Creek Gold System Continues to Expand.
2009-06-08; Wagner, D.W., Third and Fourth Drill Added on TWM’s Thunder Creek Property, Timmins, Ontario.
2009-06-24; Makuch, T., Lake Shore Gold Reports 12.75 Grams per Tonne Over 83.40 Metres at Thunder Creek.
Wagner, D.W., WTM Intersects 83.40 Metres (273.55 feet) Grading 12.75 g/t (0.37 oz/ton) Gold on Thunder Creek Property, Timmins, Ontario.
2009-07-13; Wagner, D.W., West Timmins Mining Inc. Annual Report 2009.
2009-08-05; Makuch, T., Lake Shore Gold advances Projects on Schedule and Budget and Achieves Exploration Success in Second Quarter and First Half of 2009.
2009-08-24; Wagner, D.W., West Timmins Gold Project Update.
2009-08-24; Makuch, T., Lake Shore Gold Reports High-Grade Intercepts from Underground Drilling at Timmins Mine.
2009-08-25; Makuch, T., Lake Shore Gold Continues to Establish Large Gold System at Thunder Creek, Porphyry Structure Extended To At Least 1,125 Metre Depth.
2009-08-25; Wagner, D.W., WTM Acquires 10 Additional Properties In The West Timmins Gold District.
Wagner, D.W., Thunder Creek Drilling Intersects 12.17 g/t Gold Over 9.00 Metres, Extends Porphyry System to 1,125 Vertical Metres Depth.
2009-08-27; Makuch, T., Lake Shore Gold and West Timmins Agree To Business Combination.
2009-10-07; Makuch, T., Lake Shore Gold Releases Updated National Instrument 43-101 Report for Timmins Mine.
211
2009-10-29; Makuch, T., Lake Shore Gold Reports Results of Underground Drilling and Development at Timmins Mine, Results Confirm Previous Drilling and Expand Resource Potential.
2009-11-04; Makuch, T., West Timmins Mining Shareholders Approve Business Combination Agreement With Lake Shore Gold.
2009-11-06; Makuch, T., Lake Shore Gold and West Timmins Mining Complete Business Combination.
2009-11-11; Makuch, T., Lake Shore Gold Continues to Achieve Development and Exploration Success and to Grow Property Position, Plans to Commence Accelerated Thunder Creek Advanced Exploration Program.
2010-01-06; Makuch, T., Lake Shore Gold Acquires Interest in RT Minerals Corp.
2010-01-26; Makuch, T., Lake Shore Gold Extends Thunder Creek to Depth, Confirms High-Grade Core and Discovers New Zone.
2010-02-12; Makuch, T., Lake Shore Gold Commences Drill Program on Gold River Trend, the Company’s Third Major Timmins West Target.
2010-02-17; Makuch, T., Lake Shore Gold Reports Results of Underground Exploration at Timmins Mine 650-Level Test Block.
2010-02-18; Makuch, T., Lake Shore Gold Announces Major Extension to Timmins Mine Mineralization, Thunder Creek Rusk Horizon.
2010-03-10; Makuch, T., Lake Shore Gold Announces 2009 Year End Results, Continued Exploration and Development Success, Timmins Mine to Achieve Commercial Production in 2010.
2010-04-12; Makuch, T., Annual Report 2009.
2010-04-27; Makuch, T., Lake Shore Gold Expands Resources Potential at Timmins Mine.
2010-05-04; Makuch, T., Lake Shore Gold Advances Third Major Target in Timmins West Complex, Confirms Presence of Large Gold-Bearing System Along Gold River Trend Extending to Depth.
2010-05-05; Makuch, T., Lake Shore Gold Announces Continued Progress at Three Timmins Mining Projects During First Quarter 2010.
2010-06-23; Makuch, T., Lake Shore Gold Intersects High-Grade Mineralization at Thorne Property, Expands Resource Potential Near Surface and at Depth.
2010-06-29; Makuch, T., Lake Shore Gold Ramp Reaches Thunder Creek Deposit, Intersects High-Grade Gold Mineralization.
2010-08-10; Makuch, T., Lake Shore Gold Announces Continued Progress During Second Quarter 2010.
2010-08-10; Makuch, T., Lake Shore Gold Reports Wide, High-Grade Intercepts at Timmins Mine Including 13.55 GPT over 50.80 Metres and 61.35 GPT Over 15.00 Metres.
212
2010-08-30; Makuch, T., Lake Shore Gold Expands Thunder Creek Rusk Zone, Announces Additional Wide, High-Grade Intercepts.
2010-11-01; Makuch, T., Lake Shore Gold Continues to Confirm and Expand Thunder Creek Rusk Horizon, Initial Drilling on 650 Level Intersects Rusk Zone and 100 Metres of Porphyry.
2010-11-10; Makuch, T., Lake Shore Gold Achieves Key Production, Development and Exploration Milestones Following Successful Third Quarter.
2010-11-11; Makuch, T., Lake Shore Gold Announces New High-Grade Intercepts, Major Extension of Main Zone and Expansion of Resource Blocks at Timmins Mine.
2010-11-24; Makuch, T., Lake Shore Gold Confirms and Expands Large Gold System in Thunder Creek Porphyry, Intersects 99.60 Metres Grading 4.91 GPT Including 6.92 GPT Over 61.4 Metres.
2010-12-01; Makuch, T., Lake Shore Gold Achieves 12,000 Ounces of Gold in November, Files Closure Plan for Commercial Production.
2011-01-06; Makuch, T., Lake Shore Gold Declares Commercial Production at Timmins Mine, 12,300 Ounces of Gold Produced in December of 2010.
2011-01-07; Makuch, T., Lake Shore Increases Interest In RT Minerals Corp.
2011-01-25; Makuch, T., Lake Shore Gold to Nearly Triple Gold Production in 2011, Significantly Grow Resources and Increase Exploration Spending.
2011-01-25; Makuch, T., Lake Shore Gold Confirms Broad Mineralized Envelope With High-Grade Sections Around 730 Level at Thunder Creek.
2011-02-24; Makuch, T., Lake Shore Gold Intersects Wide, High-Grade Mineralization at Timmins Mine, Confirms and Expands Ultramafic and Main Zones.
2011-03-04; Makuch, T., Lake Shore Gold Reports Wide Intersections with High-Grade Sections within Porphyry Zone at Thunder Creek, Underground and Surface Drilling Highlight Potential to Expand Mineralized System.
2011-03-09; Makuch, T., Lake Shore Gold Achieves Major Milestones in 2010, On Track to Nearly Triple Production and Significantly Grow Resources in 2011.
2011-05-15; Makuch, T., Annual Report 2010.
2011-05-02; Makuch, T., Lake Shore Gold Intersects Wide, High-Grade Mineralization at Timmins Mine, Highlights Significant Potential For Resource Expansion and Discovery of New Zones.
2011-05-03; Makuch, T., Lake Shore Gold Announces First Quarter 2011 Production Results, Company Targeting 125,000 Ounces in 2011.
2011-05-25; Makuch, T., Lake Shore Announces First Quarter 2011 Results Including Strong Gold Sales, Low Operating costs and Continued Exploration Success.
213
2011-07-18; Makuch, T., Lake Shore Gold Releases Production Results for Second Quarter and First Six-Months of 2011, Reviews 2011 Outlook.
2011-07-26; Makuch, T., Lake Shore Gold Continues To Define and Extend Mineralization at Thunder Creek, Potential New Zone Discovered 500 Metres Along TC-144 Trend.
2011-08-09; Makuch, T., Lake Shore Gold Announces Second Quarter 2011 Financial Results, Comments On Progress Made in Support of Future Production.
2011-10-11; Makuch, T., Lake Shore Gold Reports Higher Commercial Production from Timmins Mine in Third Quarter, Maintains Target Production Range for 2011.
2011-11-10; Makuch, T., Lake Shore Gold discovers Potential 1.9 Kilometre Down Plunge Extension of Timmins Gold Mineralization.
2011-11-16; Makuch, T., Lake Shore Gold Announces Large, High-Grade Initial Resource at Thunder Creek.
2012-01-12; Makuch, T., Lake Shore Reports 2011 Operating Results, Pours 26,550 ounces in Fourth Quarter and 86,565 ounces for Full Year.
2012-01-17; Makuch, T., Lake Shore Gold Announces New Extension at Thorne Property, Mineralization Now Confirmed 750 Metres East of Existing Resource.
2012-02-08; Makuch, T., Lake Shore and Franco-Nevada Enter Agreement for $50 Million Royalty and Equity Investment.
2012-02-15; Makuch, T., Lake Shore Confirms Large-Scale Resources For Timmins West Mine.
2012-02-22; Makuch, T., Lake Shore Gold Announces Large Increase in Resources at Gold River Trend, Total Ounces Nearly Triple, Grade, Doubles.
2012-02-28; Makuch, T., Lake Shore Gold Announces Results of Preliminary Economic Assessment for the Timmins West Mine, PEA Highlights Potential Positive Economics, Substantial Cash Flow, and Attractive Returns.
2012-03-08; Makuch, T., Lake Shore Gold and Franco-Nevada Complete $50 Million Royalty and Equity Investment Transaction.
2012-03-26; Makuch, T., Lake Shore Gold Announces Fourth Quarter and Full-Year 2011 Financial Results, Company on Track for Rapid Production Growth by Late 2012.
2012-03-30; Makuch, T., Lake Shore Gold Announces Large Increase in Measured and Indicated Resources at Bell Creek Mine.
2012-03-30; Makuch, T., Lake Shore Gold Files Technical Report for Timmins West Mine.
2012-04-02; Makuch, T., Lake Shore Gold Announces Reserve Estimate for Timmins West Mine, New Reserve to Support Next Five Years of Production.
214
2012-04-05; Makuch, T., Lake Shore Gold Announces First Quarter 2012 Operating Results, Company on Track to Achieve 2012 Production Target.
2012-04-05; Makuch, T., Lake Shore Gold announces filing of Gold River Trend Technical Report.
2012-04-11; Makuch, T., Lake Shore Gold Enters Agreement for Credit Facility of up to $70 Million with Sprott Resource Lending Partnership.
2012-05-01; Makuch, T., Lake Shore Gold Reports Significant New Drill Intercepts at Fenn-Gib Open-Pit Project Including 1.93 gpt Gold Over 241.20 Metres, Results Highlight Potential for Major Resource Expansion.
2012-05-10; Makuch, T., Lake Shore Gold Exceeds Targets and Achieves Continued Operating Improvements During First Quarter 2012, Company Remains on Track for Strong Production Growth and Positive Free Cash Flow.
2012-05-18; Makuch, T., Lake Shore Gold Files Timmins West Mine Reserve Technical Report
2012-05-24; Makuch, T., Lake Shore Gold Reports Smoke from Forest Fire Results in Precautionary Suspension of Mining at Timmins West Mine, Mill Production Unaffected
2012-05-27; Makuch, T., Lake Shore Gold Resumes Mining Operations at Timmins West Mine
2012-06-17; Makuch, T., Lake Shore Gold Announces Significant Extension of High-Grade Core at Gold River Trend
2012-06-08; Makuch, T., Standard & Poor’s Announces Changes in the S&P/TSX Canadian Indices
2012-06-13; Makuch, T., Lake Shore Gold Forecasts 2012 Cost Savings While Remaining on Track to Achieve Key Production Targets
2012-06-14; Makuch, T., Lake Shore Gold Completes Credit Facility Agreement for Up to $70 Million with Sprott Resource Lending Partnership
2012-07-04; Makuch, T., Lake Shore Gold Reports Strong Second Quarter Production of 24,426 Ounces of Gold
2012-07-13; Makuch, T., Lake Shore Gold Announces Details of Second Quarter 2012 Conference Call and Webcast
2012-07-26; Makuch, T., Lake Shore Gold and Revolution Resources Amend Option Agreement for Mexican Properties
2012-08-09; Makuch, T., Lake Shore Gold Reports Strong Second Quarter Results
2012-09-11; Makuch, T., Lake Shore Gold Announces Management Change
2012-09-18; Makuch, T., Lake Shore Gold Announces Exercise of Underwriters’ Over-Allotment Option for $13.5 Million of Additional Convertible Debentures
215
2012-10-10; Makuch, T., Lake Shore Gold Reports Third Quarter 2012 Production of 20,939 Ounces of Gold, Company Remains on Track to Achieve 2012 Production Guidance
2012-10-25; Makuch, T., Lake Shore Gold Announces Details of Third Quarter 2012 Conference Call and Webcast
2012-11-07; Makuch, T., Lake Shore Gold Reports Third Quarter 2012 Results, Company on Track to Meet 2012 Production Target and Achieve Strong Growth in 2013
2012-12-11; Makuch, T., Lake Shore Gold on Track for Strong Finish to 2012, Processing Capacity Increased by 25%
2013-01-10; Makuch, T., Lake Shore Gold Achieves 2012 Production Target, Company Poised for Sharply Higher Production and Lower Costs in 2013
2013-01-11; Makuch, T., Lake Shore Gold Announces Adoption of Corporate Governance Measures
2013-01-21; Makuch, T., Lake Shore Gold Discovers New Mineralization 850 Metres South of Thunder Creek Along TC-144 Trend
2013-01-28; Makuch, T., Lake Shore Gold Announces Launch of Investor Webinar Series
2013-01-30; Makuch, T., Lake Shore Gold Reaches Agreement to Sell Mexican Properties to Revolution Resources
2013-02-01; Makuch, T., Lake Shore Gold to Draw $35 Million Standby Line of Credit
2013-02-06; Makuch, T., Lake Shore Gold Announces Management Change
2013-02-25; Makuch, T., Lake Shore Gold to Reduce Carrying Value of Assets
2013-02-28; Makuch, T., Lake Shore Gold to Host Second Investor Webinar
2013-03-12; Makuch, T., Lake Shore Gold Announces Details of Full Year and Fourth Quarter 2012 Conference Call and Webcast
2013-03-18; Makuch, T., Lake Shore Gold Reports Solid Progress in 2012, Company Nearing Completion of Key Construction Programs, Strong Production Growth and Lower Costs Planned in 2013
2013-03-19; Makuch, T., Lake Shore Gold Announces Appointment of Philip C. Yee as Vice-President & Chief Financial Officer
2013-03-28; Makuch, T., Lake Shore Gold Files Bell Creek Mine Reserve Technical Report
2013-04-08; Makuch, T., Lake Shore Gold Reports First Quarter 2013 Production of 23,200 Ounces of Gold
2013-04-22; Makuch, T., Lake Shore Gold to Hold Annual Meeting in Toronto on May 15, 2013
216
2013-05-07; Makuch, T., Lake Shore Gold Announces Details of First Quarter 2013 Conference Call and Webcast
2013-05-09; Makuch, T., Lake Shore Gold Completes Sale of Mexican Portfolio to Revolution Resources Corp. for Significant Equity Interest
2013-05-10; Makuch, T., Lake Shore Gold Announces Amendments to Shareholder Meeting Matters
2013-05-14; Makuch, T., Lake Shore Gold Reports First Quarter 2013 Results
2013-05-16; Makuch, T., Lake Shore Gold Announces Results of Shareholders’ Meeting
2013-06-24; Makuch, T., Lake Shore Gold Reports Improving Operating Performance, Company on Track for Strong Second Quarter and for Net Free Cash Flow by Late 2013
2013-07-04; Makuch, T., Lake Shore Gold Reports Record Production in Second Quarter 2013
2013-07-29; Makuch, T., Lake Shore Gold Announces Details of Second Quarter 2013 Conference Call and Webcast
2013-08-12; Makuch, T., Lake Shore Gold Reports Record Production and Lower Operating Costs in Second Quarter 2013, Commissioning of Mill Expansion Progressing
2013-10-09; Makuch, T., Lake Shore Gold Reports Solid Third Quarter 2013 Operating Results, Announces Completion of Mill Expansion and Achievement of Production Target of Over 3,000 Tonnes Per Day
2013-10-23; Makuch, T., Lake Shore Gold Announces Details of Third Quarter 2013 Conference Call and Webcast
2013-11-05; Makuch, T., Lake Shore Gold Appoints Diane Francis to Board of Directors
2013-11-05; Makuch, T., Lake Shore Gold Reports Lower Costs, Improved Grades and Higher Gold Sales in Third Quarter 2013
2013-12-03; Makuch, T., Lake Shore Gold Produces 16,700 Ounces in November, Company Generating Net Free Cash Flow in Fourth Quarter 2013
2013-12-10; Makuch, T., Lake Shore Gold Increases 2014 Production Guidance
2013-12-16; Makuch, T., Lake Shore Gold Extends Maturity of Standby Line of Credit and Reduces Debt Levels
2014-01-07; Makuch, T., Lake Shore Gold Achieves Record Production of 134,600 Ounces in 2013 and 51,700 Ounces During Fourth Quarter
2014-01-24; Makuch, T., Lake Shore Gold’s Preliminary 2013 Operating Cost Per Ounce Sold Beats Company Guidance
217
2014-03-10; Makuch, T., Lake Shore Gold Announces Details of Fourth Quarter and Full-Year 2013 Conference Call and Webcast
218
28.0 DATE AND SIGNATURE PAGE
This report titled “43-101 Technical Report, Updated Mineral Reserve Estimate For Timmins West Mine, Timmins, Ontario, Canada” having an effective date of February 21, 2014 was prepared under the supervision of the following Qualified Persons:
| (Signed & Sealed) “Natasha Vaz” |
| |
Dated at Timmins, Ontario | |
March 31, 2014 | Natasha Vaz, P. Eng., MBa |
| VP Technical Services |
| Lake Shore Gold Corp. |
| |
| |
| (Signed & Sealed) “Eric Kallio” |
| |
Dated at Timmins, Ontario | |
March 31, 2014 | Eric Kallio, P. Geo. |
| VP Exploration |
| Lake Shore Gold Corp. |
219
29.0 CERTIFICATES OF QUALIFIED PERSONS
CERTIFICATE
To Accompany the Report titled “43-101 Technical Report, Mineral Reserve Estimate Update For Timmins West Mine, Timmins, Ontario, Canada.
I, Natasha Vaz, do hereby certify that:
1. I reside at 441 Marc Santi Blvd, Maple, Ontario.
2. I am a graduate of the University of Toronto, Toronto, Ontario with a B.Sc. in Mineral Engineering.
3. I have practiced my profession continuously since 2002.
4. I am a member of the Professional Engineers of Ontario (Membership Number 100122657).
5. I have been continuously employed during this period by Goldcorp Inc., Red Lake Gold Mines, FNX Mining, and Lake Shore Gold Corp.
6. I have experience in operations, engineering, and project management in underground mining environments. My accountabilities in this role included all phases of project development from project evaluation (study) through to project development (execution).
7. I have read the definition of “qualified person” set out in NI 43-101 and certify that by reason of my education, affiliation with a professional association and past relevant work experience, I fulfill the requirements to be a qualified person for the purpose of NI 43-101.
8. I am currently employed by Lake Shore Gold Corp. (since May 2008) and now hold the position of Vice-President, Technical Services. I am directly accountable for the Updated Reserve estimate for Timmins West Mine. I have provided constant feedback and oversight throughout the development of the Reserve Estimate and have reviewed all supporting documentation.
9. I take personal accountability for the content of Items 1, 2, 3, 4, 13, 15, 16, 17, 18, 19, 20, 21, 22, 24, 25, 26, 27, 28, and 29, which I have reviewed and found to be fair and reasonable assessments suitable for inclusion in the estimated Updated Reserves for Timmins West Mine having an effective date of February 21, 2014.
10. I am not aware of any material fact or material change with respect to the subject matter of the Technical Report that is not reflected in the Technical Report.
11. I have read NI 43-101 and form 43-101F1, as well as the Repeal and Replacement of NI 43-101 Standards of Disclosure for Mineral Projects, Form 43-101F1 Technical Reports, and Companion Policy 43-101CP (April 08, 2011) and this Technical Report has been prepared in compliance with these instruments and forms.
12. I consent to the filing of the Technical Report with any stock exchange and other regulatory authority and any publication by them for regulatory purposes, including electronic publication in the public company files on their websites accessible by the public, of the Technical Report.
Dated in Timmins, Ontario, this 31st day of March 2014.
“Natasha Vaz” |
(Signed and Sealed) |
Natasha Vaz, P. Eng., MBA |
220
CERTIFICATE
To Accompany the Report titled “43-101 Technical Report, Mineral Reserve Estimate Update For Timmins West Mine, Timmins, Ontario, Canada”.
I, Eric Kallio, do hereby certify that:
1. I reside at 38 Halldorson Ave, Aurora, ON.
2. I am a graduate of University of Waterloo with a B.Sc. (Hons) in Earth Sciences.
3. I have practiced my profession continuously since 1980.
4. I am a member of the Association of Professional Geoscientists of Ontario (0174).
5. I have practiced my profession as a geologist for 32 years being employed by Placer Dome Canada as Chief Geologist at the Dome Mine, Centerra Gold as Senior Resource Geologist, Kinross Gold as Exploration Manager for Canada, Patricia Mining as Vice President Exploration and as an Independent Geological Consultant for a wide variety of companies in both Canada and abroad including Detour Gold Corp, Pelangio Mines Inc., Ursa Major Minerals, Golden Goose Resources, Verena Minerals, Baffinland Iron Mining, Goldeye Exploration and others.
6. I have experience with various mineral deposit types, Mineral Resource estimation techniques, and the preparation of technical reports.
7. I have read the definition of “qualified person” set out in NI 43-101 and certify that by reason of my education, affiliation with a professional association and past relevant work experience, I fulfill the requirements to be a qualified person for the purpose of NI 43-101.
8. I am currently employed by Lake Shore Gold Corp. (since 2008), and hold the position of Vice President Exploration. I have been directly involved in design and management of both surface and underground and surface exploration, evaluation of new exploration and mining opportunities and management of the underground geology departments at the Timmins West and Bell Creek Mine sites.
9. I take personal accountability for the content of Items 5, 6, 7, 8, 9, 10, 11, 12, 14, 23 and parts of Items 1, 2, 3, 4, 24, 25, 26 and 27 of the report which I have reviewed and found to be fair and reasonable assessments suitable for inclusion in the estimated Updated Reserves for Timmins West Mine having an effective date of February 21, 2014.
10. I am not aware of any material fact or material change with respect to the subject matter of the Technical Report that is not reflected in the Technical Report.
11. I have read NI 43-101 and form 43-101F1, as well as the Repeal and Replacement of NI 43-101 Standards of Disclosure for Mineral Projects, Form 43-101F1 Technical Reports, and Companion Policy 43-101CP (April 08, 2011) and this Technical Report has been prepared in compliance with these instruments and that forms.
12. I consent to the filing of the Technical Report with any stock exchange and other regulatory authority and any publication by them for regulatory purposes, including electronic publication in the public company files on their websites accessible by the public, of the Technical Report.
Dated in Timmins, Ontario, this 31st day of March 2014.
“Eric Kallio” |
(Signed and Sealed) |
Eric Kallio, P. Geo. |
221
APPENDIX 1
MEMOS REGARDING STATISTICAL ANALYSIS OF QA/QC ASSAY DATA FOR THUNDER CREEK AND TIMMINS WEST DEPOSITS
Statistical Analysis of Thunder Creek QAQC Assay Data: October 28th, 2011 to January 8th, 2014
Introduction
This memo describes a review of Lake Shore Gold’s blind QA/QC program for underground diamond drilling for the Thunder Creek deposit for the period since the last 43-101 Technical report inclusive from October 28th, 2011 to January 8, 2014. During that time period, a total of 71,958 core samples were sent to five different analytical labs, with 39% and 32% going to ALS Canada and Accurassay respectively. These two main analytical labs used have full accreditation. Activation Laboratories has ISO 9001(working towards 17025 CANP4E in early 2014). The Bell Creek Laboratory, a Lake Shore Gold operated Mine Lab and Cattarello Assayers are both non-accredited. Table 1.1 summarizes the number of samples sent to the various labs and the number of QA/QC samples used. Due to the low number of samples sent to Activation Labs, no analysis was completed on standards, but check assaying on pulps was done.
Table 1.1: Thunder Creek Samples: 28Oct11 - 08Jan14
Laboratory | | Drill Core
Samples | | Standards | | Blanks | | Coarse
Duplicates | | Total
QA/QC
Samples | |
Accurassay Laboratories | | 22,673 | | 1,214 | | 1,305 | | 1,181 | | 3,700 | |
Activation Laboratories | | 2,202 | | 50 | | 55 | | 49 | | 154 | |
ALS Canada Ltd. | | 28,367 | | 1,273 | | 1,302 | | 1,192 | | 3,767 | |
Bell Creek Laboratory | | 11,845 | | 442 | | 529 | | 437 | | 1,408 | |
Cattarello Assayers | | 6,871 | | 319 | | 353 | | 311 | | 983 | |
ALL LABS | | 71,958 | | 3,298 | | 3,544 | | 3,170 | | 10,012 | |
1.0 Standards
From October 28th, 2011 to January 8th, 2014, nearly 3,300 standard pulps were sent to assay laboratories for analysis.
Results from a variety of standard pulps from four labs have been separated and analyzed from the Thunder Creek Underground project. The labs used in the time period from October 28th, 2011 to January 8th, 2014 were as follows: Accurassay Laboratories, Activation Laboratories Ltd., ALS Canada Ltd., Bell Creek Laboratory, and Cattarello Assayers Inc.
Summary statistics of standard results have are shown below. Each table lists the following:
· Target value of standard
· Standard deviation of standard
· The minimum / maximum gates of the standard (±3 standard deviations)
· The number of results for the standard (Nb)
· The mean / average result (Average)
· Percent relative difference between the mean result and the target (%Diff)
· A flag which indicates if the difference is significant at the 95% confidence level, given the expected standard deviation of the number of results. The difference is significant if its absolute value exceeds (2*StDev)/Nb0.5 (Sig=1 if significant).
· Percentage of results below and above the target (PBelow and PAbove)
· Percentage of results outside the Min/Max gates of target
Statistics were compiled for any standards that have more than 20 results. All standards have been plotted on the graphs for each laboratory (Fig. 1.1 to Fig. 1.5).
There were 11 mislabels removed from the Accurassay statistics (three of O-15h, two of O-19a and O-503, three of O-61d, and one of O-62c), eight mislabels removed from the ALS statistics (one of O-16b, two of O-19a and O-503, one of O-61d, O-62c and O-67a), and two mislabels removed from the Cattarello statistics (one of O-17c and O-503). Activation Laboratories did not have any standards with more than 20 results, but all standards can be seen in Fig 1.2.
ALS Canada performed the best for standards, having a failure rate of 2.98%, with a total amount of standards being 1210, which is the largest sample batch. Cattarello performed the best for the standards, having a failure rate of 3.54%. They had the lowest total amount of standard results (311). Bell Creek Lab performed well, with a failure rate of 4.30%, out of 349 samples. This percentage is somewhat skewed by one poor standard that failed 15.91% on its own. Accurassay performed the worst overall, with a failure rate of 13.29%, out of 1195 samples.
In terms of precision, ALS, Cattarello and Bell Creek have similar good performance, ie, % of returns outside of the failure limits were from 2.98% to 4.30%. Accurassay had the poorest results with 12.64% failures. The performance of all four labs is acceptable, but with the highest failure rate for standards, LSG discontinued using Accurassay in May 2013.
In terms of accuracy, Accurassay, Bell Creek and ALS all look good with average relative difference of -0.303, 0.457 and -0.509 respectively. Cattarello is low at -1.37% overall relative difference and also has the lowest overall difference of any standard with 61% of results below target. This indicates that the lab may be slightly underestimating the grade.
See Fig. 1.1 to 1.5 for detailed plots for each laboratory. See Table 1.2 to 1.5 for detailed statistics.
2.0 Blanks
Results from blanks have also been separated by each lab. Here we determine the percentage of results above a given failure limit. Traditionally the cutoff limit is five times the detection limit (0.0125 g/t Au). Lake Shore Gold cutoff limit is 0.1 g/t Au.
ALS Canada performed the best for the blanks. There were 1302 blanks sent to ALS Canada during the time period, in which 8 of them failed, giving a percent failure of 0.61%.
Bell Creek Lab performed second best for the blanks. There were 529 blanks sent, of which 4 of them failed, giving a failure rate of 0.76%.
Cattarello, Accurassay, and Activation labs also performed well, having failing rates of 1.13%, 1.23%, and 1.82% respectively. Actlabs only had a total of 55 blanks, which is much smaller than the rest of the sample sizes.
See Table 2.1 below for a breakdown of the blank statistics.
Table 2.1: Blank Statistics for Each Laboratory Used
Lab | | Total Blanks | | Number > 0.1 | | % > 0.1 | |
ACCURASSAY | | 1,305 | | 16 | | 1.23 | |
Actlabs | | 55 | | 1 | | 1.82 | |
ALS Canada | | 1,302 | | 8 | | 0.61 | |
Bell Creek | | 529 | | 4 | | 0.76 | |
Cattarello | | 353 | | 4 | | 1.13 | |
See Fig. 2.1 to Fig. 2.5 for detailed plots of each laboratory.
From these results, no serious contamination is evident in the data presented.
3.0 Coarse Duplicates
Coarse duplicates are assays from a new pulp taken from the crushed and ground (but not pulverized) reject of the original sample. There is more variability in these duplicates than in lab duplicates. A total of 3,170 course duplicates were sent to the various labs, with detailed statistics shown in Tables 3.1 to 3.4.
Cattarello Lab had the lowest percent difference between means (0.50%), with a correlation coefficient of 0.91. A total of 311 coarse duplicate pairs were sent to Cattarello Lab.
The next best performer for the coarse duplicates was Bell Creek Lab. There were a total of 437 pairs of coarse duplicates. The percent difference between the two means is -7.73%, with a correlation coefficient of 0.96.
A total of 1192 coarse duplicate pairs were sent to ALS Canada. This lab performed well for the coarse duplicates, with a percent difference of 10.01% between means, with a correlation coefficient of 0.94. ALS Canada had a large difference in the maximum value between original/duplicate (original maximum value of 225g/t, and a duplicate maximum value of 385g/t). This could explain the somewhat “poor” percent difference.
Out of 49 coarse duplicate pairs, Activation Laboratories had a somewhat high percent difference (14.26%), but a very good correlation coefficient (1.00). There is also a large difference between maximum original and duplicate value for this lab (387g/t original versus 461g/t duplicate). A larger number of samples are recommended for this lab in order that significant observations can be made.
Accurassay Laboratory performed the poorest of all the labs for the coarse duplicates. Out of 1181 coarse duplicate pairs, there is a percent difference of 56.96%, and a correlation coefficient of 0.36. There is a very large difference between maximum values for this lab (77.29g/t original, 589.95g/t duplicate), which could be caused by coarse gold. These results agree generally with the poor performance from the last 43-101 report from this lab with a percentage difference of 50.6% and a correlation coefficient of 0.90.
See Fig. 3.1 to Fig. 3.5 for detailed log-normal plots of statistics for each lab.
4.0 Check Assays
A program of check assaying (total of 2686 pulp samples) was completed on analytical results sent to the various labs for the time periods January 1, 2012 to October 31, 2012, November 1, 2012 to July 31, 2013, August 1, 2013 to October 31, 2013 (see Table 4.0 below). This represents just under 5% of the total samples sent to each individual lab. No check assays were selected for the Cattarello Lab because of the small amount of samples sent to that lab (9.5% of total) and because the lab closed down and has not been sent any drill core samples since late 2012. Check assay programs were completed for the periods January 1, 2012 to October 31, 2012 at ALS Canada, and for the periods November 1, 2012 to July, 2013 and August 1, 2013 to October 31, 2013 at SGS Canada. Results from these three time periods are summarized in Sections 4.1 to 4.3.
Table 4.0: Total Thunder Creek Samples
Used for Check Assay Programs
1 Jan 2012 - 31 Oct 2012
Laboratory | | # Samples | |
Accurassay | | 15062 | |
1 Nov 2012 - 31 Jul 2013
Laboratory | | # Samples | |
Accurassay | | 5244 | |
ActLabs | | 1007 | |
ALS Canada | | 20919 | |
Bell Creek | | 5386 | |
1 Aug 2013 - 31 Oct 2013
Laboratory | | # Samples | |
ActLabs | | 442 | |
ALS Canada | | 3289 | |
Bell Creek | | 826 | |
4.1 ALS Canada Ltd. Check Assay Program — 1 January 2012 to 31 October 2012
A total of 637 Accurassay Laboratories pulps were sent for check assay to ALS Canada Ltd.
The original Accurassay values range from 0.0025 g/t Au to 9.86 g/t Au, and have a mean of 0.42 g/t Au. The check ALS values range from 0.0025 g/t Au to 13.35 g/t Au, and have a mean of 0.43 g/t Au. The percent difference between the means is 2.95%, indicating that the ALS values tend to come back slightly higher than the Accurassay pulps. The correlation coefficient is 0.89, which represents a reasonable linear relationship.
See Table 4.1 for detailed statistics. See Fig. 4.1 for detailed log-normal plot.
4.2 SGS Canada Inc. Check Assay Program — 1 November 2012 to 31 July 2013
The laboratories used in this time period were as follows: Accurassay Laboratories, Activation Laboratories, ALS Canada Ltd., Bell Creek Laboratory, and Cattarello Assayers Inc. A total of 1,782 pulp samples were sent to SGS Canada Inc. for analysis.
The same statistics were compiled for the check assays as the coarse duplicates. In this case, we are comparing result from re-assaying another cut from the same pulps, but at different labs.
4.2.1 Accurassay Laboratories vs. SGS Canada Inc.
A total of 273 Accurassay pulps were sent for check assay to SGS Canada Inc.
The original Accurassay pulps range from 0.0025 g/t Au to 21.34 gt Au, and have a mean of 0.61 g/t Au. The check SGS pulps range from 0.0025 g/t Au to 33.60 g/t Au, and have a mean of 0.68 g/t Au. The percent difference between the means is 10.71%. The correlation coefficient is 0.96, which represents a very strong linear relationship between the sets.
See Table 4.2.1 for detailed statistics and see Fig. 4.2.1 for detailed log-normal plot.
4.2.2 Activations Laboratories vs. SGS Canada Inc.
A total of 58 Activation Laboratories pulps were sent for check assay to SGS Canada Inc.
The original Activation Laboratories values range from 0.0025 g/t Au to 107.00 g/t Au, and have a mean of 4.02 g/t Au. The check SGS values range from 0.0025 g/t Au to 125.74 g/t Au, and have a mean of
4.33 g/t Au. The percent difference between the means is 7.43%. The small sample size may be affecting the percent difference. The correlation coefficient is 1.00, which represents a very strong linear relationship between the sets.
See Table 4.2.2 for detailed statistics and see Fig. 4.2.2 for detailed log-normal plot.
4.2.3 ALS Canada Ltd. vs. SGS Canada Inc.
A total of 1,190 ALS Canada pulps were sent for check assay to SGS Canada Inc.
The original ALS values range from 0.0025 g/t Au to 116.00 g/t Au, and have a mean of 2.40 g/t Au. The check SGS values range from 0.0025 g/t Au to 126.63 g/t Au, and have a mean of 2.44 g/t Au. The percent difference between the means is 1.69%, which indicates that the SGS values tend to be slightly higher. The correlation coefficient is 0.97, which represents a very strong linear relationship between the original and check values.
See Fig. 4.2.3 for detailed log-normal plot. See Table 4.2.3 for detailed statistics.
4.2.4 Bell Creek Laboratory vs. SGS Canada Inc.
A total of 261 Bell Creek Laboratory pulps were sent for check assay to SGS Canada Inc.
The original Bell Creek Lab pulps range from 0.0025 g/t Au to 61.17 g/t Au, and have a mean of 1.62 g/t Au. The check SGS values range from 0.0025 g/t Au to 63.76 g/t Au, and have a mean of 1.75 g/t Au. The percent difference between the means is 7.81%. The data has a correlation coefficient of 0.94, which represents a strong linear relationship between the original and check assays.
See Table 4.2.4 for detailed statistics and see Fig. 4.2.4 for detailed log-normal plot.
4.3 Check Assay Program — 1 August 2013 — 31 October 2013
4.3.1 Activation Laboratories vs. SGS Canada Inc.
There were 29 Activation Laboratories pulps sent for check assay to SGS Canada Inc.
The original Activation Laboratories pulps range in value from 0.0025 g/t Au to 14.90 g/t Au, with a mean of 2.13 g/t Au. The check SGS Canada values range from 0.0025 g/t Au to 13.65 g/t Au, with a mean of 2.05 g/t Au. The correlation coefficient of the means is 0.99, indicating a very strong positive relationship. The percent difference between the means is -4.03%.
See Table 4.3.1 for detailed statistics and see Fig. 4.3.1 for detailed log-normal plot.
4.3.2 ALS Canada Ltd. vs. SGS Canada Inc.
There were 166 ALS Canada pulps sent for check assay to SGS Canada Inc.
The original ALS Canada values range from 0.0025 g/t Au to 61.70 g/t Au, with a mean of 5.03 g/t Au. The check SGS Canada values range from 0.0025 g/t Au to 96.50 g/t Au, with a mean of 5.28 g/t Au. The correlation coefficient is 0.95, which indicates a strong relationship. The percent difference is 4.91%, which could be skewed by the large difference between maximum values.
See Table 4.3.3 for detailed statistics and see Fig. 4.3.3 for detailed log-normal plot.
4.3.3 Bell Creek Laboratory vs. SGS Canada Inc.
There were 72 Bell Creek Laboratory pulps sent for check assay to SGS Canada Inc.
The original Bell Creek Laboratory values range from 0.0025 g/t Au to 19.05 g/t Au, with a mean of 2.21 g/t Au. The check SGS Canada values range from 0.0025 to 18.89 g/t Au, with a mean of 2.10 g/t Au. The correlation coefficient for the pairs is 0.94, which indicates a strong positive relationship between the two sets. The percent difference between the two means is -4.95%.
See Table 4.3.4 for detailed statistics and see Fig. 4.3.4 for detailed log-normal plot.
5.0 Analytical Lab Internal Standards, Blanks, and Duplicates
No analysis has been completed for this report on the main five analytical lab’s internal QA/QC samples (standards, blanks or duplicates). This data is routinely reviewed by the drill program QP and database administrator while assay results are emailed from the respective labs and prior to importation into the database.
6.0 Conclusions
Drill core samples from underground drill holes that were added to the Thunder Creek drill database between October 28, 2011 and January 8, 2014 were sent to five analytical labs.
No critical issues were identified that would lead Lake Shore Gold to believe that there is a concern with the analytical results.
Some issues identified with Accurassay (high failure rate for standards and poor coarse duplicate results) resulted in a decision not to use the lab from May 2013 onward. Cattarello Lab closed down and has not been used since Late 2012.
Table 1.2: Accurassay Laboratories Standard Statistics
Standard | | Target
Au (g/t) | | Std Dev
Au (g/t) | | 3Std Dev Min
Au (g/t) | | 3Std Dev Max
Au (g/t) | | Nb | | Average
Au (g/t) | | %Diff | | Nb Below
Target | | Nb Above
Target | | Nb Fail | | Pbelow
% | | Pabove
% | | Poutside
% | |
O-15h | | 1.019 | | 0.025 | | 0.945 | | 1.093 | | 216 | | 1.003 | | -1.619 | | 125 | | 91 | | 33 | | 57.87 | | 42.13 | | 15.28 | |
O-16b | | 2.210 | | 0.07 | | 1.99 | | 2.43 | | 196 | | 2.207 | | -0.149 | | 119 | | 77 | | 18 | | 60.71 | | 39.29 | | 9.18 | |
O-17c | | 3.040 | | 0.08 | | 2.79 | | 3.29 | | 167 | | 3.059 | | 0.625 | | 62 | | 105 | | 30 | | 37.13 | | 62.87 | | 17.96 | |
O-19a | | 5.490 | | 0.1 | | 5.19 | | 5.79 | | 187 | | 5.442 | | -0.882 | | 93 | | 94 | | 32 | | 49.73 | | 50.27 | | 17.11 | |
O-503 | | 0.687 | | 0.024 | | 0.615 | | 0.759 | | 185 | | 0.690 | | 0.422 | | 89.5 | | 95.5 | | 6 | | 48.38 | | 51.62 | | 3.24 | |
O-61d | | 4.760 | | 0.14 | | 4.33 | | 5.19 | | 27 | | 5.070 | | 6.508 | | 3 | | 24 | | 10 | | 11.11 | | 88.89 | | 37.04 | |
O-62c | | 8.790 | | 0.21 | | 8.16 | | 9.42 | | 168 | | 8.590 | | -2.271 | | 104 | | 64 | | 21 | | 61.90 | | 38.10 | | 12.50 | |
O-65a | | 0.520 | | 0.017 | | 0.469 | | 0.571 | | 49 | | 0.519 | | -0.212 | | 24.5 | | 24.5 | | 1 | | 50.00 | | 50.00 | | 2.04 | |
ALL | | 3.315 | | | | | | | | 1,195 | | 3.322 | | 0.303 | | | | | | | | 47.10 | | 52.90 | | 12.64 | |
Table 1.3: ALS Canada Ltd. Standard Statistics
Standard | | Target
Au (g/t) | | Std Dev
Au (g/t) | | 3Std Dev Min
Au (g/t) | | 3Std Dev Max
Au (g/t) | | Nb | | Average
Au (g/t) | | %Diff | | Nb Below
Target | | Nb Above
Target | | Nb
Fail | | Pbelow
% | | Pabove
% | | Poutside
% | |
O-10c | | 6.600 | | 0.16 | | 6.11 | | 7.08 | | 25 | | 6.636 | | 0.545 | | 12 | | 13 | | 0 | | 48.00 | | 52.00 | | 0.00 | |
O-15d | | 1.559 | | 0.042 | | 1.433 | | 1.685 | | 85 | | 1.548 | | -0.738 | | 46 | | 39 | | 2 | | 54.12 | | 45.88 | | 2.35 | |
O-15h | | 1.019 | | 0.025 | | 0.945 | | 1.093 | | 220 | | 1.011 | | -0.824 | | 134 | | 86 | | 11 | | 60.91 | | 39.09 | | 5.00 | |
O-16b | | 2.210 | | 0.07 | | 1.99 | | 2.43 | | 85 | | 2.197 | | -0.597 | | 48 | | 37 | | 2 | | 56.47 | | 43.53 | | 2.35 | |
O-18c | | 3.520 | | 0.11 | | 3.2 | | 3.84 | | 113 | | 3.491 | | -0.818 | | 73.5 | | 39.5 | | 1 | | 65.04 | | 34.96 | | 0.88 | |
O-19a | | 5.490 | | 0.1 | | 5.19 | | 5.79 | | 36 | | 5.550 | | 1.093 | | 13 | | 23 | | 2 | | 36.11 | | 63.89 | | 5.56 | |
O-2Pd | | 0.885 | | 0.029 | | 0.797 | | 0.973 | | 132 | | 0.874 | | -1.288 | | 86.5 | | 45.5 | | 6 | | 65.53 | | 34.47 | | 4.55 | |
O-502 | | 0.491 | | 0.02 | | 0.431 | | 0.551 | | 65 | | 0.491 | | -0.041 | | 39.5 | | 25.5 | | 1 | | 60.77 | | 39.23 | | 1.54 | |
O-503 | | 0.687 | | 0.024 | | 0.615 | | 0.759 | | 158 | | 0.684 | | -0.393 | | 73 | | 85 | | 3 | | 46.20 | | 53.80 | | 1.90 | |
O-61d | | 4.760 | | 0.14 | | 4.33 | | 5.19 | | 55 | | 4.722 | | -0.807 | | 32.5 | | 22.5 | | 2 | | 59.09 | | 40.91 | | 3.64 | |
O-62c | | 8.790 | | 0.21 | | 8.16 | | 9.42 | | 43 | | 8.624 | | -1.894 | | 28 | | 15 | | 4 | | 65.12 | | 34.88 | | 9.30 | |
O-67a | | 2.238 | | 0.096 | | 1.95 | | 2.526 | | 62 | | 2.189 | | -2.194 | | 38 | | 24 | | 1 | | 61.29 | | 38.71 | | 1.61 | |
O-6Pc | | 1.520 | | 0.065 | | 1.32 | | 1.72 | | 131 | | 1.540 | | 1.336 | | 40.5 | | 90.5 | | 1 | | 30.92 | | 69.08 | | 0.76 | |
ALL | | 3.059 | | | | | | | | 1,210 | | 3.043 | | -0.509 | | | | | | | | 54.58 | | 45.42 | | 2.98 | |
Table1.4: Bell Creek Laboratory Standard Statistics
Standard | | Target
Au (g/t) | | Std Dev
Au (g/t) | | 3Std Dev Min
Au (g/t) | | 3Std Dev Max
Au (g/t) | | Nb | | Average
Au (g/t) | | %Diff | | Nb Below
Target | | Nb Above
Target | | Nb Fail | | Pbelow
% | | Pabove
% | | Poutside
% | |
O-16b | | 2.21 | | 0.07 | | 1.99 | | 2.43 | | 102 | | 2.186 | | -1.077 | | 67.5 | | 34.5 | | 1 | | 66.18 | | 33.82 | | 0.98 | |
O-18c | | 3.52 | | 0.11 | | 3.2 | | 3.84 | | 34 | | 3.516 | | -0.119 | | 19 | | 15 | | 0 | | 55.88 | | 44.12 | | 0.00 | |
O-19a | | 5.49 | | 0.1 | | 5.19 | | 5.79 | | 44 | | 5.550 | | 1.095 | | 15 | | 29 | | 7 | | 34.09 | | 65.91 | | 15.91 | |
O-503 | | 0.687 | | 0.024 | | 0.615 | | 0.759 | | 105 | | 0.708 | | 3.013 | | 24 | | 81 | | 6 | | 22.86 | | 77.14 | | 5.71 | |
O-62c | | 8.79 | | 0.21 | | 8.16 | | 9.42 | | 64 | | 8.735 | | -0.628 | | 38 | | 26 | | 1 | | 59.38 | | 40.63 | | 1.56 | |
ALL | | 4.139 | | | | | | | | 349 | | 4.139 | | 0.457 | | | | | | | | 47.68 | | 52.32 | | 4.30 | |
Table 1.5: Cattarello Assayers Inc. Standard Statistics
Standard | | Target
Au (g/t) | | Std Dev
Au (g/t) | | 3Std Dev Min
Au (g/t) | | 3Std Dev Max
Au (g/t) | | Nb | | Average
Au (g/t) | | %Diff | | Nb Below
Target | | Nb Above
Target | | Nb Fail | | Pbelow
% | | Pabove
% | | Poutside
% | |
O-15h | | 1.019 | | 0.025 | | 0.945 | | 1.093 | | 43 | | 0.955 | | -6.251 | | 40.5 | | 2.5 | | 4 | | 94.19 | | 5.81 | | 9.30 | |
O-16b | | 2.210 | | 0.07 | | 1.99 | | 2.43 | | 44 | | 2.151 | | -2.692 | | 39 | | 5 | | 2 | | 88.64 | | 11.36 | | 4.55 | |
O-17c | | 3.040 | | 0.08 | | 2.79 | | 3.29 | | 55 | | 3.057 | | 0.569 | | 22 | | 33 | | 0 | | 40.00 | | 60.00 | | 0.00 | |
O-19a | | 5.490 | | 0.1 | | 5.19 | | 5.79 | | 47 | | 5.456 | | -0.623 | | 32 | | 15 | | 1 | | 68.09 | | 31.91 | | 2.13 | |
O-503 | | 0.687 | | 0.024 | | 0.615 | | 0.759 | | 37 | | 0.696 | | 1.281 | | 9 | | 28 | | 0 | | 24.32 | | 75.68 | | 0.00 | |
O-62c | | 8.790 | | 0.21 | | 8.16 | | 9.42 | | 85 | | 8.747 | | -0.487 | | 43 | | 42 | | 4 | | 50.59 | | 49.41 | | 4.71 | |
ALL | | 3.539 | | | | | | | | 311 | | 3.510 | | -1.367 | | | | | | | | 60.97 | | 39.03 | | 3.54 | |
Table 3.1: Statistics of Accurassay Coarse Duplicate Results
Stats | | Original Accurassay
Value
Au (g/t) | | Coarse Duplicate
Accurassay Value
Au (g/t) | |
Number of Samples | | 1181 | | 1181 | |
Mean | | 0.67 | | 1.21 | |
Maximum Value | | 77.29 | | 589.95 | |
Minimum Value | | 0.0025 | | 0.0025 | |
Median | | 0.02 | | 0.02 | |
Variance | | 13.20 | | 311.10 | |
Standard Deviation | | 3.63 | | 17.64 | |
Coefficient of Variation | | 5.39 | | 14.58 | |
Correlation Coefficient | | 0.36 | |
Percent Difference between Means | | 56.96 | |
Table 3.2: Statistics of ActLabs Coarse Duplicate Results
Stats | | Original ActLabs
Value
Au (g/t) | | Coarse Duplicate
ActLabs Value
Au (g/t) | |
Number of Samples | | 49 | | 49 | |
Mean | | 9.72 | | 11.21 | |
Maximum Value | | 387.00 | | 461.00 | |
Minimum Value | | 0.0025 | | 0.0025 | |
Median | | 0.46 | | 0.43 | |
Variance | | 3038.50 | | 4312.75 | |
Standard Deviation | | 55.12 | | 65.67 | |
Coefficient of Variation | | 5.67 | | 5.86 | |
Correlation Coefficient | | 1.00 | |
Percent Difference between Means | | 14.26 | |
Table 3.3: Statistics of ALS Coarse Duplicate Results
Stats | | Original ALS Value
Au (g/t) | | Coarse Duplicate
ALS Value
Au (g/t) | |
Number of Samples | | 1192 | | 1192 | |
Mean | | 1.23 | | 1.36 | |
Maximum Value | | 225.00 | | 385.00 | |
Minimum Value | | 0.0025 | | 0.0025 | |
Median | | 0.02 | | 0.02 | |
Variance | | 75.84 | | 147.24 | |
Standard Deviation | | 8.71 | | 12.13 | |
Coefficient of Variation | | 7.08 | | 8.92 | |
Correlation Coefficient | | 0.94 | |
Percent Difference between Means | | 10.012 | |
Table 3.4: Statistics of Bell Creek Laboratory Coarse Duplicate Results
Stats | | Original Bell
Creek Lab Value
Au (g/t) | | Coarse Duplicate
Bell Creek Lab Value
Au (g/t) | |
Number of Samples | | 437 | | 437 | |
Mean | | 1.74 | | 1.61 | |
Maximum Value | | 61.90 | | 61.73 | |
Minimum Value | | 0.0025 | | 0.0025 | |
Median | | 0.05 | | 0.05 | |
Variance | | 46.72 | | 42.45 | |
Standard Deviation | | 6.83 | | 6.52 | |
Coefficient of Variation | | 3.93 | | 4.05 | |
Correlation Coefficient | | 0.96 | |
Percent Difference between Means | | -7.73 | |
Table 3.5: Statistics of Cattarello Coarse Duplicate Results
Stats | | Original Cattarello
Value
Au (g/t) | | Coarse Duplicate
Cattarello Value
Au (g/t) | |
Number of Samples | | 311 | | 311 | |
Mean | | 1.70 | | 1.71 | |
Maximum Value | | 95.66 | | 80.12 | |
Minimum Value | | 0.0025 | | 0.0025 | |
Median | | 0.07 | | 0.07 | |
Variance | | 64.64 | | 56.00 | |
Standard Deviation | | 8.04 | | 7.48 | |
Coefficient of Variation | | 4.72 | | 4.37 | |
Correlation Coefficient | | 0.91 | |
Percent Difference between Means | | 0.50 | |
Table 4.1: Statistics of Check Assay Results - 1 January 2012 — 31 October 2012
Stats | | Accurassay Pulp
Assay
Au (g/t) | | ALS Pulp Assay
Au (g/t) | |
Number of Samples | | 637 | | 637 | |
Mean | | 0.42 | | 0.43 | |
Maximum Value | | 9.86 | | 13.35 | |
Minimum Value | | 0.0025 | | 0.0025 | |
Median | | 0.02 | | 0.02 | |
Variance | | 1.70 | | 2.02 | |
Standard Deviation | | 1.31 | | 1.42 | |
Coefficient of Variation | | 3.12 | | 3.30 | |
Correlation Coefficient | | 0.89 | |
Percent Difference between Means | | 2.95 | |
Tables 4.2.1 to 4.2.4: 1 November 2012 to 31 July 2013 Check Assay Program
Table 4.2.1: Statistics of Check Assay Results - Accurassay vs. SGS Canada Inc.
Stats | | Accurassay Pulp
Assay
Au (g/t) | | SGS Pulp Assay
Au (g/t) | |
Number of Samples | | 273 | | 273 | |
Mean | | 0.61 | | 0.68 | |
Maximum Value | | 21.34 | | 33.60 | |
Minimum Value | | 0.0025 | | 0.0025 | |
Median | | 0.08 | | 0.09 | |
Variance | | 2.81 | | 5.27 | |
Standard Deviation | | 1.68 | | 2.30 | |
Coefficient of Variation | | 2.74 | | 3.36 | |
Correlation Coefficient | | 0.96 | |
Percent Difference between Means | | 10.71 | |
Table 4.2.2: Statistics of Check Assay Results - ActLabs vs. SGS Canada Inc.
Stats | | ActLabs Pulp
Assay
Au (g/t) | | SGS Pulp Assay
Au (g/t) | |
Number of Samples | | 58 | | 58 | |
Mean | | 4.02 | | 4.33 | |
Maximum Value | | 107.00 | | 125.74 | |
Minimum Value | | 0.0025 | | 0.0025 | |
Median | | 0.60 | | 0.60 | |
Variance | | 215.80 | | 292.89 | |
Standard Deviation | | 14.69 | | 17.11 | |
Coefficient of Variation | | 3.65 | | 3.95 | |
Correlation Coefficient | | 1.00 | |
Percent Difference between Means | | 7.43 | |
Table 4.2.3: Statistics of Check Assay Results - ActLabs vs. SGS Canada Inc.
Stats | | ActLabs Pulp
Assay
Au (g/t) | | SGS Pulp Assay
Au (g/t) | |
Number of Samples | | 1190 | | 1190 | |
Mean | | 2.40 | | 2.44 | |
Maximum Value | | 116.00 | | 126.63 | |
Minimum Value | | 0.0025 | | 0.0025 | |
Median | | 0.27 | | 0.25 | |
Variance | | 53.50 | | 61.50 | |
Standard Deviation | | 7.31 | | 7.84 | |
Coefficient of Variation | | 3.05 | | 3.21 | |
Correlation Coefficient | | 0.97 | |
Percent Difference between Means | | 1.69 | |
Table 4.2.4: Statistics of Check Assay Results - Cattarello vs. SGS Canada Inc.
Stats | | Bell Creek Lab
Pulp Assay
Au (g/t) | | SGS Pulp Assay
Au (g/t) | |
Number of Samples | | 261 | | 261 | |
Mean | | 1.62 | | 1.75 | |
Maximum Value | | 61.17 | | 63.76 | |
Minimum Value | | 0.0025 | | 0.0025 | |
Median | | 0.48 | | 0.49 | |
Variance | | 28.48 | | 32.91 | |
Standard Deviation | | 5.34 | | 5.74 | |
Coefficient of Variation | | 3.30 | | 3.28 | |
Correlation Coefficient | | 0.94 | |
Percent Difference between Means | | 7.81 | |
Tables 4.3.1 to 4.3.3: 1 August 2013 to 31 October 2013 Check Assay Program
Table 4.3.1: Statistics of Check Assay Results - ActLabs vs. SGS Canada Inc.
Stats | | ActLabs Pulp Assay
Au (g/t) | | SGS Pulp Assay
Au (g/t) | |
Number of Samples | | 29 | | 29 | |
Mean | | 2.13 | | 2.05 | |
Maximum Value | | 14.90 | | 13.65 | |
Minimum Value | | 0.0025 | | 0.0025 | |
Median | | 0.31 | | 0.25 | |
Variance | | 17.90 | | 14.84 | |
Standard Deviation | | 4.23 | | 3.85 | |
Coefficient of Variation | | 1.98 | | 1.88 | |
Correlation Coefficient | | 0.99 | |
Percent Difference between Means | | -4.03 | |
Table 4.3.2: Statistics of Check Assay Results - ALS vs. SGS Canada Inc.
Stats | | ALS Pulp Assay
Au (g/t) | | SGS Pulp Assay
Au (g/t) | |
Number of Samples | | 166 | | 166 | |
Mean | | 5.03 | | 5.28 | |
Maximum Value | | 61.70 | | 96.50 | |
Minimum Value | | 0.0025 | | 0.0025 | |
Median | | 0.81 | | 0.79 | |
Variance | | 118.99 | | 147.51 | |
Standard Deviation | | 10.91 | | 12.15 | |
Coefficient of Variation | | 2.17 | | 2.30 | |
Correlation Coefficient | | 0.95 | |
Percent Difference between Means | | 4.91 | |
Table 4.3.3: Statistics of Check Assay Results - Bell Creek Lab vs. SGS Canada Inc.
Stats | | Bell Creek Lab Pulp
Assay
Au (g/t) | | SGS Pulp Assay
Au (g/t) | |
Number of Samples | | 72 | | 72 | |
Mean | | 2.21 | | 2.10 | |
Maximum Value | | 19.05 | | 18.89 | |
Minimum Value | | 0.0025 | | 0.0025 | |
Median | | 0.33 | | 0.47 | |
Variance | | 15.14 | | 14.16 | |
Standard Deviation | | 3.89 | | 3.76 | |
Coefficient of Variation | | 1.76 | | 1.79 | |
Correlation Coefficient | | 0.94 | |
Percent Difference between Means | | -4.95 | |
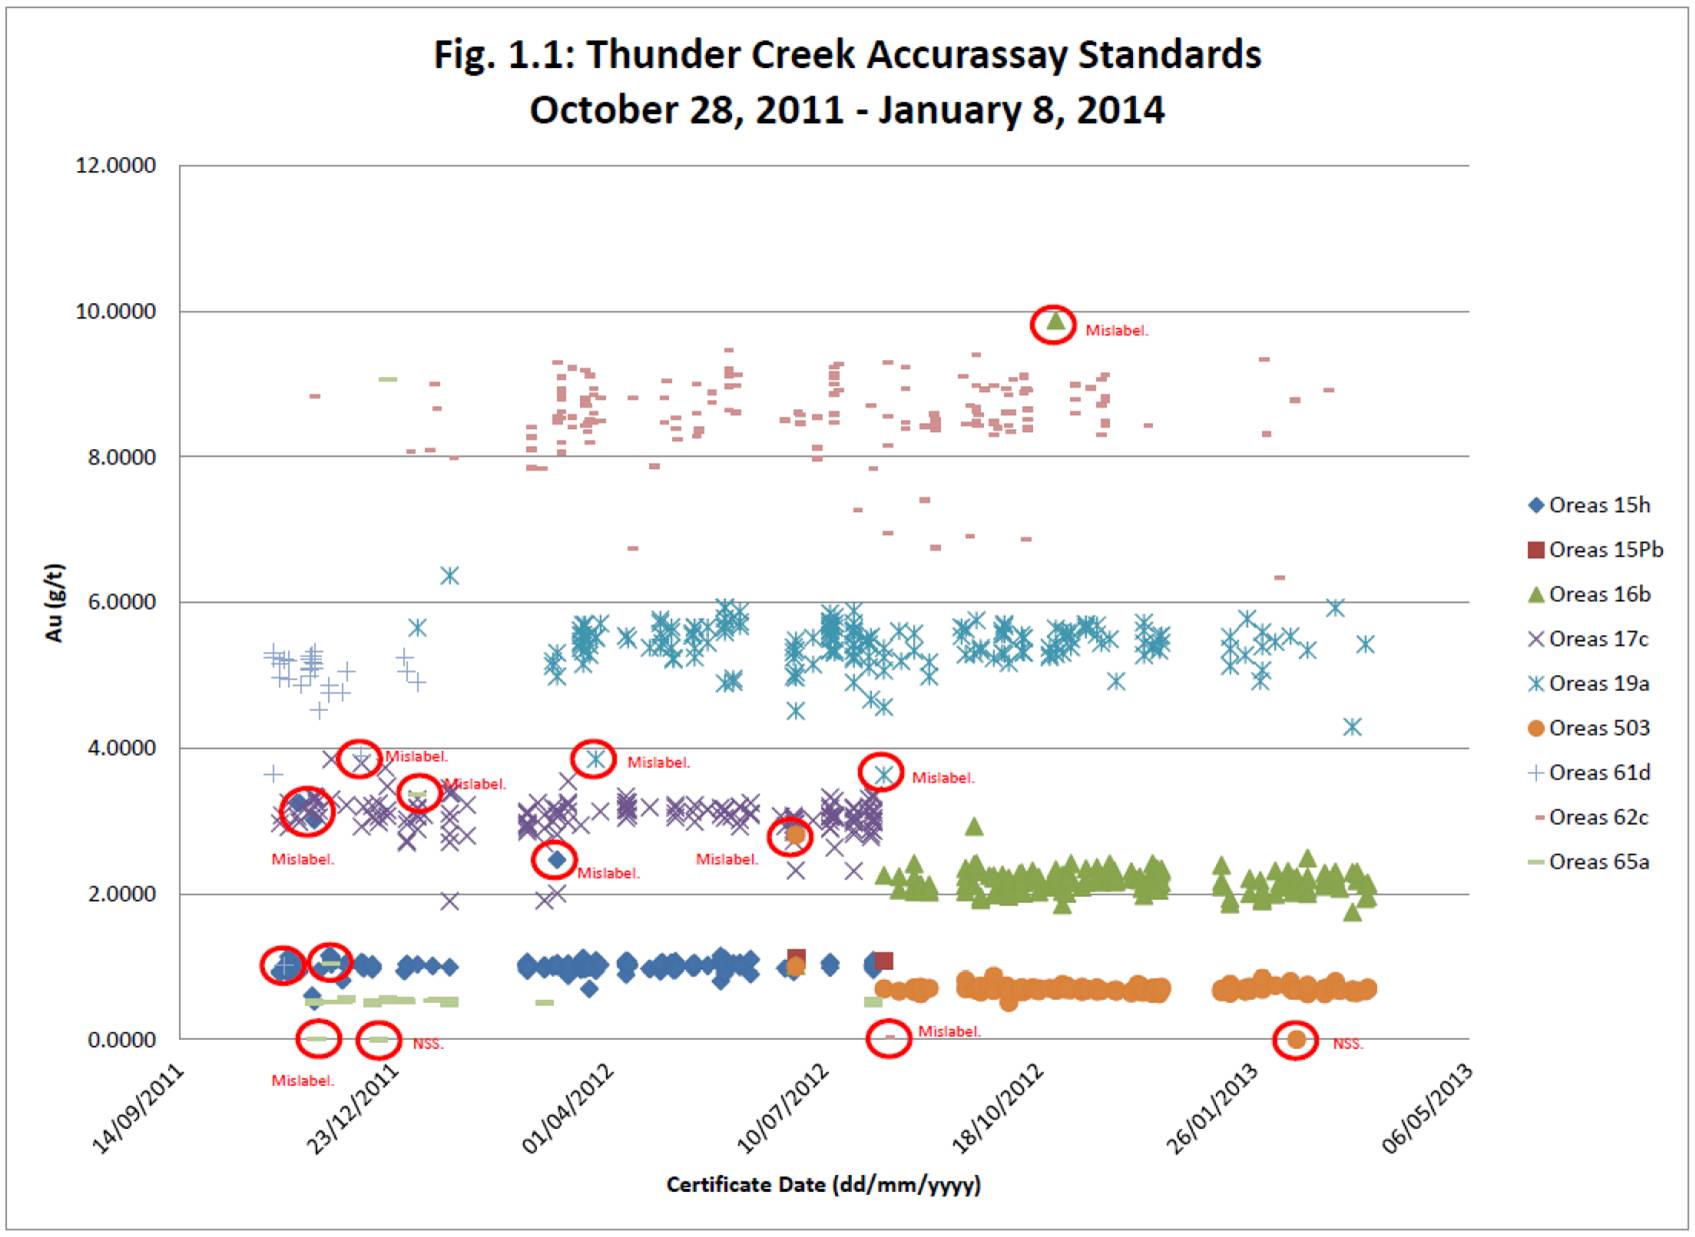
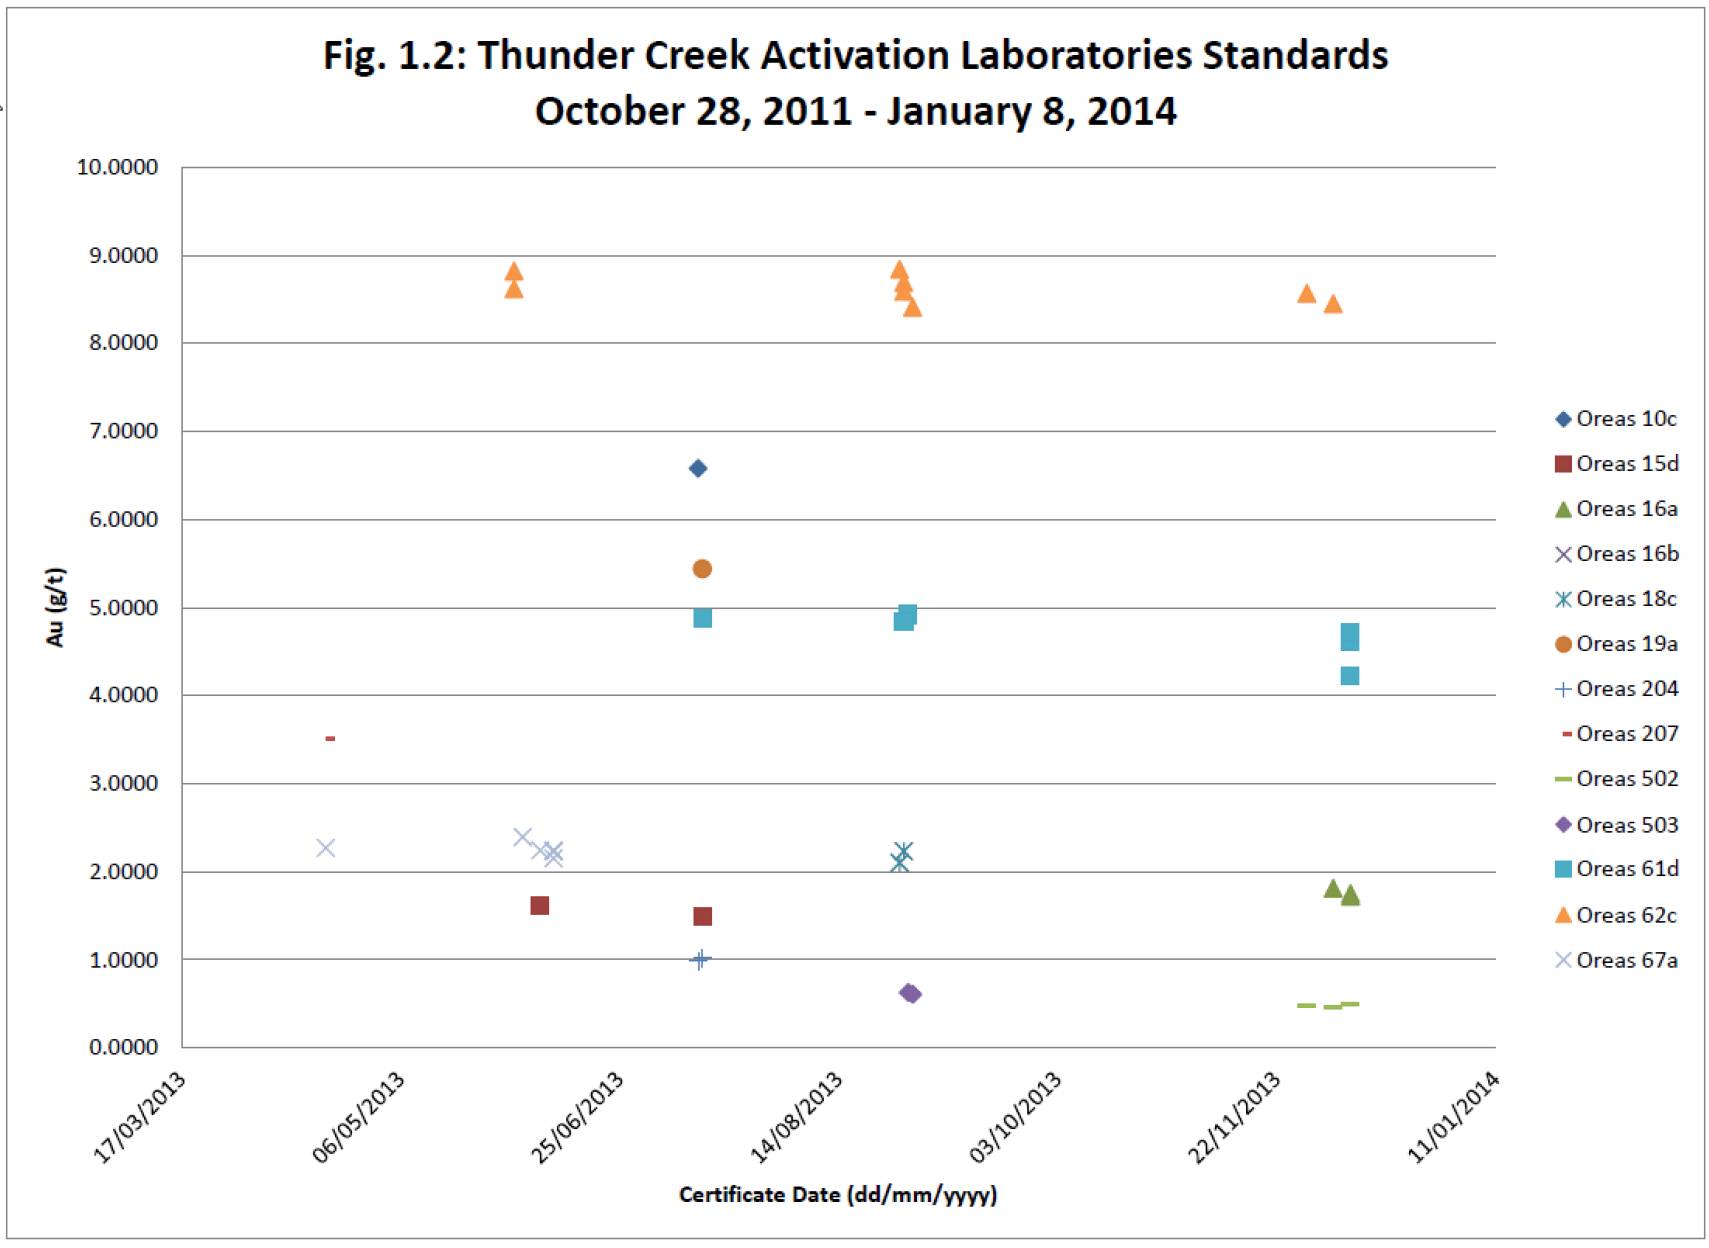

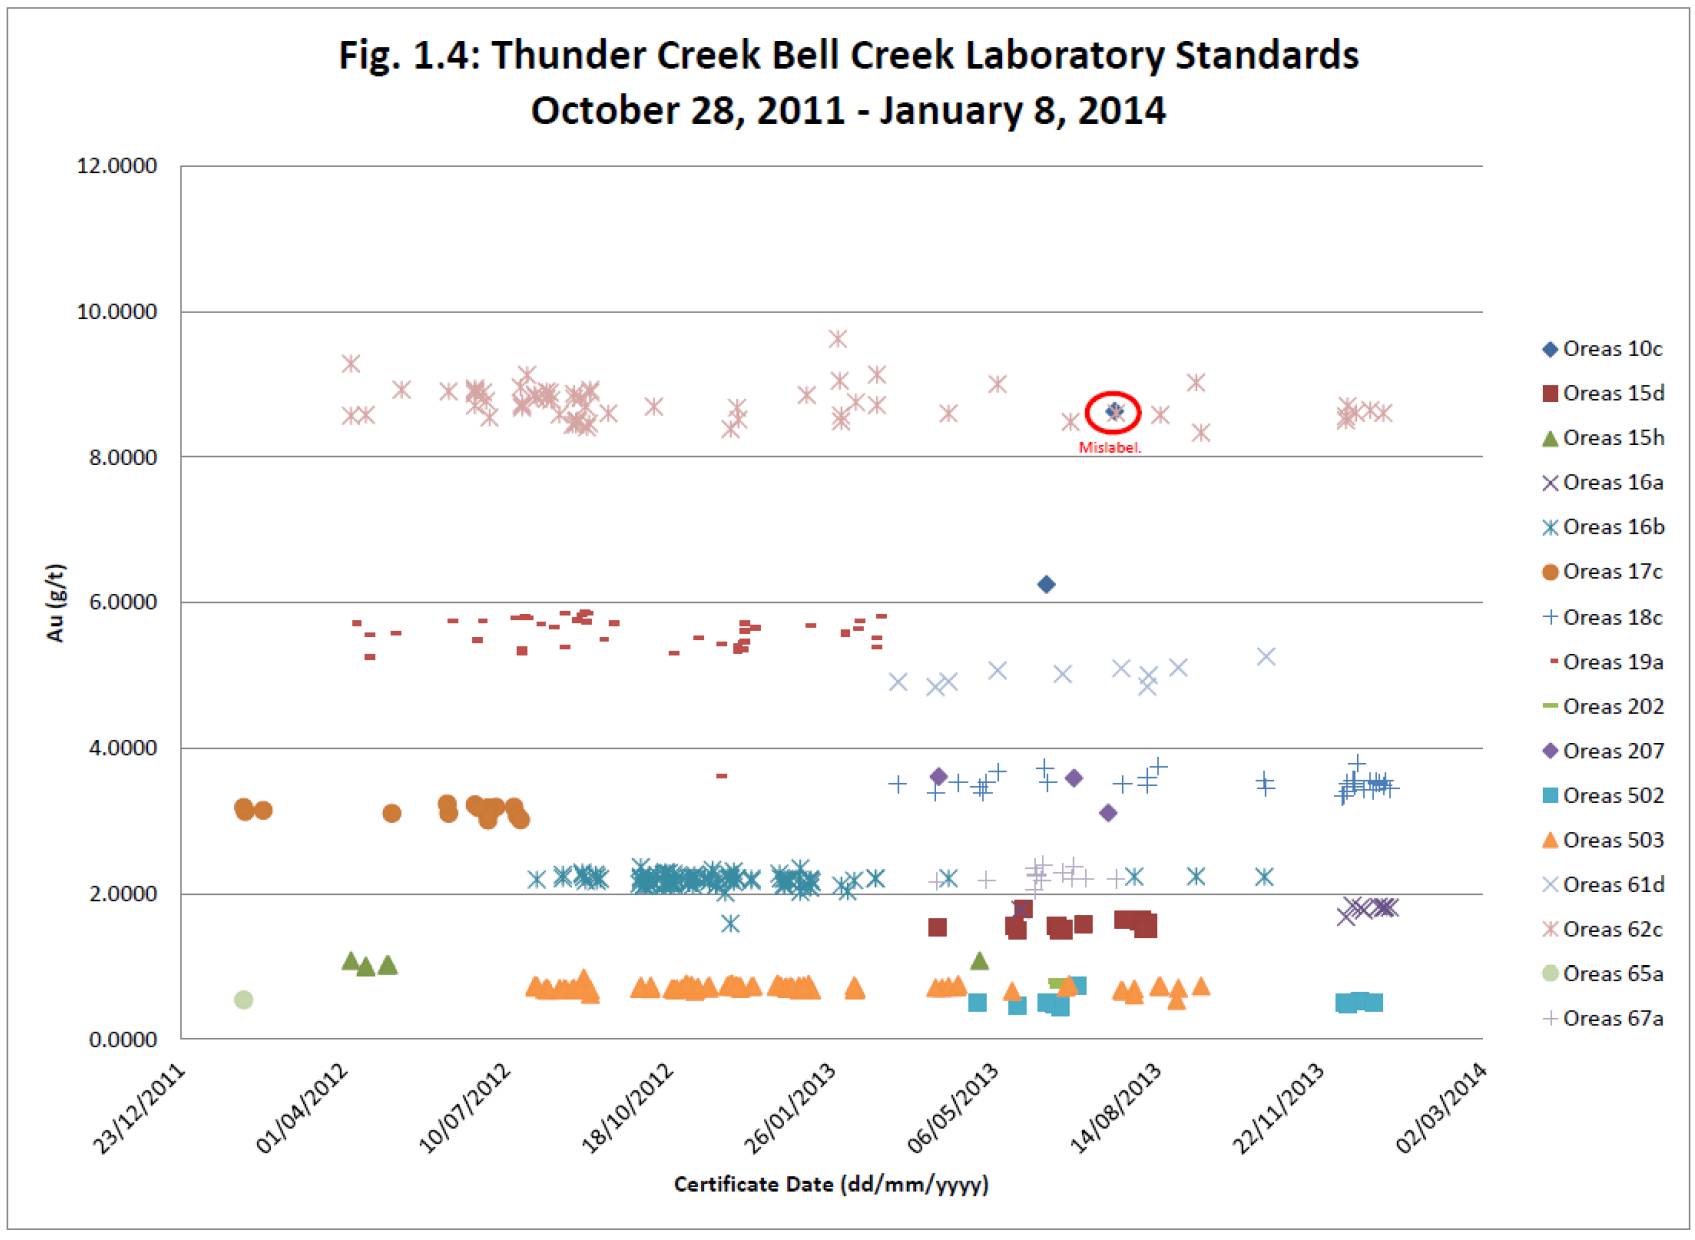
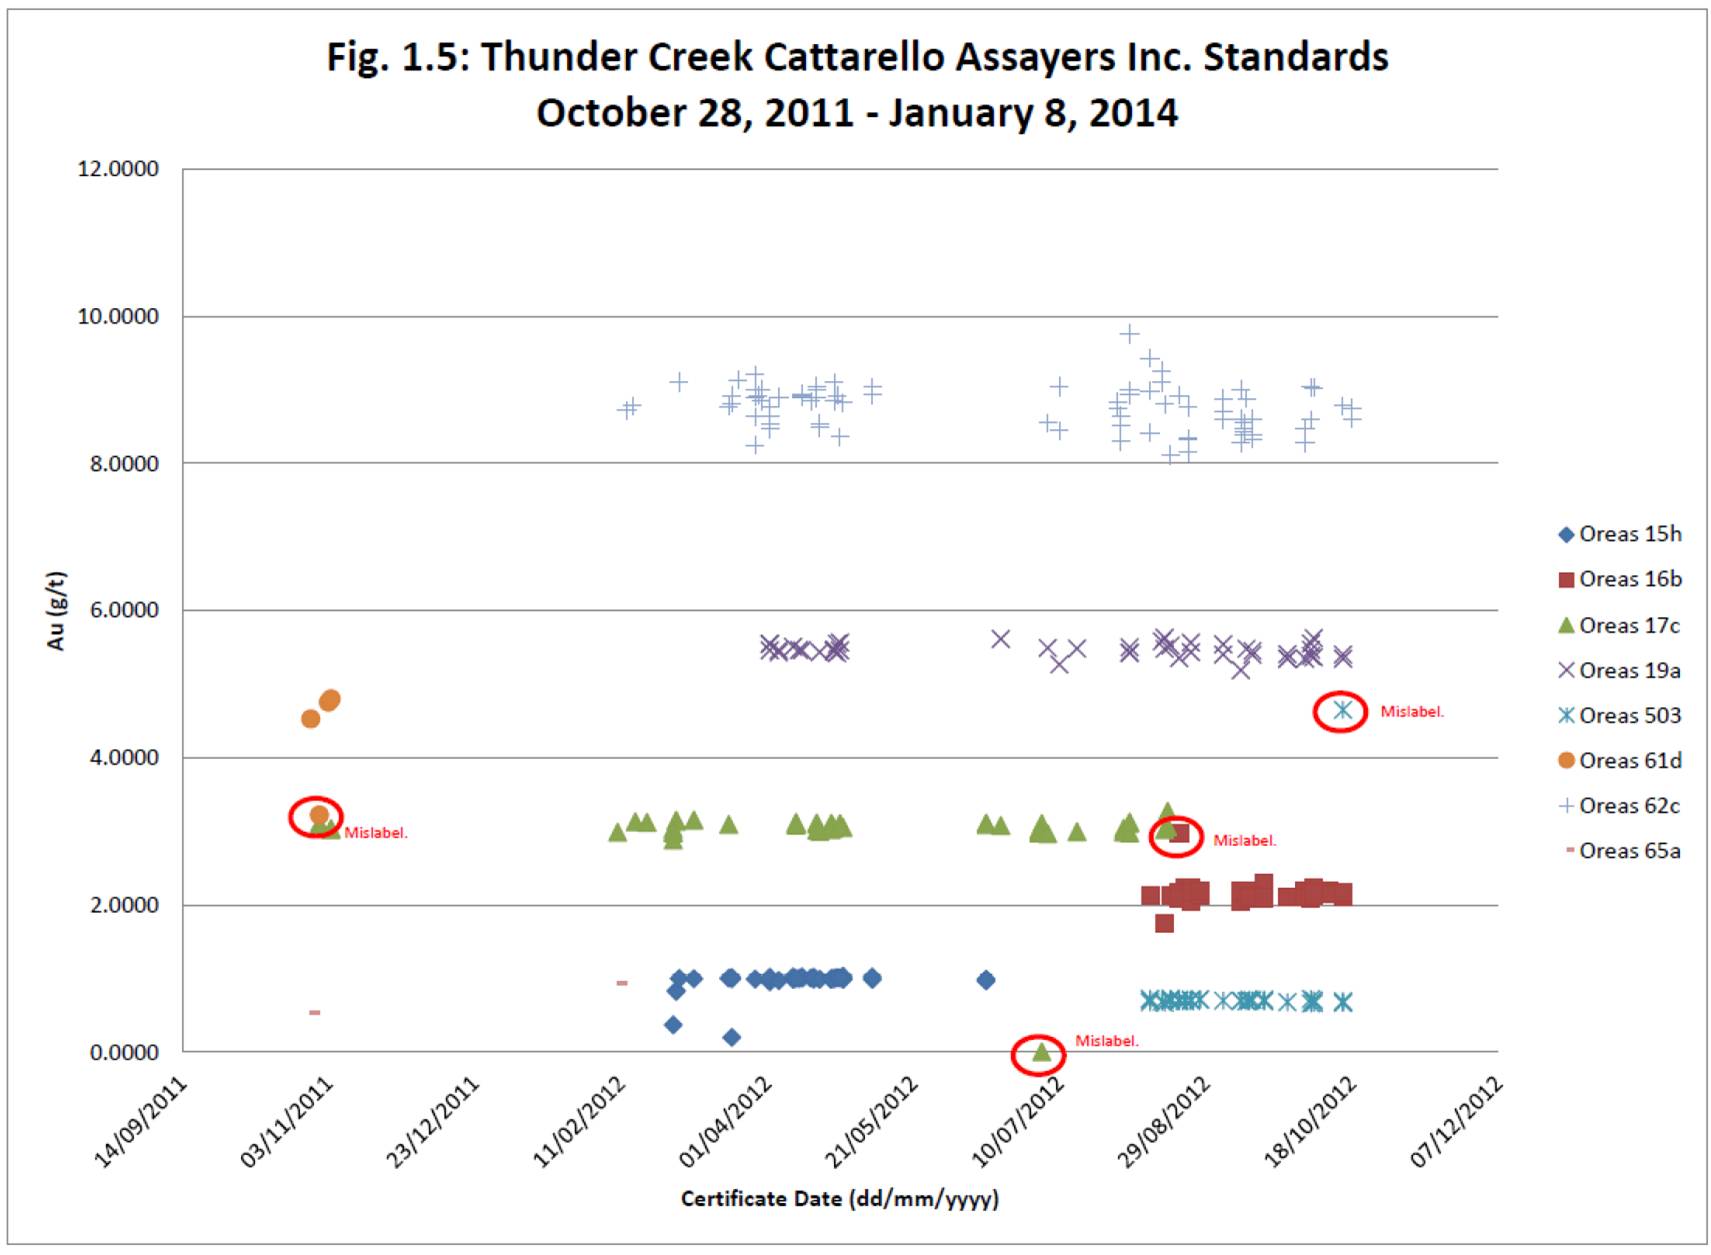
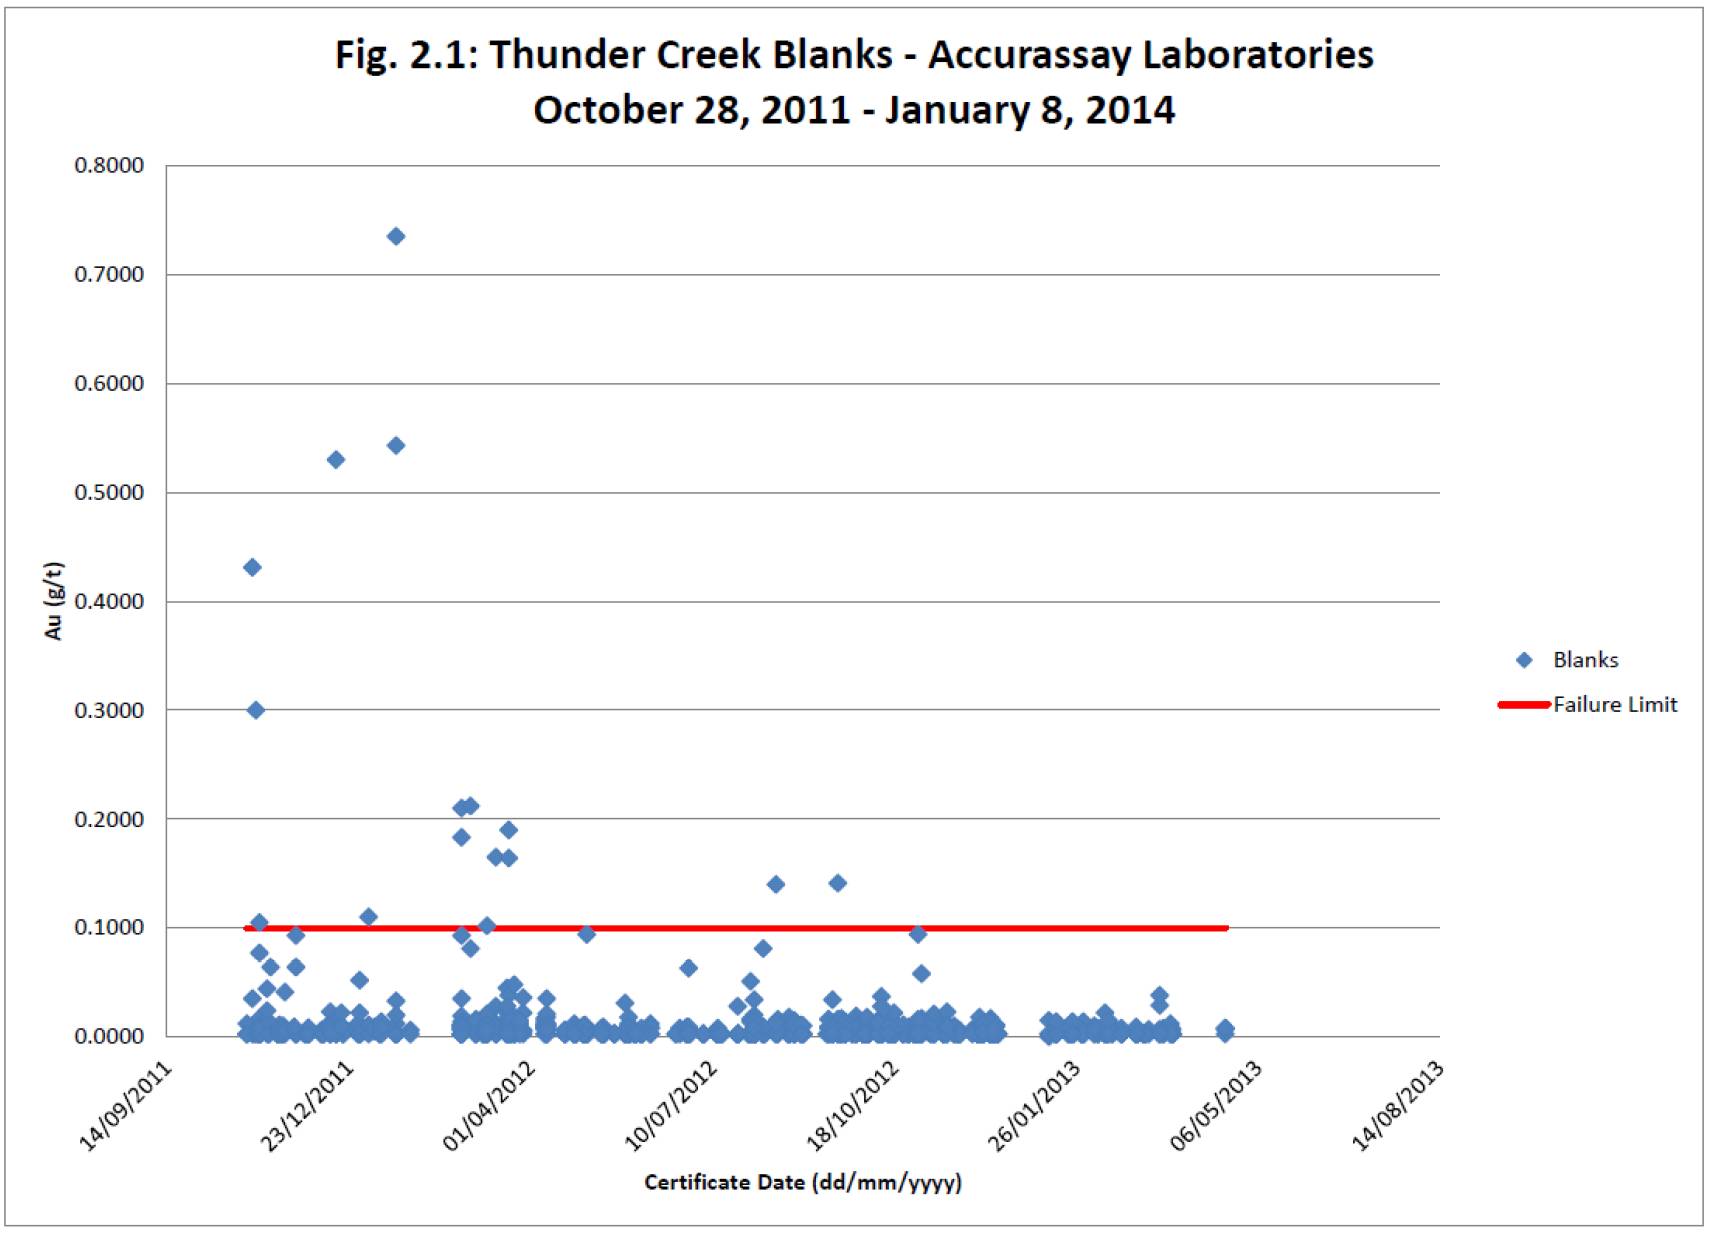
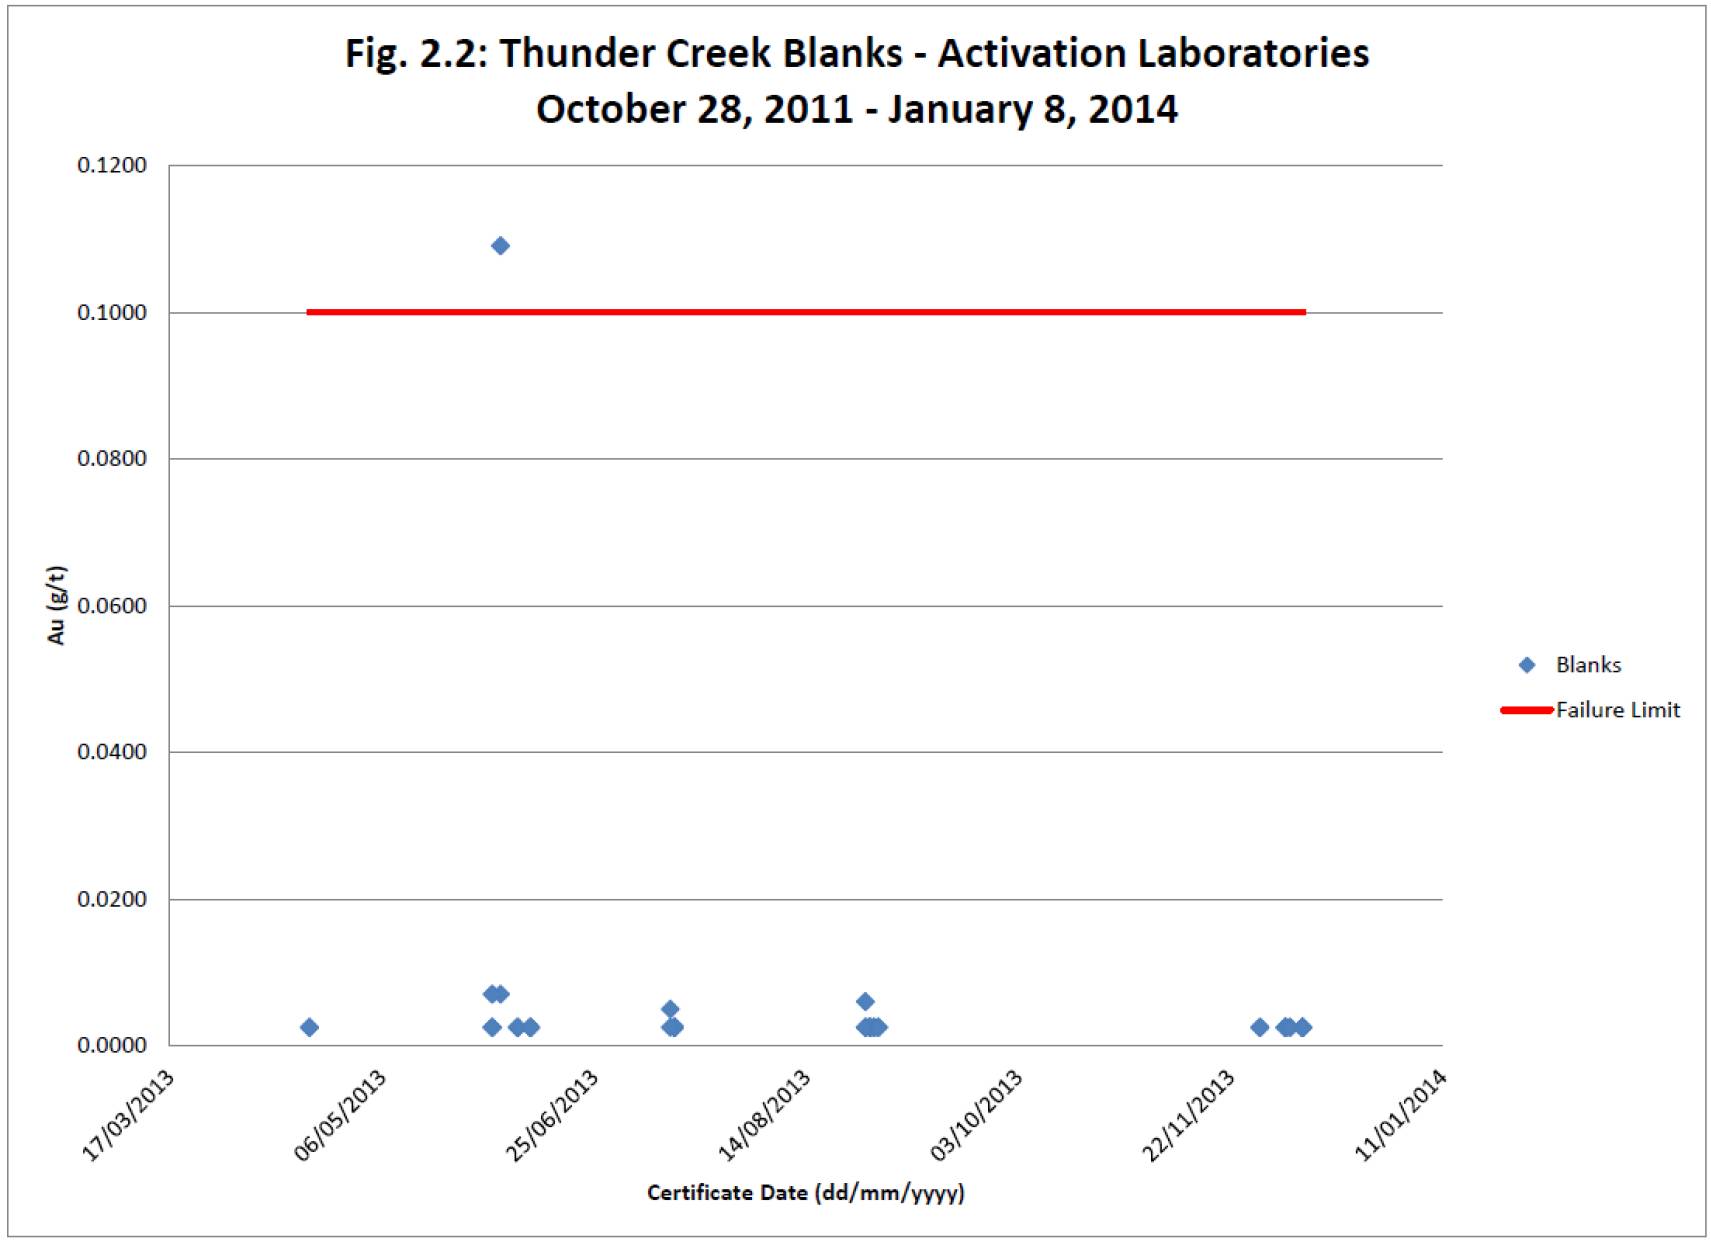
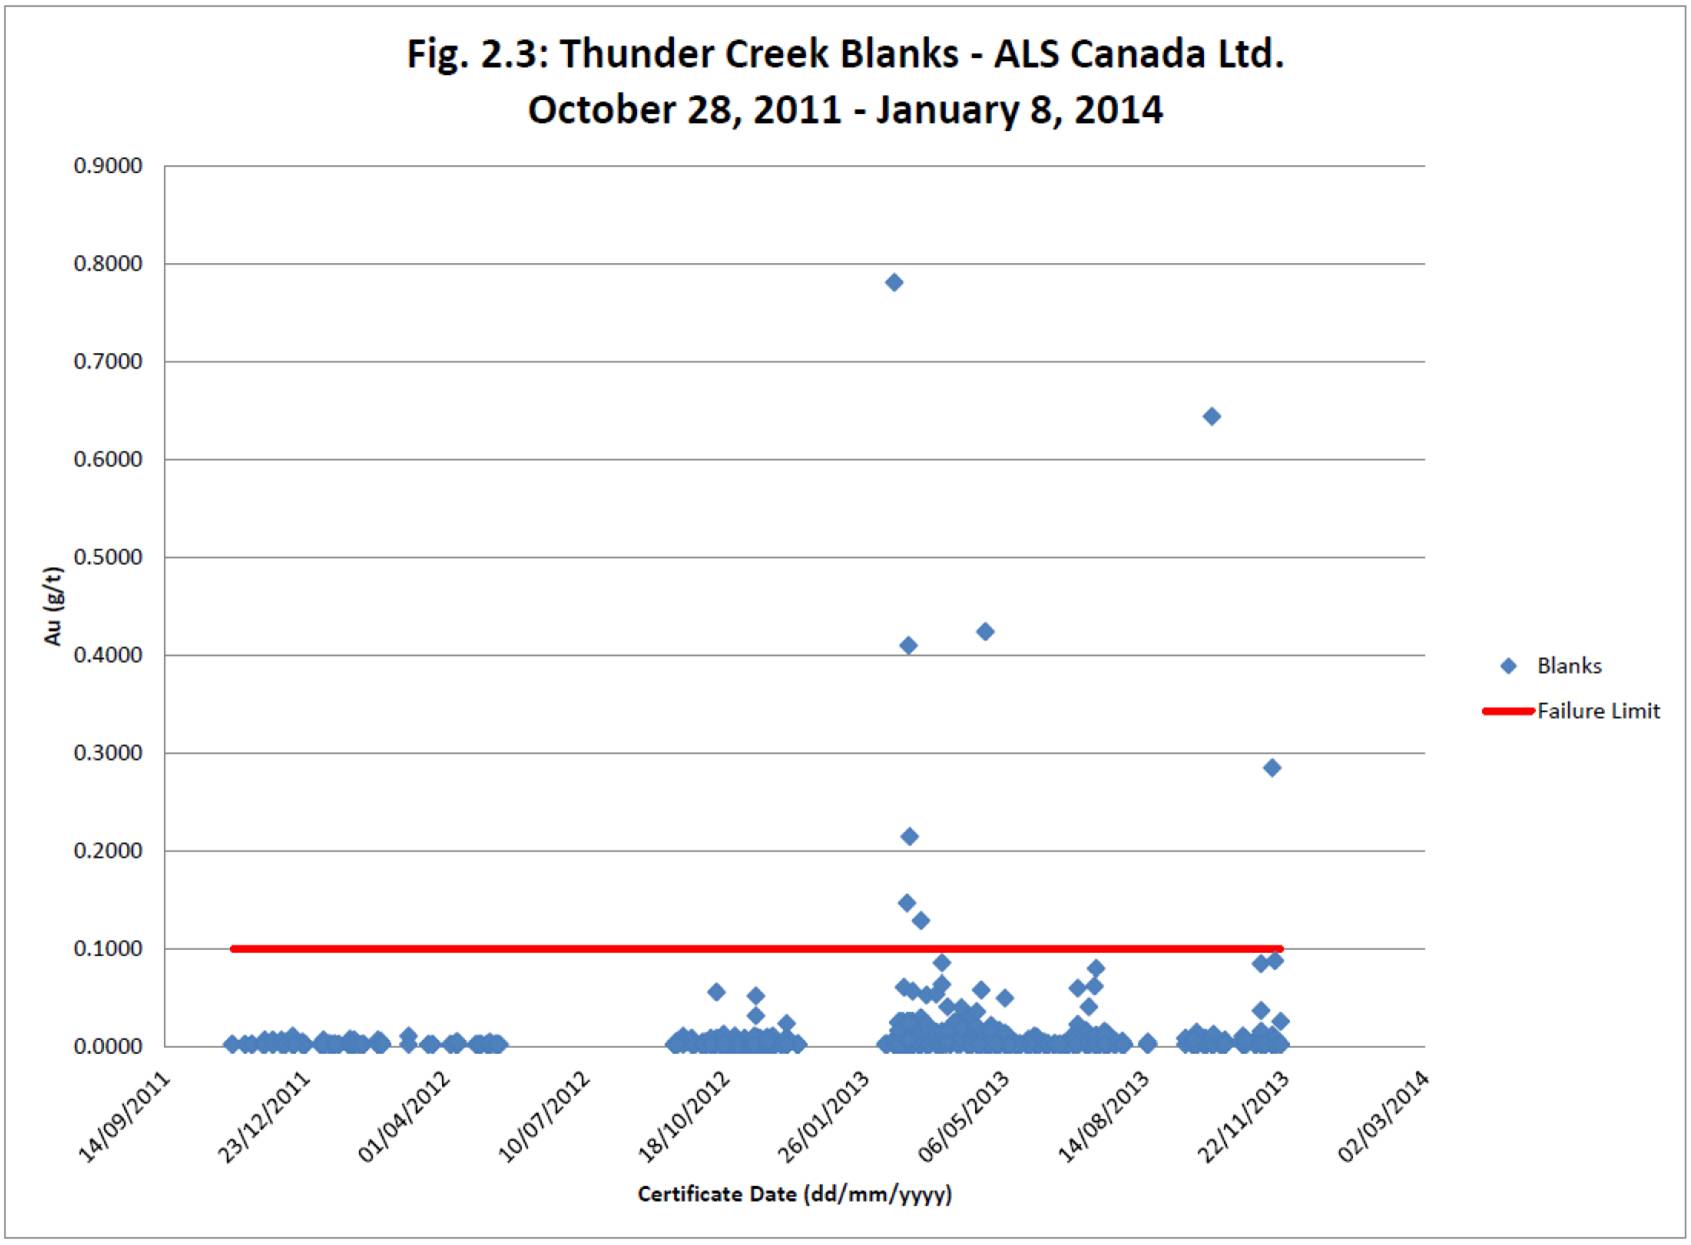
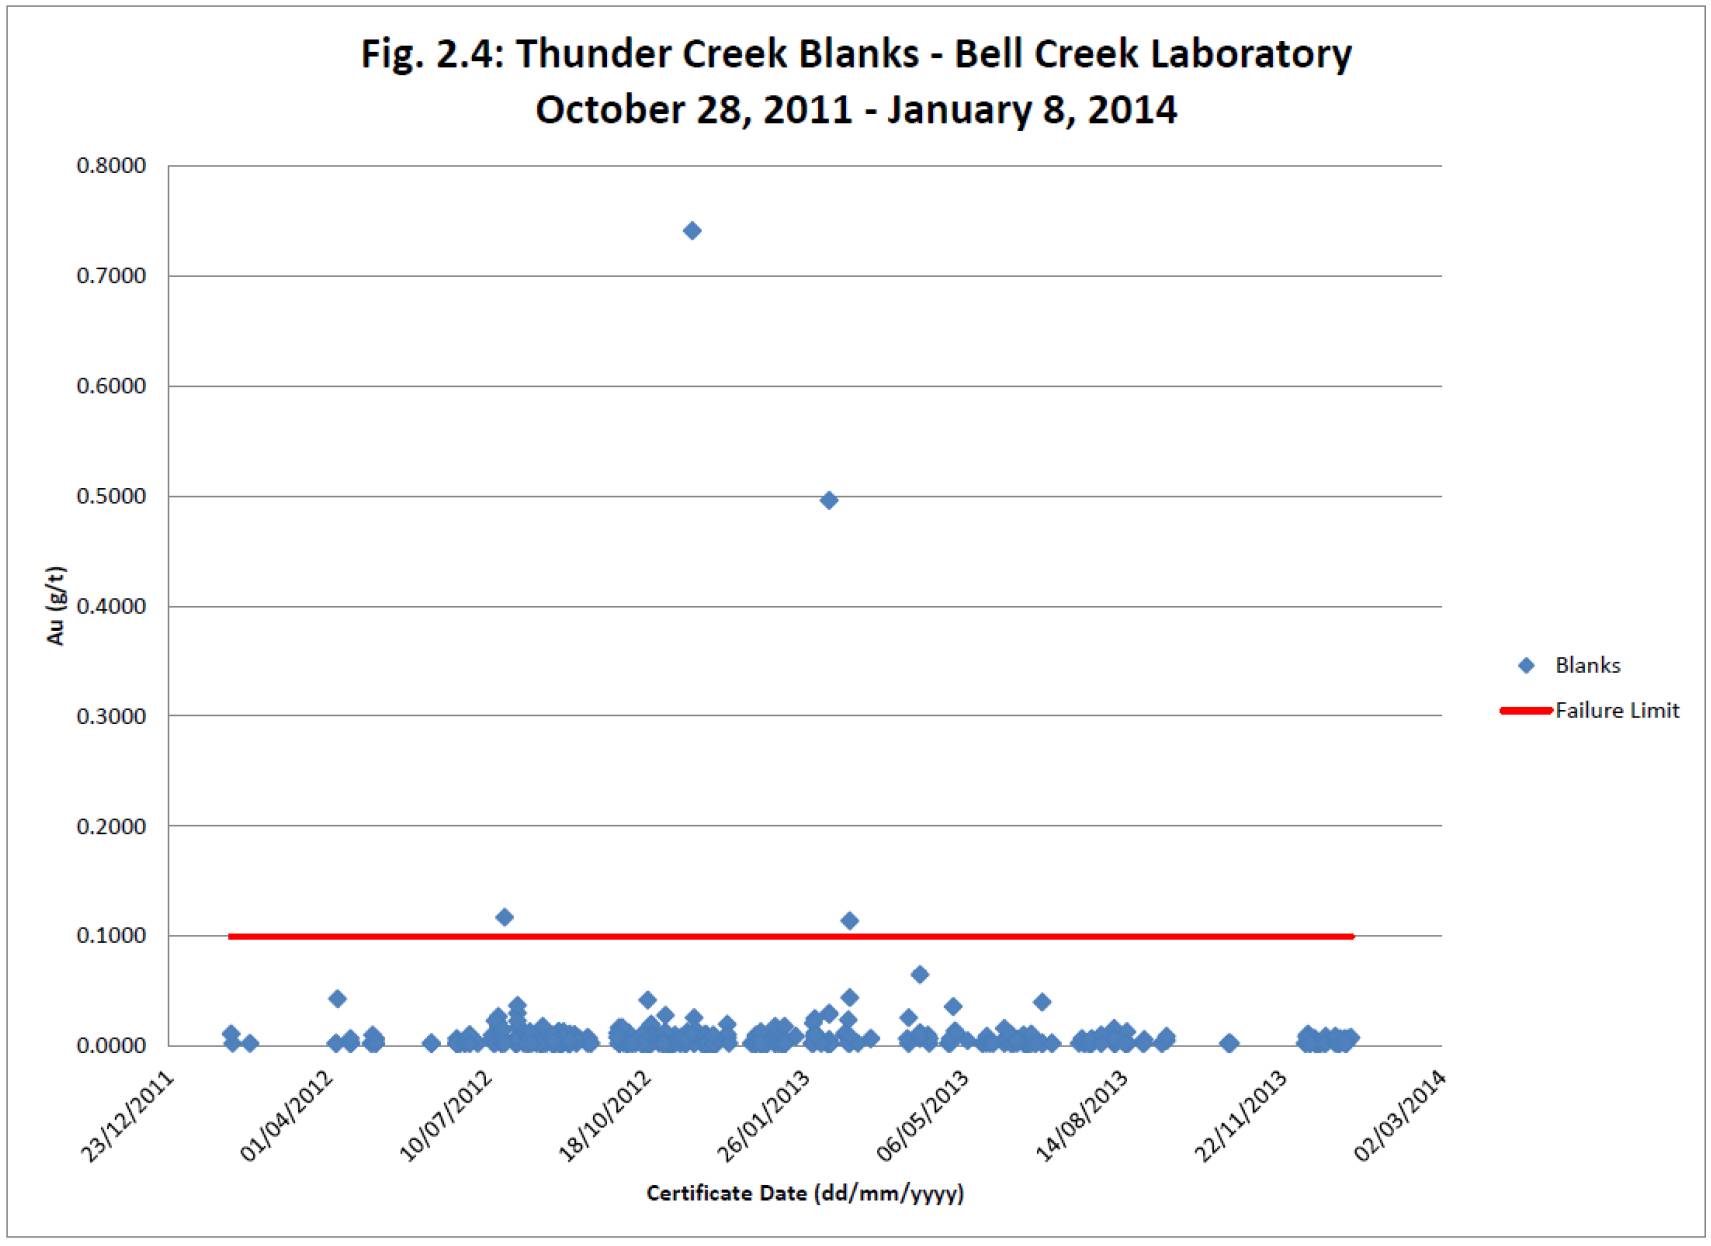
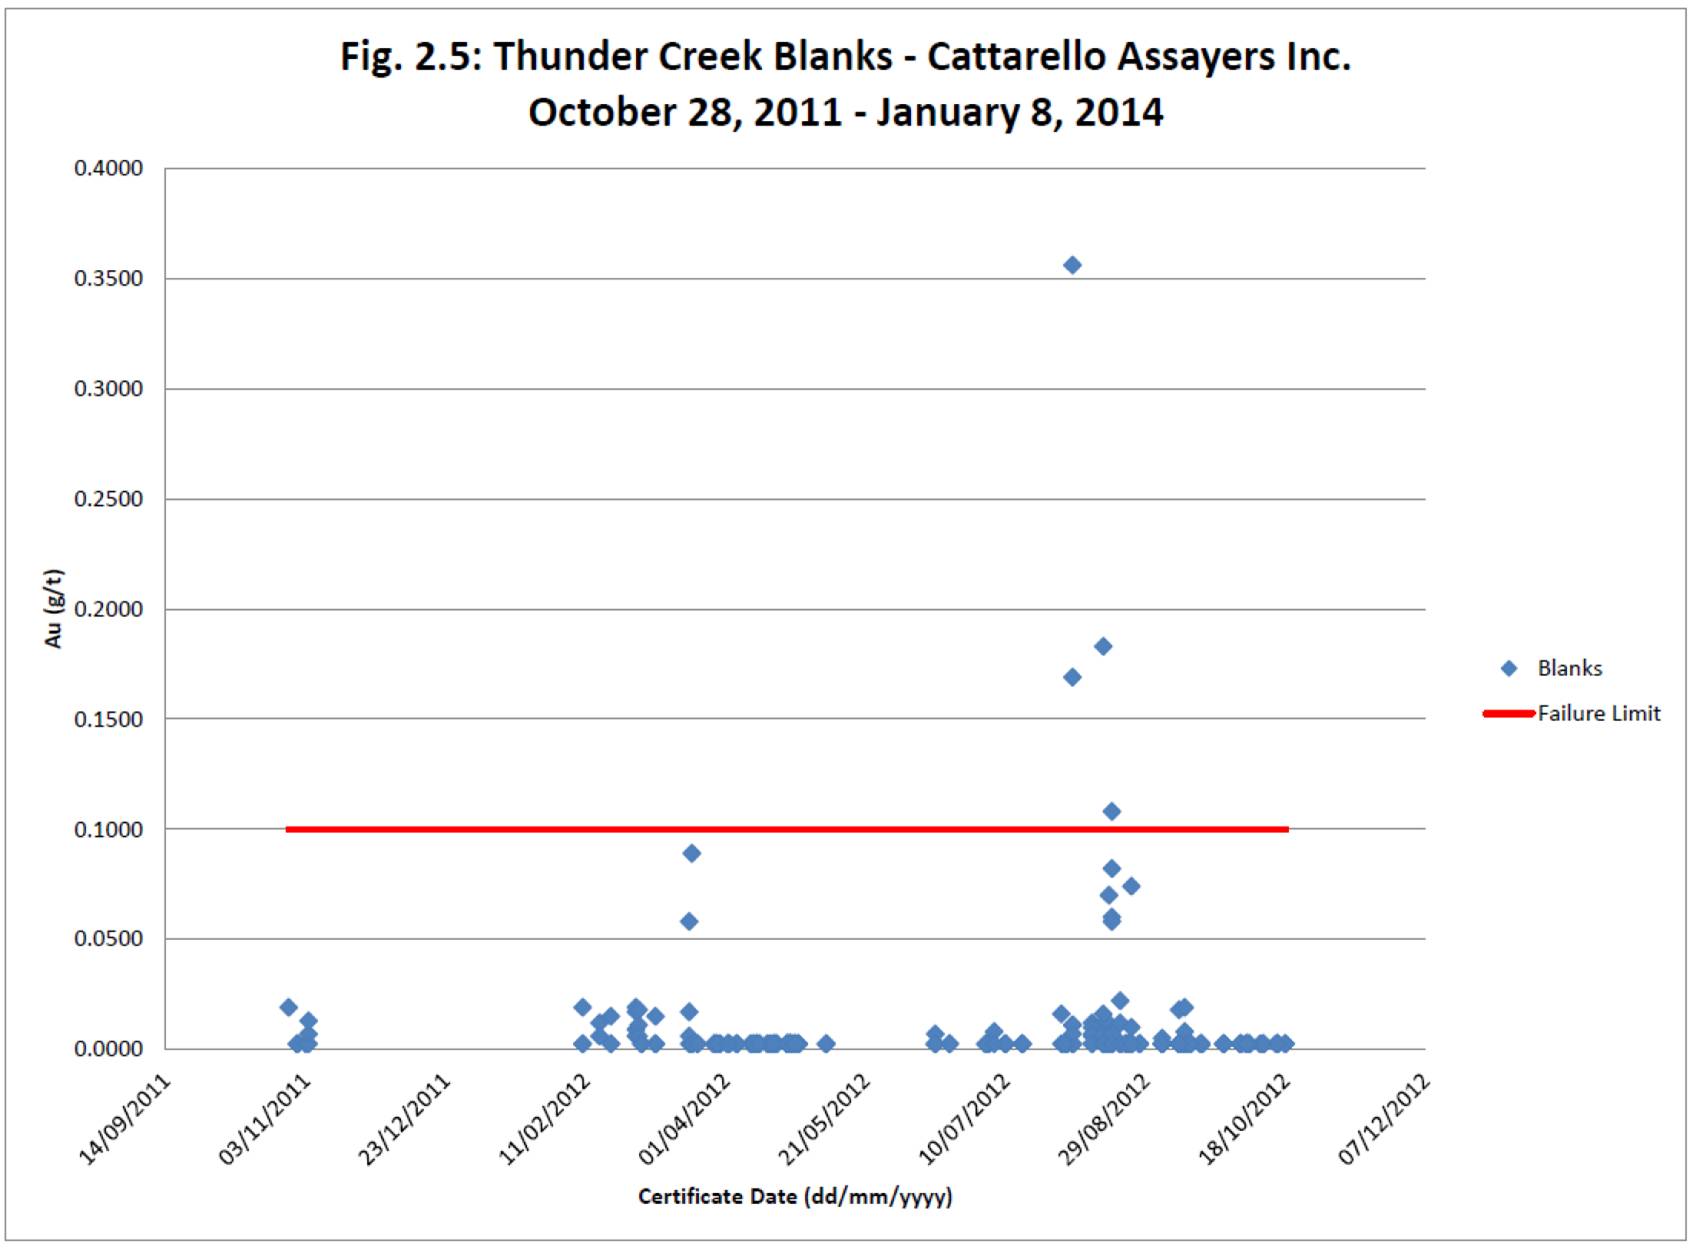
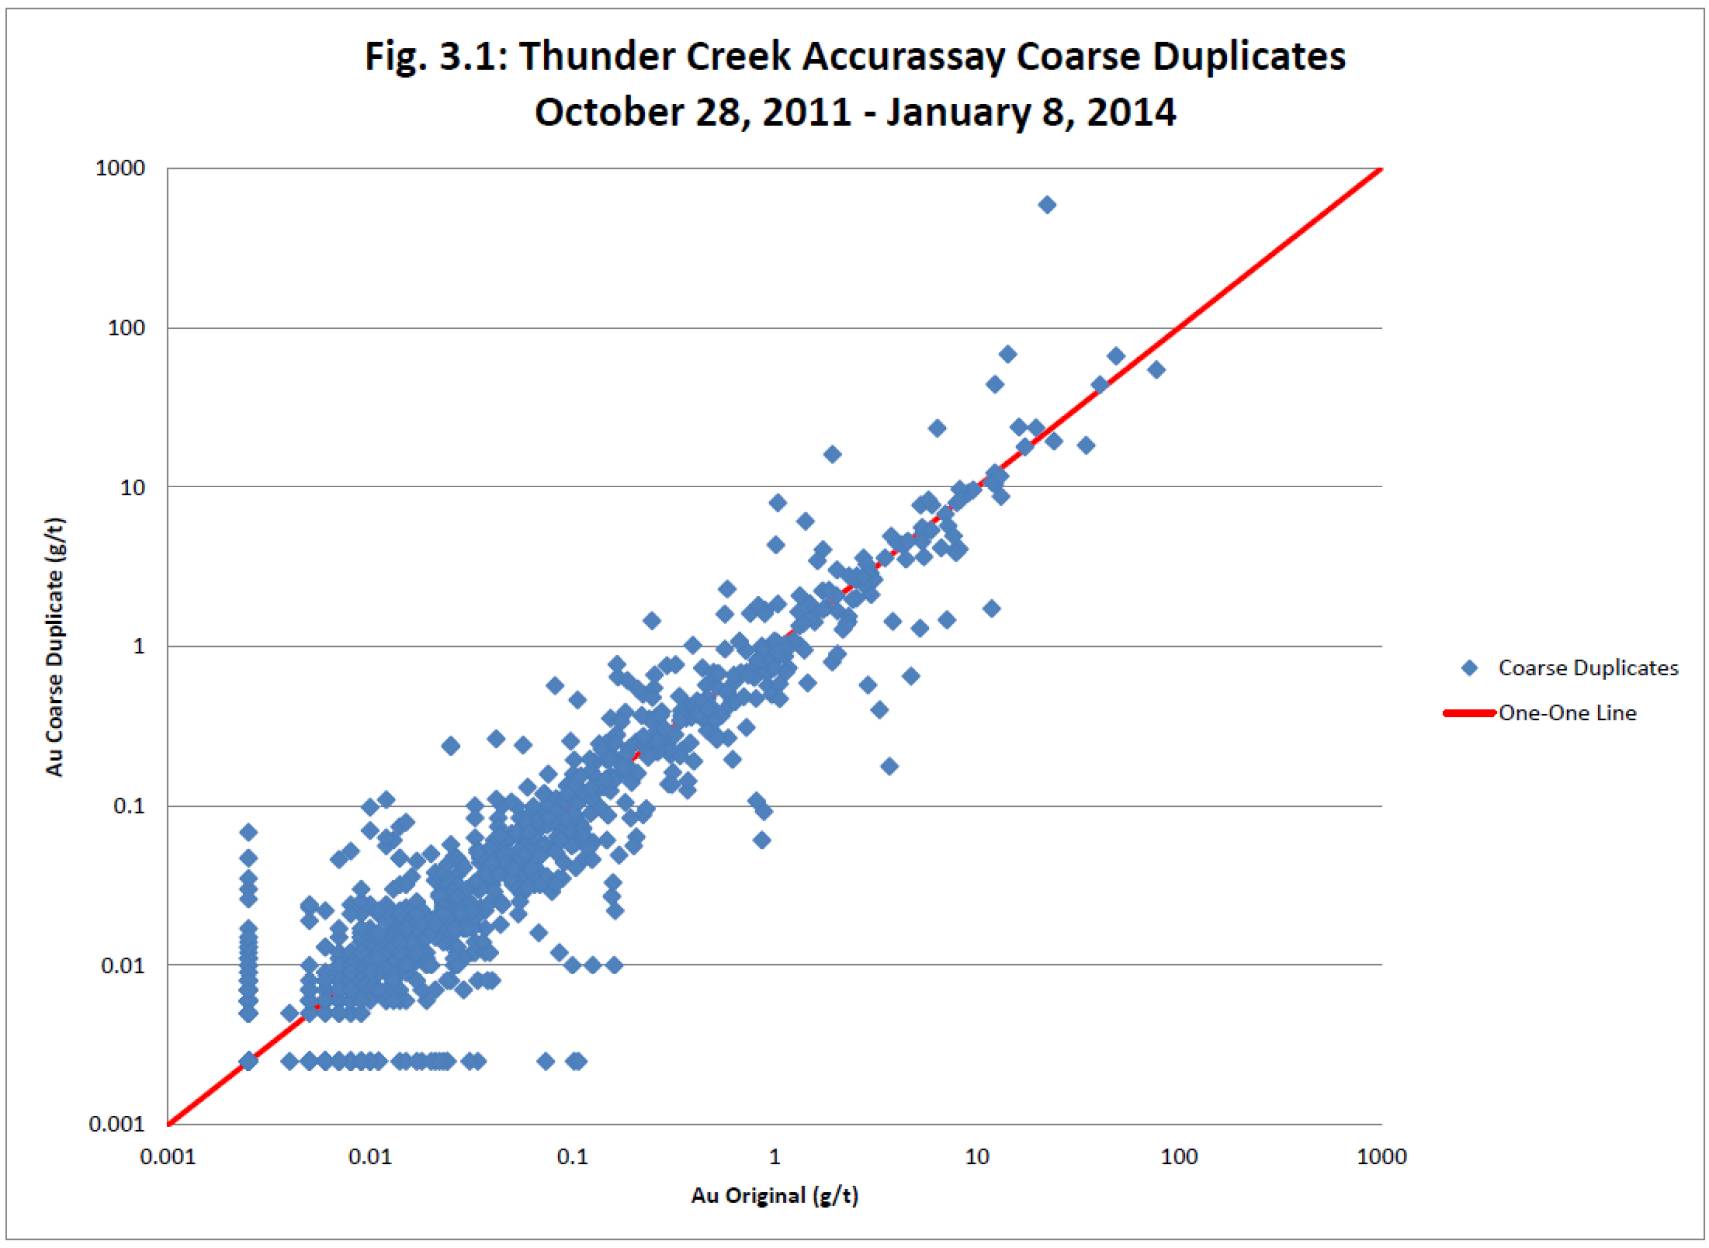
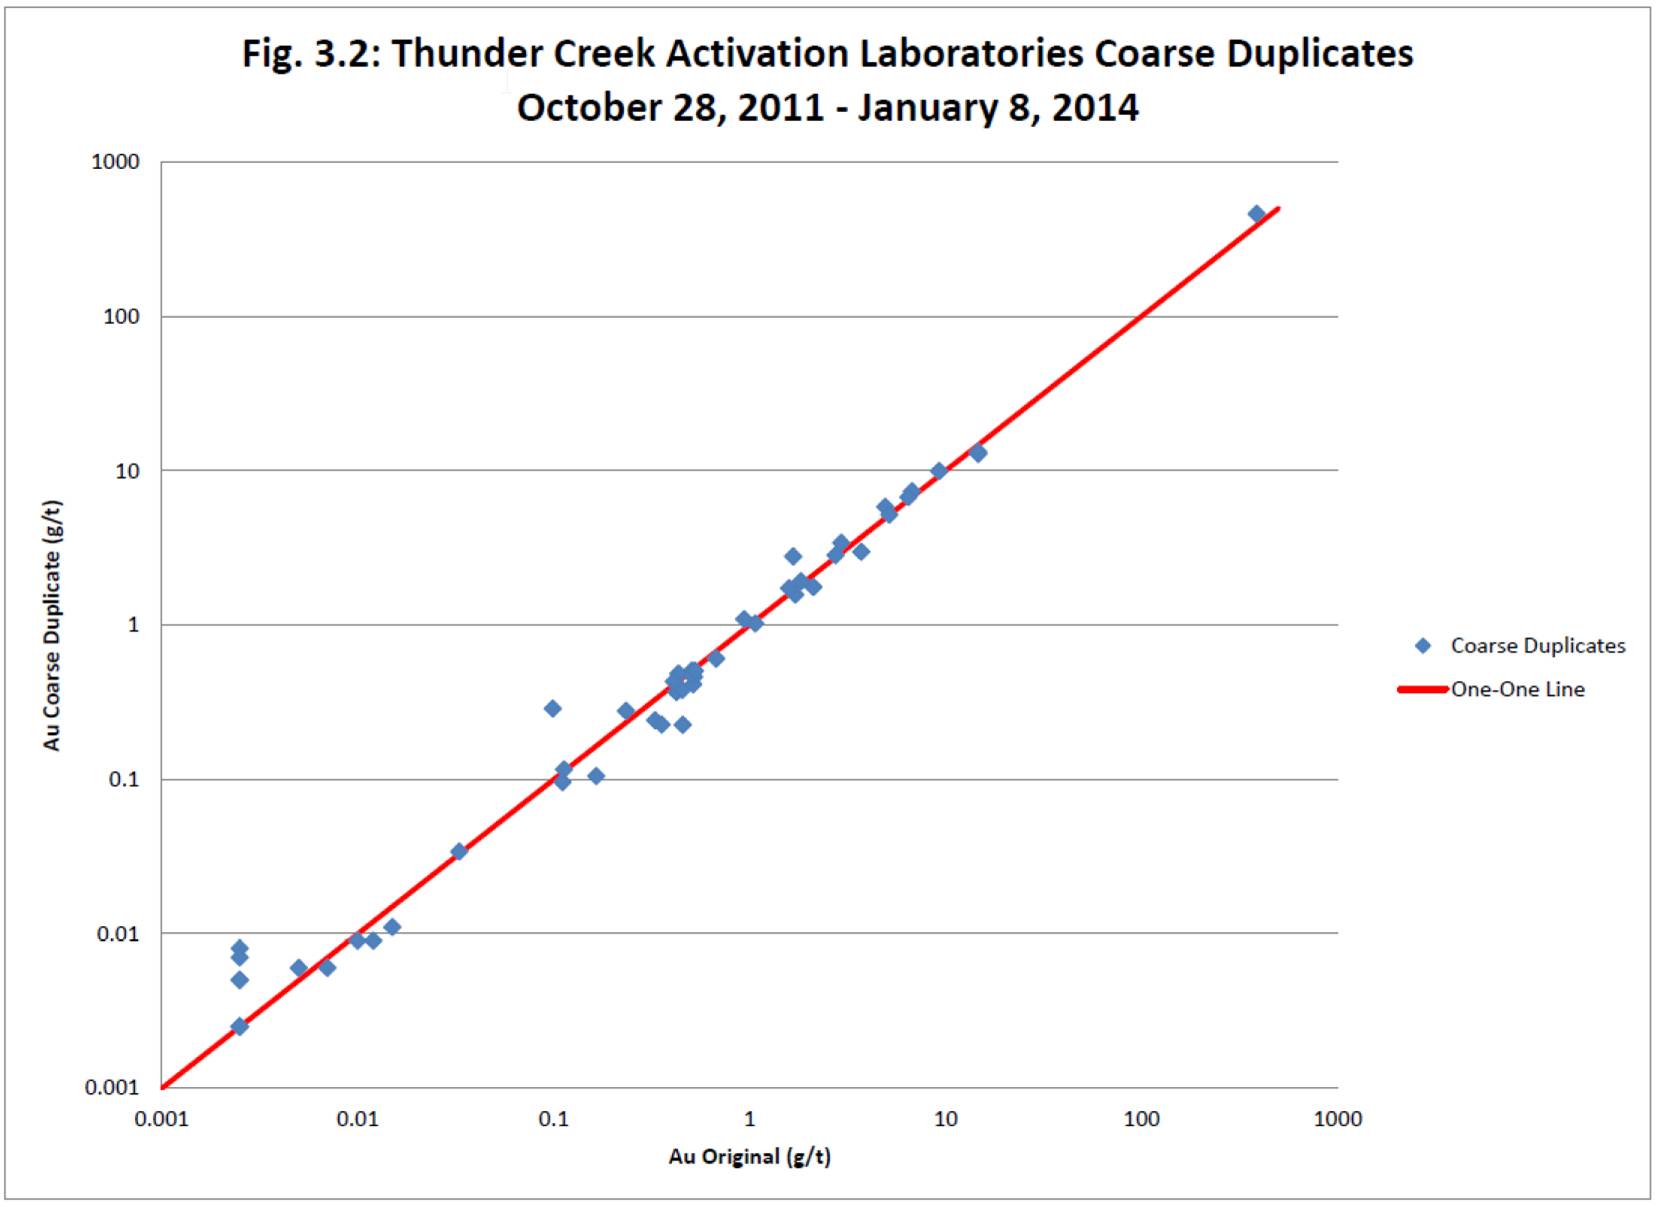
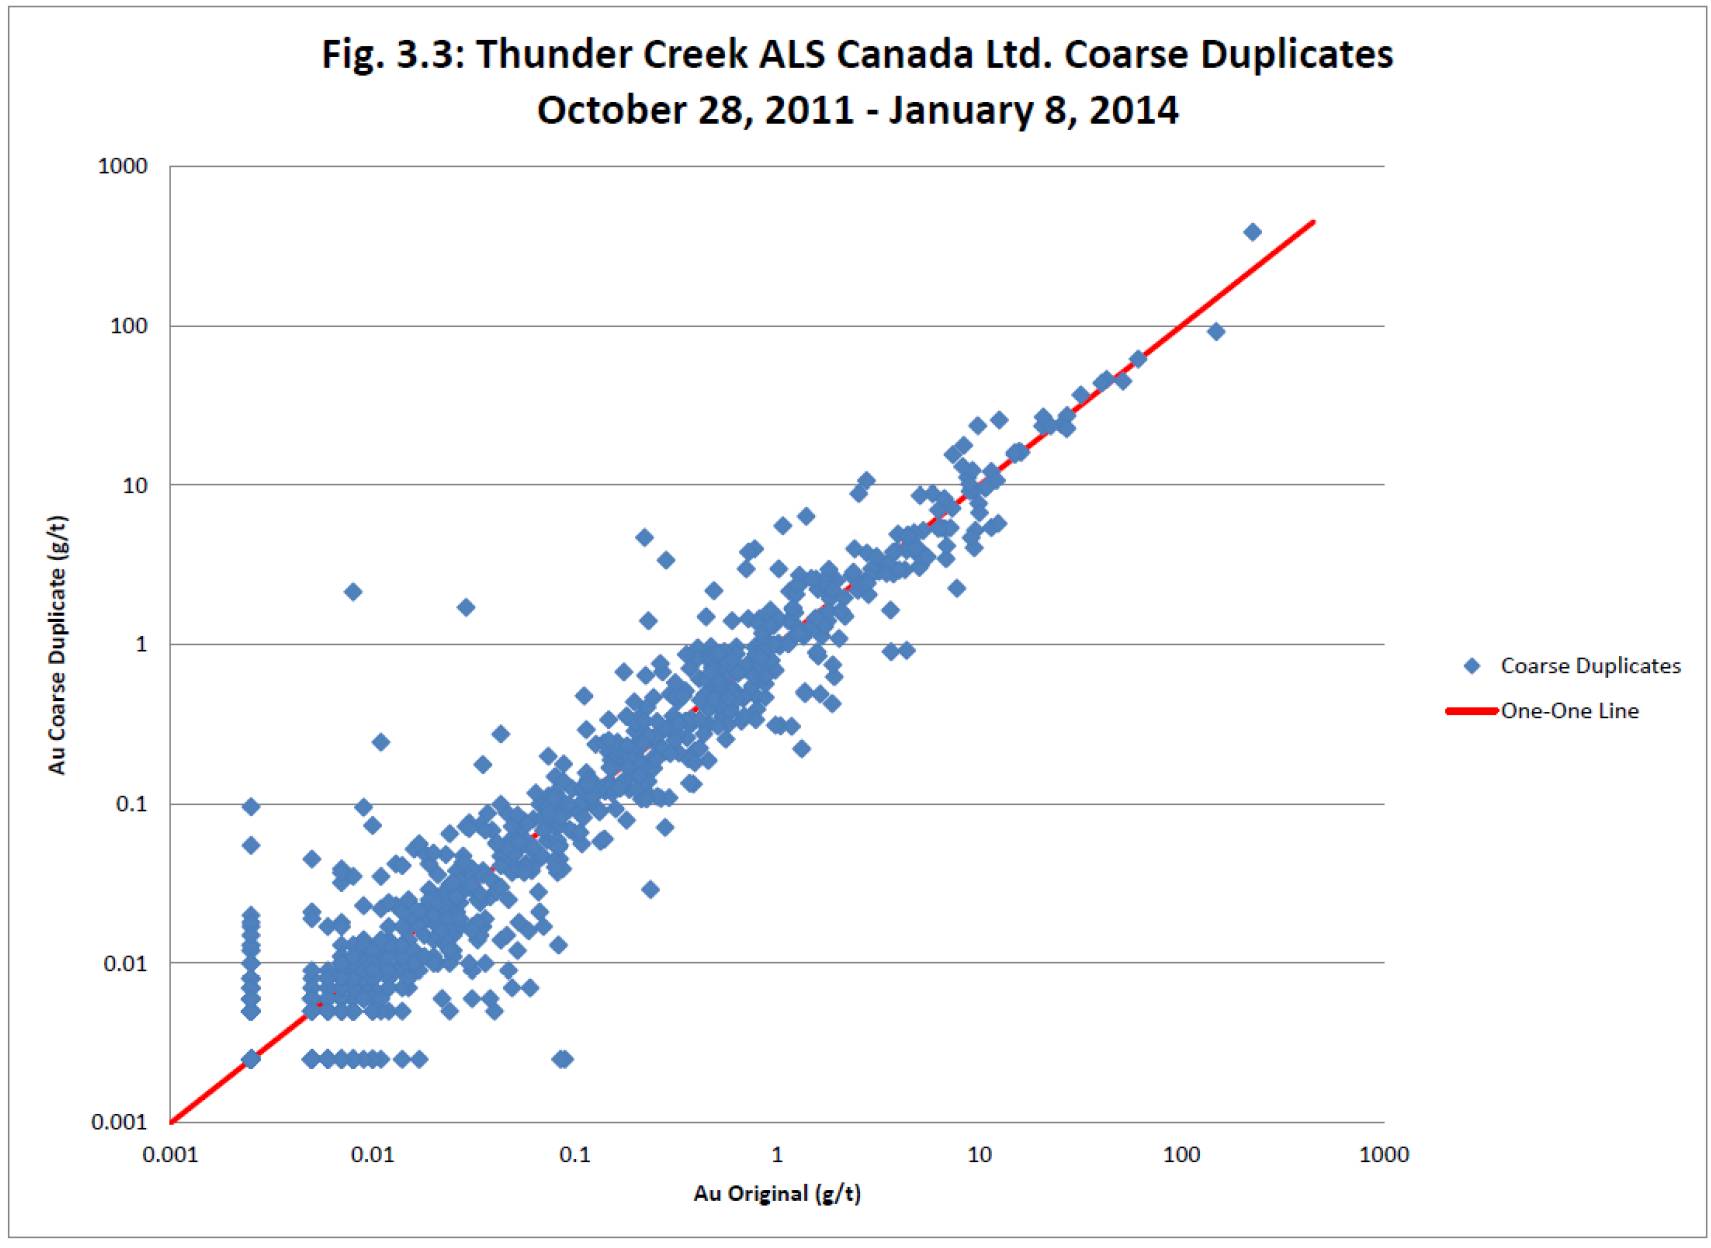
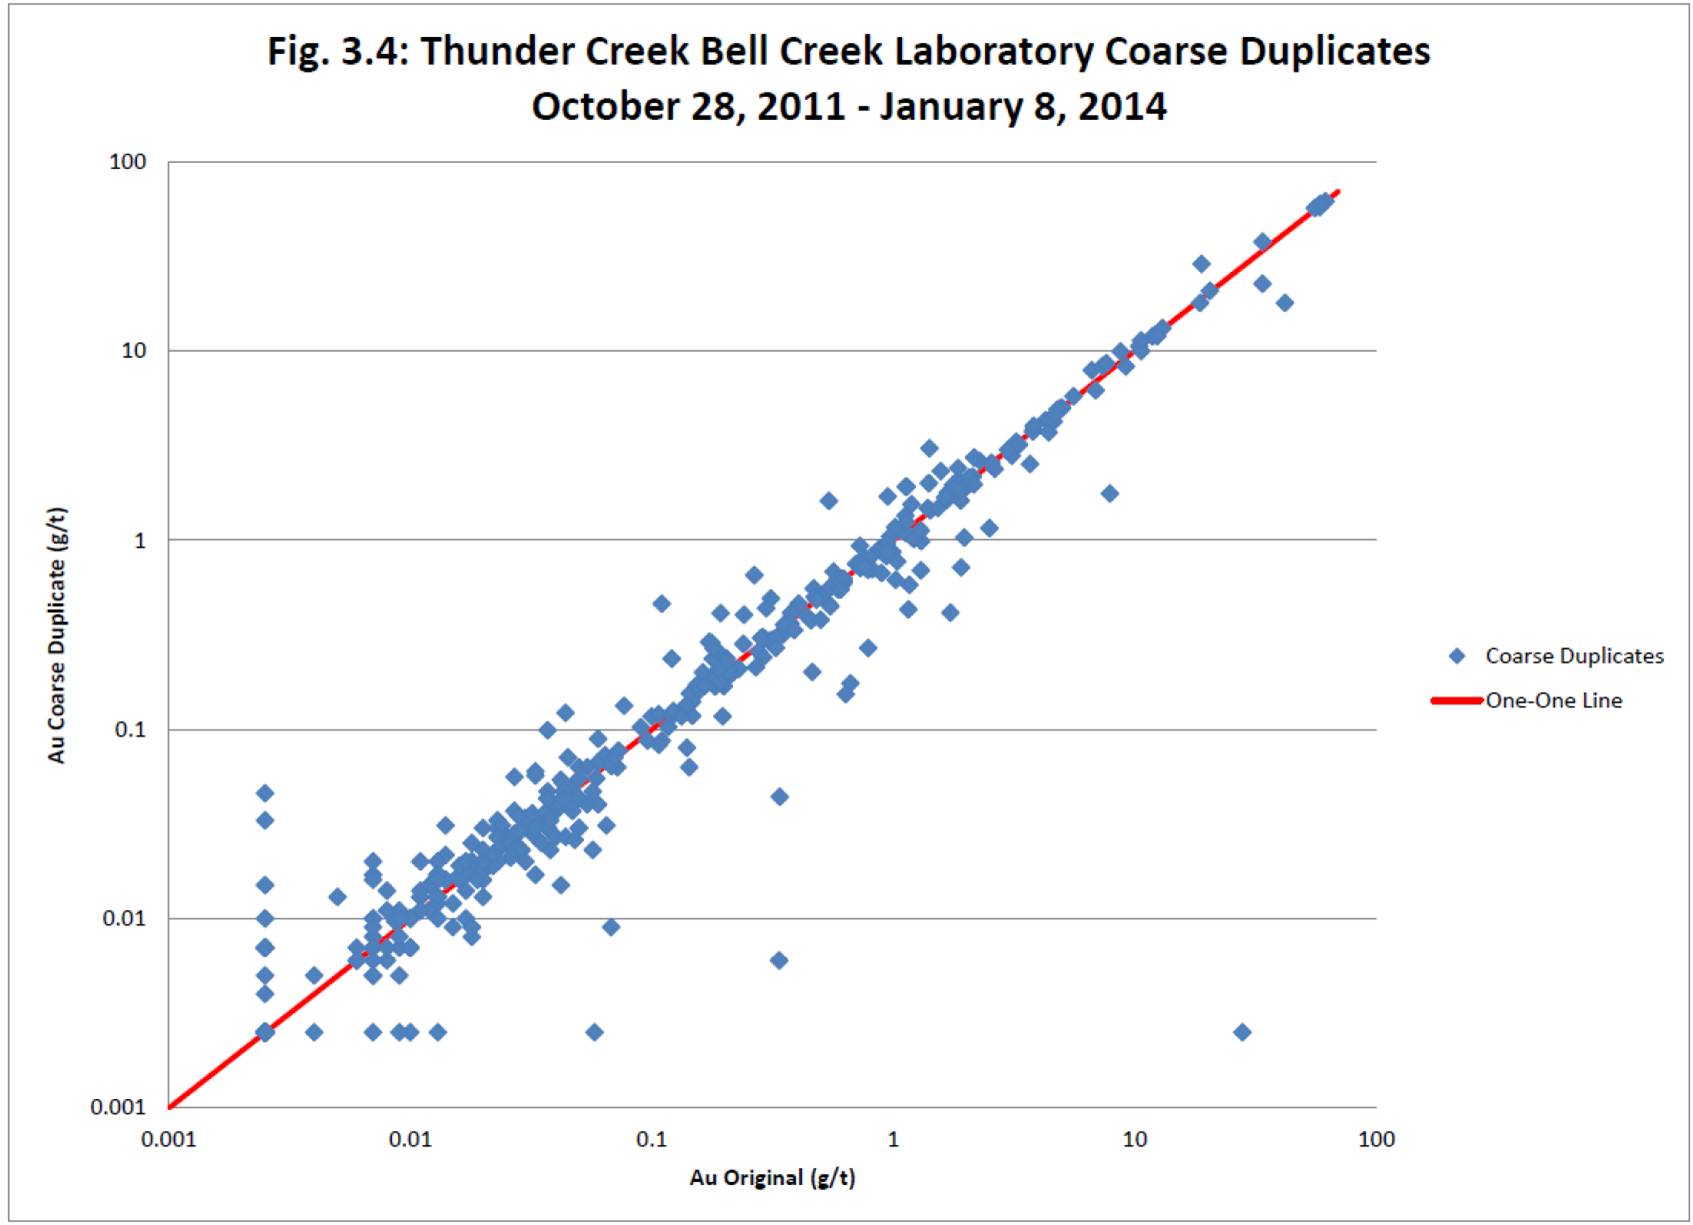
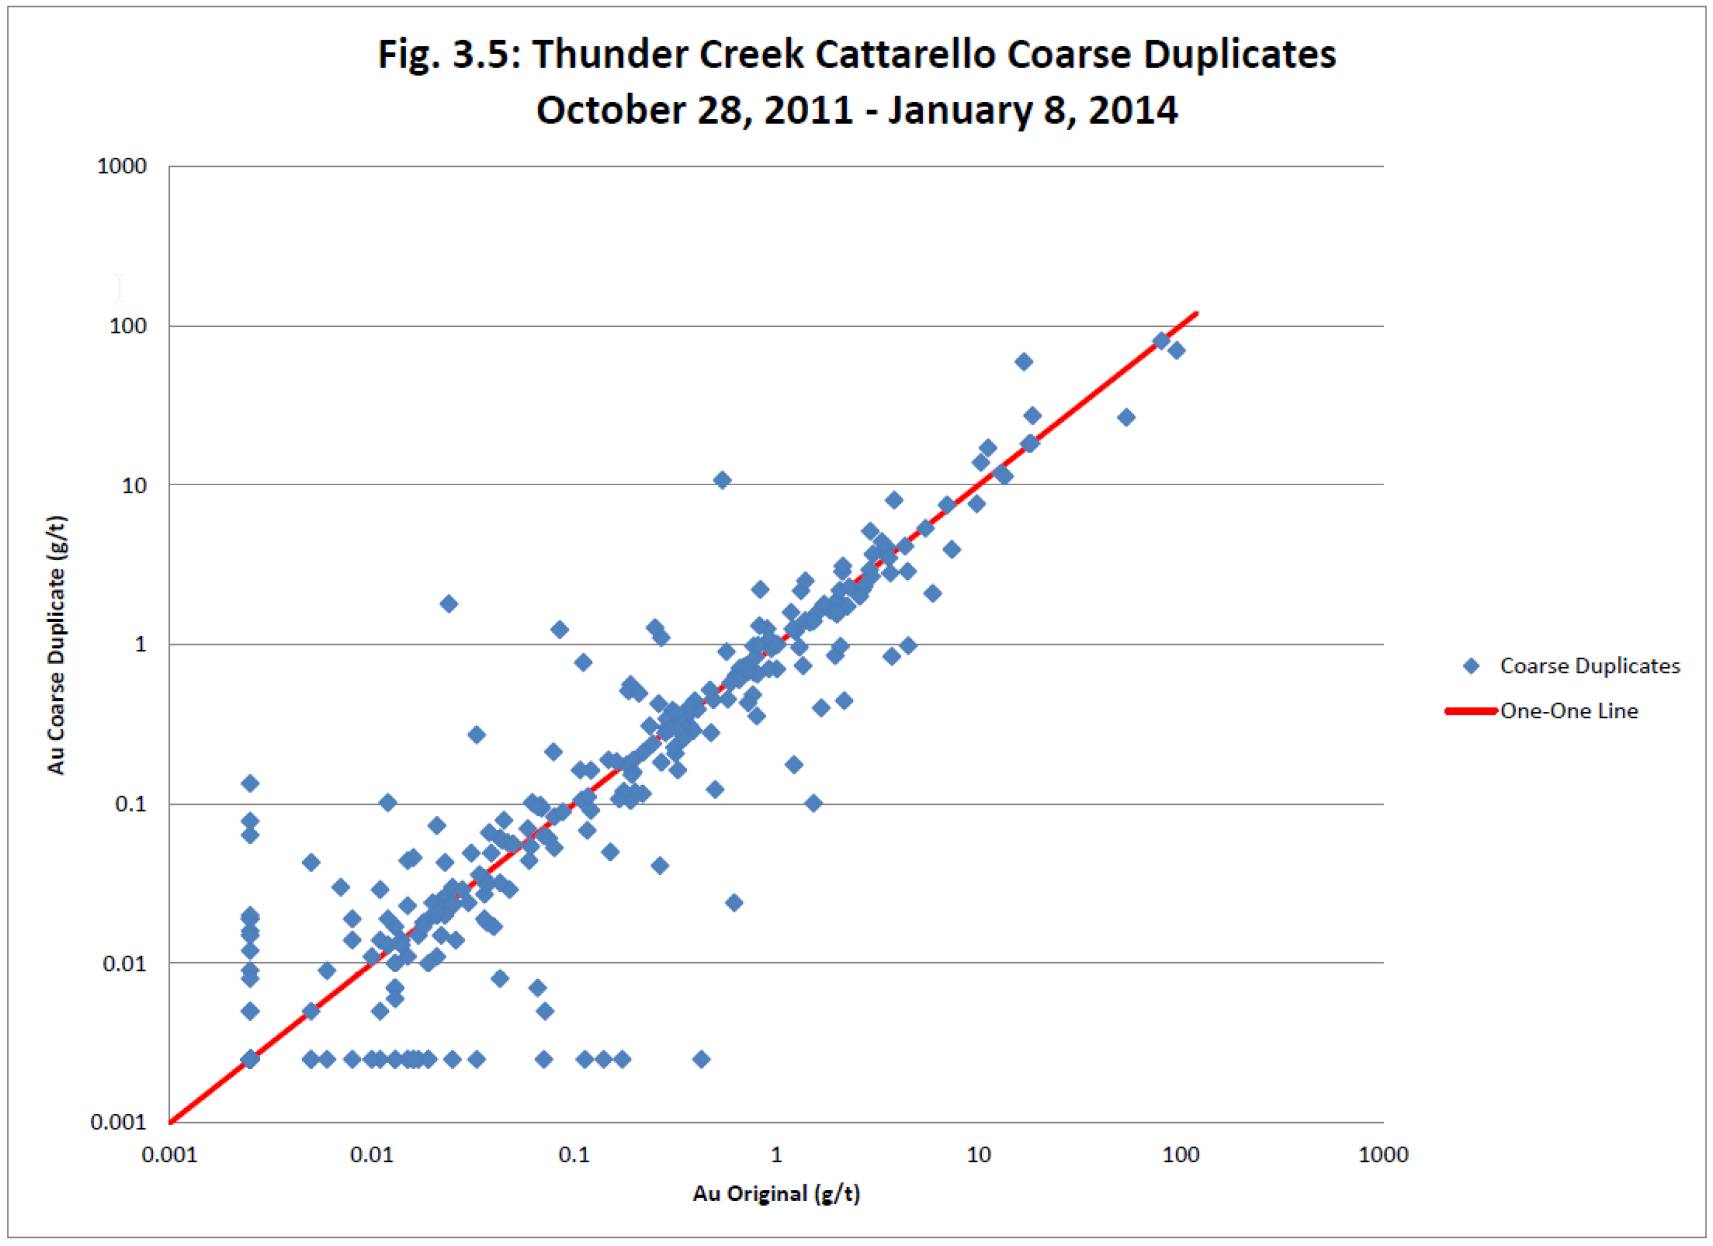

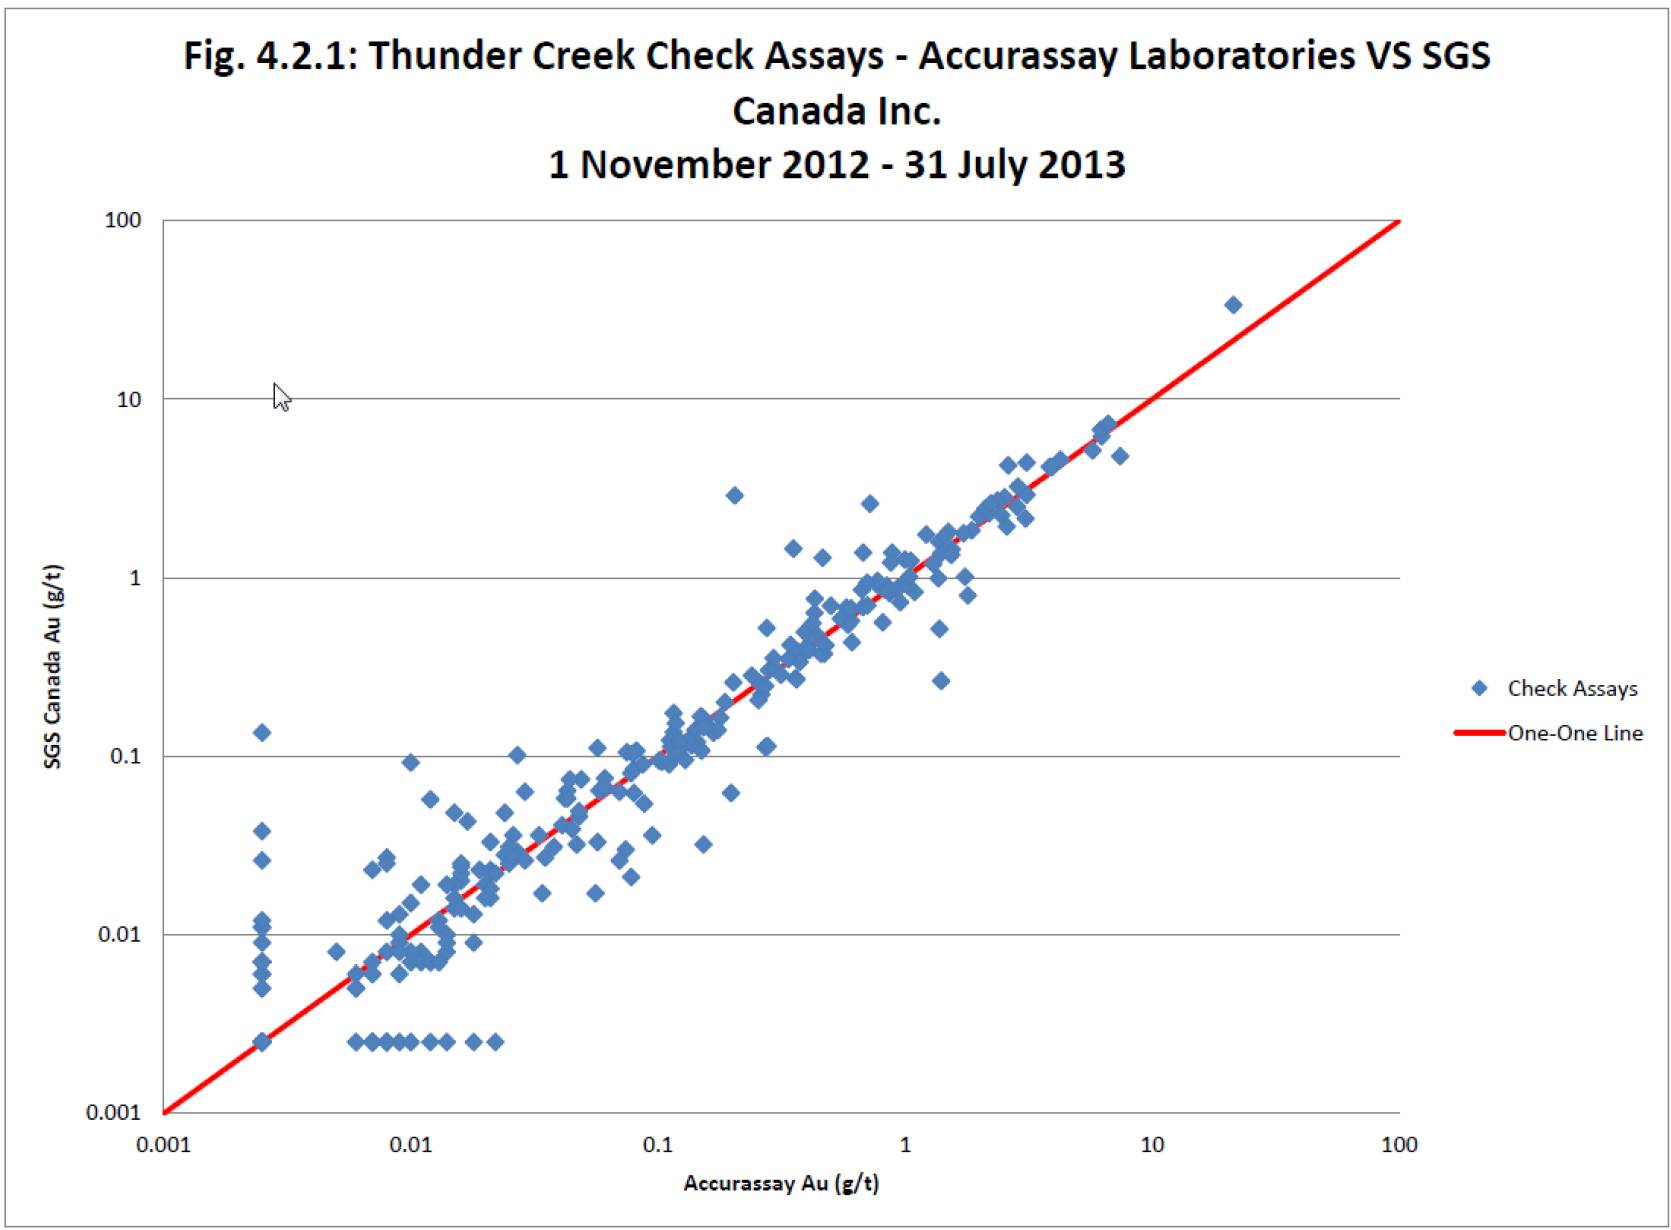
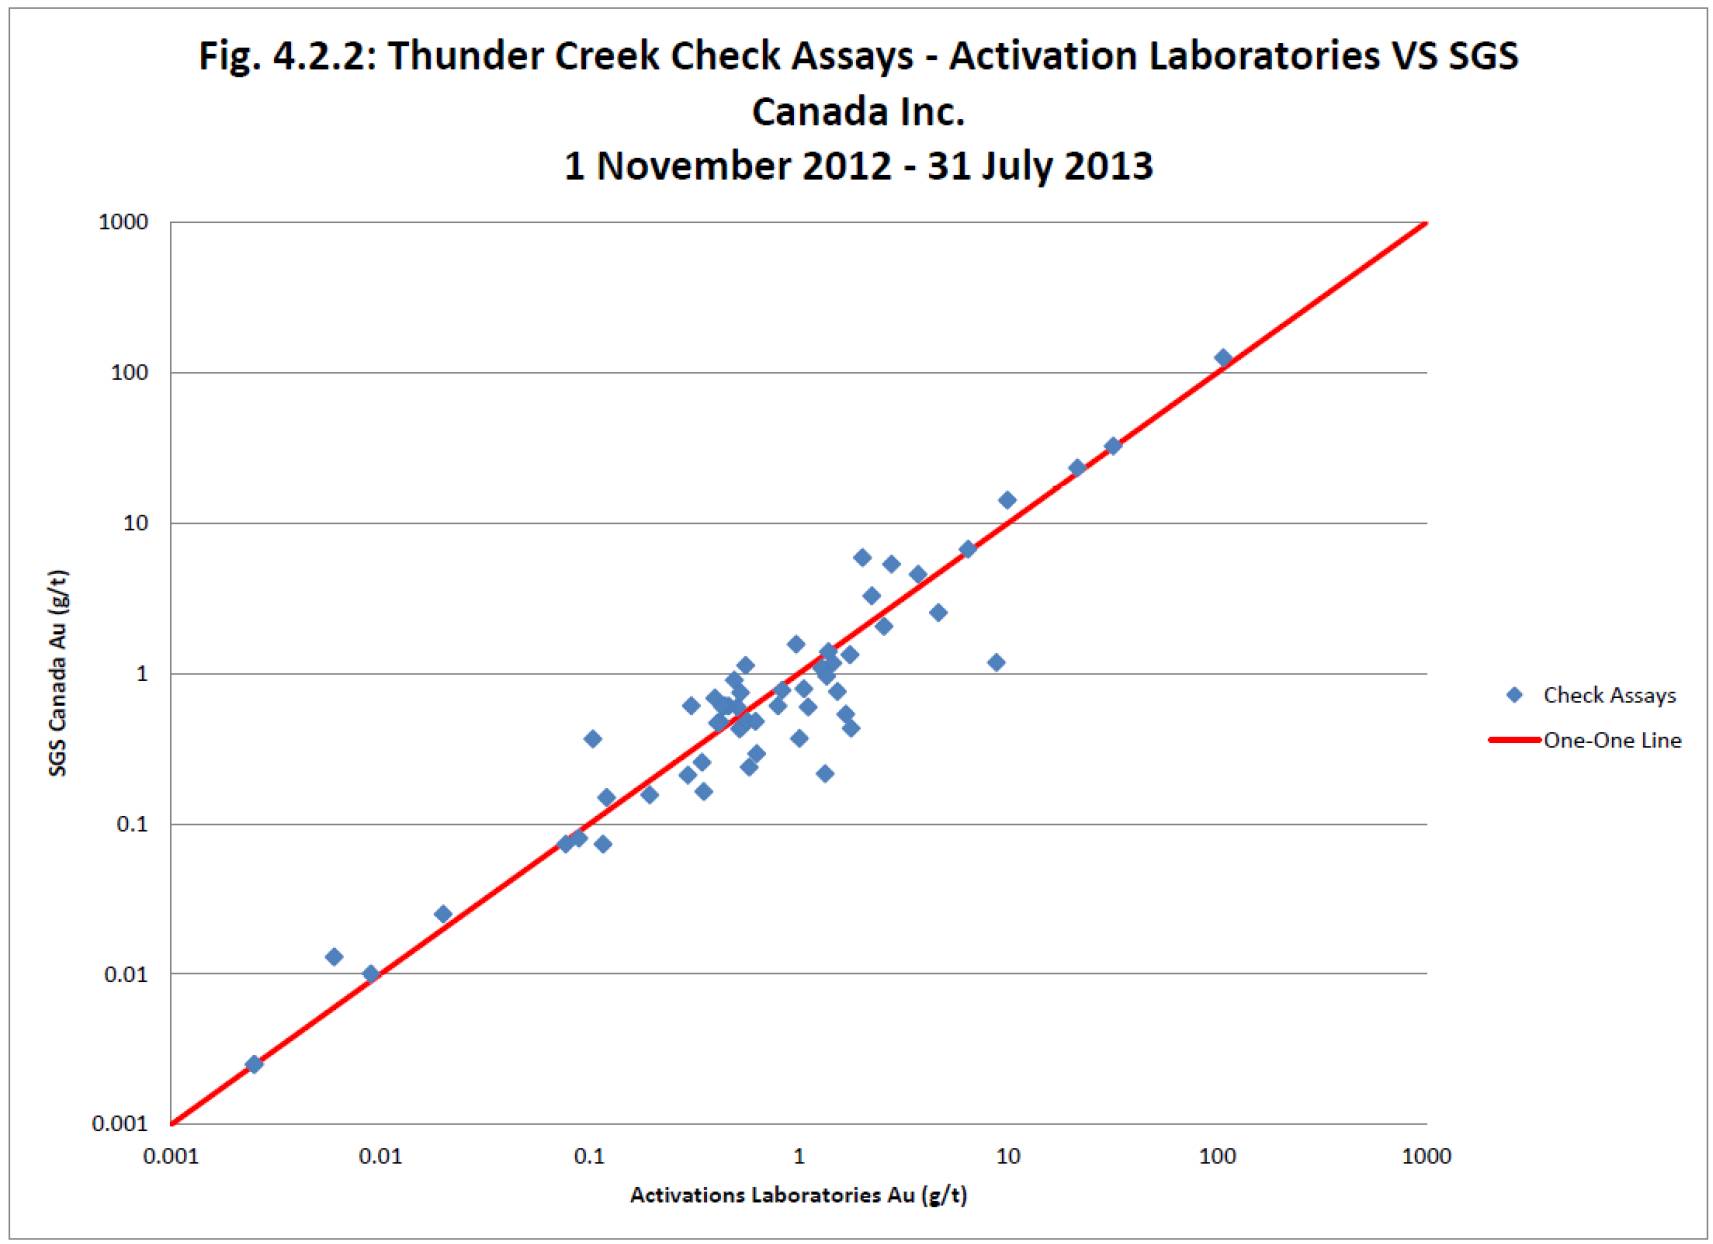
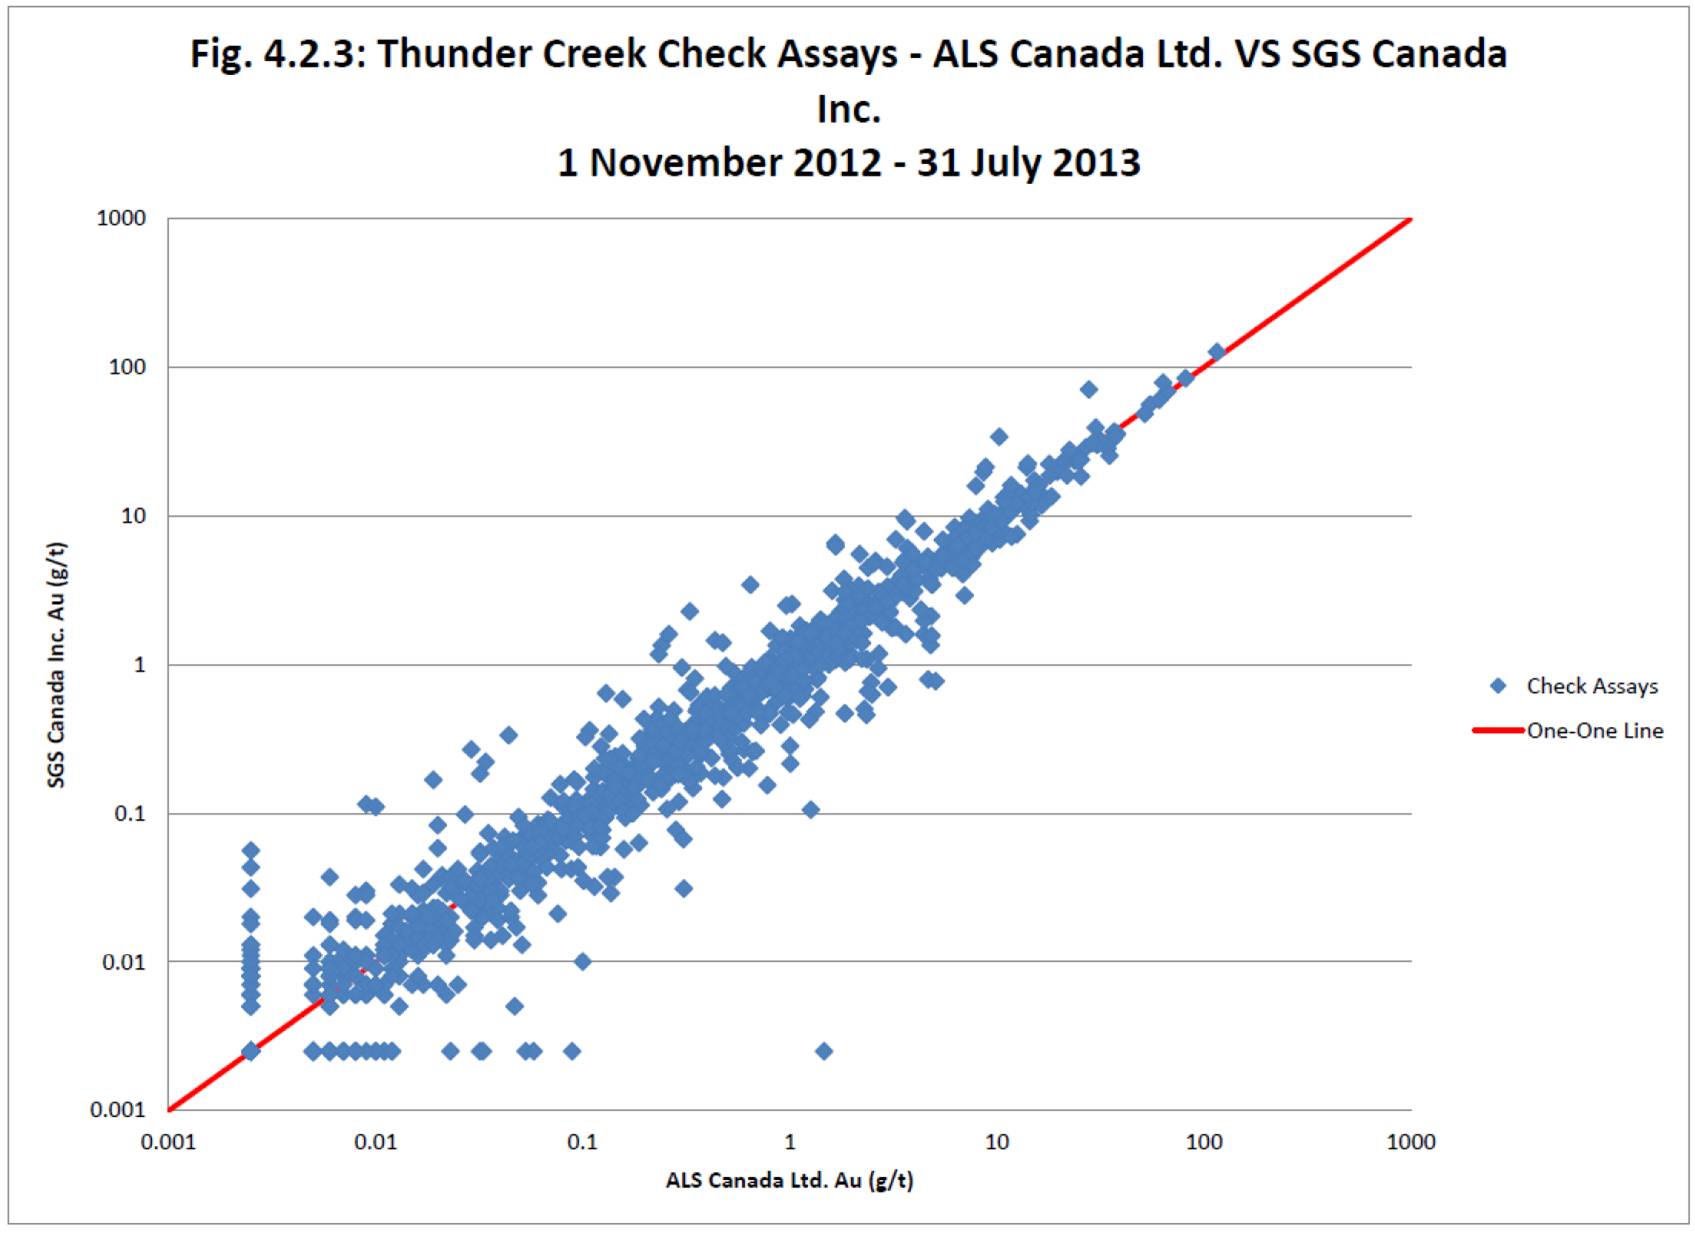
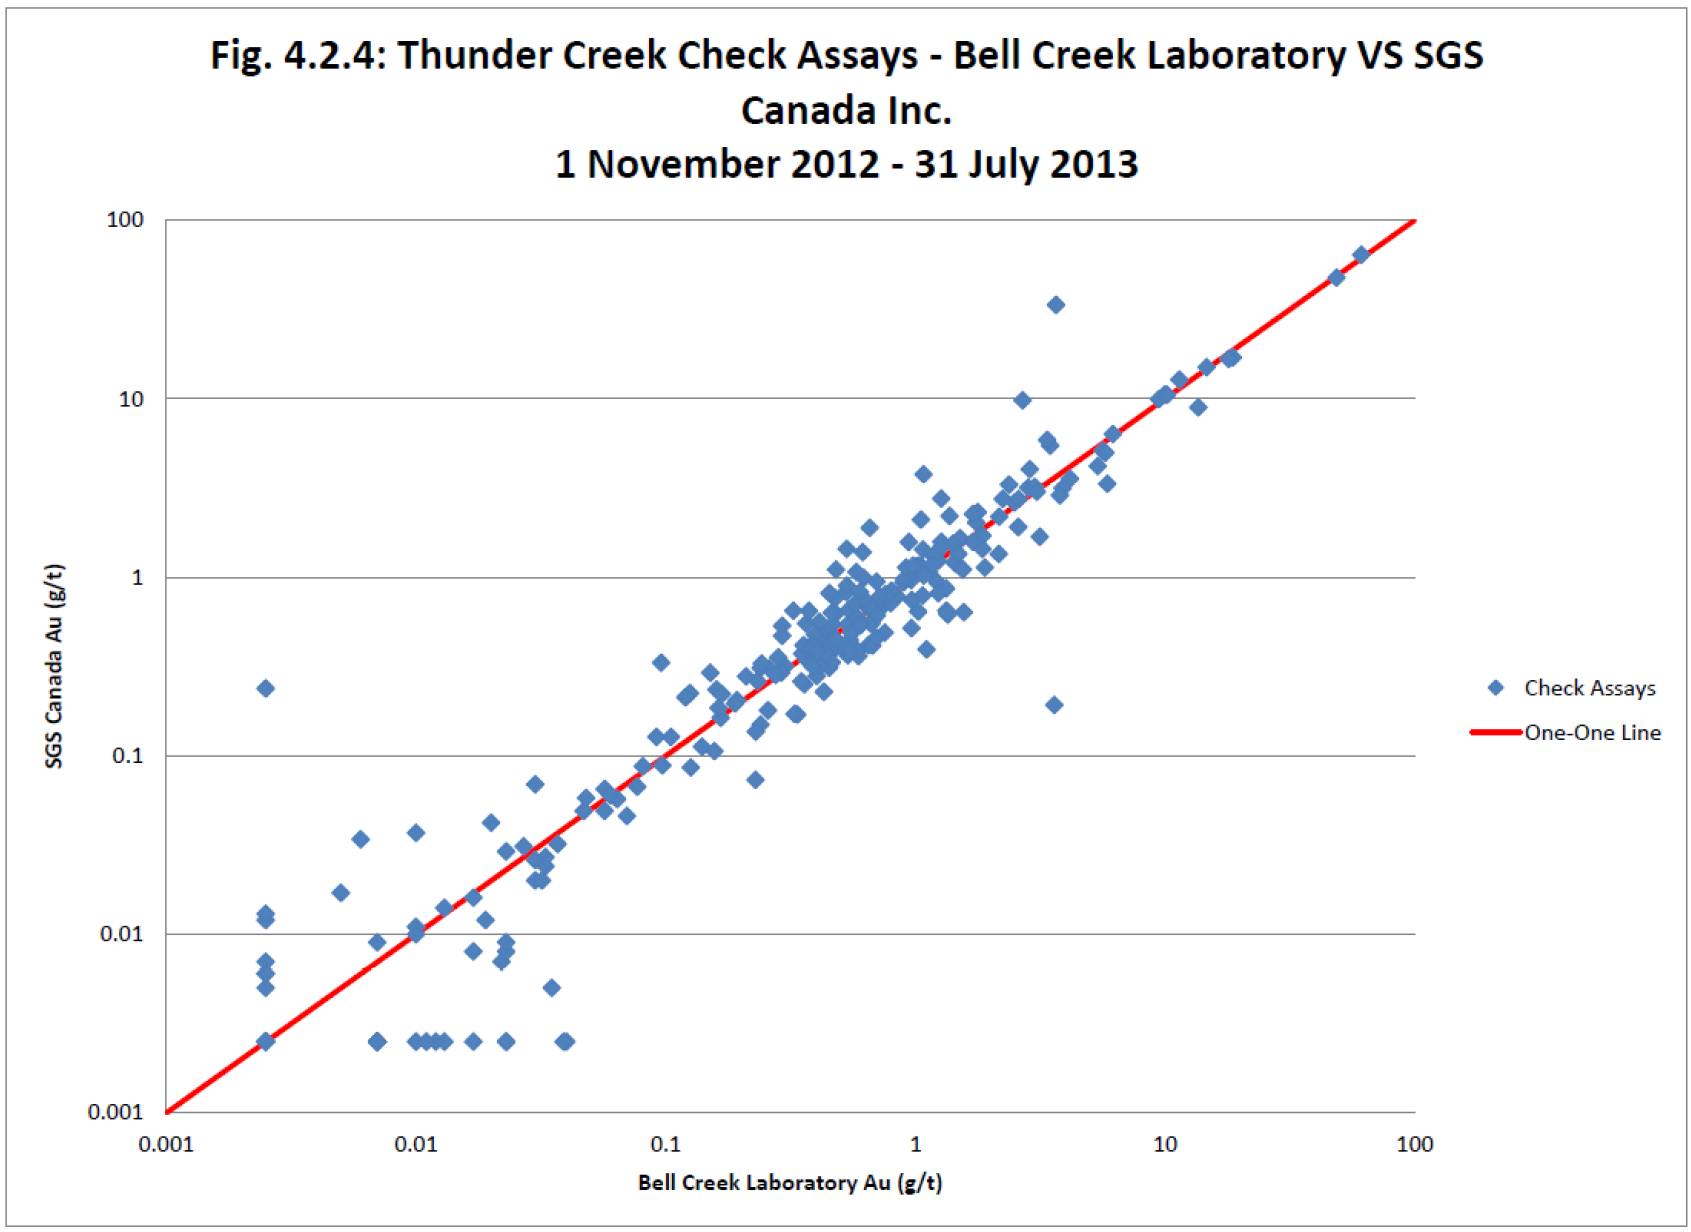
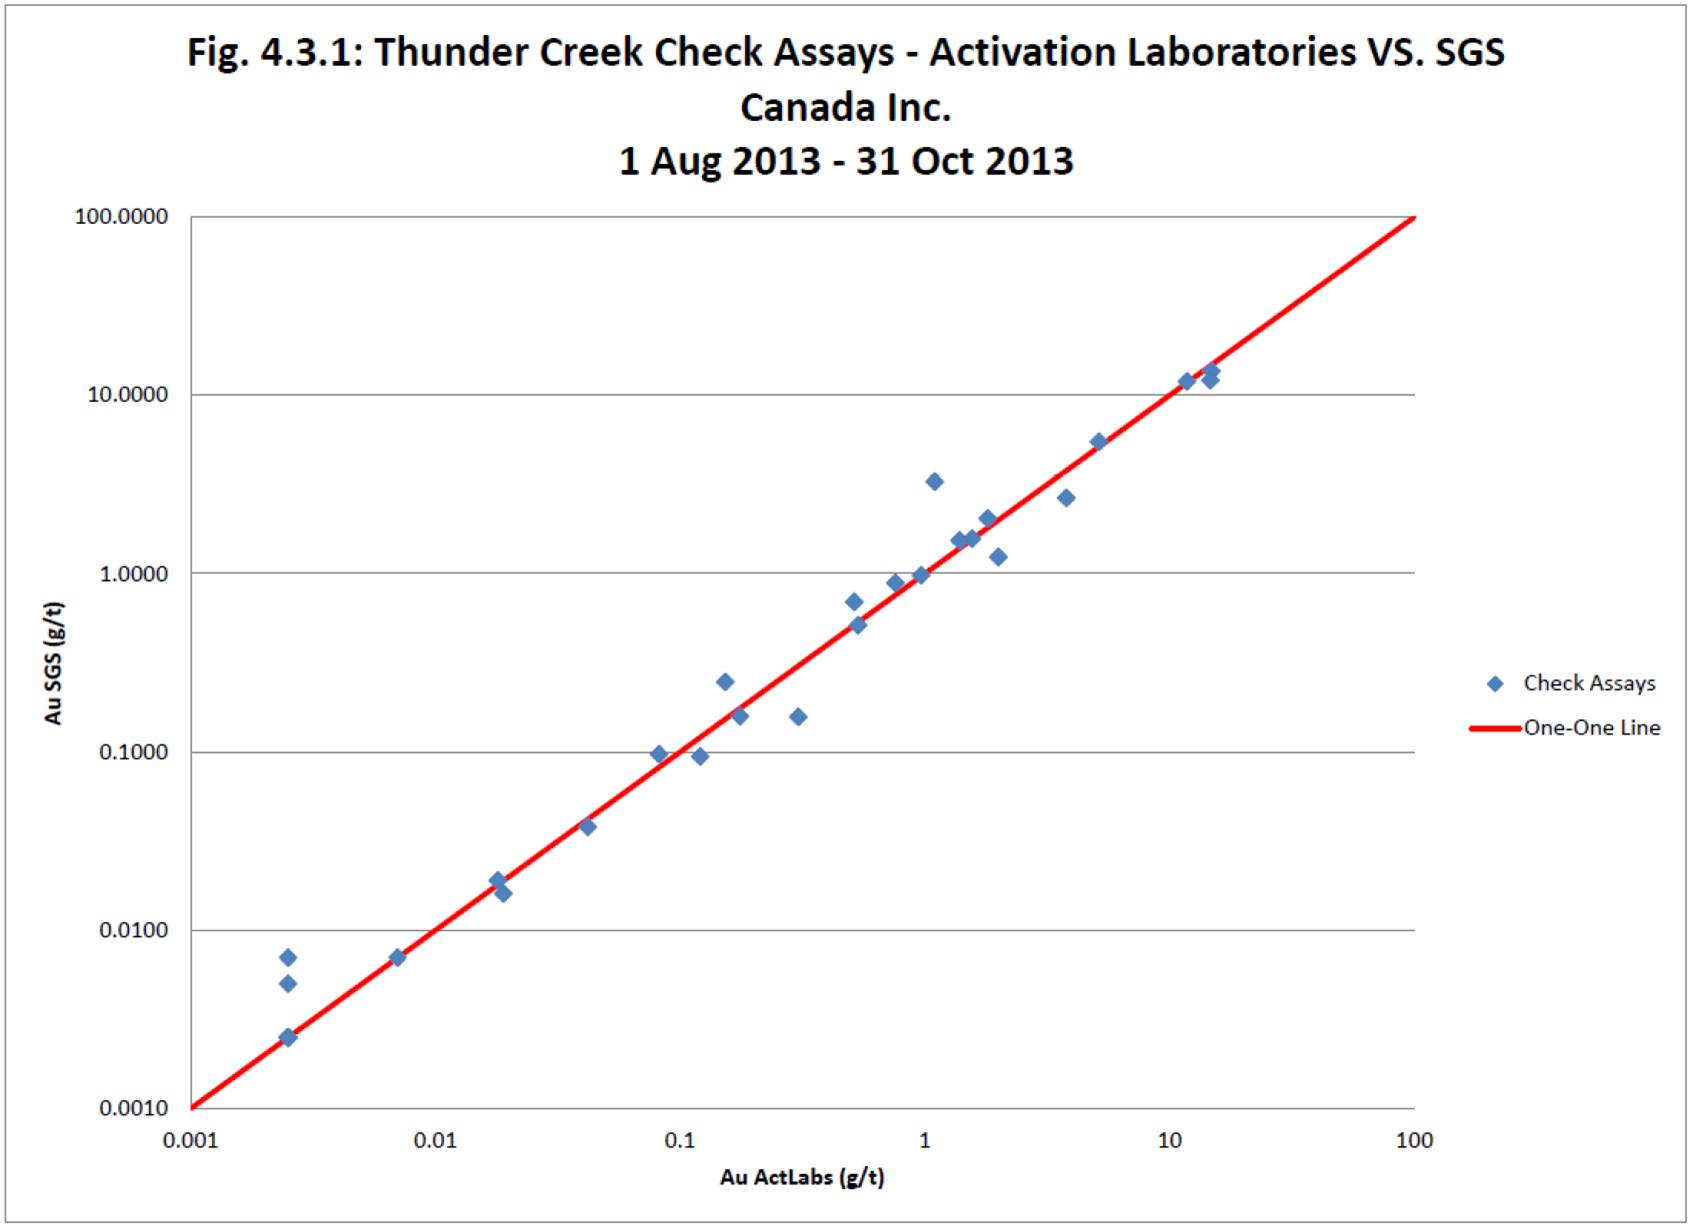
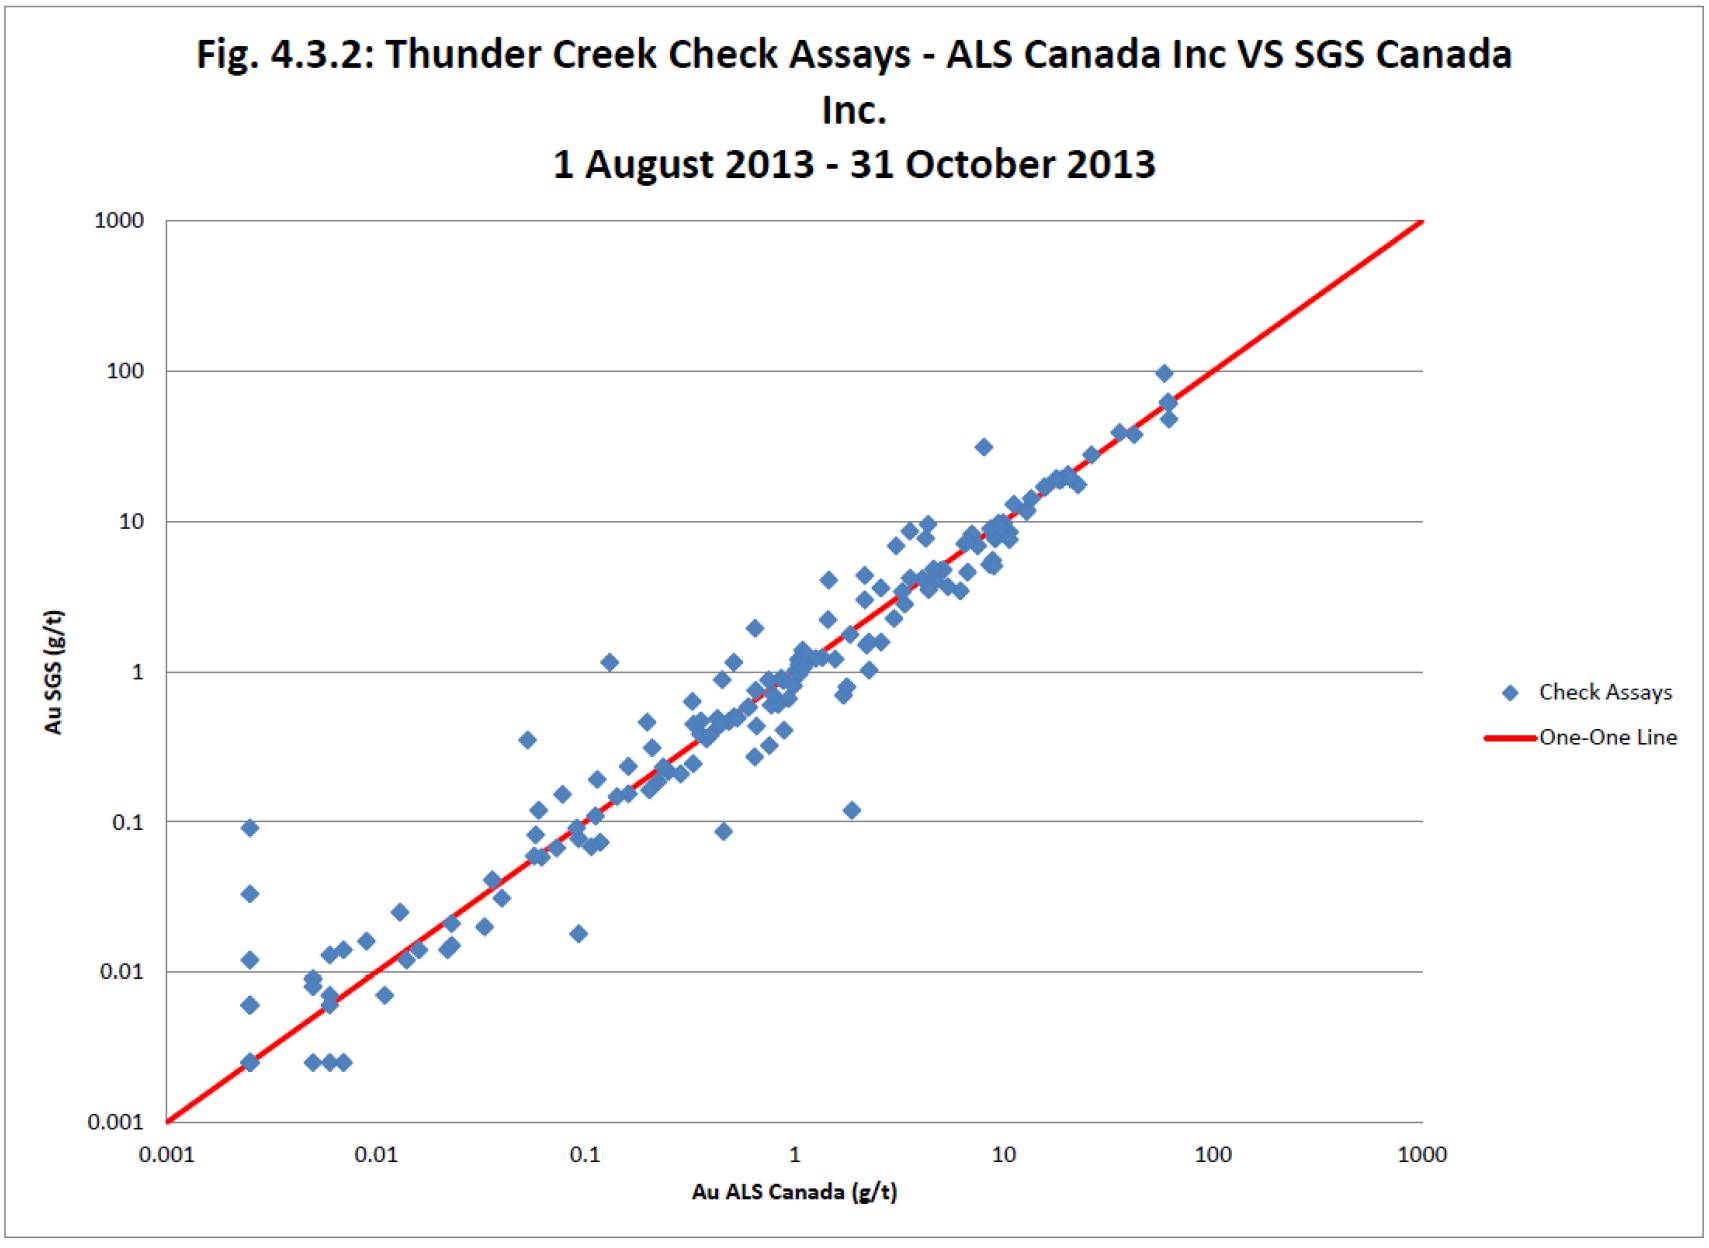
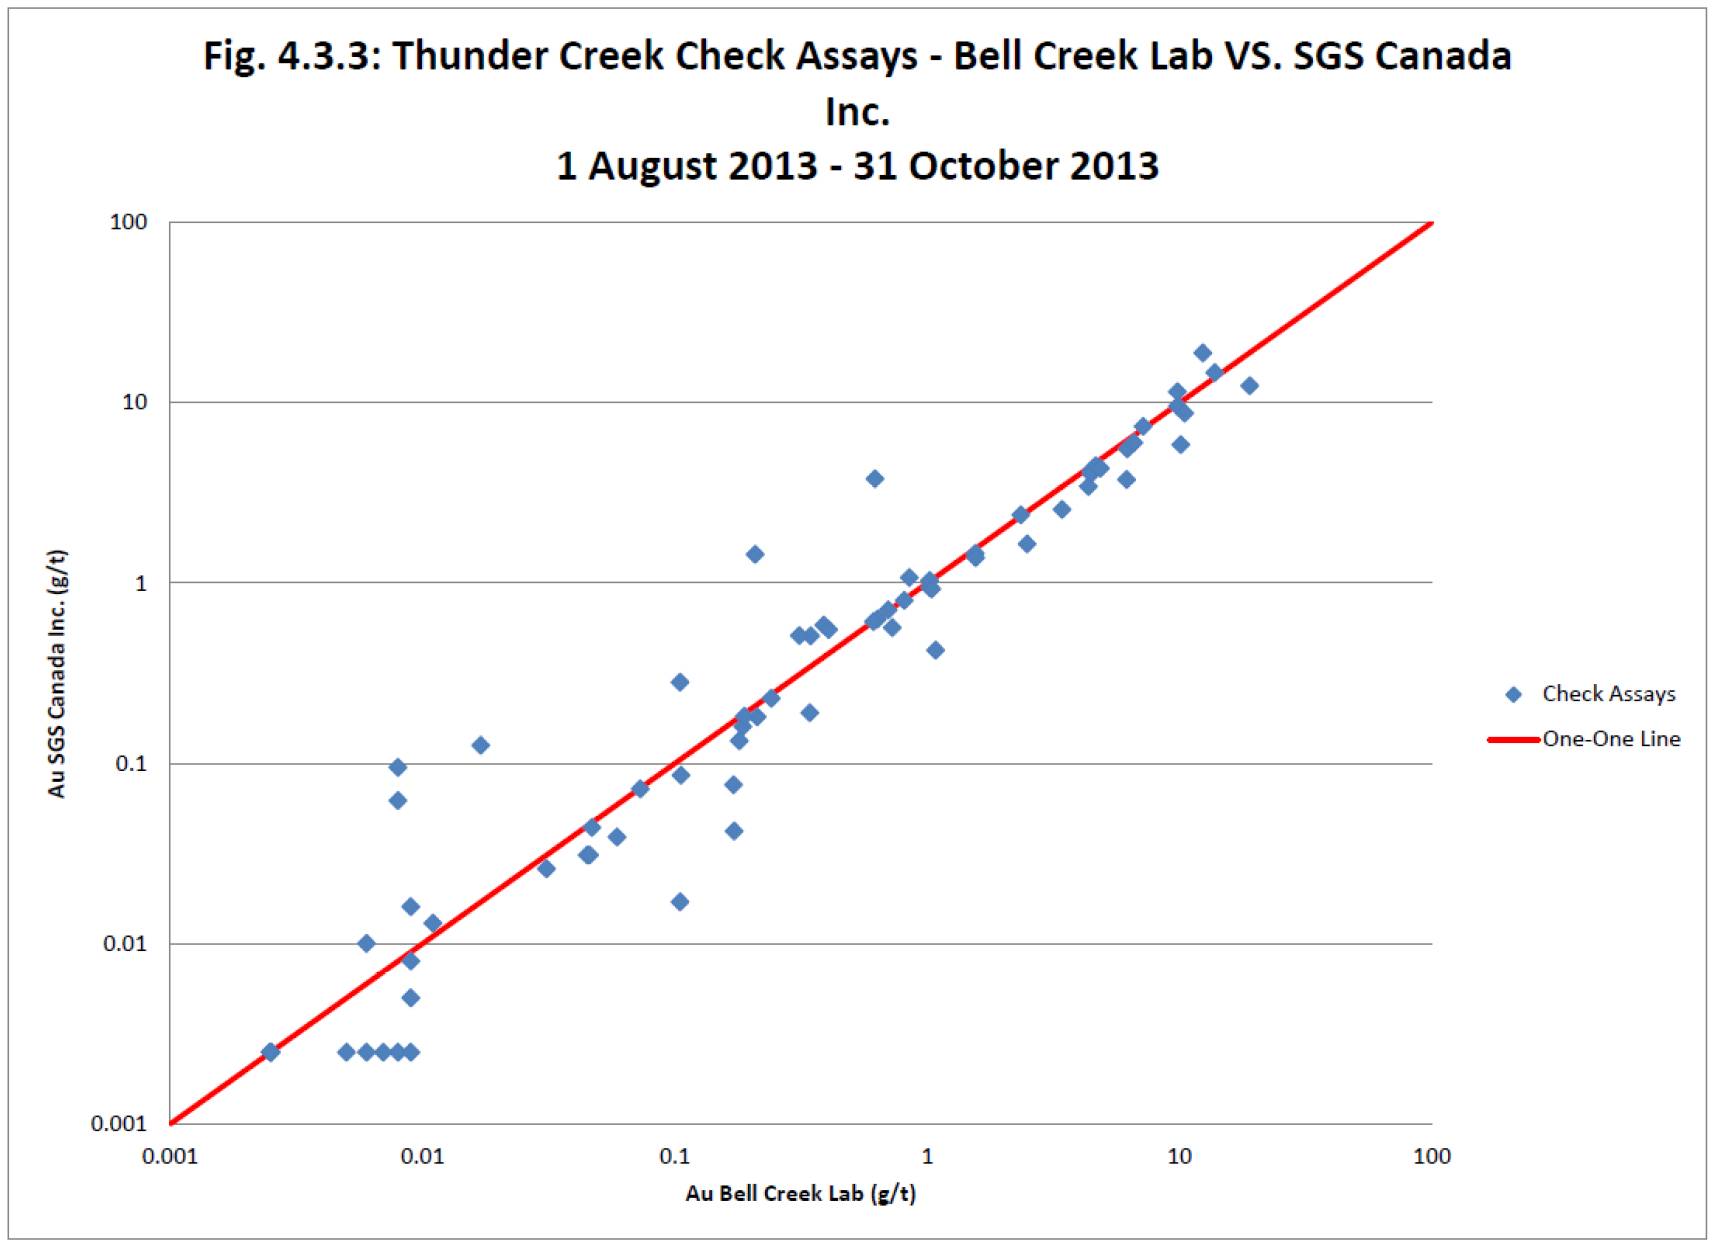
Statistical Analysis of Timmins Mine QAQC Data — January 31st, 2012 — November 26th, 2013
Introduction
This memo describes a review of Lake Shore Gold’s blind QA/QC program for underground diamond drilling for the Timmins Mine deposit for the period since the last 43-101 Technical report inclusive from between January 31, 2012 and November 26th, 2013. During that time period, a total of 74,001 core samples were sent to five different analytical labs, with 33% and 25% going to ALS Canada and Bell Creek respectively. Table 1.1 summarizes the number of samples sent to the various labs and the number of QA/QC samples used. Due to the low number of samples sent to Activation Labs, analysis on only two standards was done, but check assaying on pulps was done.
What follows is a statistical analysis of QAQC data for gold assays for Timmins Mine diamond drill core. The assays analyzed are those between January 31, 2012 and November 26th, 2013. See Table 1.1 below for a breakdown of all drill core samples, standards, blanks, and coarse duplicates sent to various laboratories in the time period.
Table 1.0: Timmins Mine Samples: 31 Jan 2012 — 26 Nov 2013 |
|
Laboratory | | Drill Core
Samples | | Standards | | Blanks | | Coarse
Duplicates | | Total
QA/QC
Samples | |
Accurassay Laboratories | | 11,938 | | 600 | | 690 | | 559 | | 1,849 | |
Activation Laboratories | | 7,666 | | 143 | | 170 | | 158 | | 471 | |
ALS Canada Ltd. | | 24,199 | | 745 | | 830 | | 766 | | 2,341 | |
Bell Creek Laboratory | | 18,424 | | 679 | | 774 | | 693 | | 2,146 | |
Cattarello Assayers Inc. | | 11,774 | | 579 | | 645 | | 546 | | 1,770 | |
ALL LABS | | 74,001 | | 2,746 | | 3,109 | | 2,722 | | 8,577 | |
1.0 Standards
In the time period from January 31st, 2012 to November 26th, 2013, over 2700 standards were sent to various assay labs (Table 1.0).
Results from a variety of standard pulps from five labs have been separated and analyzed from the Timmins Mine project. The labs used in 2012 were as follows: Accurassay Laboratories, Activation Laboratories (ActLabs), ALS Canada Ltd., Bell Creek Laboratory, and Cattarello Labs (Figs. 1.1 to 1.5). Summary statistics of standard results have are shown below (Tables 1.1-1.5). Each table lists the following:
· Target value of standard
· Standard deviation of standard
· The minimum / maximum gates of the standard (±3 standard deviations)
· The number of results for the standard (Nb)
· The mean / average result (Average)
· Percent relative difference between the mean result and the target (%Diff)
· Percentage of results below and above the target (PBelow and PAbove)
· Percentage of results outside the Min/Max gates of target
Although the graphs show all the standards, statistics were compiled on standards with more than 20 results. There were nine odd standards removed from the statistical analysis, as they were obvious mislabels. Five standards were removed from Cattarello Lab, two obvious blanks from O-15h standard, two mislabels from O-17c standard, and one mislabel from O-16b standard. Four standards were removed from Accurassay Lab, one mislabel each from O-15h, O-16b, O-17c, and O-503.
Activation Laboratories has the lowest percent difference between means, with a value of 0.18%. The lab also does not have any failures for these samples, but it is a low sample size, based on only two standards. The percent of results below and above target are 46.19% and 53.81% respectively, which indicates they could be slightly overestimating the true grade. More results are recommended to get a true idea of what to expect from this lab, however it has performed well for these two standards.
ALS Canada has the next lowest percent difference, at -0.88%. It has more negative differences than positive, which indicates they may be slightly undervaluing the true grade. The percent of results below and above target are 54.30% and 45.70% respectively. ALS has a failure rate of 4.18%, based on 693 samples.
Cattarello Assayers performed well for the standards, having a percent difference of -0.85%. All of the standards have a negative percent difference, indicating that Cattarello may be undervaluing the true grade. Overall, 65.31% of the results came back lower than standard target. The lab has a failure rate of 2.27%, based on 572 samples.
Bell Creek Laboratory performed at acceptable levels for the standards. It returned an average percent difference of 1.72%., with most of the individual percent differences being positive, except for one. The percent differences range from -0.50% to 5.05%. Overall, 60.97% of the results came back higher than the standard target, which indicates that lab could be overestimating the grades slightly. The failure rate of was a little high at 7.96%, based on 603 samples.
Accurassay Laboratories performed the worst for the standards, with a failure rate of 11.56%. The average percent difference is -1.10%, with all but one percent differences that was negative, indicating that Accurassay may be undervaluing the true grade. The percent differences range from -3.27% to 0.68%. The percent of results below and above target are 52.92% and 47.08%, respectively.
See Fig. 1.1 to Fig. 1.5 for detailed plots of all standards for each laboratory. See Table 1.1 to 1.5 for detailed statistics of standards with more than 20 results.
2.0 Blanks
Results from blanks have also been separated by each lab. Here we determine the percentage of results above a given failure limit. Traditionally the cutoff limit is five times the detection limit (0.0125 g/t Au). Lake Shore Gold uses a cutoff limit of 0.1 g/t Au.
All of the labs performed reasonably well here, as many of the blank failures are caused by contamination after high grade samples.
Activation Laboratories performed the best for the blanks, having no failures out of 170 samples. This is also the lab with lowest sample size.
Accurassay performed the second best for the blanks, having a failure rate of 0.29%, out of 690 samples.
ALS Canada has a failure rate for the blanks of 1.08%, out of 830 samples (the largest sample size). Out of the nine blanks failure that ALS had, one was most certainly caused by contamination after a very high grade sample with VG. The rest of the 8 failures all occurred from March 8th to 21st 2013, and were
also most likely due to contamination of the blank. LSG expressed their concern with the lab, and made sure that they would clean their crushers more thoroughly.
Cattarello and Bell Creek Laboratory performed similarly here, at 1.40% and 1.68% failure rates respectively. Cattarello has a sample size of 645 blanks, while Bell Creek Laboratory has a sample size of 774 blanks.
See Table 2.1 below for breakdown of blank statistics for each laboratory.
Table 2.1: Timmins Mine Blanks |
|
Lab | | Total blanks | | Number > 0.1 | | % > 0.1 | |
ACCURASSAY | | 690 | | 2 | | 0.29 | |
Actlabs | | 170 | | 0 | | 0.00 | |
ALS Canada | | 830 | | 9 | | 1.08 | |
Bell Creek | | 774 | | 13 | | 1.68 | |
Cattarello | | 645 | | 9 | | 1.40 | |
See Fig. 2.1 to Fig. 2.5 for detailed plots for each laboratory.
3.0 Coarse Duplicates
Coarse duplicates are assays from a new pulp taken from the crushed and ground (but not pulverized) reject of the original sample. There is more variability in these duplicates than in lab duplicates. A total of 2722 course duplicates were sent to the various labs, with detailed statistics shown in Tables 3.1 to 3.5.
Bell Creek Laboratory produced the best coarse duplicate results here, with an average percent difference of -0.22%. The correlation coefficient is 0.99, which represents a very strong relationship between the sets of data. The sample size is one of the largest, at 69 pairs.
ALS Canada also performed well here, giving an average percent difference of 2.99%, indicating that the duplicates on average tend to be higher than the originals. ALS Canada has the largest sample size, at 766 pairs. The correlation coefficient is 0.96, indicating a strong relationship between the two sets of data.
Activation Laboratories performed reasonably well, giving an average percent different of -3.51%, indicating that the duplicates tend to have lower values than the originals. The correlation coefficient is 0.99, indicating a very strong relationship between the duplicate pairs.
Cattarello gives an average percent different of 3.91%, indicating that the duplicates tend to have higher results than their originals. The correlation coefficient is 0.87, the second poorest for the five labs.
Accurassay Laboratories performed the worst for the coarse duplicates, with an average percent difference of -12.51%. This indicates that on average, the duplicate tends to be lower than the original. The correlation coefficient is similar to Cattarello, at 0.85.
See Fig. 3.1 to Fig. 3.5 for detailed log-normal plots of statistics for each lab.
4.0 Check Assays
A program of check assaying (total of 2901 pulp samples) was completed on analytical results sent to the various labs for the time periods January 1, 2012 to September 30, 2012, October 1, 2012 to July 31, 2013, August 1, 2013 to October 31, 2013 (see Table 4.0 below). This represents just under 5% of the total samples sent to each individual lab. No check assays were selected for the Cattarello Lab because
of the small amount of samples sent to that lab (<1.0% of total) and because the lab closed down and has not been sent any drill core samples since late 2012.
Check assay programs were completed for the periods January 1, 2012 to September 30, 2012 at ALS Canada, and for the periods October 1, 2012 to July 31, 2013 and August 1, 2013 to October 31, 2013 at SGS Canada. Results from these three time periods are summarized in Sections 4.1 to 4.3.
Table 4.0: Total Timmins Mine Samples Used for Check Assay Program. |
|
1 Jan 2012 - 30 Sep 2012 | |
Laboratory | | # Samples | |
Accurassay | | 6803 | |
1 Oct 2012 - 31 Jul 2013 | |
Laboratory | | # Samples | |
Accurassay | | 6559 | |
ActLabs | | 3256 | |
ALS Canada | | 22519 | |
Bell Creek | | 6635 | |
Cattarello | | 658 | |
1 Aug 2013 - 31 Oct 2013 | |
Laboratory | | # Samples | |
ActLabs | | 2033 | |
ALS Canada | | 1675 | |
Bell Creek | | 5204 | |
4.1 ALS Canada Ltd. Check Assay Program — 1 January 2012 to 30 September 2012
A total of 372 Accurassay pulps were sent for check assay to ALS Canada Ltd. The original Accurassay values range from 0.0025 g/t Au to 8.74 g/t Au, and have a mean of 0.66 g/t Au. The check ALS values range from 0.0025 g/t Au to 13.60 g/t Au, and have a mean of 0.68 g/t Au. The percent difference between the means is 3.44%, which means ALS results are expected to be slightly higher. The correlation coefficient between the two sets of data is 0.84, which represents a good linear relationship.
4.2 SGS Canada Inc. Check Assay Program — 1 October 2012 to 31 July 2013
4.2.1 Accurassay Laboratories vs. SGS Canada Inc.
A total of 361 pulp samples from Accurassay Laboratories were sent for check assay to SGS Canada. The Accurassay Laboratories original results range from 0.0025 g/t Au to 74.26 g/t Au, having a mean of 1.63 g/t Au. The SGS check results range from 0.0025g/t Au to 130.09 g/t Au, having a mean of 1.84 g/t Au. The percent difference between the means is 11.93%, which indicates that the SGS pulps are more likely to be higher than then Accurassay originals. The correlation coefficient for the data is 0.75.
See Fig. 4.2.1 for detailed log-normal plot. See Table 4.2.1 for detailed statistics.
4.2.2 Activation Laboratories vs. SGS Canada Inc.
A total of 152 Activation Laboratories pulps were sent for check assay to SGS Canada. The original Activation Laboratories results range from 0.0025 g/t Au to 80.50 g/t Au, having a mean of 6.07 g/t Au. The check SGS results range from 0.0025 g/t Au to 87.05 g/t Au, having a mean of 6.18 g/t Au. The percent difference between the means is 1.67%, indicating that the SGS check results are, on average, slightly higher than Activation Laboratories results. The correlation coefficient for the data is 1.00, which represents a very strong linear relationship.
See Fig. 4.2.2 for detailed log-normal plot. See Table 4.2.2 for detailed statistics.
4.2.3 ALS Canada Ltd. vs. SGS Canada Inc.
A total of 1169 ALS Canada pulp samples were sent for check assay to SGS Canada Inc. The original ALS Canada results range from 0.0025 g/t Au to 204.00 g/t Au, having a mean of 2.89 g/t Au. The check SGS Canada results range from 0.0025 g/t Au to 333.27 g/t Au, having a mean of 3.14 g/t Au. The percent difference between the means is 8.32%, indicating that the SGS check results tend to have higher values than the original ALS values. The correlation coefficient for the sets is 0.71. There is one check result that varies greatly from the original ALS value (ALS original is 0.38 g/t Au, SGS check is 333.27 g/t Au), which skews the statistics. Without this questionable result, the percent difference between means is -1.19%, and the correlation coefficient is 0.99, which is much more acceptable.
See Fig. 4.2.3 for detailed log-normal plot. See Table 4.2.3 for detailed statistics.
4.2.4 Bell Creek Laboratory vs. SGS Canada Inc.
A total of 341 Bell Creek Laboratory pulp samples were sent for check assay to SGS Canada Inc.
The original Bell Creek Laboratory values range from 0.0025 g/t Au to 59.17 g/t Au, having a mean of 2.71 g/t Au. The check SGS Canada values from 0.0025 g/t Au to 66.68 g/t Au, having a mean of 2.67 g/t Au. The percent difference between the means is -1.34%. This indicates that the SGS values tend to be very slightly lower than the original Bell Creek Laboratory values.
See Fig. 4.2.3 for detailed log-normal plot. See Table 4.2.4 for detailed statistics.
4.3 SGS Canada Inc. Check Assay Program — 1 July 2013 to 31 October 2013
4.3.1 Activation Laboratories vs. SGS Canada Inc.
A total of 112 Activation Laboratories pulps were sent for check assay to SGS Canada Inc.
The original Activation Laboratories pulps range from 0.0025 g/t Au to 27.50 g/t Au, and have a mean 2.02 g/t Au. The check SGS Canada results range from 0.0025 g/t Au to 37.12 g/t Au, and have a mean of 2.17 g/t Au. The percent difference between the means is 6.94%. The correlation coefficient is 0.99, which indicates a very strong linear relationship between the sets of data.
See Fig.4.3.1 for detailed log-normal plot. See Table 4.3.1 for detailed statistics.
4.3.2 ALS Canada Ltd. vs. SGS Canada Inc.
A total of 95 ALS Canada pulps were sent for check assay to SGS Canada Inc.
The original ALS Canada pulps range from 0.0025 g/t Au to 30.70 g/t Au, and have a mean of 3.20 g/t Au. The check SGS values range from 0.0025 g/t Au to 31.71 g/t Au, and have a mean of 3.23 g/t Au. The percent difference between the means is 1.04%. The correlation coefficient is 0.97, indicating a strong linear relationship between the sets.
See Fig. 4.3.2 for a detailed log-normal plot. See Table 4.3.2 for detailed statistics.
4.3.3 Bell Creek Laboratory vs. SGS Canada Inc.
A total of 299 Bell Creek Laboratory pulps were sent for check assay to SGS Canada Inc.
The original Bell Creek Laboratory pulps range from 0.0025 g/t Au to 82.83 g/t Au, and have a mean of 2.60 g/t Au. The check SGS Canada values range from 0.0025 g/t Au to 68.49 g/t Au, and have a mean of 2.61 g/t Au. The percent difference between the means is very low at 0.41%. The correlation coefficient is 0.90, indicating a good linear relationship between the two sets of data.
See Fig. 4.3.3 for a detailed log-normal plot. See Table 4.3.3 for detailed statistics.
5.0 Analytical Lab Internal Standards, Blanks and Duplicates
No analysis has been completed for this report on the main five analytical lab’s internal QA/QC samples (standards, blanks or duplicates). This data is routinely reviewed by the drill program QP and database administrator while assay results are emailed from the respective labs and prior to importation into the database.
6.0 Conclusions
Drill core samples from underground drill holes that were added to the Timmins Mine drill database between the period January, 2012 to October 31, 2013 were sent to five analytical labs.
No critical issues were identified that would lead Lake Shore Gold to believe that there is a concern with the analytical results.
Some issues identified with Accurassay (high failure rate standards and poor coarse duplicate results) resulted in a decision not to use the lab from May 2013 onward. Cattarello Lab closed down and has not been used since Late 2012.
Table 2.1: Timmins Mine Standards -Accurassay Laboratories
Standard | | Target
Au (g/t) | | Std Dev
Au (g/t) | | 3Std Dev Min
Au (g/t) | | 3Std Dev Max
Au (g/t) | | Nb | | Average
Au (g/t) | | %Diff | | Nb Below
Target | | Nb Above
Target | | Nb
Fail | | Pbelow
% | | Pabove
% | | Poutside
% | |
O-15h | | 1.019 | | 0.025 | | 0.945 | | 1.093 | | 96 | | 0.9991 | | -1.95289 | | 50 | | 46 | | 9 | | 52.08 | | 47.92 | | 9.38 | |
O-16b | | 2.21 | | 0.07 | | 1.99 | | 2.43 | | 154 | | 2.1378 | | -3.26697 | | 98 | | 56 | | 19 | | 63.64 | | 36.36 | | 12.34 | |
O-17c | | 3.04 | | 0.08 | | 2.79 | | 3.29 | | 64 | | 3.0226 | | -0.57237 | | 35 | | 29 | | 10 | | 54.69 | | 45.31 | | 15.63 | |
O-19a | | 5.49 | | 0.1 | | 5.19 | | 5.79 | | 79 | | 5.4703 | | -0.35883 | | 38 | | 41 | | 11 | | 48.10 | | 51.90 | | 13.92 | |
O-503 | | 0.687 | | 0.024 | | 0.615 | | 0.759 | | 149 | | 0.6917 | | 0.684134 | | 73 | | 76 | | 15 | | 48.99 | | 51.01 | | 10.07 | |
O-62c | | 8.79 | | 0.21 | | 8.16 | | 9.42 | | 46 | | 8.69 | | -1.13766 | | 23 | | 23 | | 4 | | 50.00 | | 50.00 | | 8.70 | |
ALL | | | | | | | | | | 588 | | | | -1.101 | | | | | | 68 | | 52.92 | | 47.08 | | 11.56 | |
Table 1.2: Timmins Mine Standards - Activation Laboratories
Standard | | Target
Au (g/t) | | Std Dev
Au (g/t) | | 3Std Dev Min
Au (g/t) | | 3Std Dev Max
Au (g/t) | | Nb | | Average
Au (g/t) | | %Diff | | Nb Below
Target | | Nb Above
Target | | Nb
Fail | | Pbelow
% | | Pabove
% | | Poutside
% | |
O-61d | | 4.76 | | 0.14 | | 4.33 | | 5.19 | | 21 | | 4.7719 | | 0.25 | | 11 | | 10 | | 0 | | 52.38 | | 47.62 | | 0.00 | |
O-67a | | 2.238 | | 0.096 | | 1.95 | | 2.526 | | 25 | | 2.2404 | | 0.107239 | | 10 | | 15 | | 0 | | 40.00 | | 60.00 | | 0.00 | |
ALL | | | | | | | | | | 46 | | | | 0.179 | | | | | | 0 | | 46.19 | | 53.81 | | 0.00 | |
Table 1.3: Timmins Mine Standards - ALS Canada Ltd.
Standard | | Target
Au (g/t) | | Std Dev
Au (g/t) | | 3Std Dev Min
Au (g/t) | | 3Std Dev Max
Au (g/t) | | Nb | | Average
Au (g/t) | | %Diff | | Nb Below
Target | | Nb Above
Target | | Nb
Fail | | Pbelow
% | | Pabove
% | | Poutside
% | |
O-15d | | 1.559 | | 0.042 | | 1.433 | | 1.685 | | 90 | | 1.5342 | | -1.59076 | | 54 | | 36 | | 4 | | 60.00 | | 40.00 | | 4.44 | |
O-15h | | 1.019 | | 0.025 | | 0.945 | | 1.093 | | 75 | | 0.9995 | | -1.91364 | | 54 | | 21 | | 4 | | 72.00 | | 28.00 | | 5.33 | |
O-16a | | 1.81 | | 0.06 | | 1.62 | | 1.99 | | 19 | | 1.7858 | | -1.33702 | | 9 | | 10 | | 1 | | 47.37 | | 52.63 | | 5.26 | |
O-16b | | 2.21 | | 0.07 | | 1.99 | | 2.43 | | 56 | | 2.197 | | -0.58824 | | 29 | | 27 | | 3 | | 51.79 | | 48.21 | | 5.36 | |
O-18c | | 3.52 | | 0.11 | | 3.2 | | 3.84 | | 72 | | 3.4972 | | -0.64773 | | 47.5 | | 24.5 | | 2 | | 65.97 | | 34.03 | | 2.78 | |
O-19a | | 5.49 | | 0.1 | | 5.19 | | 5.79 | | 21 | | 5.5648 | | 1.362477 | | 6 | | 15 | | 2 | | 28.57 | | 71.43 | | 9.52 | |
O-202 | | 0.752 | | 0.026 | | 0.675 | | 0.83 | | 27 | | 0.7417 | | -1.36968 | | 18.5 | | 8.5 | | 1 | | 68.52 | | 31.48 | | 3.70 | |
O-502 | | 0.491 | | 0.02 | | 0.431 | | 0.551 | | 52 | | 0.4846 | | -1.30346 | | 33 | | 19 | | 2 | | 63.46 | | 36.54 | | 3.85 | |
O-503 | | 0.687 | | 0.024 | | 0.615 | | 0.759 | | 116 | | 0.6852 | | -0.26201 | | 54 | | 62 | | 2 | | 46.55 | | 53.45 | | 1.72 | |
O-62c | | 8.79 | | 0.21 | | 8.16 | | 9.42 | | 27 | | 8.7081 | | -0.93174 | | 16 | | 11 | | 1 | | 59.26 | | 40.74 | | 3.70 | |
O-67a | | 2.238 | | 0.096 | | 1.95 | | 2.526 | | 84 | | 2.191 | | -2.10009 | | 39 | | 45 | | 6 | | 46.43 | | 53.57 | | 7.14 | |
O-6Pc | | 1.52 | | 0.065 | | 1.32 | | 1.72 | | 54 | | 1.5219 | | 0.125 | | 22.5 | | 31.5 | | 1 | | 41.67 | | 58.33 | | 1.85 | |
ALL | | | | | | | | | | 693 | | | | -0.880 | | | | | | 29 | | 54.30 | | 45.70 | | 4.18 | |
Table 1.4: Timmins Mine Standards - Bell Creek Laboratory
Standard | | Target
Au (g/t) | | Std Dev
Au (g/t) | | 3Std Dev Min
Au (g/t) | | 3Std Dev Max
Au (g/t) | | Nb | | Average
Au (g/t) | | %Diff | | Nb Below
Target | | Nb Above
Target | | Nb Fail | | Pbelow
% | | Pabove
% | | Poutside
% | |
O-15h | | 1.019 | | 0.025 | | 0.945 | | 1.093 | | 46 | | 1.0705 | | 5.053974 | | 12 | | 34 | | 9 | | 26.09 | | 73.91 | | 19.57 | |
O-16b | | 2.21 | | 0.07 | | 1.99 | | 2.43 | | 143 | | 2.199 | | -0.49774 | | 95.5 | | 47.5 | | 2 | | 66.78 | | 33.22 | | 1.40 | |
O-17c | | 3.04 | | 0.08 | | 2.79 | | 3.29 | | 73 | | 3.1112 | | 2.342105 | | 18.5 | | 54.5 | | 7 | | 25.34 | | 74.66 | | 9.59 | |
O-18c | | 3.52 | | 0.11 | | 3.2 | | 3.84 | | 26 | | 3.5421 | | 0.627841 | | 13 | | 13 | | 2 | | 50.00 | | 50.00 | | 7.69 | |
O-19a | | 5.49 | | 0.1 | | 5.19 | | 5.79 | | 64 | | 5.5905 | | 1.830601 | | 21 | | 43 | | 17 | | 32.81 | | 67.19 | | 26.56 | |
O-503 | | 0.687 | | 0.024 | | 0.615 | | 0.759 | | 149 | | 0.7105 | | 3.42067 | | 30.5 | | 118.5 | | 5 | | 20.47 | | 79.53 | | 3.36 | |
O-61d | | 4.76 | | 0.14 | | 4.33 | | 5.19 | | 35 | | 4.8009 | | 0.859244 | | 14 | | 21 | | 3 | | 40.00 | | 60.00 | | 8.57 | |
O-62c | | 8.79 | | 0.21 | | 8.16 | | 9.42 | | 67 | | 8.8005 | | 0.119454 | | 34 | | 33 | | 3 | | 50.75 | | 49.25 | | 4.48 | |
ALL | | | | | | | | | | 603 | | | | 1.720 | | | | | | 48 | | 39.03 | | 60.97 | | 7.96 | |
Table 2.5: Timmins Mine Standards - Cattarello Assayers Inc.
Standard | | Target
Au (g/t) | | Std Dev
Au (g/t) | | 3Std Dev Min
Au (g/t) | | 3Std Dev Max
Au (g/t) | | Nb | | Average
Au (g/t) | | %Diff | | Nb Below
Target | | Nb Above
Target | | Nb Fail | | Pbelow
% | | Pabove
% | | Poutside
% | |
O-15h | | 1.019 | | 0.025 | | 0.945 | | 1.093 | | 140 | | 1.0149 | | -0.40236 | | 113.5 | | 26.5 | | 5 | | 81.07 | | 18.93 | | 3.57 | |
O-16b | | 2.21 | | 0.07 | | 1.99 | | 2.43 | | 26 | | 2.151 | | -2.66968 | | 23 | | 3 | | 0 | | 88.46 | | 11.54 | | 0.00 | |
O-17c | | 3.04 | | 0.08 | | 2.79 | | 3.29 | | 190 | | 3.0433 | | 0.108553 | | 104 | | 87 | | 0 | | 54.74 | | 45.79 | | 0.00 | |
O-19a | | 5.49 | | 0.1 | | 5.19 | | 5.79 | | 75 | | 5.4482 | | -0.76138 | | 49 | | 26 | | 4 | | 65.33 | | 34.67 | | 5.33 | |
O-503 | | 0.687 | | 0.024 | | 0.615 | | 0.759 | | 62 | | 0.6856 | | -0.20378 | | 27 | | 33 | | 0 | | 43.55 | | 53.23 | | 0.00 | |
O-62c | | 8.79 | | 0.21 | | 8.16 | | 9.42 | | 78 | | 8.7023 | | -0.99772 | | 46 | | 32 | | 3 | | 58.97 | | 41.03 | | 3.85 | |
ALL | | | | | | | | | | 571 | | | | -0.82106 | | | | | | 12 | | 65.35 | | 34.20 | | 2.10 | |
Table 3.1: Statistics of Timmins Mine Coarse Duplicate Results — Accurassay
Stats | | Original Accurassay
Value
Au (g/t) | | Coarse Duplicate Accurassay
Value
Au (g/t) | |
Number of Samples | | 559 | | 559 | |
Mean | | 0.98 | | 0.86 | |
Maximum Value | | 48.51 | | 43.12 | |
Minimum Value | | 0.0025 | | 0.0025 | |
Median | | 0.01 | | 0.01 | |
Variance | | 14.20 | | 9.85 | |
Standard Deviation | | 3.77 | | 3.14 | |
Coefficient of Variation | | 3.86 | | 3.65 | |
Correlation Coefficient | | 0.85 |
Percent Difference between Means | | -12.51 |
Table 3.2: Statistics of Timmins Mine Coarse Duplicate Results — ActLabs
Stats | | Original ActLabs Value
Au (g/t) | | Coarse Duplicate ActLabs
Value
Au (g/t) | |
Number of Samples | | 158 | | 158 | |
Mean | | 2.70 | | 2.61 | |
Maximum Value | | 102.00 | | 84.70 | |
Minimum Value | | 0.0025 | | 0.0025 | |
Median | | 0.04 | | 0.04 | |
Variance | | 81.59 | | 63.89 | |
Standard Deviation | | 9.03 | | 7.99 | |
Coefficient of Variation | | 3.35 | | 3.07 | |
Correlation Coefficient | | 0.99 |
Percent Difference between Means | | -3.51 |
Table 3.3: Statistics of Timmins Mine Coarse Duplicate Results — ALS
Stats | | Original ALS Value
Au (g/t) | | Coarse Duplicate ALS Value
Au (g/t) | |
Number of Samples | | 766 | | 766 | |
Mean | | 1.6044 | | 1.6532 | |
Maximum Value | | 76.8000 | | 71.0000 | |
Minimum Value | | 0.0025 | | 0.0025 | |
Median | | 0.0100 | | 0.0100 | |
Variance | | 33.0948 | | 37.7915 | |
Standard Deviation | | 5.7528 | | 6.1475 | |
Coefficient of Variation | | 3.5856 | | 3.7186 | |
Correlation Coefficient | | 0.96 |
Percent Difference between Means | | 2.99 |
Table 3.4: Statistics of Timmins Mine Coarse Duplicate Results — Bell Creek Lab
Stats | | Original Bell Creek Lab
Value
Au (g/t) | | Coarse Duplicate Bell Creek
Lab Value
Au (g/t) | |
Number of Samples | | 693 | | 693 | |
Mean | | 1.6539 | | 1.6502 | |
Maximum Value | | 97.0000 | | 108.7000 | |
Minimum Value | | 0.0025 | | 0.0025 | |
Median | | 0.0360 | | 0.0340 | |
Variance | | 39.3710 | | 45.1031 | |
Standard Deviation | | 6.2746 | | 6.7159 | |
Coefficient of Variation | | 3.7939 | | 4.0697 | |
Correlation Coefficient | | 0.99 |
Percent Difference between Means | | -0.22 |
Table 3.5: Statistics of Timmins Mine Coarse Duplicate Results - Cattarello
Stats | �� | Original Cattarello Value
Au (g/t) | | Coarse Duplicate Cattarello
Value
Au (g/t) | |
Number of Samples | | 546 | | 546 | |
Mean | | 1.0354 | | 1.0767 | |
Maximum Value | | 25.2030 | | 30.5210 | |
Minimum Value | | 0.0025 | | 0.0025 | |
Median | | 0.0150 | | 0.0160 | |
Variance | | 9.2491 | | 12.0639 | |
Standard Deviation | | 3.0412 | | 3.4733 | |
Coefficient of Variation | | 2.9373 | | 3.2258 | |
Correlation Coefficient | | 0.87 |
Percent Difference between Means | | 3.91 |
Table 4.1: Statistics of Check Assay Results - Accurassay vs. ALS
Stats | | Accurassay Pulp Assay
Au (g/t) | | ALS Pulp Assay
Au (g/t) | |
Number of Samples | | 372 | | 372 | |
Mean | | 0.66 | | 0.68 | |
Maximum Value | | 8.74 | | 13.60 | |
Minimum Value | | 0.0025 | | 0.0025 | |
Median | | 0.02 | | 0.01 | |
Variance | | 2.53 | | 3.06 | |
Standard Deviation | | 1.59 | | 1.75 | |
Coefficient of Variation | | 2.41 | | 2.56 | |
Correlation Coefficient | | 0.84 |
Percent Difference between Means | | 3.44 |
Tables 4.2.1 to 4.2.4: SGS Canada Inc. Check Assay Program — October 1, 2012 to July 31, 2013
Table 4.2.1: Statistics of Timmins Mine Check Assay Results - Accurassay vs. SGS
Stats | | Accurassay Pulp Assay
Au (g/t) | | SGS Pulp Assay
Au (g/t) | |
Number of Samples | | 361 | | 361 | |
Mean | | 1.63 | | 1.84 | |
Maximum Value | | 74.26 | | 130.09 | |
Minimum Value | | 0.0025 | | 0.0025 | |
Median | | 0.20 | | 0.23 | |
Variance | | 25.94 | | 59.17 | |
Standard Deviation | | 5.09 | | 7.69 | |
Coefficient of Variation | | 3.13 | | 4.19 | |
Correlation Coefficient | | 0.75 |
Percent Difference between Means | | 11.93 |
Table 4.2.2: Statistics of Check Assay Results
Stats | | ActLabs Pulp Assay
Au (g/t) | | SGS Pulp Assay
Au (g/t) | |
Number of Samples | | 152 | | 152 | |
Mean | | 6.07 | | 6.18 | |
Maximum Value | | 80.50 | | 87.05 | |
Minimum Value | | 0.0025 | | 0.0025 | |
Median | | 0.72 | | 0.71 | |
Variance | | 169.82 | | 182.11 | |
Standard Deviation | | 13.03 | | 13.49 | |
Coefficient of Variation | | 2.15 | | 2.18 | |
Correlation Coefficient | | 1.00 |
Percent Difference between Means | | 1.67 |
Table 4.2.3: Statistics of Check Assay Results - ALS VS SGS
Stats | | ALS Pulp Assay
Au (g/t) | | SGS Pulp Assay
Au (g/t) | |
Number of Samples | | 1169 | | 1169 | |
Mean | | 2.89 | | 3.14 | |
Maximum Value | | 204.00 | | 333.27 | |
Minimum Value | | 0.0025 | | 0.0025 | |
Median | | 0.16 | | 0.17 | |
Variance | | 107.27 | | 195.54 | |
Standard Deviation | | 10.36 | | 13.98 | |
Coefficient of Variation | | 3.59 | | 4.46 | |
Correlation Coefficient | | 0.71 |
Percent Difference between Means | | 8.32 |
Table 4.2.4: Statistics of Check Assay Results - BC Lab VS SGS
Stats | | Bell Creek Lab Pulp Assay
Au (g/t) | | SGS Pulp Assay
Au (g/t) | |
Number of Samples | | 341 | | 341 | |
Mean | | 2.71 | | 2.67 | |
Maximum Value | | 59.17 | | 66.68 | |
Minimum Value | | 0.0025 | | 0.0025 | |
Median | | 0.29 | | 0.27 | |
Variance | | 40.94 | | 43.99 | |
Standard Deviation | | 6.40 | | 6.63 | |
Coefficient of Variation | | 2.36 | | 2.48 | |
Correlation Coefficient | | 0.99 |
Percent Difference between Means | | -1.34 |
Tables 4.3.1 to 4.3.3: SGS Canada Inc Check Assay Program — August 1, 2013 to October 31, 2013
Table 4.3.1: Statistics of Check Assay Results - ActLabs VS SGS
Stats | | ActLabs Pulp Assay
Au (g/t) | | SGS Pulp Assay
Au (g/t) | |
Number of Samples | | 112 | | 112 | |
Mean | | 2.02 | | 2.17 | |
Maximum Value | | 27.50 | | 37.12 | |
Minimum Value | | 0.0025 | | 0.0025 | |
Median | | 0.06 | | 0.06 | |
Variance | | 21.73 | | 28.74 | |
Standard Deviation | | 4.66 | | 5.36 | |
Coefficient of Variation | | 2.31 | | 2.47 | |
Correlation Coefficient | | 0.99 |
Percent Difference between Means | | 6.94 |
Table 4.3.2: Statistics of Timmins Mine Check Assay Results - ALS VS SGS
Stats | | ALS Pulp Assay
Au (g/t) | | SGS Pulp Assay
Au (g/t) | |
Number of Samples | | 95 | | 95 | |
Mean | | 3.20 | | 3.23 | |
Maximum Value | | 30.70 | | 31.71 | |
Minimum Value | | 0.0025 | | 0.0025 | |
Median | | 0.98 | | 0.91 | |
Variance | | 27.61 | | 29.52 | |
Standard Deviation | | 5.25 | | 5.43 | |
Coefficient of Variation | | 1.64 | | 1.68 | |
Correlation Coefficient | | 0.97 |
Percent Difference between Means | | 1.04 |
Table 4.3.3: Statistics of Timmins Mine Check Assay Results - BC Lab VS SGS
Stats | | Bell Creek Lab Pulp Assay
Au (g/t) | | SGS Pulp Assay
Au (g/t) | |
Number of Samples | | 299 | | 299 | |
Mean | | 2.60 | | 2.61 | |
Maximum Value | | 82.83 | | 68.49 | |
Minimum Value | | 0.0025 | | 0.0025 | |
Median | | 0.15 | | 0.12 | |
Variance | | 46.06 | | 44.59 | |
Standard Deviation | | 6.79 | | 6.68 | |
Coefficient of Variation | | 2.61 | | 2.56 | |
Correlation Coefficient | | 0.90 |
Percent Difference between Means | | 0.41 |
APPENDIX 2
SGS CANADA MEMO REGARDING REVIEW OF THE TIMMINS WEST MINE RESOURCES

Validation of the Resources at the Thunder Creek and Timmins West Mines
Timmins, Ontario
Monday, March-31-14
| Respectfully submitted to: |
| |
| By: |
| |
| SGS Canada Inc. (SGS Geostat) |
SGS Canada Inc. | Geostat | |
| 10 boul. de la Seigneurie Est, Suite 203, Blainville, Québec Canada J7C 3V5 t (450) 433-1050 f (450) 433-1048 |
| | www.geostat.com | www.met.sgs.com |
| | Membre du Groupe SGS (SGS SA) |
SGS Geostat received a mandate from Lake Shore Gold (LSG) to verify certain aspects of the resource estimate on the Timmins West and Thunder Creek deposits; that were produced internally. One of the objectives of this work was to compare results with respect to the previous divulgation representing end of year 2012. The study has so far been limited to resource estimation; no particular attention has been paid to the transfer from resources to reserves, such as the methodology of stope selection. No significant errors were detected and the methodology used by LSG is appears to follow industry guidelines. The use of normal kriging is recommended for future resource estimations to reduce the error of block grade, particularly on the local scale.
The data was transferred to SGS Geostat and imported into Genesis software for validation and verification. Particular attention was paid to the Thunder Creek deposit due to the changes that occurred between the two versions of the models. The verifications that were undertaken include:
1. Compilation of the resource estimates at various cut-off grades to ensure that the results were comparable with LSG tables for both mines and both sets of block models (2012 and 2014).
2. Mineralized solids geometry generally respected drill hole information and do not overlap with each other.
3. Composites used for interpolation were properly constrained to the solids, and no gaps in compositing were detected.
4. An investigation on the loss of tonnage and grade for Thunder Creek between 2012 and 2014 models was undertaken.
a. Sections though block models were created for the 2012 and 2014 block models for the Thunder Creek model to visualize the changes in geometry and grade distribution between the two datasets. As expected with the addition of significant delineation drilling, the shapes of the ore bodies have changed along with the distribution of grade (Figure).
b. We also subtracted the 2014 block model from the 2012 block model to better visualize the portions that have not been retained in the new model. There are several lateral extensions and smaller parallel structures that have not transitioned into the 2014 block model (Figure ). The inferred resources are more strongly affected, however we see a local veneer of 2012 indicated resource that were excluded from the updated model.
c. The result of the refinement in structures for Thunder Creek has had a net negative effect on the tonnage and ounces. LSG and SGS feel that the difference is in part due to 2012 inferred resources having a relatively high geological risk; additionally, somewhat stricter modelling guidelines applied in 2014 has caused losses (mining constraints are considered at the early stage). The second point should translate into a more efficient transition from resources to reserves.
5. The Thunder Creek block model was reinterpolated using ordinary kriging and inverse distance squared methods. The results were as expected: same tonnage and grade before applying a cut-off grade, and slightly lower grade but higher tonnage after application of a 1.5g/t cutoff for the kriging model.
| SGS Canada Inc. - Geostat | 
|
2
6. Grade tonnage curves were created for both deposits to see whether there were any critical grades at which application of a cut-off grade onto the block models would have an unduly strong impact. The curves were relatively linear.
7. A methodology developed by SGS Geostat (kriging of irregular solids) was used to evaluate the relative error on grade estimation within a sample of 12 mining stopes. Results showed that the relative error varied between 0.8g/t and 3g/t for a 95% confidence interval, and was strongly linked to the size of stope (smaller stopes have a higher error). We then estimated the probability that each stope was in reality below the cut-off grade; only two examples had a higher probability than 3% (lower grade smaller stopes). These result are not surprising given the nature of gold mineralization.
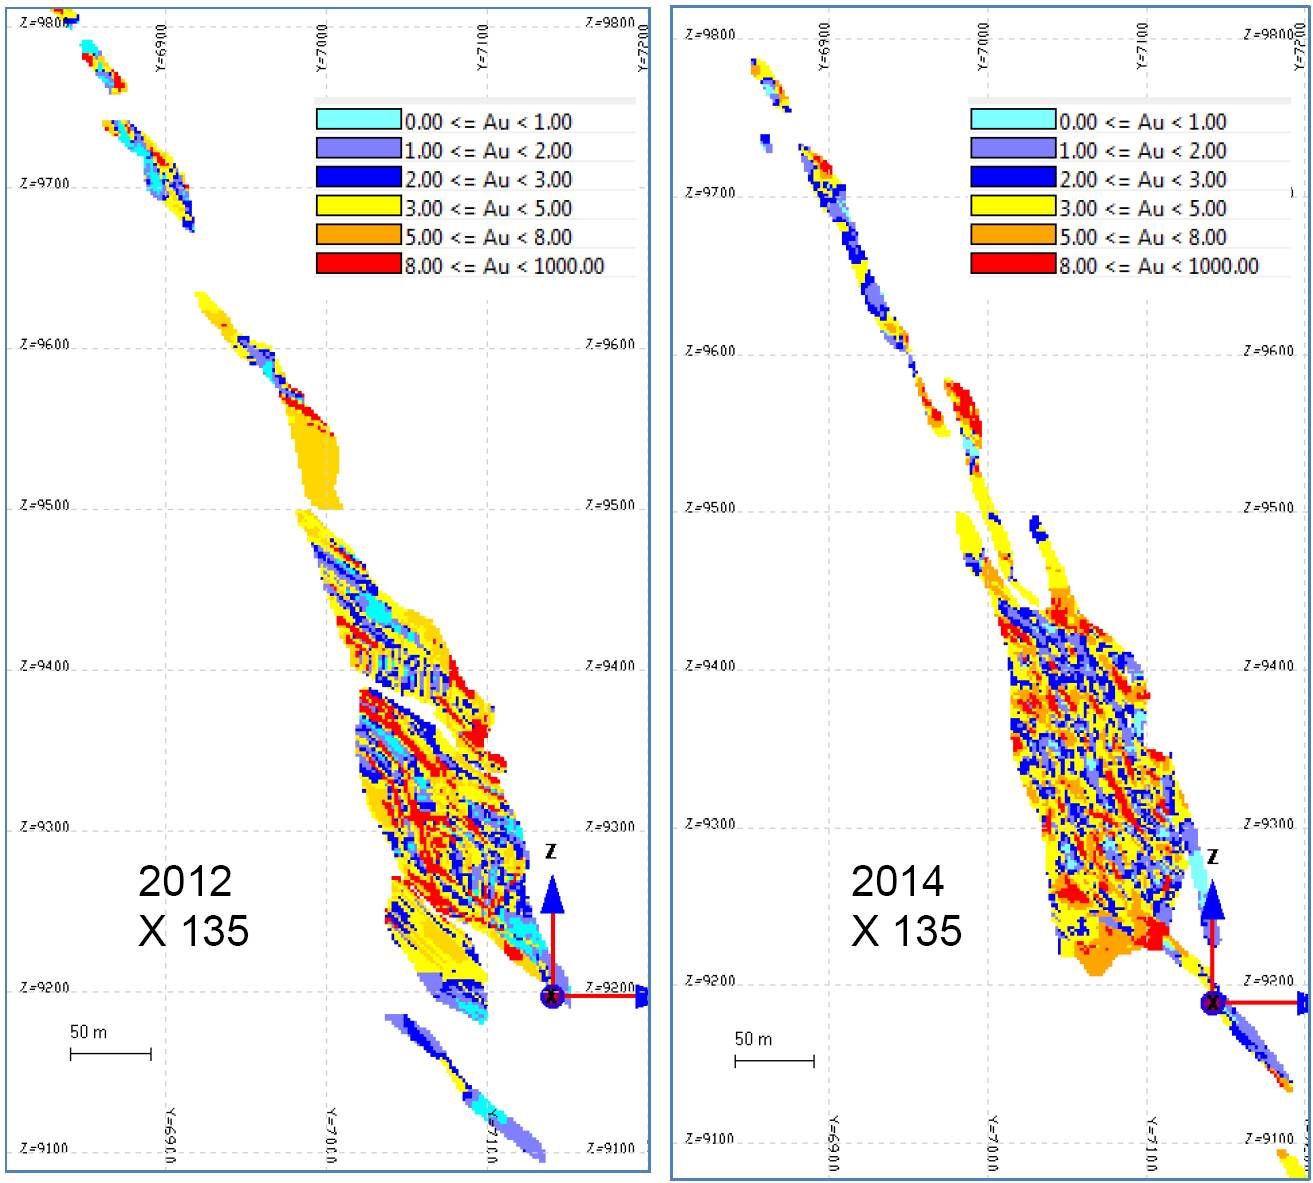
Figure1. Cross section through core of the Thunder Creek deposit showing block grade and geometric changes between the 2012 model (left) and 2014 model (right).
3
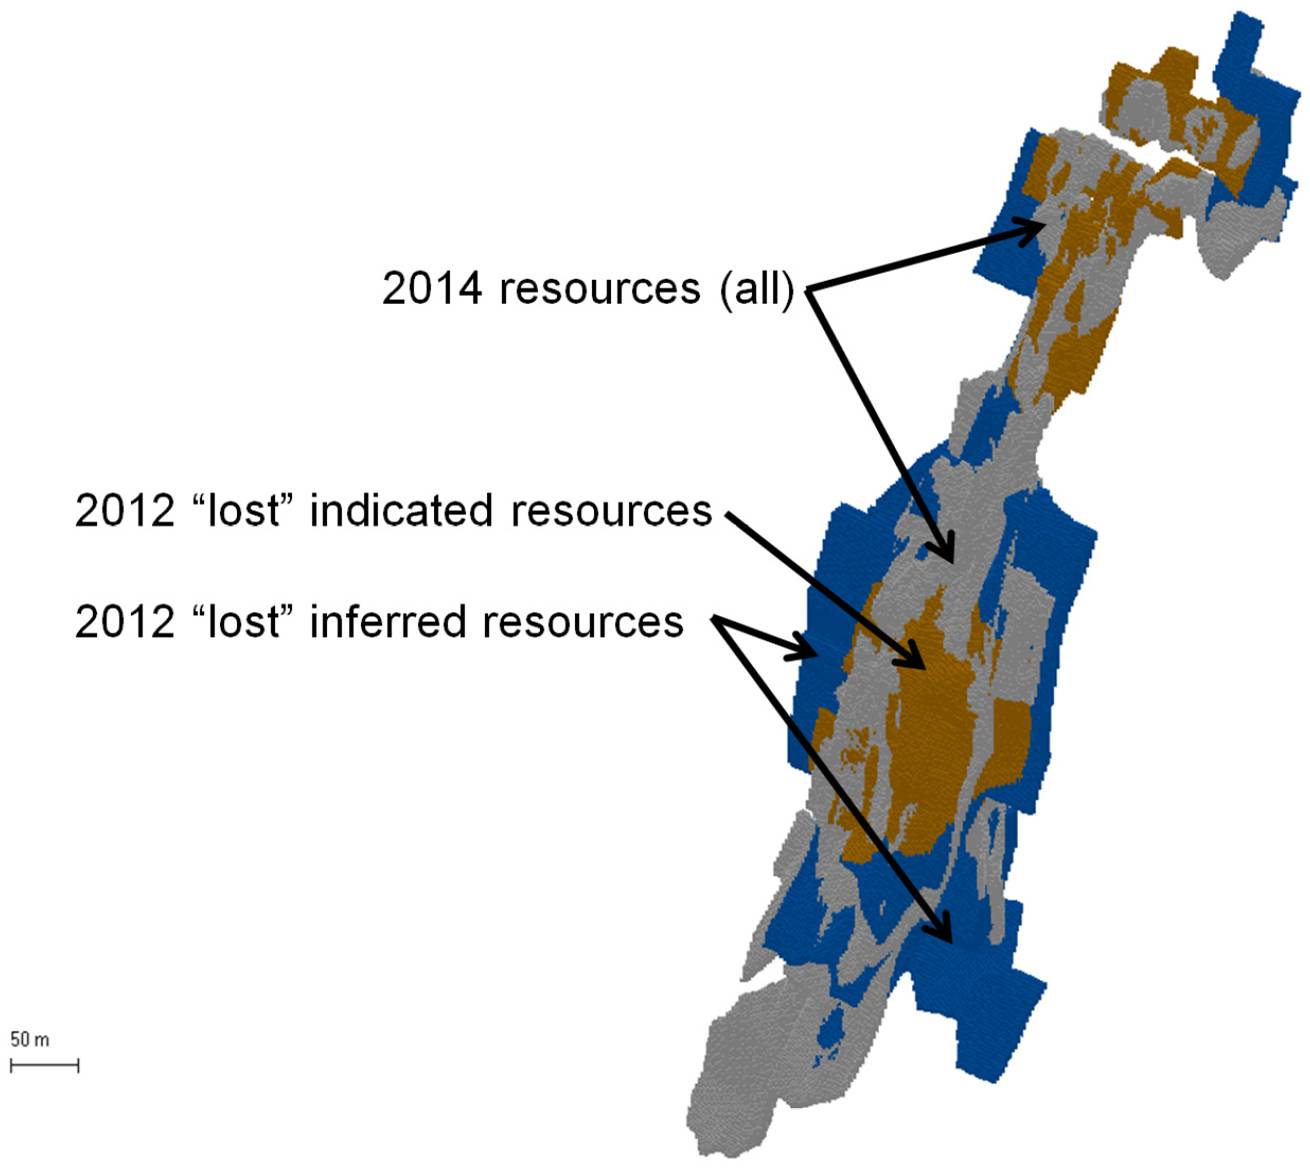
Figure 2. Oblique image of block model showing 2014 block model in grey and the blocks of 2012 indicated resources in gold (mainly as a veneer where we see it) and 2012 inferred resources in blue.
Note that 2014 resources are underrepresented in this image because they are in places hidden by the 2012 blocks.
4
APPENDIX 3
UNDERGROUND PHOTOS OF THE TIMMINS WEST MINE MINERALIZATION AT THUNDER CREEK AND TIMMINS DEPOSITS
The following photos and commentary have been provided courtesy of Mr. David Rhys from a PowerPoint presentation titled “Lake Shore Gold Thunder Creek Zones: Mineralization, Setting and Style in the Rusk and Porphyry Zones” (Rhys, 2011). The various styles of mineralization are represented in this suite of underground pictures from Rusk and Porphyry styles of the Thunder Creek deposit (Plates 1-6) and the Vein and Ultramafic hosted extensional vein arrays of the Timmins deposit (Plates 7-11).
Plate 1:
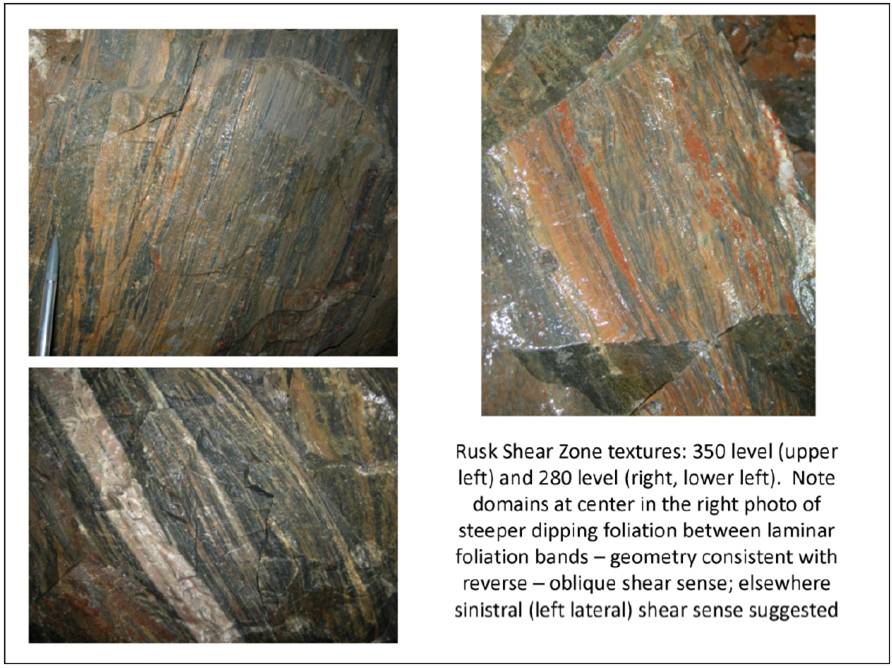
Plate 2:
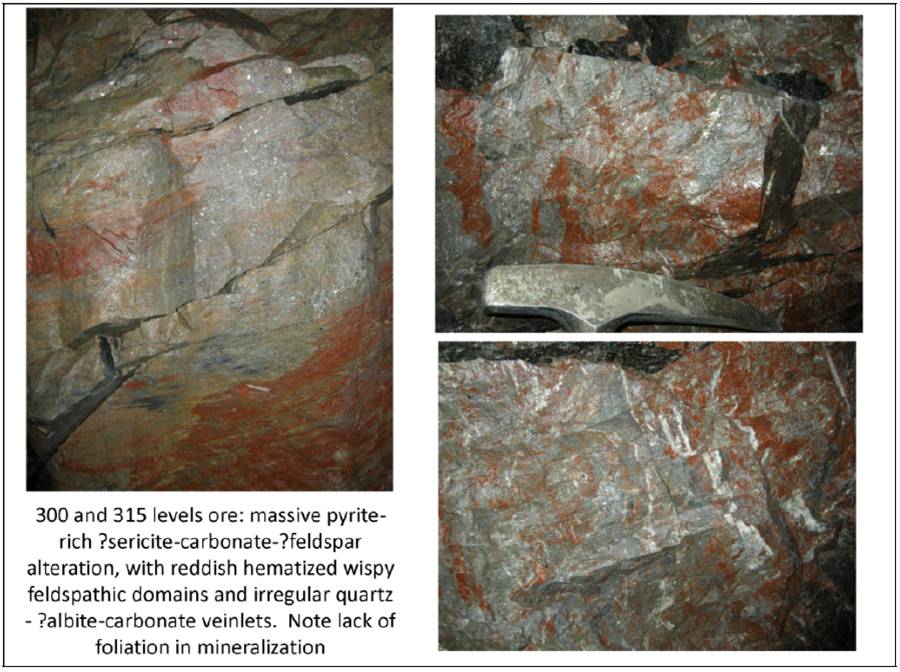
Plate 3:
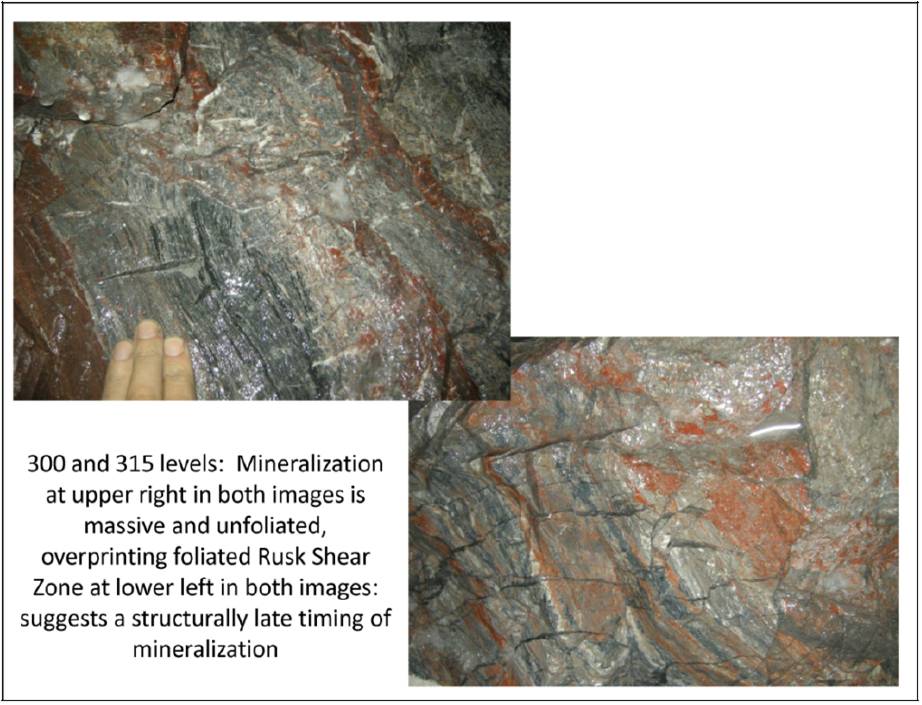
Plate 4:
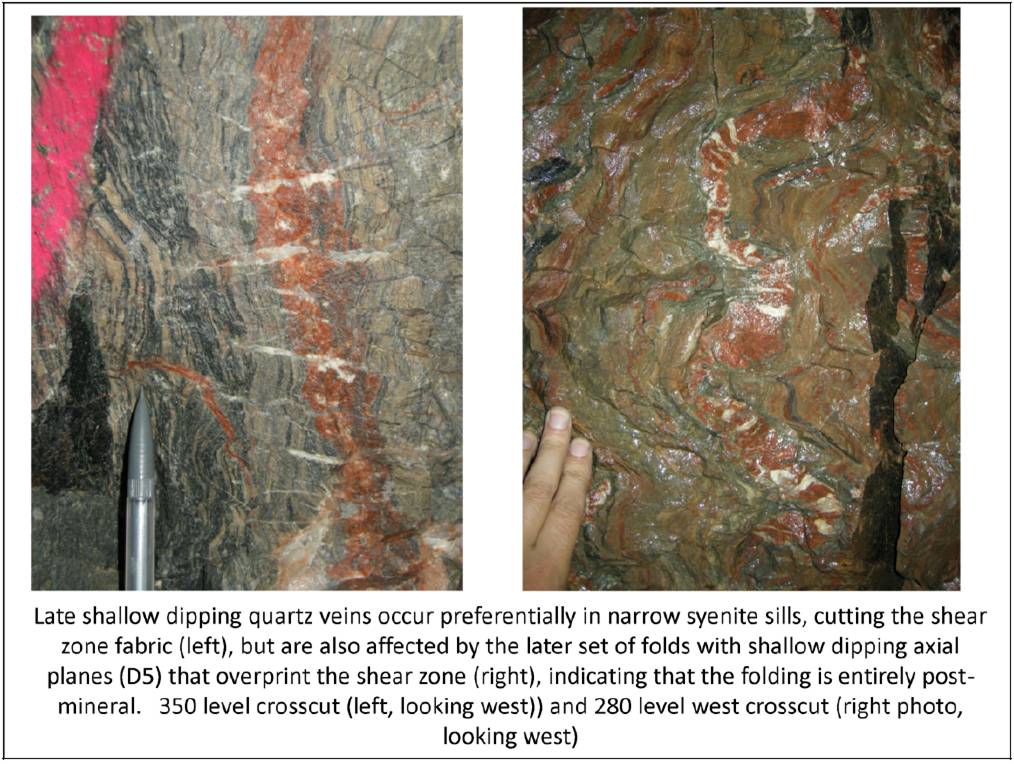
Plate 5:

Plate 6:
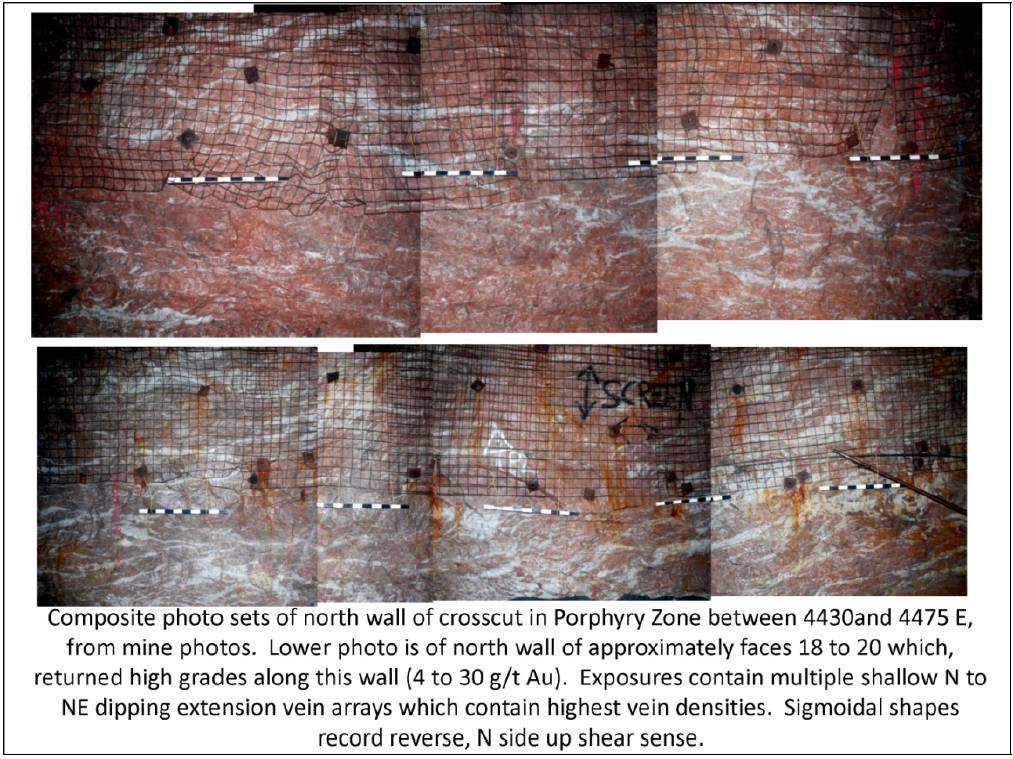
Plate 7:

Plate 8:
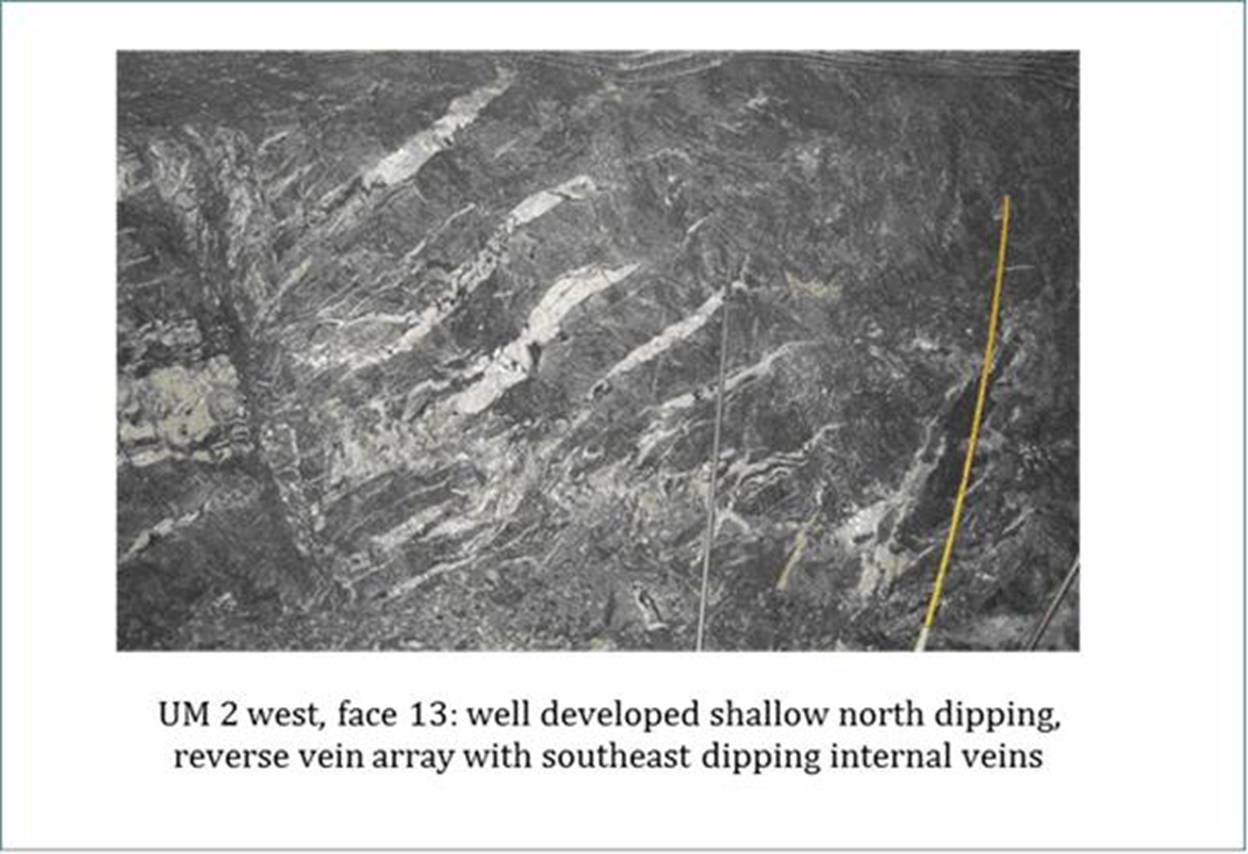
Plate 9:
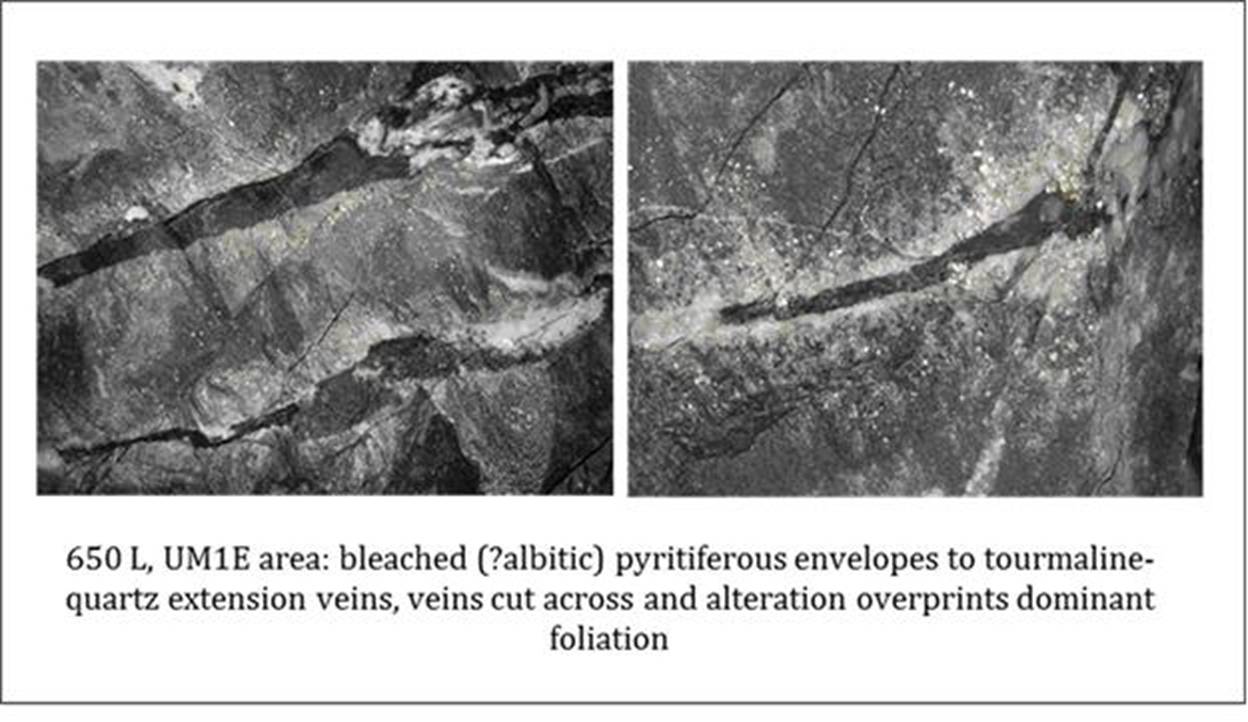
Plate 10:
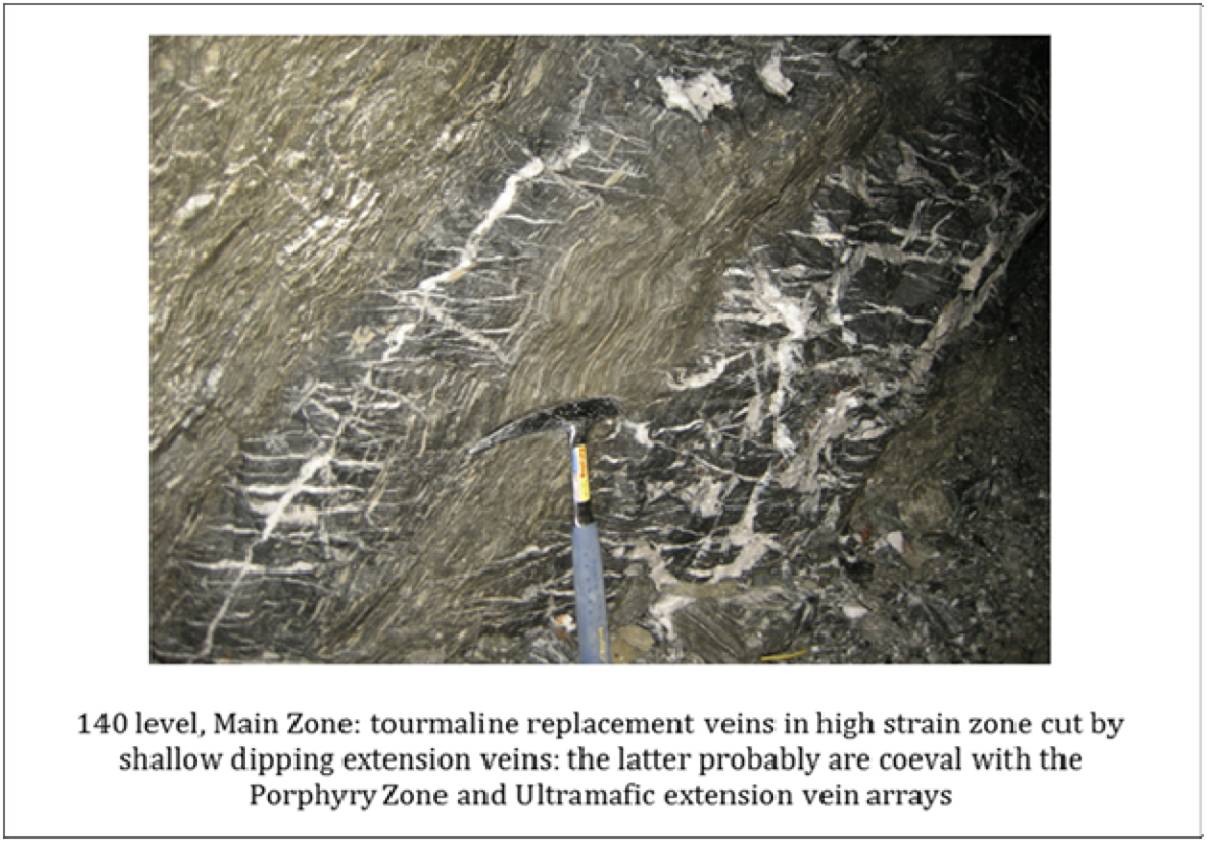
Plate 11:
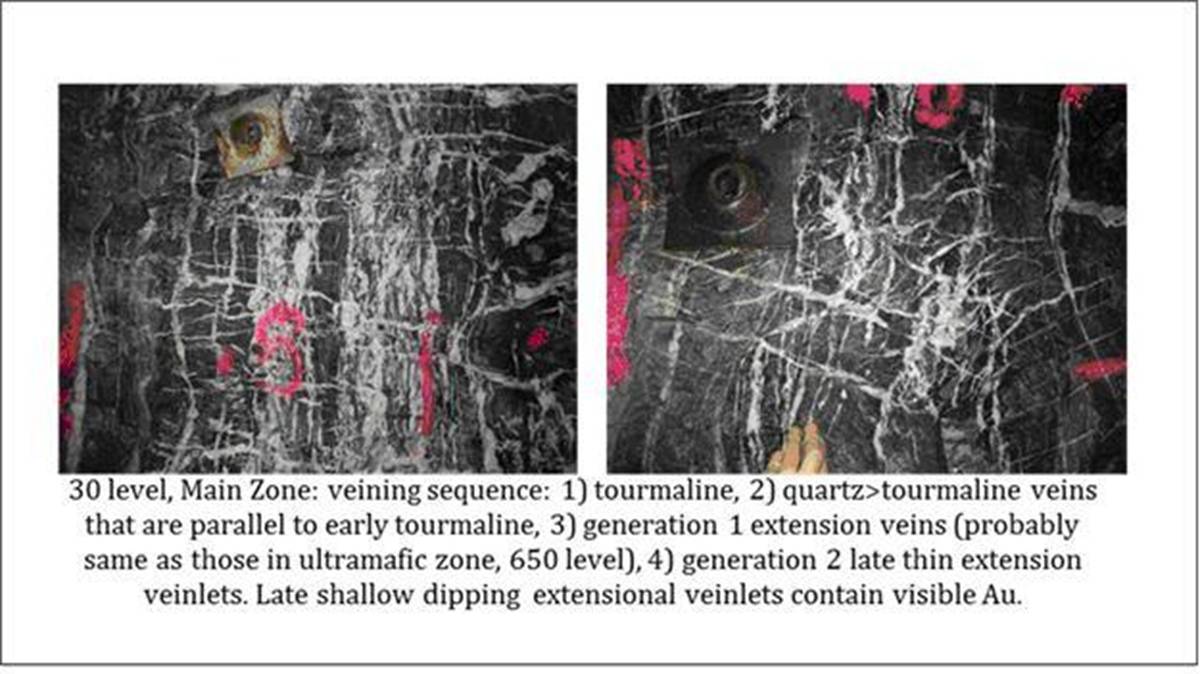
(photos are courtesy of Mr. David Rhys, August 2011)