Exhibit 99.1
| PERFORMANCE CASH FLOW GROWTH 2014 ANNUAL REPORT LAKE SHORE GOLD CORP. |
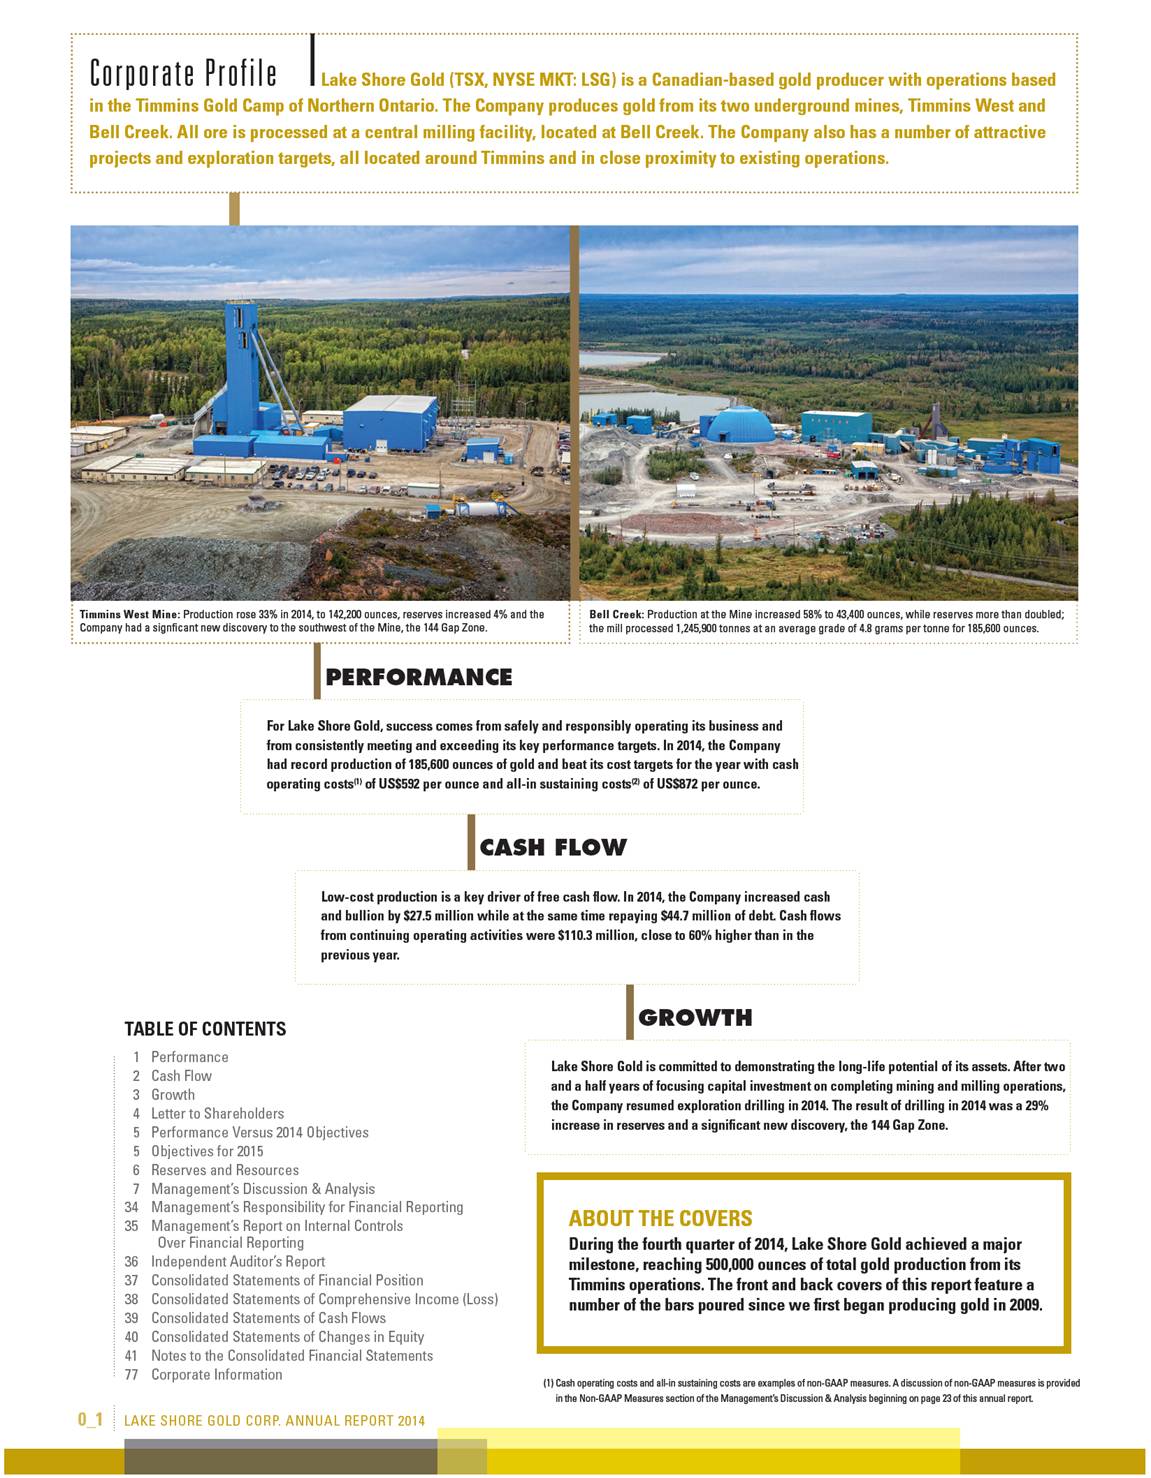
| LAKE SHORE GOLD CORP. ANNUAL REPORT 2014 TABLE OF CONTENTS 1 Performance 2 Cash Flow 3 Growth 4 Letter to Shareholders 5 Performance Versus 2014 Objectives 5 Objectives for 2015 6 Reserves and Resources 7 Management’s Discussion & Analysis 34 Management’s Responsibility for Financial Reporting 35 Management’s Report on Internal Controls Over Financial Reporting 36 Independent Auditor’s Report 37 Consolidated Statements of Financial Position 38 Consolidated Statements of Comprehensive Income (Loss) 39 Consolidated Statements of Cash Flows 40 Consolidated Statements of Changes in Equity 41 Notes to the Consolidated Financial Statements 77 Corporate Information PERFORMANCE CASH FLOW GROWTH Low-cost production is a key driver of free cash flow. In 2014, the Company increased cash and bullion by $27.5 million while at the same time repaying $44.7 million of debt. Cash flows from continuing operating activities were $110.3 million, close to 60% higher than in the previous year. Lake Shore Gold is committed to demonstrating the long-life potential of its assets. After two and a half years of focusing capital investment on completing mining and milling operations, the Company resumed exploration drilling in 2014. The result of drilling in 2014 was a 29% increase in reserves and a significant new discovery, the 144 Gap Zone. For Lake Shore Gold, success comes from safely and responsibly operating its business and from consistently meeting and exceeding its key performance targets. In 2014, the Company had record production of 185,600 ounces of gold and beat its cost targets for the year with cash operating costs(1) of US$592 per ounce and all-in sustaining costs(2) of US$872 per ounce. Corporate Profile Lake Shore Gold (TSX, NYSE MKT: LSG) is a Canadian-based gold producer with operations based in the Timmins Gold Camp of Northern Ontario. The Company produces gold from its two underground mines, Timmins West and Bell Creek. All ore is processed at a central milling facility, located at Bell Creek. The Company also has a number of attractive projects and exploration targets, all located around Timmins and in close proximity to existing operations. 0_1 Timmins West Mine: Production rose 33% in 2014, to 142,200 ounces, reserves increased 4% and the Company had a signficant new discovery to the southwest of the Mine, the 144 Gap Zone. ABOUT THE COVERS During the fourth quarter of 2014, Lake Shore Gold achieved a major milestone, reaching 500,000 ounces of total gold production from its Timmins operations. The front and back covers of this report feature a number of the bars poured since we first began producing gold in 2009. Bell Creek: Production at the Mine increased 58% to 43,400 ounces, while reserves more than doubled; the mill processed 1,245,900 tonnes at an average grade of 4.8 grams per tonne for 185,600 ounces. (1) Cash operating costs and all-in sustaining costs are examples of non-GAAP measures. A discussion of non-GAAP measures is provided in the Non-GAAP Measures section of the Management’s Discussion & Analysis beginning on page 23 of this annual report. |
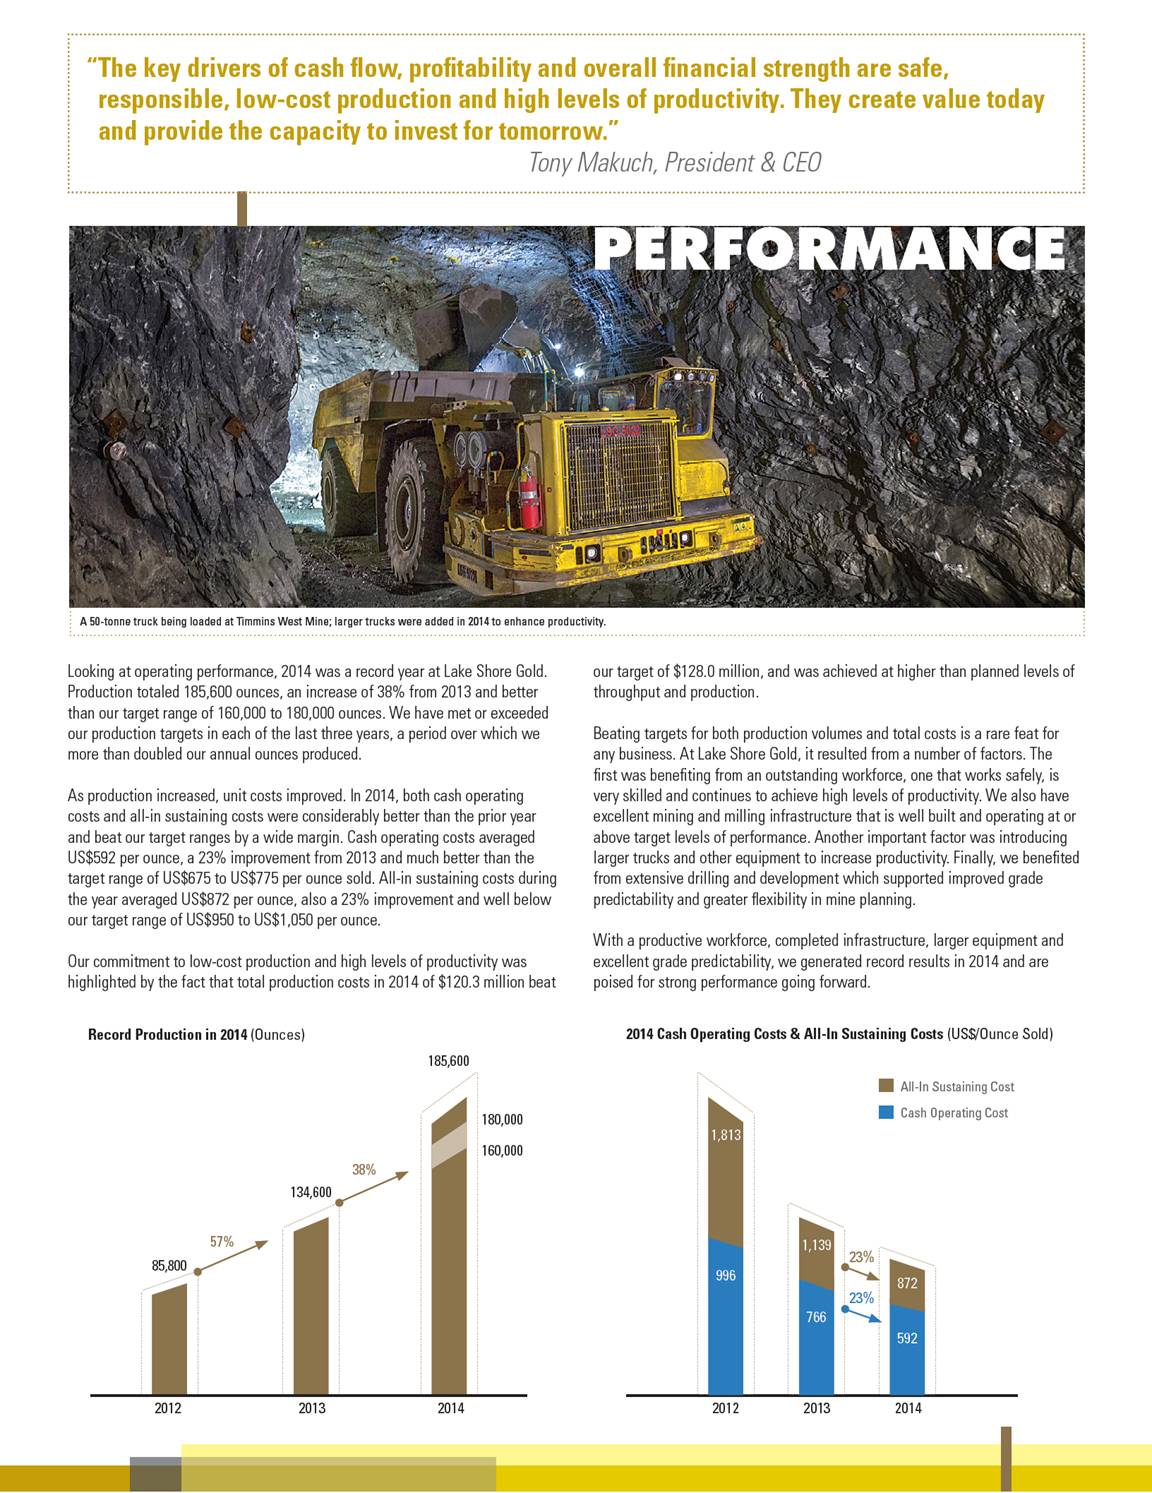
| A 50-tonne truck being loaded at Timmins West Mine; larger trucks were added in 2014 to enhance productivity. PERFORMANCE “ The key drivers of cash flow, profitability and overall financial strength are safe, responsible, low-cost production and high levels of productivity. They create value today and provide the capacity to invest for tomorrow.” Tony Makuch, President & CEO Looking at operating performance, 2014 was a record year at Lake Shore Gold. Production totaled 185,600 ounces, an increase of 38% from 2013 and better than our target range of 160,000 to 180,000 ounces. We have met or exceeded our production targets in each of the last three years, a period over which we more than doubled our annual ounces produced. As production increased, unit costs improved. In 2014, both cash operating costs and all-in sustaining costs were considerably better than the prior year and beat our target ranges by a wide margin. Cash operating costs averaged US$592 per ounce, a 23% improvement from 2013 and much better than the target range of US$675 to US$775 per ounce sold. All-in sustaining costs during the year averaged US$872 per ounce, also a 23% improvement and well below our target range of US$950 to US$1,050 per ounce. Our commitment to low-cost production and high levels of productivity was highlighted by the fact that total production costs in 2014 of $120.3 million beat our target of $128.0 million, and was achieved at higher than planned levels of throughput and production. Beating targets for both production volumes and total costs is a rare feat for any business. At Lake Shore Gold, it resulted from a number of factors. The first was benefiting from an outstanding workforce, one that works safely, is very skilled and continues to achieve high levels of productivity. We also have excellent mining and milling infrastructure that is well built and operating at or above target levels of performance. Another important factor was introducing larger trucks and other equipment to increase productivity. Finally, we benefited from extensive drilling and development which supported improved grade predictability and greater flexibility in mine planning. With a productive workforce, completed infrastructure, larger equipment and excellent grade predictability, we generated record results in 2014 and are poised for strong performance going forward. 2014 Cash Operating Costs & All-In Sustaining Costs (US$/Ounce Sold) All-In Sustaining Cost Cash Operating Cost 1,813 1,139 23% 23% 766 592 872 996 2012 2013 2014 Record Production in 2014 (Ounces) 85,800 134,600 38% 57% 185,600 180,000 160,000 2012 2013 2014 |
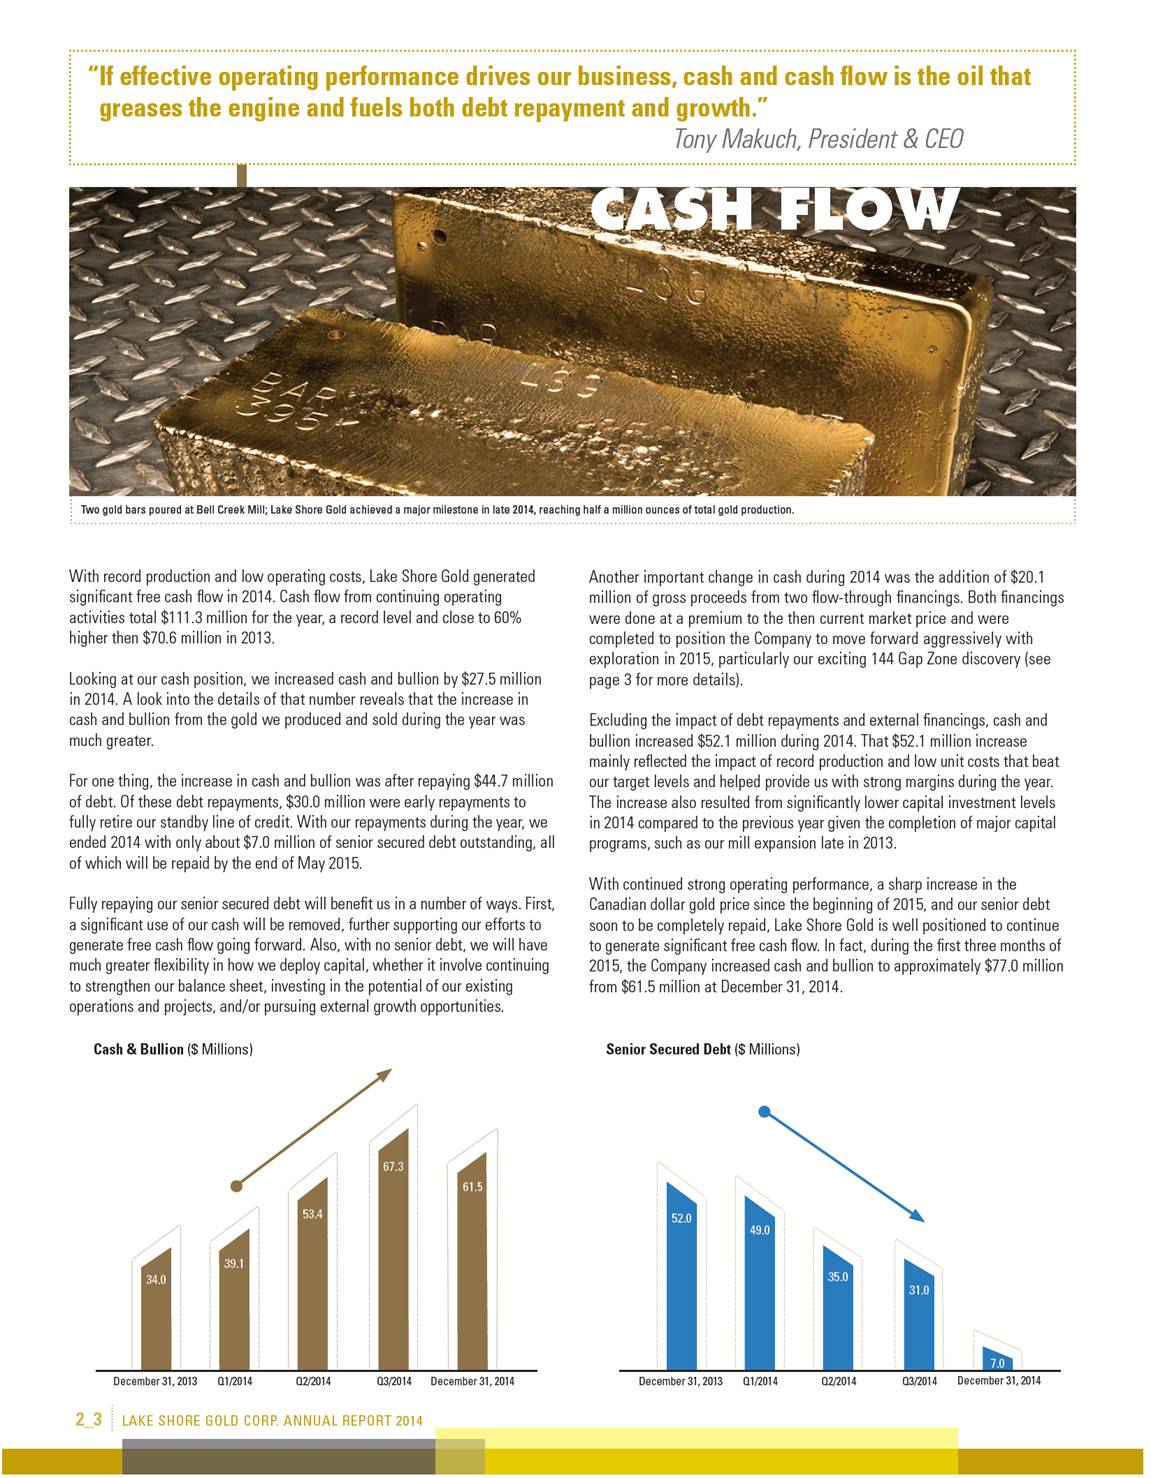
| LAKE SHORE GOLD CORP. ANNUAL REPORT 2014 Two gold bars poured at Bell Creek Mill; Lake Shore Gold achieved a major milestone in late 2014, reaching half a million ounces of total gold production. With record production and low operating costs, Lake Shore Gold generated significant free cash flow in 2014. Cash flow from continuing operating activities total $111.3 million for the year, a record level and close to 60% higher then $70.6 million in 2013. Looking at our cash position, we increased cash and bullion by $27.5 million in 2014. A look into the details of that number reveals that the increase in cash and bullion from the gold we produced and sold during the year was much greater. For one thing, the increase in cash and bullion was after repaying $44.7 million of debt. Of these debt repayments, $30.0 million were early repayments to fully retire our standby line of credit. With our repayments during the year, we ended 2014 with only about $7.0 million of senior secured debt outstanding, all of which will be repaid by the end of May 2015. Fully repaying our senior secured debt will benefit us in a number of ways. First, a significant use of our cash will be removed, further supporting our efforts to generate free cash flow going forward. Also, with no senior debt, we will have much greater flexibility in how we deploy capital, whether it involve continuing to strengthen our balance sheet, investing in the potential of our existing operations and projects, and/or pursuing external growth opportunities. Another important change in cash during 2014 was the addition of $20.1 million of gross proceeds from two flow-through financings. Both financings were done at a premium to the then current market price and were completed to position the Company to move forward aggressively with exploration in 2015, particularly our exciting 144 Gap Zone discovery (see page 3 for more details). Excluding the impact of debt repayments and external financings, cash and bullion increased $52.1 million during 2014. That $52.1 million increase mainly reflected the impact of record production and low unit costs that beat our target levels and helped provide us with strong margins during the year. The increase also resulted from significantly lower capital investment levels in 2014 compared to the previous year given the completion of major capital programs, such as our mill expansion late in 2013. With continued strong operating performance, a sharp increase in the Canadian dollar gold price since the beginning of 2015, and our senior debt soon to be completely repaid, Lake Shore Gold is well positioned to continue to generate significant free cash flow. In fact, during the first three months of 2015, the Company increased cash and bullion to approximately $77.0 million from $61.5 million at December 31, 2014. “ If effective operating performance drives our business, cash and cash flow is the oil that greases the engine and fuels both debt repayment and growth.” Tony Makuch, President & CEO CASH FLOW 2_3 Cash & Bullion ($ Millions) December 31, 2013 Q1/2014 Q3/2014 Q2/2014 December 31, 2014 39.1 53.4 67.3 61.5 34.0 Senior Secured Debt ($ Millions) 49.0 35.0 31.0 7.0 52.0 December 31, 2013 Q1/2014 Q3/2014 Q2/2014 December 31, 2014 |
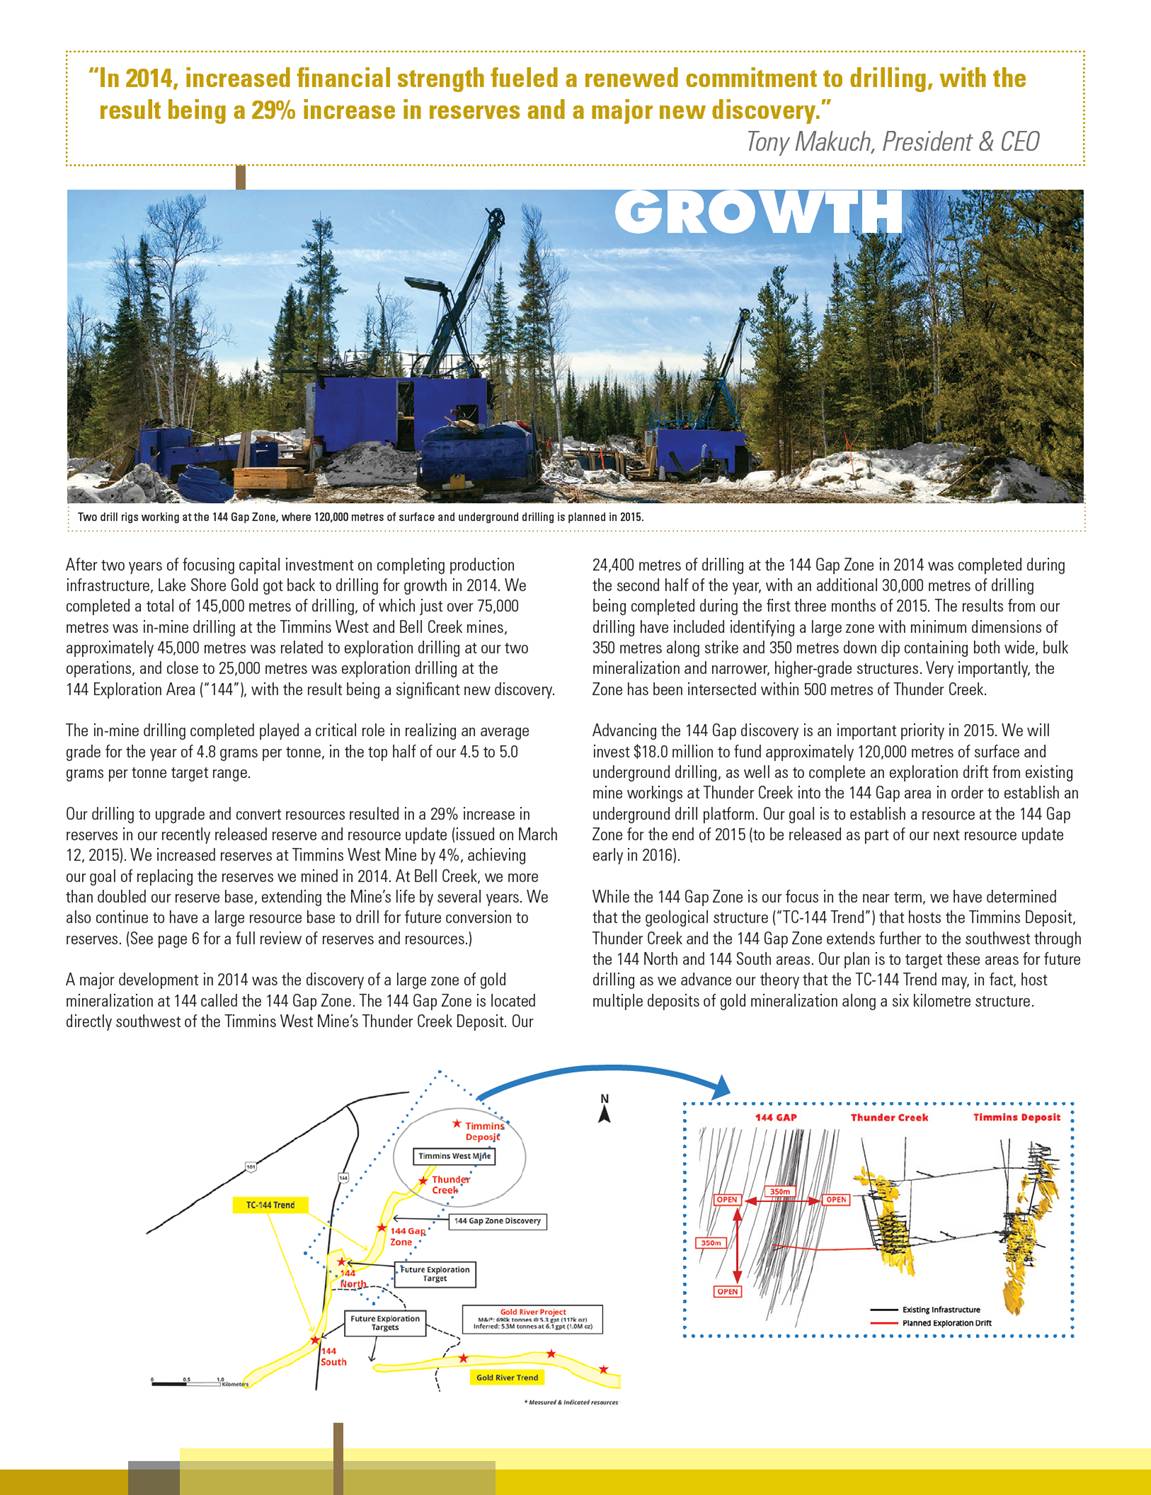
| Two drill rigs working at the 144 Gap Zone, where 120,000 metres of surface and underground drilling is planned in 2015. GROWTH After two years of focusing capital investment on completing production infrastructure, Lake Shore Gold got back to drilling for growth in 2014. We completed a total of 145,000 metres of drilling, of which just over 75,000 metres was in-mine drilling at the Timmins West and Bell Creek mines, approximately 45,000 metres was related to exploration drilling at our two operations, and close to 25,000 metres was exploration drilling at the 144 Exploration Area (“144”), with the result being a significant new discovery. The in-mine drilling completed played a critical role in realizing an average grade for the year of 4.8 grams per tonne, in the top half of our 4.5 to 5.0 grams per tonne target range. Our drilling to upgrade and convert resources resulted in a 29% increase in reserves in our recently released reserve and resource update (issued on March 12, 2015). We increased reserves at Timmins West Mine by 4%, achieving our goal of replacing the reserves we mined in 2014. At Bell Creek, we more than doubled our reserve base, extending the Mine’s life by several years. We also continue to have a large resource base to drill for future conversion to reserves. (See page 6 for a full review of reserves and resources.) A major development in 2014 was the discovery of a large zone of gold mineralization at 144 called the 144 Gap Zone. The 144 Gap Zone is located directly southwest of the Timmins West Mine’s Thunder Creek Deposit. Our 24,400 metres of drilling at the 144 Gap Zone in 2014 was completed during the second half of the year, with an additional 30,000 metres of drilling being completed during the first three months of 2015. The results from our drilling have included identifying a large zone with minimum dimensions of 350 metres along strike and 350 metres down dip containing both wide, bulk mineralization and narrower, higher-grade structures. Very importantly, the Zone has been intersected within 500 metres of Thunder Creek. Advancing the 144 Gap discovery is an important priority in 2015. We will invest $18.0 million to fund approximately 120,000 metres of surface and underground drilling, as well as to complete an exploration drift from existing mine workings at Thunder Creek into the 144 Gap area in order to establish an underground drill platform. Our goal is to establish a resource at the 144 Gap Zone for the end of 2015 (to be released as part of our next resource update early in 2016). While the 144 Gap Zone is our focus in the near term, we have determined that the geological structure (“TC-144 Trend”) that hosts the Timmins Deposit, Thunder Creek and the 144 Gap Zone extends further to the southwest through the 144 North and 144 South areas. Our plan is to target these areas for future drilling as we advance our theory that the TC-144 Trend may, in fact, host multiple deposits of gold mineralization along a six kilometre structure. “ In 2014, increased financial strength fueled a renewed commitment to drilling, with the result being a 29% increase in reserves and a major new discovery.” Tony Makuch, President & CEO |
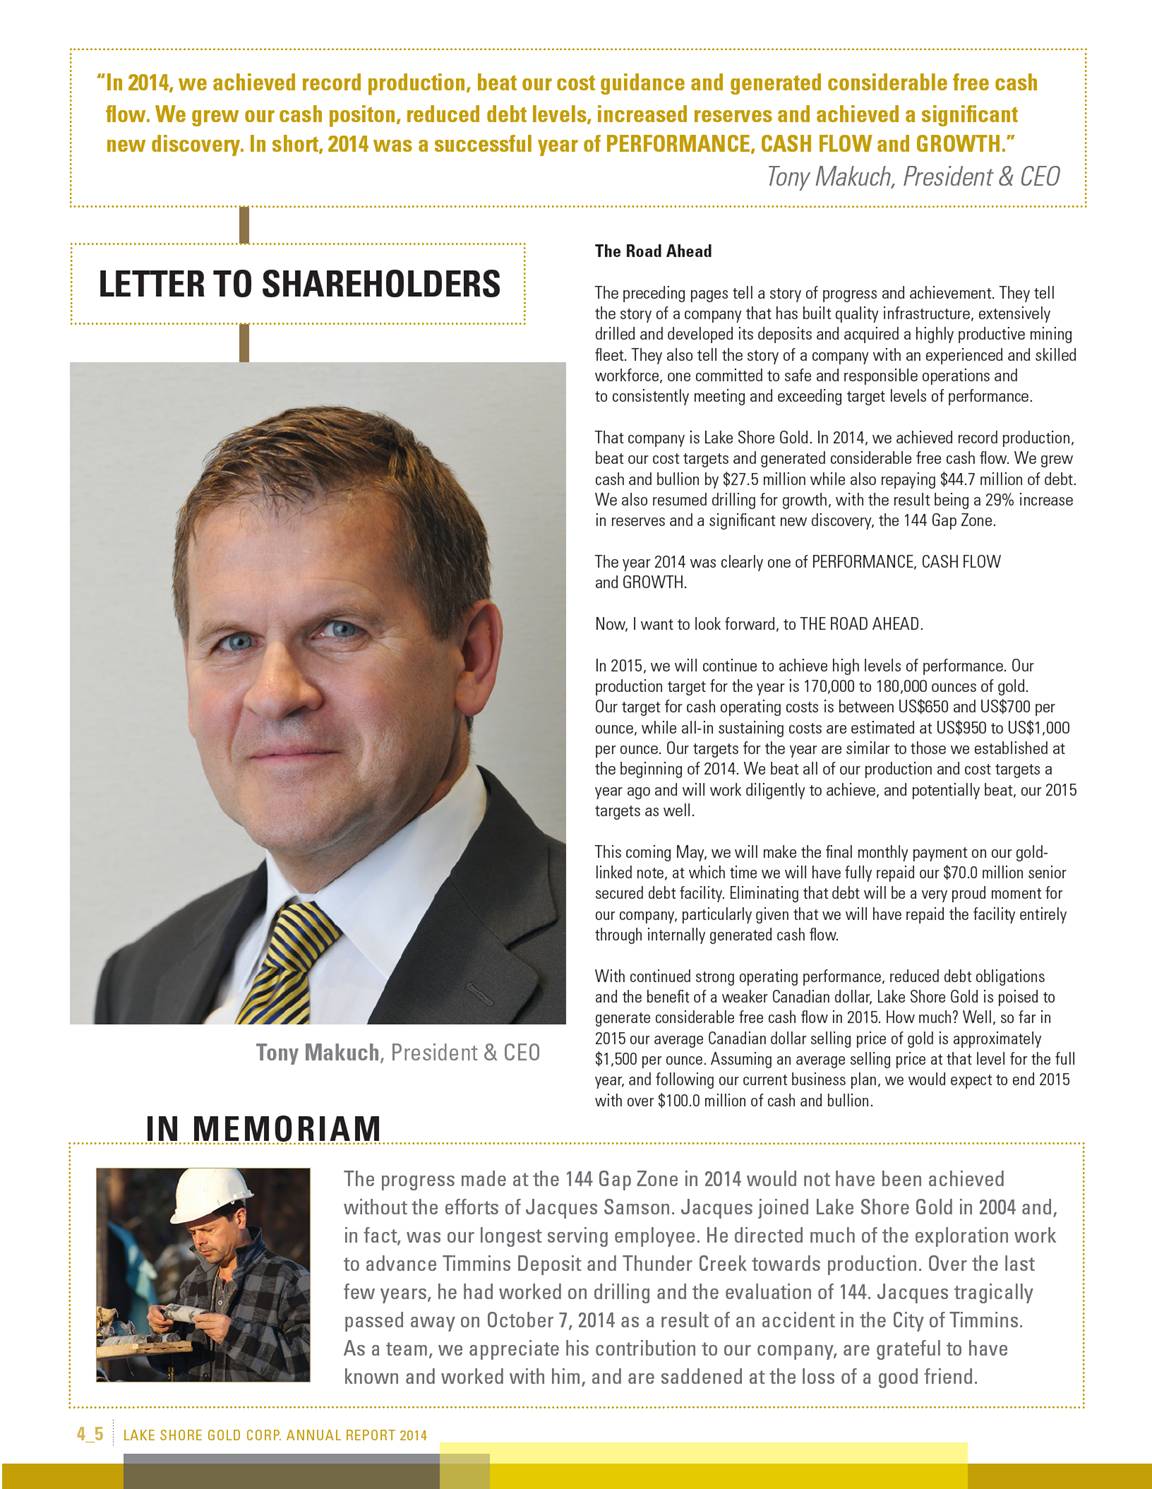
| LAKE SHORE GOLD CORP. ANNUAL REPORT 2014 The Road Ahead The preceding pages tell a story of progress and achievement. They tell the story of a company that has built quality infrastructure, extensively drilled and developed its deposits and acquired a highly productive mining fleet. They also tell the story of a company with an experienced and skilled workforce, one committed to safe and responsible operations and to consistently meeting and exceeding target levels of performance. That company is Lake Shore Gold. In 2014, we achieved record production, beat our cost targets and generated considerable free cash flow. We grew cash and bullion by $27.5 million while also repaying $44.7 million of debt. We also resumed drilling for growth, with the result being a 29% increase in reserves and a significant new discovery, the 144 Gap Zone. The year 2014 was clearly one of PERFORMANCE, CASH FLOW and GROWTH. Now, I want to look forward, to THE ROAD AHEAD. In 2015, we will continue to achieve high levels of performance. Our production target for the year is 170,000 to 180,000 ounces of gold. Our target for cash operating costs is between US$650 and US$700 per ounce, while all-in sustaining costs are estimated at US$950 to US$1,000 per ounce. Our targets for the year are similar to those we established at the beginning of 2014. We beat all of our production and cost targets a year ago and will work diligently to achieve, and potentially beat, our 2015 targets as well. This coming May, we will make the final monthly payment on our goldlinked note, at which time we will have fully repaid our $70.0 million senior secured debt facility. Eliminating that debt will be a very proud moment for our company, particularly given that we will have repaid the facility entirely through internally generated cash flow. With continued strong operating performance, reduced debt obligations and the benefit of a weaker Canadian dollar, Lake Shore Gold is poised to generate considerable free cash flow in 2015. How much? Well, so far in 2015 our average Canadian dollar selling price of gold is approximately $1,500 per ounce. Assuming an average selling price at that level for the full year, and following our current business plan, we would expect to end 2015 with over $100.0 million of cash and bullion. Tony Makuch, President & CEO “ In 2014, we achieved record production, beat our cost guidance and generated considerable free cash flow. We grew our cash positon, reduced debt levels, increased reserves and achieved a significant new discovery. In short, 2014 was a successful year of PERFORMANCE, CASH FLOW and GROWTH.” Tony Makuch, President & CEO 4_5 The progress made at the 144 Gap Zone in 2014 would not have been achieved without the efforts of Jacques Samson. Jacques joined Lake Shore Gold in 2004 and, in fact, was our longest serving employee. He directed much of the exploration work to advance Timmins Deposit and Thunder Creek towards production. Over the last few years, he had worked on drilling and the evaluation of 144. Jacques tragically passed away on October 7, 2014 as a result of an accident in the City of Timmins. As a team, we appreciate his contribution to our company, are grateful to have known and worked with him, and are saddened at the loss of a good friend. IN MEMORIAM LETTER TO SHAREHOLDERS |
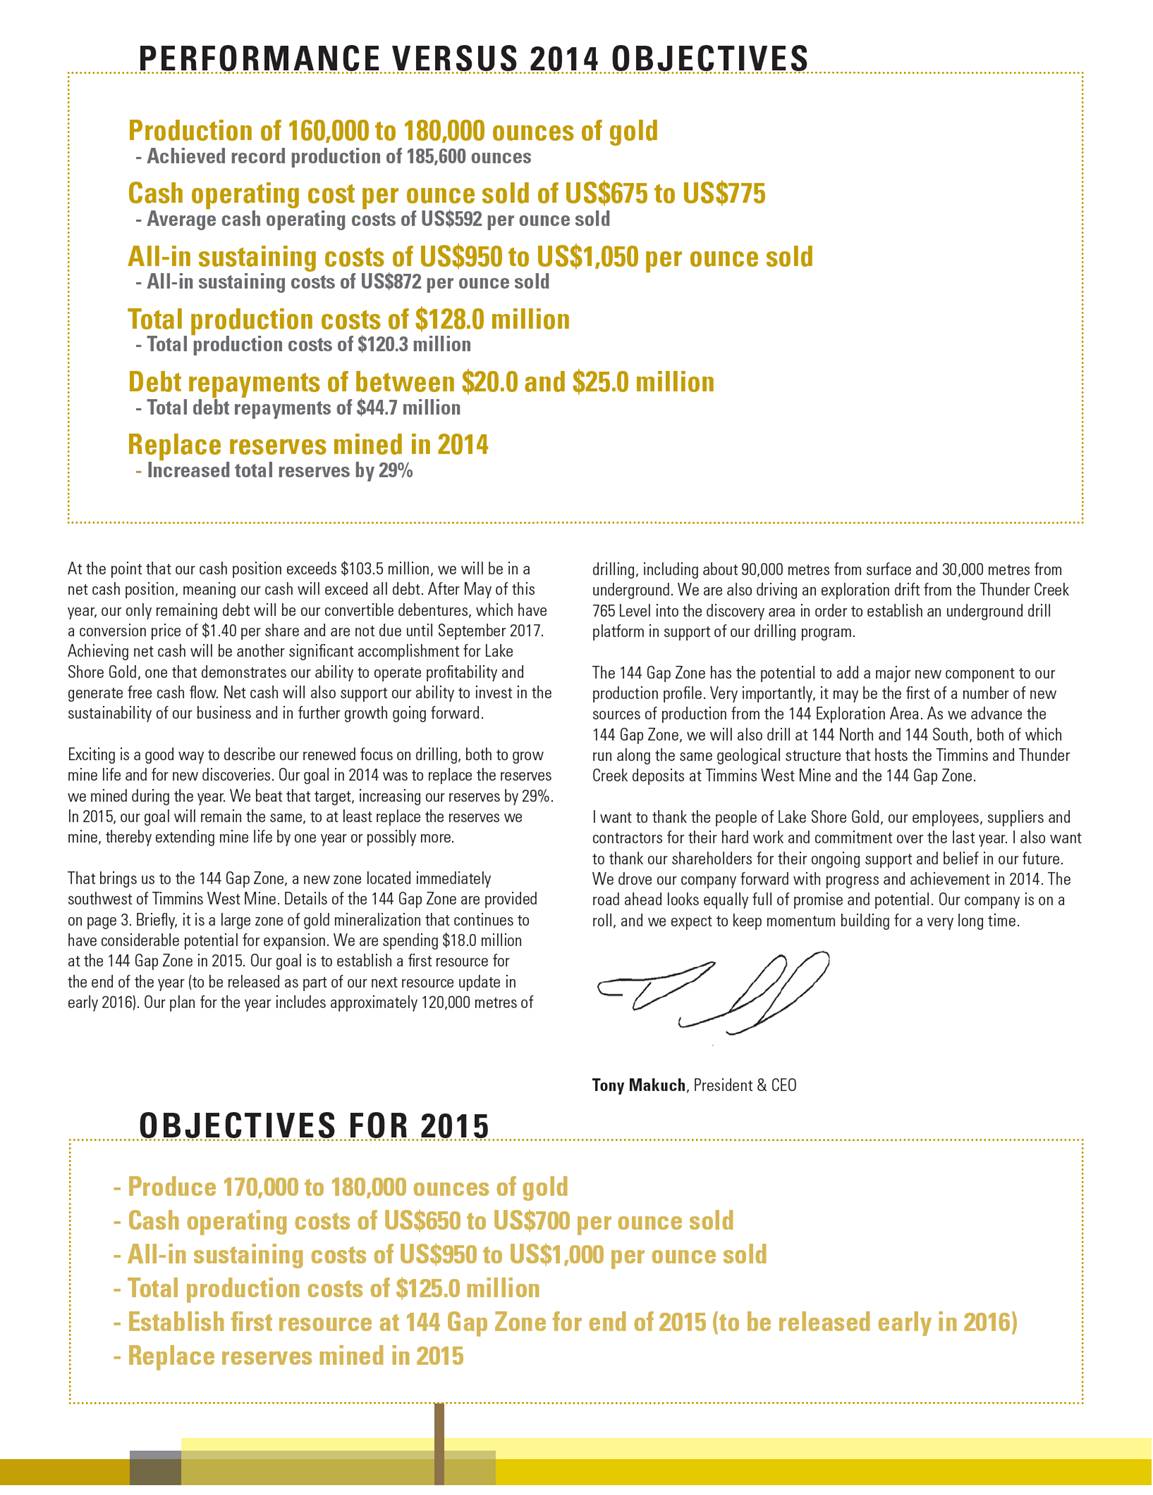
| Production of 160,000 to 180,000 ounces of gold - Achieved record production of 185,600 ounces Cash operating cost per ounce sold of US$675 to US$775 - Average cash operating costs of US$592 per ounce sold All-in sustaining costs of US$950 to US$1,050 per ounce sold - All-in sustaining costs of US$872 per ounce sold Total production costs of $128.0 million - Total production costs of $120.3 million Debt repayments of between $20.0 and $25.0 million - Total debt repayments of $44.7 million Replace reserves mined in 2014 - Increased total reserves by 29% PERFORMANCE VERSUS 2014 OBJECTIVES At the point that our cash position exceeds $103.5 million, we will be in a net cash position, meaning our cash will exceed all debt. After May of this year, our only remaining debt will be our convertible debentures, which have a conversion price of $1.40 per share and are not due until September 2017. Achieving net cash will be another significant accomplishment for Lake Shore Gold, one that demonstrates our ability to operate profitability and generate free cash flow. Net cash will also support our ability to invest in the sustainability of our business and in further growth going forward. Exciting is a good way to describe our renewed focus on drilling, both to grow mine life and for new discoveries. Our goal in 2014 was to replace the reserves we mined during the year. We beat that target, increasing our reserves by 29%. In 2015, our goal will remain the same, to at least replace the reserves we mine, thereby extending mine life by one year or possibly more. That brings us to the 144 Gap Zone, a new zone located immediately southwest of Timmins West Mine. Details of the 144 Gap Zone are provided on page 3. Briefly, it is a large zone of gold mineralization that continues to have considerable potential for expansion. We are spending $18.0 million at the 144 Gap Zone in 2015. Our goal is to establish a first resource for the end of the year (to be released as part of our next resource update in early 2016). Our plan for the year includes approximately 120,000 metres of drilling, including about 90,000 metres from surface and 30,000 metres from underground. We are also driving an exploration drift from the Thunder Creek 765 Level into the discovery area in order to establish an underground drill platform in support of our drilling program. The 144 Gap Zone has the potential to add a major new component to our production profile. Very importantly, it may be the first of a number of new sources of production from the 144 Exploration Area. As we advance the 144 Gap Zone, we will also drill at 144 North and 144 South, both of which run along the same geological structure that hosts the Timmins and Thunder Creek deposits at Timmins West Mine and the 144 Gap Zone. I want to thank the people of Lake Shore Gold, our employees, suppliers and contractors for their hard work and commitment over the last year. I also want to thank our shareholders for their ongoing support and belief in our future. We drove our company forward with progress and achievement in 2014. The road ahead looks equally full of promise and potential. Our company is on a roll, and we expect to keep momentum building for a very long time. Tony Makuch, President & CEO - Produce 170,000 to 180,000 ounces of gold - Cash operating costs of US$650 to US$700 per ounce sold - All-in sustaining costs of US$950 to US$1,000 per ounce sold - Total production costs of $125.0 million - Establish first resource at 144 Gap Zone for end of 2015 (to be released early in 2016) - Replace reserves mined in 2015 OBJECTIVES FOR 2015 |
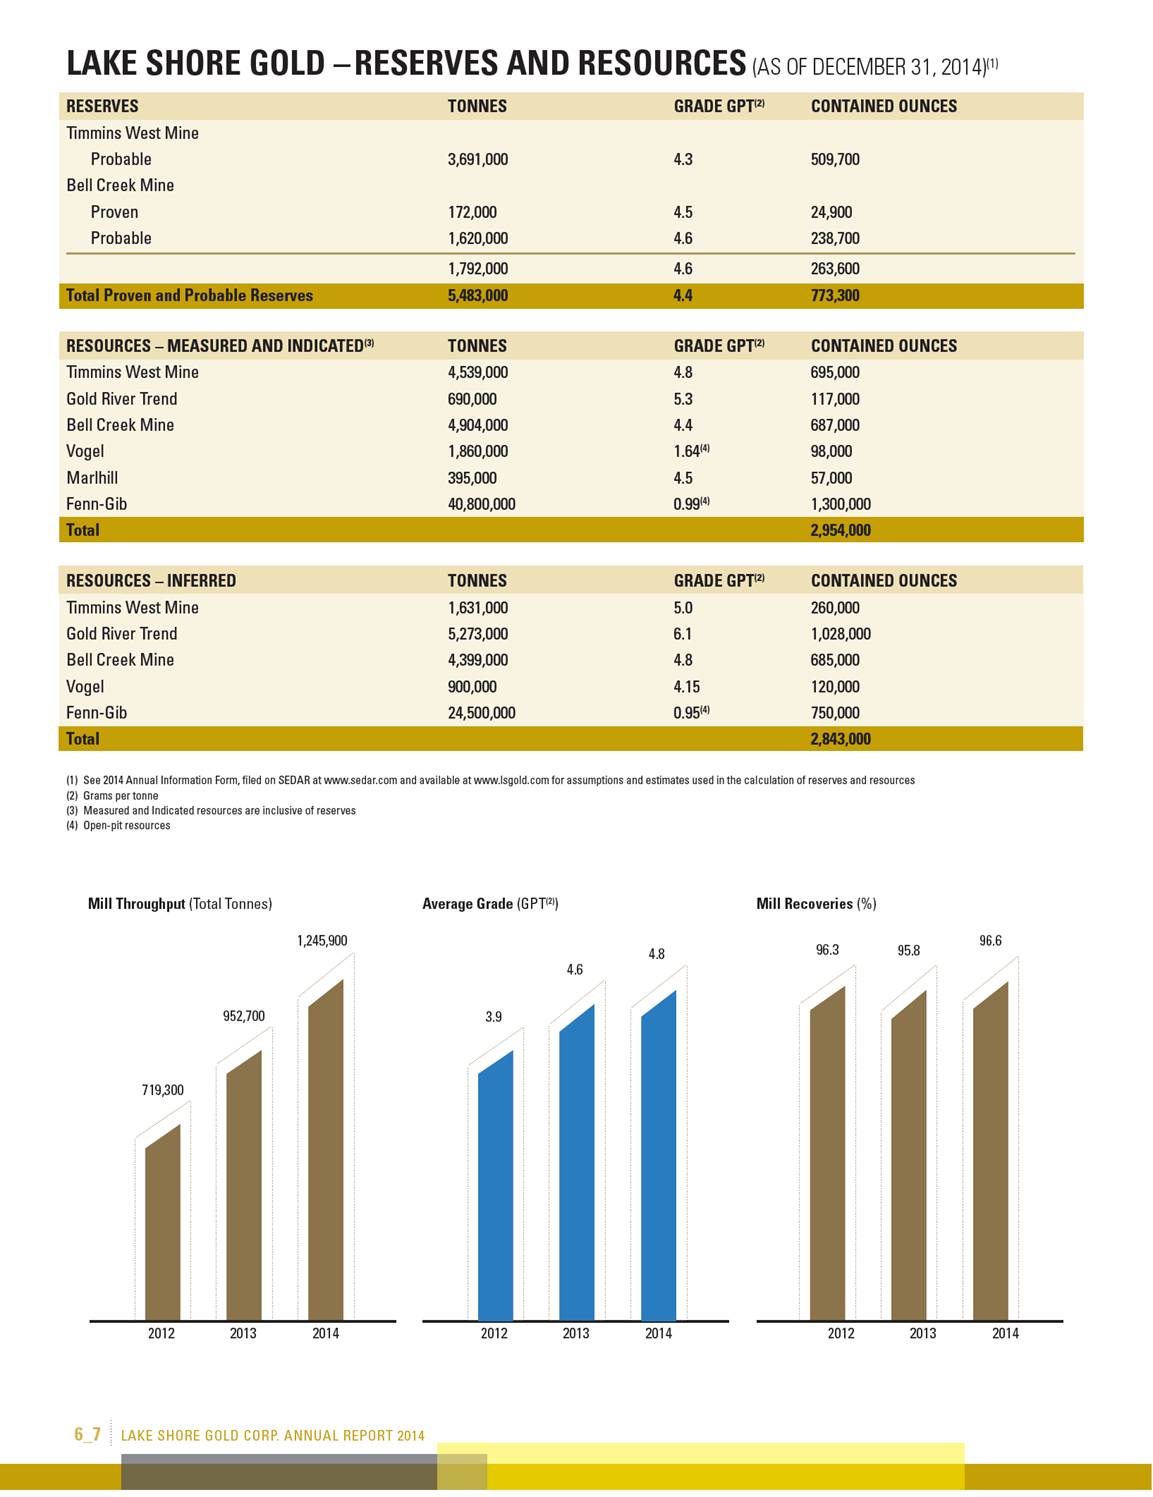
| LAKE SHORE GOLD CORP. ANNUAL REPORT 2014 LAKE SHORE GOLD – RESERVES AND RESOURCES (AS OF DECEMBER 31, 2014)(1) RESERVES TONNES GRADE GPT(2) CONTAINED OUNCES Timmins West Mine Probable 3,691,000 4.3 509,700 Bell Creek Mine Proven 172,000 4.5 24,900 Probable 1,620,000 4.6 238,700 1,792,000 4.6 263,600 Total Proven and Probable Reserves 5,483,000 4.4 773,300 RESOURCES – MEASURED AND INDICATED(3) TONNES GRADE GPT(2) CONTAINED OUNCES Timmins West Mine 4,539,000 4.8 695,000 Gold River Trend 690,000 5.3 117,000 Bell Creek Mine 4,904,000 4.4 687,000 Vogel 1,860,000 1.64(4) 98,000 Marlhill 395,000 4.5 57,000 Fenn-Gib 40,800,000 0.99(4) 1,300,000 Total 2,954,000 RESOURCES – INFERRED TONNES GRADE GPT(2) CONTAINED OUNCES Timmins West Mine 1,631,000 5.0 260,000 Gold River Trend 5,273,000 6.1 1,028,000 Bell Creek Mine 4,399,000 4.8 685,000 Vogel 900,000 4.15 120,000 Fenn-Gib 24,500,000 0.95(4) 750,000 Total 2,843,000 (1) See 2014 Annual Information Form, filed on SEDAR at www.sedar.com and available at www.lsgold.com for assumptions and estimates used in the calculation of reserves and resources (2) Grams per tonne (3) Measured and Indicated resources are inclusive of reserves (4) Open-pit resources 6_7 Mill Throughput (Total Tonnes) 719,300 952,700 1,245,900 2012 2013 2014 Average Grade (GPT(2)) 3.9 4.6 4.8 2012 2013 2014 Mill Recoveries (%) 96.3 95.8 96.6 2012 2013 2014 |
LAKE SHORE GOLD CORP.
MANAGEMENT’S DISCUSSION & ANALYSIS
Years ended December 31, 2014 and 2013
TABLE OF CONTENTS
GENERAL | 1 |
HIGHLIGHTS | 3 |
OUTLOOK | 5 |
CONSOLIDATED FINANCIAL INFORMATION | 2 |
KEY PERFORMANCE INDICATORS | 6 |
REVIEW OF OPERATIONS | 10 |
SUMMARY OF QUARTERLY RESULTS | 19 |
FINANCIAL CONDITION, LIQUIDITY AND CAPITAL RESOURCES | 20 |
OUTSTANDING SHARE CAPITAL | 21 |
NON-GAAP MEASURES | 23 |
ACCOUNTING POLICIES, STANDARDS AND JUDGMENTS | 25 |
OFF BALANCE SHEET ARRANGEMENTS AND TRANSACTIONS WITH RELATED PARTIES | 30 |
RISKS AND CONTROLS | 30 |
FORWARD-LOOKING STATEMENTS | 34 |
ADDITIONAL INFORMATION | 36 |
GENERAL
This Management’s Discussion and Analysis, or MD&A, is intended to assist the reader in the understanding and assessment of the trends and significant changes in the results of operations and financial condition of Lake Shore Gold Corp. (the “Company” or “Lake Shore Gold”). This MD&A should be read in conjunction with the audited consolidated financial statements of the Company, including the notes thereto, for the years ended December 31, 2014 and 2013 (the “financial statements”), which are prepared in accordance with International Financial Reporting Standards (“IFRS”), as issued by the International Accounting Standards Board. This MD&A has taken into account information available up to and including March 25, 2015. All dollar amounts are in Canadian dollars unless otherwise stated.
This MD&A contains forward-looking statements. For example, statements in the “Outlook” section of this MD&A are forward looking, and any statements elsewhere with respect to the cost or timeline of planned or expected development, production, or exploration are all forward-looking statements. As well, statements about future mining or milling capacity, future growth, future financial position, the adequacy of the Company’s cash resources or the need for future financing are also forward-looking statements. All forward-looking statements, including forward-looking statements not specifically identified in this paragraph, are made subject to the cautionary language at the end of this document, and readers are directed to refer to that cautionary language when reading any forward-looking statements.
1
Overview
Lake Shore Gold is a gold producing company with two operating mines, a central milling facility and a large portfolio of growth projects and exploration properties, all located in the Timmins Gold Camp of Northern Ontario.
The Company’s Timmins West Complex is located 18 kilometres west of the City of Timmins and hosts the Timmins West Mine, an underground mining operation that produced 142,200 ounces of gold in 2014. Production at Timmins West Mine comes from two deposits, Timmins Deposit and Thunder Creek Deposit, both of which are open for expansion. Additional growth opportunities at Timmins West Complex include the 144 exploration area (“144”) and the Gold River Trend Deposit. 144 is a four kilometre trend to the southwest of the Thunder Creek Deposit. The recent intersection of wide, high-grade gold mineralization at 144 illustrates the potential for additional gold deposits along the TC-144 Trend. The Gold River Trend Deposit is located 3 kilometres south of the Timmins West Mine and currently hosts over a million ounces of inferred resources with growth potential.
On the east side of the City of Timmins, the Bell Creek Complex hosts the Company’s milling facility as well as the Bell Creek Mine. The Bell Creek Mine is an underground mine that produced 43,400 ounces in 2014. Significant progress was made in 2014 drilling to extend the reserve life of the Bell Creek Mine, with the result being a 147% increase in reserves (announced as part of the 2014 reserve and resource update on March 12, 2015). There remains a large resource base below the current reserve in the Labine Deep Zone, providing additional opportunities for growth. The Bell Creek Complex also hosts two additional deposits, Vogel and Marlhill, as well as other exploration targets.
The Company’s central mill, located at the Bell Creek Complex, is a conventional gold milling circuit, which processes ore from both the Timmins West and Bell Creek mines. Following completion of an expansion in the third quarter of 2013 (“Q3/13”), throughput at the mill has consistently averaged well over 3,000 tonnes per day (3,410 tonnes per day in 2014) with average recoveries exceeding 95% (96.6% in 2014).
A third gold complex, the Fenn-Gib Deposit, is located approximately 60 kilometres east of Bell Creek. Fenn-Gib is an advanced-stage exploration project, which hosts a large, near-surface deposit with excellent potential for further growth.
Lake Shore Gold is a reporting issuer in all Provinces in Canada (excluding the Territories), and a foreign private issuer in the United States. The Company’s common shares trade on the Toronto Stock Exchange and NYSE MKT under the symbol LSG.
Strategy
Lake Shore Gold’s strategy for increasing shareholder value includes maintaining safe and responsible operations and consistently meeting and exceeding its key performance targets. Strong operating performance is a key driver of free cash flow, which in turn funds the work required to continually replace reserves and to build resources in support of long-life production and long-term value creation.
2
HIGHLIGHTS
Lake Shore Gold achieved significant progress in 2014. Production exceeded the Company’s target range and increased 38% from 2013. Cash operating costs and all-in sustaining costs beat guidance and improved by 23% from 2013. The Company increased cash and bullion by $27.5 million, while at the same time repaying $44.7 million of debt. In addition, drilling completed during 2014 resulted in a 29% increase in total reserves and an extension of mine life at both Timmins West Mine and Bell Creek Mine. The Company also discovered a new area of gold mineralization, the 144 Gap Zone, located southwest of the Timmins West Mine Thunder Creek Deposit.
Performance
· Record production of 185,600 ounces in 2014; 43,200 ounces produced in fourth quarter 2014 (“Q4/14”)
· Gold poured of 186,500 ounces in 2014 and 42,400 ounces in Q4/14
· Record gold sales of 183,300 ounces in 2014, 41,200 ounces sold in Q4/14
· Mill throughput of 1,245,900 tonnes in 2014 and 331,500 tonnes in Q4/14
· Average grade of 4.8 grams per tonne in 2014 and 4.2 grams per tonne in Q4/14
· Cash operating cost per ounce sold(1) of US$592 in 2014 and US$597 in Q4/14, based on cash operating costs(1) of $119.9 million (production costs of $120.3 million) and $28.0 million (production costs of $28.1 million), respectively
· All-in sustaining cost per ounce sold(2) of US$872 in 2014 and US$915 in Q4/14
Cash Flow and Profitability
· Record revenues in 2014 of $256.1 million, $56.1 million in Q4/14
· Record cash flows from continuing operating activities of $111.3 million, $21.7 million in Q4/14
· Cash and bullion (the latter valued at market price) at December 31, 2014 of $61.5 million, $27.5 million increase from $34.0 million at December 31, 2013 (cash and bullion declined $5.8 million during Q4/14 reflecting debt repayments)
· Total capital investments of $56.2 million in 2014, $17.5 million in Q4/14
· Total debt repayments of $44.7 million in 2014 ($23.7 million in Q4/14), including $30.0 million ($20.0 million in Q4/14) to fully repay and eliminate standby line of credit (“Standby Line”)
· $20.1 million of flow-through financing arranged in 2014, $15.0 million during Q4/14
· Net earnings of $23.6 million ($0.06 per common share) in 2014 and a net loss of $1.5 million ($0.00 per common share) in Q4/14 (Q4/14 net loss included $3.6 million expense from write off of unamortized debt transactions costs and fees related to early repayment of Standby Line)
· Adjusted net earnings(3) of $28.6 million ($0.07 per common share) in 2014 and $2.5 million in Q4/14 ($0.01 per common share)
3
Growth
· Production increased 38% in 2014 and doubled in two-year period from 2012 to 2014
· Cash and bullion increased 81% in 2014 and more than tripled from low point of $15.0 million at September 30, 2013 following completion of mill expansion
· Reserves grew 29% in 2014 (2014 reserve and resource update released March 12, 2015), extending mine life at both Timmins West Mine and Bell Creek Mine
· Discovery of large, new zone of gold mineralization southwest of Timmins West Mine Thunder Creek Deposit; drilling in second half 2014 and early 2015 identifies 144 Gap Zone to minimum dimensions of 350 metres along strike and 350 metres down dip
· Intersection of high-grade gold mineralization below the current reserve at Bell Creek Mine and in the S2 Fold Nose at Timmins Deposit.
This MD&A contains measures that are not prepared in accordance with Generally Accepted Accounting Principles as defined under IFRS (“GAAP”). Each of the following is a Non-GAAP measure: cash operating costs and cash operating cost per ounce sold(1), all-in sustaining costs and all-in sustaining cost per ounce sold(2), cash earnings from mine operations(3), and adjusted net earnings (loss)(4). The Company believes these Non-GAAP measures provide useful information that can be used by management and investors to evaluate the Company’s performance and ability to generate cash flows. These measures do not have standardized definitions and should not be relied upon in isolation or as a substitute for measures prepared in accordance with GAAP. A reconciliation of these measures to amounts included in the Consolidated Statements of Comprehensive Income (Loss) for the three and twelve months ended December 31, 2014 and 2013 begins on page 23 of this MD&A.
(1) Cash operating costs and cash operating cost per ounce are Non-GAAP measures. In the gold mining industry, cash operating costs and cash operating costs per ounce are common performance measures but do not have any standardized meaning. Cash operating costs are derived from amounts included in the Consolidated Statements of Comprehensive Income (Loss) and include mine site operating costs such as mining, processing and administration as well as royalty expenses, but exclude depreciation, depletion and share-based payment expenses and reclamation costs. Cash operating costs per ounce are based on ounces sold and are calculated by dividing cash operating costs by commercial gold ounces sold; US$ cash operating costs per ounce sold are derived from the cash operating costs per ounce sold translated using the average Bank of Canada C$/US$ exchange rate for the period. The Company discloses cash operating costs and cash operating costs per ounce as it believes the measures provide valuable assistance to investors and analysts in evaluating the Company’s operational performance and ability to generate cash flow. The most directly comparable measure prepared in accordance with GAAP is total production costs. A reconciliation of cash operating costs and cash operating cost per ounce to total production costs for the three and twelve months ended December 31, 2014 and 2013 is set out on page 23 of this MD&A.
(2) All-in sustaining costs and all-in sustaining cost per ounce are Non-GAAP measures. These measures are intended to assist readers in evaluating the total costs of producing gold from current operations. While there are no standardized meanings across the industry for these measures, the Company’s definitions conform to the all-in sustaining costs definition as set out by the World Gold Council in its guidance note dated June 27, 2013. The Company defines all-in sustaining costs as the sum of production costs, sustaining capital (capital required to maintain current operations at existing levels), corporate general and administrative expenses, in-mine exploration expenses and reclamation cost accretion related to current operations. All-in sustaining costs exclude growth capital, reclamation cost accretion not related to current operations, interest expense, debt repayment and taxes. The costs included in the calculation of all-in sustaining costs are divided by commercial gold ounces sold to obtain the all-in sustaining cost per ounce; US$ all-in sustaining cost per ounce sold is translated using the average Bank of Canada C$/US$ exchange rate for the period. The most directly comparable measure prepared in accordance with GAAP is total production costs. A reconciliation of all-in sustaining costs and all-in sustaining cost per ounce to total production costs for the three and twelve months ended December 31, 2014 and 2013 is set out on page 24 of this MD&A.
4
(3) Adjusted net earnings (loss) excludes impairment charges, other income/losses (which includes gains/losses and other costs incurred for acquisition and disposal of mining interests, unrealized and non—cash realized gains/losses on financial instruments) as well as significant non-cash non-recurring items. The Company also excludes the net (earnings) losses from the Company’s investments in associates as well as write down/off of investments in associates. The Company excludes these items from net earnings (losses) to provide a measure which allows the Company and investors to evaluate the operating results of the core operations of the Company and its ability to generate operating cash flows to fund working capital requirements, future capital expenditures and service outstanding debt. A reconciliation of adjusted net earnings (loss) to net earnings (loss) for the three and twelve months ended December 31, 2014 and 2013 is set out beginning on page 24 of this MD&A.
(4) Cash earnings from mine operations is a Non-GAAP measure and does not have any standardized meaning. The Company discloses cash earnings from mine operations as it believes this measure provides valuable assistance to investors and analysts in evaluating the Company’s ability to finance its ongoing business and capital activities. The most directly comparable measure prepared in accordance with GAAP is earnings from mine operations. Cash earnings from mine operations represent the earnings from mine operations prior to deducting non-cash expenses, and is calculated by adding depletion, depreciation and share-based payments in production costs to earnings from mine operations. A reconciliation of cash earnings from mine operations to earnings from mine operations for the three and twelve months ended December 31, 2014 and 2013 is set out beginning on page 23 of this MD&A.
OUTLOOK
In 2015, the Company is targeting gold production of 170,000 — 180,000 ounces with estimated cash operating costs per ounce sold in the range of US$650 to US$700, all-in sustaining costs per ounce sold between US$950 and US$1,000 and total production costs of $125.0 million. The 2015 targets for production and units costs are similar to the target ranges established a year earlier for 2014.
The Company is well financed to meet its operating, capital investment and debt repayment requirements during 2015, including fully repaying its senior secured debt by the end of May. In addition, based on its 2015 business plan and current market conditions, the Company is positioned to generate significant free cash flow during the year. The Company’s cash and bullion increased from $61.5 million at December 31, 2014 to approximately $75.0 million at March 25, 2015.
Additionally in 2015, the Company is targeting to replace reserves mined in the year, and advance the 144 Gap discovery. To achieve these targets, the Company is planning over 200,000 metres of drilling in 2015, including 120,000 metres of drilling at the 144 Gap Zone. The work program at 144 Gap includes $18.0 million of exploration expenditures and will involve approximately 90,000 metres of surface drilling, 30,000 metres of underground drilling and development to drive an exploration drift from Thunder Creek to establish an underground drill platform. The drift is scheduled for completion during the third quarter of 2015. The Company’s goal is to establish a first resource at the 144 Gap Zone for December 31, 2015, which will be released as part of the next resource update early in 2016.
5
CONSOLIDATED FINANCIAL INFORMATION(1)
| | Quarter ended December 31, | | Year ended December 31, | |
(in $’000, except the per share amounts) | | 2014 | | 2013 | | 2014 | | 2013 | |
| | | | | | | | | |
Revenue | | $ | 56,080 | | $ | 65,814 | | $ | 256,144 | | $ | 192,647 | |
Production costs | | $ | 28,076 | | $ | 31,952 | | $ | 120,303 | | $ | 107,491 | |
Earnings (loss) from mine operations | | $ | 11,889 | | $ | (213,260 | ) | $ | 64,112 | | $ | (200,049 | ) |
Earnings (loss) from operations and associates | | $ | 5,144 | | $ | (218,577 | ) | $ | 45,567 | | $ | (219,624 | ) |
Earnings (loss) from continuing operations* | | $ | (1,500 | ) | $ | (225,693 | ) | $ | 23,614 | | $ | (229,167 | ) |
Net earnings (loss)* | | $ | (1,500 | ) | $ | (225,693 | ) | $ | 23,614 | | $ | (233,469 | ) |
Basic net income (loss) per share from continuing operations | | $ | (0.00 | ) | $ | (0.54 | ) | $ | 0.06 | | $ | (0.55 | ) |
Basic net income (loss) per share | | $ | (0.00 | ) | $ | (0.54 | ) | $ | 0.06 | | $ | (0.56 | ) |
Cash flows from continuing operating activities | | $ | 21,736 | | $ | 38,112 | | $ | 111,256 | | $ | 70,647 | |
* Loss in Q4/14 includes $3.6 million expense from write off of unamortized debt transaction costs and fees related to early repayment of Standby Line.
KEY PERFORMANCE INDICATORS(1)
| | Quarter ended December 31, | | Year ended December 31, | |
| | 2014 | | 2013 | | 2014 | | 2013 | |
Tonnes milled | | 331,500 | | 321,800 | | 1,245,900 | | 952,700 | |
Grade (gpt) | | 4.2 | | 5.2 | | 4.8 | | 4.6 | |
Average mill recoveries | | 96.7 | % | 96.3 | % | 96.6 | % | 95.8 | % |
Ounces produced | | 43,200 | | 51,700 | | 185,600 | | 134,600 | |
Ounces poured | | 42,400 | | 51,400 | | 186,500 | | 129,600 | |
Ounces sold | | 41,200 | | 49,650 | | 183,300 | | 135,600 | |
Average price (US$/oz) | | $ | 1,200 | | $ | 1,261 | | $ | 1,269 | | $ | 1,377 | |
Average price ($/oz) | | $ | 1,360 | | $ | 1,328 | | $ | 1,398 | | $ | 1,422 | |
Cash operating costs (US$/oz) | | $ | 597 | | $ | 609 | | $ | 592 | | $ | 766 | |
Cash operating costs ($/oz) | | $ | 679 | | $ | 640 | | $ | 654 | | $ | 789 | |
All - in sustaining costs (US$/oz) | | $ | 915 | | $ | 849 | | $ | 872 | | $ | 1,139 | |
All - in sustaining costs ($/oz) | | $ | 1,040 | | $ | 891 | | $ | 963 | | $ | 1,174 | |
Cash earnings from mine operations ($000s) | | $ | 28,117 | | $ | 34,089 | | $ | 136,249 | | $ | 85,686 | |
Adjusted net earnings (loss) ($000s) | | $ | 2,493 | | $ | 2,310 | | $ | 28,570 | | $ | (3,593 | ) |
Adjusted net earnings (loss) per share ($/share) | | $ | 0.01 | | $ | 0.01 | | $ | 0.07 | | $ | (0.01 | ) |
(1) The Company’s Consolidated Financial Information includes measures prepared in accordance with GAAP. The Company’s Key Performance Indicators include a number of Non-GAAP measures, including cash operating costs, all-in sustaining costs, cash earnings from mine operations as well as adjusted net earnings (loss) and adjusted net earnings (loss) per share, which the Company believes provide useful information that can be used to evaluate the Company’s performance. These Non-GAAP measures do not have standardized definitions and should not be relied upon in isolation or as a substitute for the measures prepared in accordance with GAAP. A reconciliation of these measures to amounts included in the Consolidated Statements of Comprehensive Income (Loss) is set out beginning on page 23 of this MD&A.
An ongoing key objective for the Company is generating free cash flow. Achieving this objective is important for funding the Company’s operations, reducing debt and providing the financial strength to invest in future growth. The key performance indicators that drive cash flow generation include gold production, gold poured and gold sales, as well as unit costs which, along with the gold price, determine the Company’s margins. Also important to the Company’s cash position is its ability to manage its capital investment as well as its debt levels. Another indicator of the Company’s ability to generate cash flow is cash earnings from mine operations, which along with earnings from mine operations, net earnings and adjusted net earnings are the Company’s primary earnings measures.
6
Record Production of 185,600 Ounces in 2014 Exceeds Company’s Target
The Company achieved record production in 2014, with a total of 185,600 ounces produced, exceeding the Company’s target range for the year of 160,000 to 180,000 ounces. The production was 38% higher than the 134,600 ounces produced in 2013. Mill throughput during the year totaled 1,245,900 tonnes, or an average of 3,410 tonnes per day, an increase of 31% from the 2,610 tonnes per day processed in 2013. Higher volumes resulted from a full year of increased production rates following the completion of the Company’s mill expansion in the Q3/13. The average grade in 2014 was 4.8 grams per tonne compared to 4.6 grams per tonne in 2013, with the increase mainly reflecting mine sequencing. Gold poured during 2014 totaled 186,500 ounces, an increase of 44% from 129,600 ounces in 2013.
Production in Q4/14 of 43,200 ounces of gold (331,500 tonnes at an average grade of 4.2 grams per tonne) compared to total production of 51,700 ounces (321,800 tonnes at an average grade of 5.2 grams per tonne) in the fourth quarter of 2013 (“Q4/13”). The change from the prior year’s fourth quarter reflected lower average grades due to mine sequencing. The Company poured 42,400 ounces during Q4/14 versus 51,400 ounces in Q4/13.
Record Gold Sales Drive Strong Growth in Revenues
Gold sales in 2014 were a record 183,300 ounces, a 35% increase from 2013. Total revenues of $256.1 million in 2014 were also a record and increased by 33% from the prior year. The increase in revenues from 2013 reflected strong growth in sales volumes, which more than offset a 2% reduction in the average selling price, to $1,398 (US$1,269) per ounce from $1,422 (US$1,377) per ounce in 2013. The average Canadian dollar exchange rate was US$1:C$1.10 in 2014 compared to US$1:C$1.03 in 2013.
Gold sales in Q4/14 totaled 41,200 ounces compared to 49,600 ounces in Q4/13, reflecting lower production levels. Revenues in Q4/14 totaled $56.1 million versus $65.8 million in Q4/13. Partially offsetting the impact of lower gold sales was an increase in the average selling price of gold to $1,360 (US$1,200) per ounce in Q4/14 from $1,328 (US$1,269) per ounce in Q4/13. The increase in the average gold price reflected a weaker Canadian dollar (US$1:C$1.14 in Q4/14 versus US$1:C$1.05 in Q4/13), which more than offset the impact of a 4.8% reduction in the average US$ gold price from US$1,261 per ounce in Q4/13 to US$1,200 per ounce in Q4/14.
7
Lower Unit Operating Costs and Significant Margin Improvement
Production costs in 2014 totaled $120.3 million, an increase from $107.5 million in 2013 reflecting higher production volumes. Total production costs in 2014 beat the Company’s target for the year of $128.0 million. On a unit cost basis, cash operating cost per ounce sold averaged US$592 in 2014, a 23% improvement from US$766 in 2013 and 12% better than the low end of the Company’s target range for the year of US$675 to US$775. All-in sustaining cost per ounce sold averaged US$872, also a 23% improvement from 2013 and US$397 per ounce less than the average selling price of US$1,269 per ounce during 2014. The US$872 per ounce sold of all-in sustaining costs in 2014 was 8% better than the low end of the Company’s 2014 target range of US$950 to US$1,050.
Production costs in Q4/14 totaled $28.1 million, a reduction from $32.0 million in Q4/13 reflecting lower production volumes. Cash operating cost per ounce sold of US$597 was 2% lower than the US$609 in Q4/13 and reflected the impact of a weaker Canadian dollar during Q4/14. All-in sustaining costs averaged US$915 per ounce sold in Q4/14 or US$285 per ounce less than the average selling price for the quarter of US$1,200. All-in-sustaining costs for Q4/14 were 8% higher than in the same period in 2013 as higher sustaining capital costs, mainly for mine development, was only partially offset by the impact of a weaker Canadian dollar.
Capital Expenditures in Line with Expectations
Capital investment in 2014 totaled $56.2 million, or 38% lower than the $90.4 million invested in 2013.
During Q4/14, the Company invested a total of $17.5 million in its mining interests compared to $10.3 million invested in Q4/13. The increase reflects higher investment in capital development in Q4/14 than in Q4/13.
$44.7 Million of Debt Repayments in 2014 — Standby Line Fully Repaid
Total debt repayments in 2014 were $44.7 million, all relating to the Company’s senior secured credit facility with Sprott Resource Lending Partnership (“Sprott”). Included in the $44.7 million of debt repayments are $30.0 million relating to the Company’s Standby Line and $14.7 million to principal repayments on the Company’s gold-linked note.
8
Debt repayments in Q4/14 totaled $23.7 million, of which $20.0 million was paid on December 31, 2014 to fully repay and retire the Standby Line. The remaining $3.7 million of debt repayments in Q4/14 related to the principal portion of payments on the gold-linked note.
Cash and Bullion of $61.5 Million at December 31, 2014
Cash and bullion at December 31, 2014 totaled $61.5 million, including $54.4 million of cash and cash equivalents and $7.1 million of bullion valued at market prices (bullion represents gold poured in doré that has not yet been included in revenue and for which cash has not yet been received). The $61.5 million of cash and bullion at December 31, 2014 was 81% higher than the $34.0 million of cash and bullion at December 31, 2013. The increase in cash and bullion was after debt repayments of $44.7 million and resulted from internally generated cash flow as well as approximately $20.1 million from flow-through financings completed in 2014.
Cash flow from operating activities, after movements in working capital, was a record $111.3 million in 2014, a 58% increase from $70.6 million in 2013. Investing activities represented a use of cash totaling $57.3 million in 2014, reflecting capital expenditures during the year, including movements in working capital. Financing activities accounted for a use of cash totaling $32.8 million in 2014 as cash used for debt repayments and payments relating to finance lease obligations more than offset the impact of proceeds from flow-through financings during the year.
Cash flow from operating activities, after movements in working capital, in Q4/14 totaled $21.7 million compared to $38.1 million in Q4/13. Cash used for investing activities in Q4/14 totaled $16.3 million, while cash used for financing activities totaled $12.7 million, the latter mainly reflecting the $20.0 million payment on the Standby Line on December 31, 2014 and $5.1 million of principal and interest payments on the gold-linked note, partially offset by the net proceeds from flow through financing of $14.4 million.
Strong Growth in Both Cash Earnings and Earnings from Mine Operations
The Company generated cash earnings from mine operations in 2014 of $136.3 million, 59% higher than the $85.7 million reported in 2013. The significant growth in cash earnings from mine operations mainly reflected increased revenues resulting from higher gold sales, as well as the impact of lower unit costs and improved margins.
Earnings from mine operations totaled $64.1 million in 2014 compared to a loss from mining operations of $200.0 million in 2013. Excluding the impact of a $225.0 million impairment charge in 2013, earnings from mine operations for that year totaled $25.0 million. Earnings from mine operations includes cash earnings from mine operations, as well as the impact of depreciation and depletion expense, share-based payments and any impairment charges.
Cash earnings from mine operations in Q4/14 totaled $28.1 million versus $34.1 million in Q4/13, largely reflecting higher gold sales and revenues in the prior period. Earnings from mine operations totaled $11.9 million compared to a loss from mine operations of $213.3 million in Q4/13 (earnings from mine operations of $11.7 million excluding the impact of the impairment charge in Q4/13).
9
Net Earnings Total $23.6 Million in 2014, $0.06 per Common Share
Net earnings in 2014 totaled $23.6 million or $0.06 per common share, which compared to a net loss of $233.5 million or $0.56 per common share in 2013. The net loss in 2013, in addition to the impairment charge of $225.0 million, included a $4.3 million loss from discontinued operations relating to the sale of the Company’s Mexico subsidiary. Excluding the impact of the impairment charge and the loss from discontinued operations, the net loss in 2013 totaled $4.2 million or $0.01 per common share. The higher net earnings in 2014 compared to 2013, excluding the impairment charge and loss from discontinued operations in 2013, resulted mainly from higher gold sales and lower unit costs in 2014.
The Company reported a net loss of $1.5 million or $0.00 per common share in Q4/14 compared to a net loss of $225.7 million or $0.54 per common share in Q4/13, the latter including the $225.0 million impairment charge. Contributing to the net loss in Q4/14 were a $2.4 million write off related to unamortized debt transaction costs and a $1.2 million prepayment fee, both resulting from the $20.0 million prepayment on the Standby Line on December 31, 2014.
Adjusted Net Earnings of $28.6 Million in 2014, $2.5 Million in Q4/14
Starting in the first quarter of 2014, the Company began reporting adjusted net earnings (see the Non-GAAP Measures section on page 24 of this MD&A for a full definition). Adjusted net earnings in 2014 totaled $28.6 million versus adjusted net losses of $3.6 million in 2013. Adjusted net earnings in Q4/14 totaled $2.5 million compared to adjusted net earnings of $2.3 million in Q4/13.
REVIEW OF OPERATIONS
Processing
The Company’s central mill, located at the Bell Creek Complex, is a conventional gold mill circuit, involving crushing and grinding, gravity and leaching, followed by carbon-in-leach and carbon-in-pulp processes for gold recovery. The milling facility is located approximately 20 kilometres east of the City of Timmins. The mill, which processes ore from both the Timmins West and Bell Creek mines, has an operating capacity of over 1.3 million tonnes per year and has consistently achieved metallurgical recoveries exceeding 95%.
During 2014, the Company processed 1,245,900 tonnes of ore at an average grade of 4.8 grams per tonne and average recoveries of 96.6% for a total of 185,600 recovered ounces. 2014 production compared to 952,700 tonnes at an average grade of 4.6 grams per tonne and recoveries of 95.8% for 134,600 ounces recovered in 2013.
In Q4/14, a total of 331,500 tonnes of ore was processed at the Bell Creek Mill, an increase of 3% from Q4/13 reflecting higher production volumes from the Company’s mines. A total of 43,200 ounces were recovered in Q4/14 at an average grade of 4.2 grams per tonne with recoveries averaging 96.7%. These results compare to 321,800 tonnes at an average grade of 5.2 grams per tonne and recoveries of 96.3% for 51,700 recovered ounces in Q4/13.
During 2014, the Company invested $8.9 million ($3.2 million in Q4/14) at the Bell Creek Mill, which mainly related to expansion of its tailings facility.
10
Timmins West Mine
The Timmins West Mine is an underground mine located approximately 18 kilometres west of Timmins, Ontario at the junction of highways 101 and 144. The current mine represents the combination of the Timmins Deposit and the adjacent Thunder Creek Deposit into a single fully integrated mining operation, effective January 1, 2012. The Company produces ore at Timmins West Mine using a 710 metre, 5.5 metre diameter shaft, with a 6,000 tonne per day total hoisting capacity. The ore is accessed using mobile equipment via internal ramps both from surface and the main shaft. Primary mining methods include longitudinal and transverse longhole mining. Broken ore is removed from the stopes using remote controlled Load-Haul-Dump Loaders (“LHDs”), loaded onto trucks and hauled to the main shaft rockbreaker station prior to skipping to surface.
Production from Timmins West Mine and surrounding properties is subject to a 2.25% net smelter royalty (“NSR”). There are several other royalties applicable to various land areas comprising the Timmins West Mine. Only one of these other royalties, a 1% NSR royalty related to Thunder Creek, involves areas of known mineralization.
A total of 142,200 ounces of gold was produced at Timmins West Mine in 2014, as a result of processing 971,200 tonnes of ore at an average grade of 4.7 grams per tonne. The 2014 production was 33% higher than the 107,100 ounces produced during 2013 (747,500 tonnes at an average grade of 4.6 grams per tonne). Increased throughput levels and a slightly higher average grade accounted for the increase in production compared to 2013. In 2014, production was largely from the Ultramafic Zone at Timmins Deposit and Rusk Zone at Thunder Creek.
A total of 31,200 ounces of gold was produced at Timmins West Mine in Q4/14 from processing 251,800 tonnes at an average grade of 4.0 grams per tonne. Production in Q4/14 compared to production in Q4/13 of 41,600 ounces (259,800 tonnes at an average grade of 5.2 grams per tonne). The change in production from in Q4/14 compared to Q4/13 mainly reflected the impact on average grades of mine sequencing.
During 2014, the Company invested $32.7 million at the Timmins West Mine ($9.8 million in Q4/14), largely related to investments in mine development, equipment, and a new water pond. Also included in the $32.7 million of investments were $4.4 million for in-mine, definition drilling and $2.7 million for exploration work, including drilling and the development of exploration drifts. The Company completed 5,100 metres of capital development in 2014, mainly focused on continued ramp advancement and level development at both Timmins Deposit and Thunder Creek. As at December 31, 2014, the ramp at Timmins Deposit had been developed to below the 930 Level, while the ramp at Thunder Creek had been advanced upward past the 520 Level. In addition to all other associated infrastructure development, a portion of the capital development in 2014 related to exploration drifts on the 790, 830 and 910 levels at Timmins Deposit. Near the end of the year, the Company commenced development of an exploration ramp from the 765 Level at Thunder Creek towards the 144 Gap Zone, primarily for the purpose of establishing an underground diamond drill platform.
A total of 65,600 metres of in-mine, definition drilling was completed in 2014. Drilling during the year was focused on the Ultramafic and Footwall zones between the 850 and 1,120 levels at the Timmins Deposit. At Thunder Creek, drilling tested both the Rusk and the Porphyry zones between the 765 and the 890 levels, as well between the 520 and 625 levels. On March 12, 2015, the Company released results of its 2014 reserve and resource update, which included total
11
reserves at Timmins West Mine of 509,700 ounces (3,691,000 tonnes at an average grade of 4.3 grams per tonne). The updated reserve estimate compares to the previous estimate of 492,200 ounces (3,332,000 tonnes at an average grade of 4.6 grams per tonne), with the 4% increase in reserves exceeding the Company’s goal of replacing reserves mined at Timmins West Mine during 2014.
A total of 20,600 metres of exploration drilling was completed on Timmins West Mine in 2014 (4,400 metres during Q4/14) as part of an exploration program initiated in January 2014 focused on targets outside existing resources. Key areas of focus included exploring high-potential areas along strike and down dip of current zones at the Timmins Deposit, as well as areas along the sediment/ultramafic contact between the Timmins Deposit and Thunder Creek. Results from 13,916 metres were reported in a press release dated October 21, 2014 and included several significant intersections from the S2 Fold Nose, a second fold nose structure located on the east side of the Timmins Deposit. The results also included encouraging intercepts below the current resource shapes for the Footwall and Ultramafic zones at Timmins Deposit between the 790 and 850 levels. An additional eight widely-spaced holes (4,376 metres) were drilled to explore along the contact between the Timmins and Thunder Creek deposits, with no significant gold values being intersected from this drilling.
Bell Creek Mine
The Bell Creek Mine is an underground mine located approximately 20 kilometres northeast of Timmins, Ontario. Ore at Bell Creek is trucked to surface using a five metre wide by five metre high ramp. Longitudinal longhole stoping is the primary mining method. Broken ore is removed from the stope using remote controlled LHDs, and trucked to surface.
Production from Bell Creek Mine is subject to a 2% NSR, payable to Goldcorp Inc. (“Goldcorp”). The royalty is subject to the recovery by the Company of $6.0 million related to Goldcorp’s share of the purchase price of a prior royalty. The $6.0 million is being offset against royalty obligations payable by the Company to Goldcorp. As at December 31, 2014 the Company had total royalty expense of $2.7 million that had been offset against the payment owed by Goldcorp.
Production from Bell Creek Mine in 2014 totaled 43,400 ounces of gold (274,700 tonnes at an average grade of 5.1 grams per tonne), a 58% increase from 27,500 ounces (205,200 tonnes at an average grade of 4.4 grams per tonne) produced in 2013. Higher throughput levels and increased average grades accounted for the strong production growth compared to 2013. Production in 2014 was primarily in the NA and Hanging Wall (“HW”) zones with some production from the NA2, NA3, NA4 veins and North B (“NB”)2 and NB3 veins between the 300 Level and 760 Level. Higher tonnage in the year compared to 2013 reflected an increase in the mining rate given a widening of the orebody at depth. The improved average grade resulted from increased production from the higher-grade NA Zone.
During Q4/14, 12,000 ounces of gold was produced from Bell Creek Mine (79,700 tonnes at an average grade of 4.9 grams per tonne), which compared to production of 10,100 ounces (62,000 tonnes at an average grade of 5.3 grams per tonne) in Q4/13. Production in Q4/14 was primarily in the NA and HW zones with some production from the NA4 and Foot Wall veins between the 300 Level and 760 Level. Increased tonnage in Q4/14 compared to the same quarter in 2013 reflected an increase in the mining rate given a widening of the orebody at depth. The decline in average grade resulted from mine sequencing.
12
In 2014, the Company invested $14.0 million ($4.2 million in Q4/14) at the Bell Creek Mine for mine development, equipment and exploration drilling. The Company completed 2,700 metres of capital development in 2014. As at December 31, 2014 the ramp had been extended to the 790 Level, with level development, escapeways and ventilation raises advancing towards the 790 Level. A total of 11,961 metres of in-mine definition drilling was completed at the Bell Creek Mine during 2014 (1,058 metres in Q4/14) in support of ongoing mining operations.
Exploration drilling programs, totaling 24,200 metres, were completed at Bell Creek during 2014 and accounted for $2.3 million of the $14.0 million of total investment for the year. The first program was launched in January and included 3,800 metres of drilling. The program was designed to test high-potential targets near existing resources between the 775 and 925 levels. A second program, involving 20,400 metres of drilling, was launched in July in order to infill and expand resources and convert resources to reserves between the 775 Level and the 1165 Level. It was mainly as a result of the second drill program that the Company announced a 147% increase in reserves (1,792,000 tonnes at an average grade of 4.6 grams per tonne for 263,600 ounces) at Bell Creek Mine as part of its 2014 reserve update, issued on March 12, 2015.
144
In August 2014, the Company commenced a drill program at the 144, located directly southwest of Thunder Creek, with 23,700 metres completed in Q4/14 and a total of 24,400 metres completed during the year. The drill program is largely focused on the area immediately adjacent to Thunder Creek (the 144 Gap), and also includes drilling in both the 144 North and 144 South targets.
On October 6, 2014, the Company announced that the first hole (Hwy-14-48) from the program had intersected 5.37 grams per tonne over 46.0 metres, including 21.87 grams per tonne over 6.0 metres and 12.54 grams per tonne over 4.4 metres. The intersections confirmed the presence of wide, high-grade gold mineralization within 770 metres of Thunder Creek.
On November 13, 2014, the Company announced the results from another four drill holes with all holes intersecting wide, high-grade gold mineralization. The new results confirmed and extended the size of the mineralized area southwest of Thunder Creek.
On January 27, 2015, the Company released the results of an additional 20 holes, covering 23,600 metres of drilling, at the 144 Gap Zone target area. The results identified the 144 Gap Zone to within 500 metres of Thunder Creek and established the zone to minimum dimensions of 350 metres along strike and 350 metres down dip, with the zone remaining open for expansion.
On February 23, 2015, the Company released results from an additional 10 holes and one wedge hole, covering a total of 11,100 metres of drilling. The results established a thick, high-grade core within the 144 Gap Zone with minimum dimensions of 250 metres of vertical height, 75 to 100 metres of width and 50 to 75 metres along strike. Based on drilling to date, the high-grade core remains open for expansion along strike, to the west and towards surface.
Interpretations of current drill results suggest that the mineralization at the 144 Gap Zone is contained within a broad zone of hydrothermal alteration and deformation measuring up to 100 metres wide and closely associated with syenite intrusions, quartz veining, pyrite, scheelite and/or galena and multiple occurrences of visible gold. Similar to Thunder Creek, mineralization at the 144 Gap Zone appears to be contained in both wide bulk and narrow high-grade structures.
13
A total of approximately 120,000 metres of drilling is planned at 144 Gap Zone in 2015, with the Company’s goal to establish a first resource for the end of 2015 (to be released in early 2016). Late in 2014, the Company commenced driving a ramp from the 765 Level at Thunder Creek towards the 144 Gap Zone area for the purpose of establishing an underground drill platform to support approximately 30,000 metres of underground drilling in 2015 (approximately 90,000 metres of surface drilling is planned). A total of 1,200 metres of total development is planned, with the ramp expected to be completed in the third quarter of 2015. Underground drilling is targeted to commence during the second quarter of the year.
FINANCIAL REVIEW
The table that follows highlights the results of operations for the fourth quarter and year ended December 31, 2014 and 2013:
| | Quarter ended December 31, | | Year ended December 31, | |
(in $’000, except the per share amounts) | | 2014 | | 2013 | | 2014 | | 2013 | |
| | | | | | | | | |
Revenue | | $ | 56,080 | | $ | 65,814 | | $ | 256,144 | | $ | 192,647 | |
Cash operating costs | | (27,963 | ) | (31,725 | ) | (119,895 | ) | (106,961 | ) |
Cash earnings from mine operations | | 28,117 | | 34,089 | | 136,249 | | 85,686 | |
Depreciation and depletion | | (16,115 | ) | (22,122 | ) | (71,729 | ) | (60,205 | ) |
Share-based payments in production costs | | (113 | ) | (227 | ) | (408 | ) | (530 | ) |
Impairment charge | | — | | (225,000 | ) | — | | (225,000 | ) |
Earnings (loss) from mine operations | | 11,889 | | (213,260 | ) | 64,112 | | (200,049 | ) |
Expenses* | | | | | | | | | |
General and administrative | | (2,687 | ) | (3,256 | ) | (11,274 | ) | (10,573 | ) |
Exploration | | (2,488 | ) | (262 | ) | (3,339 | ) | (1,203 | ) |
Share-based payments in expenses | | 120 | | (626 | ) | (2,260 | ) | (2,092 | ) |
| | 6,834 | | (217,404 | ) | 47,239 | | (213,917 | ) |
Other (loss) income, net | | (2,875 | ) | (1,830 | ) | (3,284 | ) | 5,133 | |
Share of loss of investments in associates | | (311 | ) | (871 | ) | (865 | ) | (1,833 | ) |
Write down of investment in associates | | (807 | ) | (302 | ) | (807 | ) | (3,874 | ) |
Earnings (loss) before finance items | | 2,841 | | (220,407 | ) | 42,283 | | (214,491 | ) |
Finance expense, net | | (4,341 | ) | (5,286 | ) | (18,669 | ) | (14,676 | ) |
(Loss) earnings before taxes | | (1,500 | ) | (225,693 | ) | 23,614 | | (229,167 | ) |
Loss from discontinued operations | | — | | — | | — | | (4,302 | ) |
Net (loss) earnings | | $ | (1,500 | ) | $ | (225,693 | ) | $ | 23,614 | | $ | (233,469 | ) |
Basic and diluted (loss) earnings per share | | | | | | | | | |
(Loss) earnings per share from continuing operations | | $ | (0.00 | ) | $ | (0.54 | ) | $ | 0.06 | | $ | (0.55 | ) |
(Loss) earnings per share | | $ | (0.00 | ) | $ | (0.54 | ) | $ | 0.06 | | $ | (0.56 | ) |
* General and administrative and exploration expenses differ from the balances on the Consolidated Statements of Comprehensive Income (Loss) by the share-based payments in expenses of $2,260 in 2014 ($2,092 in 2013).
Summary
Cash earnings from mine operations of $136.2 million in 2014 were $50.6 million or 59% higher than the $85.7 million in 2013 due to higher gold sales and lower unit operating costs which more than offset the impact of a 2% reduction in the average realized Canadian gold price.
The Company reported net earnings of $23.6 million, or $0.06 per common share in 2014 compared to a net loss of $233.5 million in 2013. The net loss in 2013 included a $225.0 million impairment charge and a $4.3 million loss from discontinued operations from the sale of the Company’s Mexico subsidiary. Excluding the impairment charge and the loss from discontinued
14
operations, the Company’s net loss in 2013 was $4.2 million. Higher gold sales, improved unit costs as well as lower depletion and depreciation costs per ounce more than offset the impact of a reduction in the average gold price in accounting for the improved earnings performance in 2014 compared to 2013.
Cash earnings from mine operations of $28.1 million in Q4/14 were $6.0 million lower than the same period in 2013 reflecting lower gold sales, partially offset by slightly higher realized gold price. The average realized gold price in Q4/14 was $1,360 per ounce, 2% higher than for the same period in 2013.
The Company reported net loss of $1.5 million, or $0.00 per common share, in Q4/14 compared to a net loss of $225.7 million in the same period of 2013. Net loss in Q4/14 includes the impact of the prepayment of the Standby Line ($2.4 million write off of unamortized debt transaction costs and $1.2 million prepayment fee). Excluding the charges for the Standby Line prepayment, the Company would have generated net earnings of $2.1 million in Q4/14. The net loss in Q4/13 included a $225.0 million impairment charge; excluding the impairment charge the Company’s net loss in Q4/13 was $0.7 million.
Discontinued operations
On January 30, 2013 the Company and Revolution Resources Corp., subsequently renamed IDM Mining Ltd. (“IDM”), entered into an agreement for the sale of the Company’s Mexico subsidiary (which held 100% of the Company’s Mexico property portfolio) to IDM for shares of IDM and other consideration.
The transaction closed on May 8, 2013 (“closing date”) at which time the Company received 20 million common shares of IDM. The Company recorded a loss of $4.3 million on the discontinued operations.
Revenue
| | Quarter ended December 31, | | Year ended December 31, | |
| | 2014 | | 2013 | | 2014 | | 2013 | |
Revenues | | | | | | | | | |
Gold sales (ounces) | | 41,200 | | 49,600 | | 183,300 | | 135,550 | |
Realized gold price ($/ounce) | | $ | 1,360 | | $ | 1,328 | | $ | 1,398 | | $ | 1,422 | |
Revenues ($’000) | | $ | 56,080 | | $ | 65,814 | | $ | 256,144 | | $ | 192,647 | |
Revenues for 2014 are 33% higher than in the same period in 2013 reflecting higher gold sales (47,750 more ounces or 35% higher than in 2013), which more than offset a slightly lower average realized gold price (2% lower than in 2013). Revenues for the three months ended December 31, 2014 are 15% lower than in the same period in 2013, reflecting less ounces sold; the impact of lower ounces sold was partially offset by a better price realized (2% higher than in the fourth quarter of 2013).
Cash operating costs
Cash operating costs in 2014 totaled $119.9 million, which represented $654 per ounce sold compared to cash operating costs of $107.0 million or $789 per ounce in 2013. The higher cash operating costs in 2014 reflected increased production volumes. Lower per unit costs in 2014 compared to 2013 reflect increased grades for 2014, the benefit of completed infrastructure, as
15
well as the impact of a number of cost control measures introduced since the end of the first quarter of 2013 in response to lower gold prices.
Cash operating costs in Q4/14 totaled $28.0 million, which represented $679 per ounce sold compared to cash operating costs of $31.7 million or $640 per ounce in Q4/13. The higher cash cost per unit in Q4/14 compared to same period in 2013 reflected the impact of a lower average grade in Q4/14 (4.2 grams per tonne compared to 5.2 grams per tonne in Q4/13).
Depreciation and depletion
Depreciation and depletion in 2014 of $71.7 million was $11.5 million higher than in 2013 reflecting higher gold sales. On a per ounce sold basis, depreciation and depletion were $391 in 2014, 12% lower than in 2013. The reduction in per unit depletion and depreciation costs from 2013 was mainly due to the lower carrying value of mining interests in 2014 after the impairment charge recorded at the end of 2013.
For Q4/14, depreciation and depletion of $16.1 million was $6.0 million lower than in Q4/13, with the reduction reflecting lower gold sales. As with the full-year, depreciation and depletion on a per ounce sold basis was $391, 12% lower than in Q4/13.
Share-based payments in production costs
Share-based payments in production costs of $0.4 million and $0.1 million for 2014 and Q4/14 were comparable to the same periods in 2013.
Other income (loss) and expenses
General and administrative expenses (net of share-based payment expense discussed below) for 2014 were $0.7 million higher than in 2013 due to expenditures for management restructuring. General and administrative expenses (net of share-based payments) in Q4/14were $0.6 million lower than in Q4/13 due to the timing of certain accruals in 2013.
Exploration expenses (net of share-based payment expense discussed below) of $3.3 million and $2.5 million, respectively for 2014 and Q4/14 are $2.2 million higher than in the same periods in 2013 as the Company started drilling at 144 in the third quarter of 2014. The Company spent a total of $2.4 million at the 144 Gap Zone in 2014 ($2.2 million in the fourth quarter).
Share-based payments in expenses for 2014 and Q4/14 of $2.3 million and $0.1 million, respectively, were $0.2 million higher and $0.7 million lower than in the same periods in 2013. The lower share-based payments in expenses in Q4/14 were primarily due to a decrease in share-based liabilities in the quarter reflecting a lower market price of the Company’s shares at December 31, 2014 compared to September 30, 2014.
16
Other (loss) income, net, for the three and twelve months ended December 31, 2014 and 2013 is as follows (in $’000s):
| | Quarter ended December 31, | | Year ended December 31, | |
| | 2014 | | 2013 | | 2014 | | 2013 | |
Unrealized and realized gain (loss) on embedded derivatives | | $ | 1,717 | | $ | (245 | ) | $ | 5,491 | | $ | 8,171 | |
Unrealized and realized foreign exchange (loss), net | | (1,686 | ) | (555 | ) | (6,044 | ) | (489 | ) |
Gain (loss) on deemed disposition of investments | | — | | — | | 1,038 | | (1,681 | ) |
Write down of unamortized transaction costs on loan prepayment | | (2,392 | ) | — | | (3,356 | ) | — | |
Loss on sale lease back transaction | | — | | (682 | ) | — | | (682 | ) |
Expenditures for disputed property taxes | | (943 | ) | — | | (943 | ) | — | |
Amortization of deferred premium on flow through shares | | 429 | | — | | 530 | | — | |
Other loss, net | | — | | (348 | ) | — | | (186 | ) |
Other (loss) income, net | | $ | (2,875 | ) | $ | (1,830 | ) | $ | (3,284 | ) | $ | 5,133 | |
The unrealized and realized gain (loss) on embedded derivatives represents the gain (loss) from the mark to market of the embedded derivatives on the Sprott gold-linked note as a result of movements in gold prices. The change in the realized and unrealized gain (loss) reflects changes in gold prices for various periods as well as fewer payments remaining on the Sprott gold-linked note at December 31, 2014 compared to December 31, 2013.
Unrealized and realized foreign exchange loss includes unrealized losses from the mark to market of the embedded derivatives on the Sprott gold-linked note and reflects movements in the C$/US$ exchange rate during the periods.
On May 8, 2013, the closing date of the transaction between the Company and IDM (see above under “Discontinued Operations”) the Company’s interest in IDM increased to 22.5% (from approximately 7% before the transaction) and IDM became an associate of Lake Shore Gold. As such, from May 8, 2013 to June 13, 2014), the Company accounted for its interest in IDM under the equity method of accounting.
Prior to the closing date, the Company’s investment in IDM was considered available for sale and marked to market at each period end with changes in value accumulated in other comprehensive income (loss) as part of investment revaluation reserve. The Company recorded a loss of $1.7 million on the transaction (deemed disposition of the available for sale investment in IDM).
On June 13, 2014 the Company’s interest in IDM was diluted to 11.6% (from 22.5%) reflecting Lake Shore Gold’s decision not to participate in a financing by IDM. Effective June 13, 2014 (the “change date”), the investment in IDM was transferred to available for sale investments since IDM is no longer considered an associate of the Company. The Company recorded a gain of $1.0 million on the change date, representing the difference between the Company’s carrying value of the investment in IDM and its market value.
17
On June 4, 2014, the Company repaid $10.0 million on its Standby Line; on December 31, 2014, the Company repaid the remaining $20.0 million on the Standby Line. As a result of the $20.0 payment, the Company wrote down $3.4 million and $2.4 million, respectively, of unamortized debt transaction costs in 2014 and Q4/14.
Expenditures for disputed property taxes — on November 21, 2014, the Company received a notice of reassessment from the City of Timmins, totaling $0.9 million, for additional property taxes payable in respect of the Company’s Timmins West Mine and Bell Creek site (in addition to property taxes the Company had already been assessed and had paid in 2014, and which had been recognized within production costs). The reassessment reflects property values as determined by the Municipal Property Assessment Corporation (“MPAC”). The Company is appealing the property value reassessment and the related taxes payable. Given the complexity of determining the appropriate assessment and the uncertainty of the result of the Company’s appeal, the final amount payable cannot be estimated at this time. In accordance with IFRS, the Company has recognized the maximum amount due of $0.9 million in other income (loss), net. The Company has agreed on a payment schedule with the City of Timmins with respect to the full amount, with $0.3 million paid in December 2014 and the remaining to be paid in 2015, subject to the deduction or refund of any amounts determined not to be payable pursuant to the appeal.
Amortization of deferred premium on flow-through shares of $0.5 million and $0.4 million, respectively for 2014 and Q4/14, is related to the premium on flow through funds raised in 2014 (refer to Financial Condition, Liquidity and Capital resources section for more details on the financing).
Other loss, net, in 2013 includes $0.1 million unrealized loss on certain warrants held by the Company and fully expired as at December 31, 2013, $0.3 million write-off of certain amounts receivable and $0.2 million gain from the sale of one of its non-core green field exploration properties for the same amount.
Share of loss of investments in associates of $0.9 million and $0.3 million, respectively in 2014 and Q4/14 decreased by $1.0 million and $0.6 million compared to the same periods in 2013 and represents the Company’s proportionate share of the losses relating to its equity investments for the periods.
Write down of investments in associates and available for sale investments of $0.8 million for both 2014 and Q4/14 (2013 and Q4/13 - $3.9 million and $0.3 million) reflects the write down of certain available for sale investments and investments in associates to their fair value, as the decline in value was considered significant and prolonged.
Finance expense, net, for 2014 of $18.7 million is $3.4 million higher than in 2013, primarily due to the capitalizing of $6.2 million of borrowing costs in 2013. There were no borrowing costs capitalized on mining interests in 2014 and fourth quarter of 2013 since the Bell Creek Mill expansion was finalized in the third quarter of 2013. Finance expense, net, of $4.3 million for Q4/14 is $0.9 million higher than in the same period in 2013, primarily due to the $1.2 million prepayment fee on the payment of the Standby Line at December 31, 2014.
18
SELECTED ANNUAL FINANCIAL INFORMATION
The following selected financial data has been prepared in accordance with IFRS and should be read in conjunction with the Company’s audited financial statements (in $’000s except for loss per share and number of shares issued and outstanding).
Year ended December 31, | | 2014 | | 2013 | | 2012 | |
Financial Results: | | | | | | | |
Revenue | | $ | 256,144 | | $ | 192,647 | | $ | 133,012 | |
Earnings (loss) from mine operations | | $ | 64,112 | | $ | (200,049 | ) | $ | (220,666 | ) |
Earnings (loss) from continuing operations | | $ | 23,614 | | $ | (229,167 | ) | $ | (246,389 | ) |
Loss from discontinued operations | | $ | — | | $ | (4,302 | ) | $ | (71,543 | ) |
Earnings (loss) per share* - basic and diluted | | $ | 0.06 | | $ | (0.56 | ) | $ | (0.77 | ) |
Earnings (loss) per share* from discontinued operations - basic and diluted | | $ | 0.00 | | $ | (0.01 | ) | $ | (0.17 | ) |
| | | | | | | |
Financial Position: At December 31, | | | | | | | |
Cash and cash equivalents | | $ | 54,370 | | $ | 33,120 | | $ | 48,715 | |
Assets held for sale | | $ | — | | $ | — | | $ | 2,432 | |
Working capital | | $ | 39,784 | | $ | 18,683 | | $ | 28,099 | |
Mining interests | | $ | 527,449 | | $ | 531,585 | | $ | 719,888 | |
Total assets | | $ | 619,678 | | $ | 597,932 | | $ | 823,015 | |
Long term debt | | $ | 89,708 | | $ | 116,686 | | $ | 100,334 | |
Long term finance lease obligations | | $ | 6,851 | | $ | 6,150 | | $ | 2,812 | |
Environmental rehabilitation provision | | $ | 5,640 | | $ | 4,770 | | $ | 5,257 | |
Share capital | | $ | 1,033,623 | | $ | 1,017,262 | | $ | 1,016,524 | |
Equity portion of convertible debentures | | $ | 14,753 | | $ | 14,753 | | $ | 14,753 | |
Reserves | | $ | 32,297 | | $ | 31,388 | | $ | 23,212 | |
Deficit | | $ | (608,621 | ) | $ | (632,235 | ) | $ | (398,766 | ) |
| | | | | | | |
Number of shares issued and outstanding (000s) | | 435,433 | | 416,620 | | 415,654 | |
* Earnings (loss) per share is calculated based on weighted average number of shares outstanding for the year
The loss from mine operations in 2013 and 2012 included impairment charges related to the Timmins West Mine cash generating unit of $225.0 million and $231.0 million, respectively. Excluding the impairment charges, earnings from mine operations in 2013 and 2012, respectively, were $25.0 million and $10.3 million, compared to 64.1 million in 2014. The increase year over year, reflects increased production and revenues as well as decreased cost per units.
The loss from discontinued operations of $4.3 million and $71.5 million, respectively in 2013 and 2012, relates to the sale of the Company’s Mexico subsidiary as discussed under Financial Review, Discontinued Operations above. The loss from discontinued operations in 2012 included an impairment charge of $71.5 million, representing the fair value of the Mexico subsidiary less cost to sell at at December 31, 2012, when the assets and liabilities of the Mexico subsidiary were reclassified as held for sale in the statement of financial position.
19
SUMMARY OF QUARTERLY RESULTS
The following selected financial data has been prepared in accordance with IFRS and should be read in conjunction with the Company’s interim consolidated financial statements ($000’s, other than “per share” amounts):
Fiscal quarter ended | | December 31, 2014 | | September 30, 2014 | | June 30, 2014 | | March 31, 2014 | |
Revenue | | $ | 56,080 | | $ | 63,514 | | $ | 75,091 | | $ | 61,459 | |
Earnings (loss) from mine operations | | $ | 11,889 | | $ | 15,876 | | $ | 22,057 | | $ | 14,290 | |
Finance expense, net | | (4,341 | ) | $ | (4,524 | ) | $ | (4,865 | ) | $ | (4,939 | ) |
Net (loss) earnings | | $ | (1,500 | ) | $ | 7,621 | | $ | 12,906 | | $ | 4,587 | |
Net (loss) earnings per share* basic and diluted | | $ | (0.00 | ) | $ | 0.02 | | $ | 0.03 | | $ | 0.01 | |
Fiscal quarter ended | | December 31, 2013 | | September 30, 2013 | | June 30, 2013 | | March 31, 2013 | |
Revenue | | $ | 65,814 | | $ | 44,301 | | $ | 39,675 | | $ | 42,857 | |
Earnings (loss) from mine operations | | $ | (213,260 | ) | $ | 7,554 | | $ | 1,797 | | $ | 3,860 | |
Finance (expense) income, net | | $ | (5,286 | ) | $ | (3,495 | ) | $ | (2,794 | ) | $ | (3,101 | ) |
Net loss | | $ | (225,693 | ) | $ | (1,718 | ) | $ | (5,446 | ) | $ | (612 | ) |
Loss from discontinued operations | | $ | — | | $ | — | | $ | (4,302 | ) | $ | — | |
Net loss per share* - basic and diluted | | | | | | | | | |
From continuing and discontinued operations | | $ | (0.54 | ) | $ | (0.00 | ) | $ | (0.01 | ) | $ | (0.00 | ) |
From discontinued operations | | $ | 0.00 | | $ | (0.00 | ) | $ | (0.00 | ) | $ | (0.00 | ) |
* Net earnings (loss) per share is calculated based on the weighted average number of shares outstanding for the quarter
The net loss in the Q4/14 compared to net earnings in the previous quarters of the year, largely reflects the impact of lower cash earnings from mine operations due to lower gold sales as well as the write off of the unamortized debt transaction costs ($2.4 million) and the prepayment fee ($1.2 million) related to the Standby Line payment on December 31, 2014.
The loss from mine operations in the Q4/13 included impairment charges related to the Timmins West Mine cash generating unit of $225.0 million. Excluding the impairment charges, earnings from mine operations in the Q4/13 were $11.7 million. Absent the impairment charges, the increase in earnings from mine operations in the Q4/13 compared to the previous quarter was due to higher gold sales and lower production costs, partially offset by lower gold price realized.
FINANCIAL CONDITION, LIQUIDITY AND CAPITAL RESOURCES
As at December 31, 2014 the Company’s cash and bullion was $61.5 million, an increase of $27.5 million from December 31, 2013. In 2014, the Company generated cash from operating activities of $111.3 million which compares to $70.6 million in 2013, with the increase reflecting higher cash earnings from mine operations, resulting from greater sales volumes and lower unit costs.
Receivables and prepaids at December 31, 2014 of $3.7 million are comparable to balances at December 31, 2013 ($3.6 million). Accounts payable and accrued liabilities of $26.5 million at December 31, 2014 are higher than the balance at December 31, 2013 ($21.6 million) primarily due to the timing of payments.
Net cash used in investing activities of $57.3 million in 2014 is $42.4 million lower than in the 2013. The reduction in expenditures reflected the completion of the Company’s mill expansion during the third quarter of 2013, partially offset by approximately $5.0 million spent on exploration drilling in 2014.
20
On December 3, 2014, the Company raised gross proceeds of $15.1 (net proceeds of $14.4 million) through the issuance of 12,900,000 flow-through common shares under a private placement at $1.17 per flow through share. On May 13, 2014, the Company raised gross proceeds of $5.0 million (net proceeds of $5.0 million) through the issuance of 5,300,000 flow-through common shares under a private placement at $0.95 per flow-through share. The Company has until December 31, 2015 to spend the flow-through funds raised on eligible Canadian exploration expenditures (“CEE”). The Company has spent $3.0 million on CEE to December 31, 2014.
On June 14, 2012, the Company signed a financing agreement with Sprott for a credit facility totaling up to $70.0 million, secured by the material assets of the Company. The credit facility involves two components, a $35.0 million gold-linked note and a standby line of credit for an additional $35.0 million. The transaction closed on July 16, 2012, at which time the Company received $35.0 million for the gold-linked note. The Standby Line of $35.0 million was drawn down on February 1, 2013.
On December 12, 2013, the Company entered into a modification agreement (the “Modification Agreement”) with Sprott whereby the Company agreed to repay the balance of the Standby Line through 18 equal monthly payments starting on June 30, 2015 with the final payment due on November 30, 2016. Previously, the Standby Line was due in full on January 1, 2015. The Company repaid $5.0 million of the Standby Line in December 2013, $10.0 million in June 2014 and the remaining $20.0 million on December 31, 2014.
The gold-linked note is being repaid through 29 monthly cash payments, which started on January 31, 2013. The cash payments are based on 947 ounces of gold each month multiplied by the Bloomberg gold closing price on the date prior to payment. The Company paid $15.9 million in 2014 related to the gold-linked note of which $14.7 million was in respect of principal repayments. To December 31, 2014, the Company had made payments totaling $32.3 million related to the gold-linked note (principal and interest), with five monthly payments remaining as of that date. The final payment on the gold-linked note is scheduled to be made on May 29, 2015.
CONTRACTUAL OBLIGATIONS
The Company has various obligations, such as contractual obligations in respect of the various debts, office rent obligations, finance lease obligations and environmental rehabilitation obligations for the Bell Creek Mine and Mill and Timmins West Mine, as at December 31, 2014 as follows (in $’000s):
| | Payments Due by Period | |
Contractual obligations | | Total | | Less than a
year | | 1-3 years | | 4-5 years | | After 5 years | |
Accounts payable and accrued liabilities | | $ | 26,531 | | $ | 26,531 | | $ | — | | $ | — | | $ | — | |
Finance leases and other | | $ | 15,936 | | $ | 7,605 | | $ | 7,642 | | $ | 689 | | $ | — | |
Environmental rehabilitation provision | | $ | 5,640 | | $ | — | | $ | — | | $ | — | | $ | 5,640 | |
Long term debt - principal and interest payments | | $ | 129,452 | | $ | 12,997 | | $ | 116,455 | | $ | — | | $ | — | |
| | $ | 177,559 | | $ | 47,133 | | $ | 124,097 | | $ | 689 | | $ | 5,640 | |
The Company has certain contractual obligations with First Nation communities as provided in the Impact and Benefits Agreement with the Flying Post First Nation and Mattagami First Nation signed on February 17, 2011 and the Exploration Agreement with the Flying Post First Nation, Mattagami First Nation, Matachewan First Nation and Wahgoshig First Nation signed on March
21
10, 2009 (for the exploration and advanced exploration work on the Bell Creek Complex). The agreements establish a framework for ongoing dialogue and consultation, including providing business, employment and training opportunities for members of the First Nation communities.
CAPITAL RESOURCES
The Company’s capital at December 31, 2014 and 2013 is as follows (in $’000):
As at December 31, | | 2014 | | 2013 | |
Share capital | | $ | 1,033,623 | | $ | 1,017,262 | |
Equity portion of convertible debentures | | 14,753 | | 14,753 | |
Reserves | | 32,297 | | 31,388 | |
Deficit | | (608,621 | ) | (632,235 | ) |
Long term debt | | 96,298 | | 130,025 | |
| | $ | 568,350 | | $ | 561,193 | |
The Company believes it has the financial resources available to finance its operations and capital activities on its operating mines and mill based on management’s expectations and assumptions, including in respect of gold prices, production levels and costs. The Company may pursue opportunities to strengthen its balance sheet and financial flexibility if and when required, and may raise additional capital through debt and/or equity markets or any combination as it progresses with its projects and properties.
The debt agreement with Sprott has certain financial covenants, which must be maintained on an ongoing basis. Non-compliance with the covenants could result in the Company having to pay the outstanding balance of the loan. Throughout 2014 and 2013, and as at December 31, 2014 and 2013, the Company was in full compliance with all debt covenants.
The Company and its subsidiaries are not subject to any other externally imposed capital requirements and do not have exposure to asset-backed commercial paper or similar products.
As at March 25, 2015, there were 435,591,224 common shares of the Company issued and outstanding.
OUTSTANDING OPTIONS
As at March 25, 2015 the following options were outstanding:
Number of Options Outstanding | | Exercise Price Range | |
13,630,856 | | $0.37-$0.99 | |
1,935,000 | | $1.00-$1.99 | |
30,000 | | $2.00-$2.99 | |
5,964,000 | | $3.00-$3.99 | |
21,559,856 | | | |
22
NON-GAAP MEASURES
The Company has included in this MD&A certain Non-GAAP (Generally Accepted Accounting Principles) performance measures as detailed below. In the gold mining industry, these are common performance measures but do not have any standardized meaning, and are considered Non-GAAP measures. The Company believes that, in addition to conventional measures prepared in accordance with GAAP, certain investors use such Non-GAAP measures to evaluate the Company’s performance and ability to generate cash flow. Accordingly, they are intended to provide additional information and should not be considered in isolation or as a substitute for measures of performance prepared in accordance with GAAP.
Cash Operating Costs and Cash Operating Cost Per Gold Ounce
Cash operating costs and cash operating cost per ounce are Non-GAAP measures. In the gold mining industry, cash operating costs and cash operating cost per ounce are common performance measures but do not have any standardized meaning.
Cash operating costs are derived from amounts included in the Consolidated Statements of Comprehensive Income (Loss) and include mine site operating costs such as mining, processing and administration as well as royalty expenses, but exclude depreciation, depletion and share-based payment expenses and reclamation costs. Cash operating cost per ounce is based on ounces sold and is calculated by dividing cash operating costs by commercial gold ounces sold; US$ cash operating cost per ounce sold is derived from the cash operating costs per ounce sold translated using the average Bank of Canada C$/US$ exchange rate for the period.
The Company discloses cash operating costs and cash operating cost per ounce as it believes the measures provide valuable assistance to investors and analysts in evaluating the Company’s operational performance and ability to generate cash flow. The most directly comparable measure prepared in accordance with GAAP is total production costs. Cash operating costs and cash operating cost per ounce of gold sold should not be considered in isolation or as a substitute for measures prepared in accordance with GAAP.
Cash operating costs are reconciled to the amounts included in the Consolidated Statements of Comprehensive Income (Loss) as follows (all dollar amounts, other than per ounce, in 000’s):
| | Quarter ended December 31, | | Year ended December 31, | |
| | 2014 | | 2013 | | 2014 | | 2013 | |
Production costs ($’000) | | $ | 28,076 | | $ | 31,952 | | $ | 120,303 | | $ | 107,491 | |
Less share based payments ($’000) | | (113 | ) | (227 | ) | (408 | ) | (530 | ) |
Cash operating costs ($’000) | | $ | 27,963 | | $ | 31,725 | | $ | 119,895 | | $ | 106,961 | |
Gold sales (ounces) | | 41,200 | | 49,650 | | 183,300 | | 135,550 | |
Cash operating cost per ounce of gold ($/ounce) | | $ | 679 | | $ | 640 | | $ | 654 | | $ | 789 | |
Cash operating cost per ounce of gold (US$/ounce) | | $ | 597 | | $ | 609 | | $ | 592 | | $ | 766 | |
Cash Earnings from Mine Operations
Cash earnings from mine operations is a Non-GAAP measure and does not have any standardized meaning. The Company discloses cash earnings from mine operations as it believes this measure provides valuable assistance to investors and analysts in evaluating the Company’s ability to finance its ongoing business and capital activities. The most directly comparable measure prepared in accordance with GAAP is earnings from mine operations. Cash earnings from mine operations represent the earnings from mine operations prior to deducting
23
non-cash expenses, and is calculated by adding depletion, depreciation and share-based payments in production costs to earnings from mine operations.
Cash earnings from mine operations for the three and twelve months ended December 31, 2014 and 2013 are shown below (in 000’s):
| | Quarter ended December 31, | | Year ended December 31, | |
| | 2014 | | 2013 | | 2014 | | 2013 | |
Earnings from mine operations | | $ | 11,889 | | $ | (213,260 | ) | $ | 64,112 | | $ | (200,049 | ) |
Impairment charge | | — | | 225,000 | | — | | 225,000 | |
Depletion and depreciation | | 16,115 | | 22,122 | | 71,729 | | 60,205 | |
Share based payments in production costs | | 113 | | 227 | | 408 | | 530 | |
Cash earnings from mine operations | | $ | 28,117 | | $ | 34,089 | | $ | 136,249 | | $ | 85,686 | |
All-In Sustaining Costs and All-In Sustaining Cost Per Ounce of Gold
All-in sustaining costs and all-in sustaining cost per ounce are Non-GAAP measures. These measures are intended to assist readers in evaluating the total costs of producing gold from current operations. While there is no standardized meaning across the industry for this measure, the Company’s definition conforms to the definition of all-in sustaining costs as set out by the World Gold Council in its guidance note dated June 27, 2013. The Company defines all-in sustaining costs as the sum of production costs, sustaining capital (capital required to maintain current operations at existing levels), corporate general and administrative expenses, in-mine exploration expenses and reclamation cost accretion related to current operations. All-in sustaining costs exclude growth capital, reclamation cost accretion not related to current operations, interest expense, debt repayment and taxes. The costs included in the calculation of all-in sustaining costs are divided by commercial gold ounces sold; US$ all-in sustaining costs per ounce sold are translated using the average Bank of Canada C$/US$ exchange rate for the period.
All-in sustaining costs and all-in sustaining cost per ounce are reconciled to the amounts included in the Consolidated Statements of Comprehensive Income (Loss) as follows (all dollar amounts, other than per ounce, in 000’s):
| | Quarter ended December 31, | | Year ended December 31, | |
| | 2014 | | 2013 | | 2014 | | 2013 | |
Production costs | | $ | 28,076 | | $ | 31,952 | | $ | 120,303 | | $ | 107,491 | |
General and administrative | | 2,567 | | 3,844 | | 13,534 | | 12,555 | |
Rehabilitation - accretion and amortization (operating sites) | | 63 | | 40 | | 195 | | 186 | |
Mine in-site exploration and evaluation costs | | 1,216 | | 1,270 | | 4,486 | | 4,834 | |
Mine development expenditures | | 8,133 | | 6,421 | | 29,667 | | 31,338 | |
Sustaining capital expenditures | | 2,775 | | 652 | | 8,389 | | 2,682 | |
All-in sustaining costs | | $ | 42,830 | | $ | 44,179 | | $ | 176,574 | | $ | 159,086 | |
Gold sales (ounces) | | 41,200 | | 49,600 | | 183,300 | | 135,550 | |
All-in sustaining cost per ounce of gold ($/ounce) | | $ | 1,040 | | $ | 891 | | $ | 963 | | $ | 1,174 | |
All-in sustaining cost per ounce of gold (US$/ounce) | | $ | 915 | | $ | 849 | | $ | 872 | | $ | 1,139 | |
Adjusted Net Earnings
Adjusted net earnings excludes impairment charges, other income/losses (which includes gain/losses and other costs incurred for acquisition and disposal of mining interests, unrealized and non—cash realized gain/losses on financial instruments) as well as significant non-cash non-recurring items. The Company also excludes the net (earnings) losses from the Company’s investments in associates as well as write down/off of investments in associates. The Company
24
excludes these items from net earnings (losses) to provide a measure which allows the Company and investors to evaluate the operating results of the core operations of the Company and its ability to generate operating cash flows to fund working capital requirements, future capital expenditures and service outstanding debt.
Adjusted net earnings are reconciled to the amounts included in the Consolidated Statements of Comprehensive Income (Loss) as follows (all dollar amounts, other than per share, in 000’s):
| | Quarter ended December 31, | | Year ended December 31, | |
| | 2014 | | 2013 | | 2014 | | 2013 | |
Earnings (loss) from continuing operations | | $ | (1,500 | ) | $ | (225,693 | ) | $ | 23,614 | | $ | (229,167 | ) |
Impairment charge | | — | | 225,000 | | — | | 225,000 | |
Share of loss of investments in associates | | 311 | | 871 | | 865 | | 1,833 | |
Write down of investments in associates and available for sale investments | | 807 | | 302 | | 807 | | 3,874 | |
Other loss (income) | | 2,875 | | 1,830 | | 3,284 | | (5,133 | ) |
Adjusted net earnings (loss) | | $ | 2,493 | | $ | 2,310 | | $ | 28,570 | | $ | (3,593 | ) |
Weighted average number of shares outstanding (‘000) | | 426,452 | | 416,620 | | 421,158 | | 416,536 | |
Adjusted net earnings (loss) per share | | $ | 0.01 | | $ | 0.01 | | $ | 0.07 | | $ | (0.01 | ) |
ACCOUNTING POLICIES, STANDARDS AND JUDGMENTS
Changes in Accounting Policies
The Company has adopted the following new standards, along with any consequential amendments, effective January 1, 2014. These changes were made in accordance with the applicable transitional provisions.
IAS 32, Financial instruments: presentation
IAS 32, Financial instruments: presentation (“IAS 32”) was amended by the IASB in December 2011. The amendment clarifies that an entity has a legally enforceable right to offset financial assets and financial liabilities if that right is not contingent on a future event and it is enforceable both in the normal course of business and in the event of default, insolvency or bankruptcy of the entity and all counterparties. The amendment to IAS 32 is effective for annual periods beginning on or after January 1, 2014. The amendment to the standard did not have any impact on the Company’s consolidated financial statements.
IAS 36, Impairment of assets
IAS 36, Impairment of assets (“IAS 36”), was amended by the IASB in May 2013. The amendments require the disclosure of the recoverable amount of impaired assets when an impairment loss has been recognised or reversed during the period and additional disclosures about the measurement of the recoverable amount of impaired assets when the recoverable amount is based on fair value less costs of disposal, including the discount rate when a present value technique is used to measure the recoverable amount. The amendments to IAS 36 are effective for annual periods beginning on or after January 1, 2014. The amendments to the standard did not have any impact on the Company’s consolidated financial statements.
IAS 39, Financial instruments: recognition and measurement
IAS 39, Financial instruments: recognition and measurement (“IAS 39”), was amended by the IASB in June 2013. The amendments clarify that novation of a hedging derivative to a clearing counterparty as a consequence of laws or regulations or the introduction of laws or regulations
25
does not terminate hedge accounting. The amendments to IAS 39 are effective for annual periods beginning on or after January 1, 2014. The amendments to the standard did not have any impact on the Company’s consolidated financial statements.
IFRIC 21, Levies
IFRIC 21, Levies (“IFRIC 21”) was issued in May 2013 and is an interpretation of IAS 37, Provisions, Contingent Liabilities and Contingent Assets. The interpretation clarifies the obligating event that gives rise to a liability to pay a levy. IFRIC 21 is effective for periods beginning on or after January 1, 2014. IFRIC 21 did not have a significant impact on the Company’s consolidated financial statements.
Amendments to IFRS 2, Share-based Payments
In the second quarter of 2014, the IASB issued Amendments to IFRS 2, Share-based Payments. The amendments change the definitions of “vesting condition” and “market condition” in the Standard, and add definitions for “performance condition” and “service condition”. They also clarify that any failure to complete a specified service period, even due to the termination of an employee’s employment or a voluntary departure, would result in a failure to satisfy a service condition. This would result in the reversal, in the current period, of compensation expense previously recorded reflecting the fact that the employee failed to complete a specified service condition. These amendments are effective for transactions with a grant date on or after July 1, 2014. These amendments had no impact on the Company’s consolidated financial statements.
Amendments to IFRS 3, Business Combinations (contingent consideration)
In the second quarter of 2014, the IASB issued Amendments to IFRS 3, Business Combinations. The amendments clarify the guidance in respect of the initial classification requirements and subsequent measurement of contingent consideration. This will result in the need to measure the contingent consideration at fair value at each reporting date, irrespective of whether it is a financial instrument or a non-financial asset or liability. Changes in fair value will need to be recognized in profit and loss. These amendments are effective for transactions with acquisition dates on or after July 1, 2014. These amendments had no impact on the Company’s consolidated financial statements.
Accounting Standards Issued but Not Yet Effective
IFRS 15, Revenue from Contracts and Customers
IFRS 15, Revenue from Contracts and Customers (“IFRS 15”) was issued by the IASB on May 28, 2014, and will replace IAS 18, Revenue, IAS 11, Construction Contracts, and related interpretations on revenue. IFRS 15 sets out the requirements for recognizing revenue that apply to all contracts with customers, except for contracts that are within the scope of the Standards on leases, insurance contracts and financial instruments. IFRS 15 uses a control based approach to recognize revenue which is a change from the risk and reward approach under the current standard. Companies can elect to use either a full or modified retrospective approach when adopting this standard and it is effective for annual periods beginning on or after January 1, 2017. The Company is currently evaluating the impact of IFRS 15 on its consolidated financial statements.
26
IFRS 9, Financial Instruments
IFRS 9, Financial Instruments (“IFRS 9”) was issued by the IASB on July 24, 2014, and will replace IAS 39, Financial Instruments: Recognition and Measurement. IFRS 9 uses a single approach to determine whether a financial asset is measured at amortized cost or fair value, replacing multiple rules in IAS 39. The approach in IFRS 9 is based on how an entity manages its financial instruments in the context of its business model and the contractual cash flow characteristics of the financial assets. Two measurement categories continue to exist to account for financial liabilities in IFRS 9; fair value through profit or loss (“FVTPL”) and amortized cost. Financial liabilities held-for-trading are measured at FVTPL, and all other financial liabilities are measured at amortized cost unless the fair value option is applied. The treatment of embedded derivatives under the new standard is consistent with IAS 39 and is applied to financial liabilities and non-derivative host contracts not within the scope of this standard. The effective date for this standard is for annual periods beginning on or after January 1, 2018. The Company is currently evaluating the impact of IFRS 9 on its consolidated financial statements.
Amendments to IAS 16, Property, Plant and Equipment, and IAS 38, Intangible Assets: Clarification of Acceptable Methods of Depreciation and Amortization
On May 12, 2014, the IASB issued Amendments to IAS 16, Property, Plant and Equipment, and IAS 38, Intangible Assets. In issuing the amendments, the IASB has clarified that the use of revenue-based methods to calculate the depreciation of a tangible asset is not appropriate because revenue generated by an activity that includes the use of a tangible asset generally reflects factors other than the consumption of the economic benefits embodied in the asset. The IASB has also clarified that revenue is generally presumed to be an inappropriate basis for measuring the consumption of the economic benefits embodied in an intangible asset. This presumption for an intangible asset, however, can be rebutted in certain limited circumstances. The amendments are to be applied prospectively for fiscal years beginning on or after January 1, 2016, with early application permitted. The Company is currently evaluating the impact of these amendments on its consolidated financial statements.
IFRS 11, Joint Arrangements
On May 6, 2014 the IASB amended IFRS 11, Joint Arrangements (“IFRS 11”). The amendments add new guidance on how to account for the acquisition of an interest in a joint operation that constitutes a business. The amendments are effective for annual periods beginning on or after January 1, 2016. The Company is currently evaluating the impact of these amendments on its consolidated financial statements.
IFRS 8, Operating Segments
On December 12, 2013 the IASB amended IFRS 8, Operating Segments (“IFRS 8”). The amendments add a disclosure requirement for the aggregation of operating segments and clarify the reconciliation of the total reportable segments’ assets to the entity’s assets. The amendments are effective for annual periods beginning on or after July 1, 2014. The Company is currently evaluating the impact of these amendments on its consolidated financial statements.
IAS 1, Presentation of Financial Statements
On December 18, 2014 the IASB amended IAS 1, Presentation of Financial Statements (“IAS 1”). The amendments to existing IAS 1 requirements relate to materiality; order of the notes; subtotals; accounting policies; and disaggregation. The amendments are effective for annual
27
periods beginning on or after January 1, 2016. The Company is currently evaluating the impact of these amendments on its consolidated financial statements.
IAS 19, Employee Benefits
On November 13, 2013 the IASB amended IAS 19, Employee Benefits (“IAS 19”). The amendments provide additional guidance to IAS 19 on the accounting for contributions from employees or third parties set out in the formal terms of a defined benefit plan. The amendments are effective for annual periods beginning on or after July 1, 2014. IAS 19 was further amended on July 30, 2014. The amendments to IAS 19 clarify the application of the requirements of IAS 19 on determination of the discount rate to a regional market consisting of multiple countries sharing the same currency. The amendments are effective for annual periods beginning on or after January 1, 2016. The amendments do not impact the Company’s consolidated financial statements.
IAS 38, Intangible Assets
On May 12 2014 the IASB amended IAS 38, Intangible Assets (“IAS 38”). The amendments clarify that an amortization method based on revenue is generally presumed to be an inappropriate basis for measuring the consumption of the economic benefits embodied in an intangible asset. However, the amendments provide limited circumstances when a revenue based method can be an appropriate basis for amortization. The amendments are effective for annual periods beginning on or after January 1, 2016. The Company is currently evaluating the impact of these amendments on its consolidated financial statements.
Critical Accounting Judgments and Key Sources of Estimation Uncertainty
In the application of the Company’s accounting policies, which are described in note 3 to the consolidated financial statements for the years ended December 31, 2014 and 2013 (the “Annual Consolidated Financial Statements”), management is required to make judgments, estimates and assumptions about the carrying amount and classification of assets and liabilities that are not readily apparent from other sources. The estimates and associated assumptions are based on historical experience and other factors that are considered to be relevant. Actual results may differ from these estimates.
The estimates and underlying assumptions are reviewed on an ongoing basis. Revisions to accounting estimates are recognized in the period in which the estimate is revised if the revisions affect only that period, or in the period of the revision and future periods, if the revision affects both current and future periods.
The following are the critical judgments and areas involving estimates, that management has made in the process of applying the Company’s accounting policies, and that have the most significant effect on the amount recognized in the consolidated financial statements.
Critical Judgments in Applying Accounting Policies
Commercial production - Operating levels intended by management
Prior to reaching operating levels intended by management, costs incurred are capitalized as part of costs of related mining properties and proceeds from sales are offset against costs capitalized. Depletion of capitalized costs for mining properties begins when operating levels intended by management have been reached. Management considers several factors in determining when a mining property has reached the operating levels intended by management.
28
Determination of functional currency
In accordance with International Accounting Standards (“IAS”) 21, The Effects of Changes in Foreign Exchange Rates, management determined that the functional currency of its Canadian entities is the Canadian dollar, and the functional currency for the Company’s subsidiary in Mexico was the Mexican peso. The Company disposed of its Mexico entity on May 8, 2013.
Key Sources of Estimation Uncertainties
Useful life of plant and equipment
The Company reviews the estimated lives of its plant and equipment at the end of each reporting period. There were no material changes in the lives of plant and equipment for the years ended December 31, 2014 and 2013.
Determination of ore reserves and resources
Reserves and resources are used in the units of production calculation for depreciation, depletion calculations and in the determination of the timing of environmental rehabilitation costs as well as impairment analysis.
There are numerous uncertainties inherent in estimating ore reserves and resources. Assumptions that are valid at the time of estimation may change significantly when new information becomes available. Changes in the forecast prices of commodities, exchange rates, production costs, drilling or recovery rates may change the economic status of reserves and resources and may, ultimately, result in the reserves and resources being revised.
Deferred income taxes
Judgment is required in determining whether deferred tax assets are recognized on the statement of financial position. Deferred tax assets, including those arising from unutilized tax losses require management to assess the likelihood that the Company or/and its subsidiaries will generate taxable earnings in future periods, in order to utilize recognized deferred tax assets. Estimates of future taxable income are based on forecast cash flows from operations and the application of existing tax laws in each jurisdiction. To the extent that future cash flows and taxable income differ significantly from estimates, the ability of the Company or/and its subsidiaries to realize the net deferred tax assets recorded at the statement of financial position date could be impacted. Additionally, future changes in tax laws in the jurisdictions in which the Company and its subsidiaries operates could limit the ability of the Company to obtain tax deductions in future periods.
Impairment of assets
The carrying amounts of mining properties and plant and equipment are reviewed for impairment if events or changes in circumstances indicate that the carrying value may not be recoverable. If there are indicators of impairment, an exercise is undertaken to determine whether the carrying values are in excess of their recoverable amount. Such a review is undertaken on an asset by asset basis, except where such assets do not generate cash flows independent of other assets, and then the review is undertaken at the cash generating unit level.
The assessment requires the use of estimates and assumptions such as, but not limited to, long-term commodity prices, foreign exchange rates, discount rates, future capital requirements, resource estimates, exploration potential and operating performance as well as the Cash
29
Generating Unit (“CGU”) definition. It is possible that the actual fair value could be significantly different from those assumptions, and changes in these assumptions will affect the recoverable amount of the mining interests. In the absence of any mitigating valuation factors, the Company’s failure to achieve its valuation assumptions or declines in the fair values of its CGU or other assets may, over time, result in impairment charges causing the Company to record material losses.
The Company considers both external and internal sources of information in assessing whether there are any indications that mining interests are impaired. External sources of information the Company considers include changes in the market, economic and legal environment in which the Company operates that are not within its control and affect the recoverable amount of mining interests. Internal sources of information the Company considers include the manner in which mining properties and plant and equipment are being used or are expected to be used and indications of economic performance of the assets. In assessing whether there is objective evidence that the Company’s mining interests represented by its investments in associates are impaired, the Company’s management considers observable data including the carrying amounts of the investees’ net assets as compared to their market capitalization.
Environmental rehabilitation
Significant estimates and assumptions are made in determining the environmental rehabilitation costs as there are numerous factors that will affect the ultimate liability payable. These factors include estimates of the extent and costs of rehabilitation activities, technological changes, regulatory changes, cost increases, and changes in discount rates.
Those uncertainties may result in actual expenditures in the future being different from the amounts currently provided. The provision represents management’s best estimate of the present value of the future rehabilitation costs required.
Share-based payments
Management assesses the fair value of stock options granted, PSUs and DSUs in accordance with the accounting policy stated in note 3(m) of the Annual Consolidated Financial Statements. The fair value of stock options granted and DSUs is measured using the Black-Scholes option valuation model; the fair value of PSUs is measured using the Monte Carlo simulation valuation model. The fair value of stock options granted, PSUs and DSUs using valuation models is only an estimate of their potential value and requires the use of estimates and assumptions.
OFF BALANCE SHEET ARRANGEMENTS AND TRANSACTIONS WITH RELATED PARTIES
The Company has not entered into any off balance sheet arrangements or transactions with related parties during the twelve months ended December 31, 2014 and 2013.
RISKS AND CONTROLS
Financial Instruments Risk Exposure
The Company is exposed to financial risks sensitive to changes in commodity prices, foreign exchange and interest rates. The Company’s Board of Directors has overall responsibility for the establishment and oversight of the risk management framework. Currently the Company has not
30
entered into any options, forward and future contracts to manage its price-related exposures. Similarly, derivative financial instruments are not used to reduce these financial risks.
The Company’s risk exposures and the impact on the Company’s financial instruments are summarized below:
Credit Risk
The Company’s credit risk is primarily attributable to receivables, which mainly consist of sales tax due from the Federal Government of Canada. The Company’s surplus cash at December 31, 2014, is invested in very liquid low risk accounts in A rated Canadian Banks. The Company has no significant concentration of credit risk arising from operations. Management believes that the credit risk concentration with respect to financial instruments included in other assets is remote.
Liquidity Risk
The Company’s approach to managing liquidity risk is to ensure that it will have sufficient liquidity to meet liabilities when due. The Company has a planning and budgeting process in place to help determine the funds required to support the Company’s normal operating requirements on an ongoing basis and its expansionary plans. In the normal course of business, the Company enters into contracts that give rise to commitments for future minimum payments as disclosed in the “Contractual Obligations” section on this MD&A. All of the Company’s financial liabilities are subject to normal trade terms.
Market Risk
Interest rate risk
The Company is exposed to interest rate fluctuations related to interest earned on its cash on hand. The Company’s current policy is to invest excess cash in low risk investments with banking institutions. The Company periodically monitors the investments it makes and is satisfied with the credit ratings of its banks and investments.
The Company’s excess cash at December 31, 2014, is invested in liquid and low risk accounts in A rated Canadian Banks. The Company is exposed to short-term interest rates through the interest earned on cash balances. A 1% change in short term rates would change the interest income and net loss of the Company, assuming that all other variables remain constant, by approximately $0.4 million in 2014 (2013 - $0.3 million).
Price risk
The Company is exposed to price risk with respect to fluctuation in gold prices, which impacts the future economic feasibility of its mining interests and cash earnings from its operating mines. The Company is also exposed to price risk with respect to its gold-linked note, which will be repaid using a fixed amount of gold ounces multiplied by the Bloomberg gold closing price on the date of payment.
The Company has not entered into any material derivative financial instruments to manage exposure to price risk. Gold prices are affected by numerous factors such as the sale or purchase of gold by various central banks and financial institutions, interest rates, exchange rates, inflation or deflation, fluctuations in the value of the US dollar and foreign currencies, global and regional supply and demand, and the political and economic conditions of major gold producing countries throughout the world. A 10% change in gold prices would result in an approximately $25.1 million
31
(2013 - $19.5 million) change in the Company’s net earnings; the change in the net earnings in 2014 includes a $Nil (2013 - $0.3 million) change in the mark to market value of gold loan derivatives.
Foreign currency exchange risk
The Company is exposed to foreign currency exchange risk with respect to future gold sales, since gold sales are denominated in United States Dollars (US$) and the Company’s functional currency is Canadian dollar. The movements on US$ rates may impact the future economic feasibility of the Company’s mining interests as well as earnings from its mine operations.
The Company is also exposed to foreign currency exchange risk with respect to the gold-linked note, which will be repaid using a fixed amount of gold ounces multiplied by the Bloomberg gold closing price on the date of payment (gold price is denominated in US$). A 10% change in the US$/CAD$ exchange rate would change the unrealized foreign exchange gain (loss) and net earnings of the Company, assuming that all other variables remains constant, by approximately $0.6 million in 2014 (2013, $0.3 million).
Other Risks and Uncertainties
The most significant risks and uncertainties faced by the Company are: changes in the price of gold; the uncertainty of production estimates, including the ability to extract anticipated tonnes and successfully realize estimated grades; the inherent risk associated with project development and mineral exploration activities; the uncertainty of mineral resources and their development into reserves; uncertainty as to potential project delays from circumstances beyond the Company’s control; and timing of production; as well as title risks and the possible failure to obtain mining licenses.
The success of the Company’s Timmins West Mine, Bell Creek Mine, and its other properties will be primarily dependent on the future price of gold. Metal prices have historically been subject to significant price fluctuation. No assurance may be given that metal prices will remain stable. Significant price fluctuations over short periods of time may be generated by numerous factors beyond the control of the Company, including domestic and international economic and political trends, expectations of inflation, currency exchange fluctuations, interest rates, global or regional consumption patterns, speculative activities and increases or decreases in production due to improved mining and production methods.
Significant reductions or volatility in metal prices may have an adverse effect on the Company’s business, including the economic attractiveness of the Company’s projects, the Company’s ability to obtain financing and the amount of the Company’s revenue or profit or loss. In addition, a prolonged period of lower gold prices could result in the Company breaching one or more covenants in the future with regard to its outstanding credit facility with Sprott.
For a detailed description of Risks and Uncertainties refer to the Company’s Annual Information Form for the year ended December 31, 2014.
Corporate Governance
The Company’s Board of Directors follows accepted corporate governance guidelines for public companies to ensure transparency and accountability to shareholders.
32
The Audit Committee of the Company fulfills its role of ensuring the integrity of the reported information through its review of the interim and audited annual financial statements prior to their submission to the Board of Directors for approval. The Audit Committee, comprised of four independent directors, meets with management and the external auditors of the Company on a quarterly basis to review the financial statements, including the MD&A, and to discuss other financial, operating and internal control matters. The Company also has adopted the practice of engaging its external auditors to perform quarterly reviews of its interim financial statements.
Controls and Procedures
The Company’s management, including the Chief Executive Officer (“CEO”) and the Senior Vice-President and Chief Financial Officer (“CFO”) has evaluated the operating effectiveness of the Company’s internal control over financial reporting. Management of the Company is responsible for establishing and maintaining adequate internal control over financial reporting. Internal control over financial reporting is a process designed by, or under the supervision of, the CEO and CFO and effected by management and other personnel to provide reasonable assurance regarding the reliability of financial reporting and the preparation of financial statements for external purposes in accordance with IFRS. Management assessed the effectiveness of the Company’s internal control over financial reporting as of December 31, 2014. Based on this assessment, management concluded that, as of December 31, 2014, the Company’s internal control over financial reporting was operating effectively. The evaluation was performed using the criteria set forth in the Internal Control-Integrated Framework (1992) issued by the Committee of Sponsoring Organizations of the Treadway Commission (COSO).
Disclosure controls and procedures are designed to provide reasonable assurance that all relevant information is gathered and reported to senior management, including the CEO and CFO on a timely basis so that appropriate decisions can be made regarding annual and interim financial statement disclosure. An evaluation of the effectiveness of the design and operation of disclosure controls and procedures was conducted as of December 31, 2014, by the Company’s management, including the CEO and CFO. Based on this evaluation, the CEO and CFO have concluded that the Company’s disclosure controls and procedures were effective.
Quality Control
Lake Shore Gold has a quality control program to ensure best practices in the sampling and analysis of drill core. Normal practice for all programs has been to insert three Quality Control samples including one blank, one certified standard and one reject duplicate at a frequency of every twenty drill core samples submitted. Subsequent to September 2012, all surface exploration drilling programs have modified the frequency of insertion of the three Quality Control samples to one blank, one certified standard and one reject duplicate every forty drill core samples submitted and, as of March 18, 2013, all underground drilling used this same frequency. The blanks and the certified standards are checked to be within acceptable limits prior to being accepted into the GEMS SQL database. Routine assays have been completed using a standard fire assay with a 30-gram aliquot. For samples that return a value greater than ten grams per tonne gold, the remaining pulp is taken and fire assayed with a gravimetric finish. Select samples are tested with the pulp metallic process.
Underground drilling at the Timmins West and Bell Creek mines utilizes four different core sizes including; NQ with a core diameter of 47.6mm; AQTK with a core diameter of 30.5mm; BQTK which has a core diameter of 40.7mm; and BQ which has a core diameter of 36.4mm. Most underground definition and delineation drilling is done with AQTK, BQTK or BQ with any
33
underground exploration core with NQ. All surface exploration drilling is done with NQ. Sampling of drill core is conducted in standard intervals with most BQTK, BQ and AQTK sized core being whole core sampled and selected core from underground as well as all surface exploration core being saw cut. For core that is saw cut, the remaining half is stored in a secure location.
Gold analysis for drill core from underground drilling has utilized four analytical laboratories. All drill core from underground drilling is analyzed at either ALS Canada Ltd. (2090 Riverside Drive, Timmins and 2103 Dollarton Hwy, North Vancouver), Activation Laboratories (1752 Riverside Drive, Timmins) or Accurassay Laboratories (150A Jaguar Drive Timmins and 1046 Gorham Street, Thunder Bay, not used since May, 2013) and select drill core, test holes and production samples at Lake Shore Gold Corp.’s Bell Creek Complex mill laboratory. ALS Canada Ltd. is ISO 9001:2008 and ISO 17025 certified and Accurassay conforms to requirements of CAN P–4E ISO/IEC 17025, and CAN–P–1579, not used since May, 2013). Activation Laboratories Ltd. in Timmins is ISO 9001 certified and follows their fully certified main Ancaster, Ontario Lab analytical procedures (working towards ISO 17025 CANP4E in early 2014). Lake Shore Gold Corp’s Bell Creek mill laboratory is not ISO registered. All gold analysis for recent surface drilling is performed at ALS Canada Ltd. and Activation Laboratories.
Qualified Persons
Scientific and technical information contained in this MD&A related to mining operations and reserves has been reviewed and approved by Natasha Vaz, P.Eng., Vice-President, Technical Services, who is an employee of Lake Shore Gold Corp., and a “qualified person” as defined by National Instrument 43-101 – Standards of Disclosure for Mineral Projects (“NI 43-101”).
Scientific and technical information related to resources, drilling and all matters involving mine production geology contained in this MD&A or source material, was reviewed and approved by Eric Kallio, P.Geo., Senior Vice-President, Exploration. Mr. Kallio is an employee of Lake Shore Gold Corp., and is a “qualified person” as defined by NI 43-101.
FORWARD-LOOKING STATEMENTS
All statements, other than statements of historical fact, contained or incorporated by reference in this MD&A including, but not limited to, any information as to the future financial or operating performance of Lake Shore Gold Corp., constitute “forward-looking information” or “forward-looking statements” within the meaning of certain securities laws, including the provisions of the Securities Act (Ontario) and the provisions for “safe harbor” under the United States Private Securities Litigation Reform Act of 1995, and are based on expectations, estimates and projections as of the date of this MD&A or, in the case of documents incorporated by reference herein, as of the date of such documents. Forward-looking statements are provided for the purpose of providing information about management’s expectations and plans relating to the future. All of the forward-looking statements made in this MD&A are qualified by these cautionary statements and those made in our other filings with the securities regulators of Canada and the Securities Exchange Commission.
Other than as specifically required by law, the Company does not intend, and does not assume any obligation, to explain any material difference between subsequent actual events and such forward-looking statements, or to update any forward-looking statement to reflect events or circumstances after the date on which such statement is made or to reflect the occurrence of unanticipated events, whether as a result of new information, future events or results or
34
otherwise. These forward-looking statements represent management’s best judgment based on facts and assumptions that management considers reasonable, including that: there are no significant disruptions affecting operations, whether due to labour disruptions, supply disruptions, power disruptions, damage to equipment or otherwise; permitting, development, operations, expansion and acquisitions at the Timmins West Complex continue on a basis consistent with the Company’s current expectations; permitting, development and operations at the Bell Creek Complex continue on a basis consistent with the Company’s current expectations; the exchange rate between the Canadian dollar and the U.S. dollar stays approximately consistent with current levels; price assumptions for gold hold true; prices for fuel, electricity and other key supplies remains consistent with current levels; production and cost of sales forecasts meet expectations; the accuracy of the Company’s current mineral reserve and mineral resource estimates hold true; and labour and materials costs increase on a basis consistent with the Company’s current expectations. The Company makes no representation that reasonable business people in possession of the same information would reach the same conclusions.
Forward-looking statements include, but are not limited to, possible events, statements with respect to possible events, statements with respect to the future price of gold and other metals, the estimation of mineral resources and reserves, the realization of mineral reserve and resource estimates, the timing and amount of estimated future production, costs of production, expected capital expenditures, costs and timing of the development of new deposits, success of exploration and development activities, permitting time lines, currency fluctuations, requirements for additional capital, government regulation of exploration and mining operations, environmental risks, unanticipated reclamation expenses, title disputes or claims, completion of acquisitions and their potential impact on the Company and its operations, limitations on insurance coverage and the timing and possible outcome of pending litigation. In certain cases, forward-looking statements can be identified by the use of words such as “plans”, “expects” or “does not expect”, “is expected”, “budget”, “scheduled”, “estimates”, “forecasts”, “intends”, “anticipates” or “does not anticipate”, or “believes”, or variations of such words and phrases or statements that certain actions, events or results “may”, “could”, “would”, “might” or “will be taken”, “occur” or “be achieved”.
Forward-looking statements involve known and unknown risks, uncertainties and other factors which may cause the actual results, performance or achievements of the Company to be materially different from any future results, performance or achievements expressed or implied by the forward-looking statements. As well as those factors discussed in the section entitled “Risks and Uncertainties” in this MD&A and in the section entitled “Risk Factors” in the Company’s most recently filed AIF, known and unknown risks which could cause actual results to differ materially from projections in forward-looking statements include, among others: fluctuations in the currency markets; fluctuations in the spot and forward price of gold or certain other commodities (such as diesel fuel and electricity); changes in interest rates; changes in national and local government legislation, taxation, controls, regulations and political or economic developments in Canada or other countries in which the Company may carry on business in the future; business opportunities that may be presented to, or pursued by, the Company; the Company’s ability to integrate acquisitions successfully; operating or technical difficulties in connection with mining or development activities; employee relations; the speculative nature of gold exploration and development, including the risks of obtaining necessary licenses and permits; diminishing quantities or grades of reserves; and contests over title to properties, particularly title to undeveloped properties. In addition, there are risks and hazards associated with the business of gold exploration, development and mining, including environmental hazards, industrial accidents,
35
unusual or unexpected formations, pressures, cave-ins, flooding and gold bullion losses (and the risk of inadequate insurance, or the inability to obtain insurance, to cover these risks).
Although the Company has attempted to identify important factors (which it believes are reasonable) that could cause actual actions, events or results to differ materially from those described in forward-looking statements, there may be other factors that cause actions, events or results not to be as anticipated, estimated or intended. There can be no assurance that forward-looking statements will prove to be accurate, as actual results and future events could differ materially from those anticipated in such statements. Accordingly, readers should not place undue reliance on forward-looking statements.
ADDITIONAL INFORMATION
Additional information relating to the Company is provided in the Company’s audited consolidated financial statements for the year ended December 31, 2014, its Annual Information Form for the year ended December 31, 2014, and its most recently filed Information Circular. These and other documents relating to the Company are available on SEDAR at www.sedar.com.
36
LAKE SHORE GOLD CORP.
Consolidated Financial Statements
(December 31, 2014 and 2013)
Management’s Responsibility for Financial Reporting
The accompanying consolidated financial statements have been prepared by management and are in accordance with International Financial Reporting Standards as issued by the International Accounting Standards Board (“IASB”). Other information contained in this document has also been prepared by management and is consistent with the data contained in the consolidated financial statements. A system of internal controls has been developed and is maintained by management to provide reasonable assurance that assets are safeguarded and financial information is accurate and reliable.
The Board of Directors approves the financial statements and ensures that management discharges its financial reporting responsibilities. The Board’s review is accomplished principally through the audit committee, which is composed of non-executive directors. The audit committee meets periodically with management and the auditors to review financial reporting and control matters.
/s/ Anthony Makuch | | /s/ Philip C. Yee |
| | |
Anthony Makuch | | Philip C. Yee |
Chief Executive Officer | | Senior Vice President and Chief Financial Officer |
March 25, 2015
Toronto, Canada
2
Management’s Report on Internal Controls Over Financial Reporting
The management of Lake Shore Gold Corp. (the “Company”) is responsible for establishing and maintaining adequate internal controls over financial reporting. The Company’s internal controls over financial reporting are reviewed and approved by the Chief Executive Officer and the Senior Vice President and Chief Financial Officer with the expectation of providing reasonable assurance regarding the reliability of financial reporting and the preparation of financial statements for external purposes in accordance with International Financial Reporting Standards as issued by the IASB.
Due to its inherent limitations, internal controls over financial reporting may not prevent or detect misstatements on a timely basis. Also, projections regarding the effectiveness of these controls applicable to future periods are subject to risk and may not be sufficient to meet the degree of compliance required to comply with the policies or procedures in the future.
��
Management conducted an assessment of the Company’s internal controls over financial reporting based on the “Internal Control-Integrated Framework (1992)” established by the Committee of Sponsoring Organizations of the Treadway Commission (“COSO”). Based on that assessment, the Chief Executive Officer and Senior Vice President and Chief Financial Officer concluded the Company’s internal controls over financial reporting were effective as of December 31, 2014. There were no material weaknesses identified by management as of December 31, 2014.
/s/ Anthony Makuch | | /s/ Philip C. Yee |
| | |
Anthony Makuch | | Philip C. Yee |
Chief Executive Officer | | Senior Vice President and Chief Financial Officer |
March 25, 2015
Toronto, Canada
3
Independent Auditor’s Report
To the Shareholders and Board of Directors of Lake Shore Gold Corp.
We have audited the accompanying consolidated financial statements of Lake Shore Gold Corp. (the “Company”), which comprise the consolidated statements of financial position as at December 31, 2014 and December 31, 2013, and the consolidated statements of comprehensive income (loss), consolidated statements of changes in equity and consolidated statements of cash flows for the years then ended, and a summary of significant accounting policies and other explanatory information.
Management’s Responsibility for the Consolidated Financial Statements
Management is responsible for the preparation and fair presentation of these consolidated financial statements in accordance with International Financial Reporting Standards as issued by the International Accounting Standards Board, and for such internal control as management determines is necessary to enable the preparation of consolidated financial statements that are free from material misstatement, whether due to fraud or error.
Auditor’s Responsibility
Our responsibility is to express an opinion on these consolidated financial statements based on our audits. We conducted our audits in accordance with Canadian generally accepted auditing standards. Those standards require that we comply with ethical requirements and plan and perform the audit to obtain reasonable assurance about whether the consolidated financial statements are free from material misstatement.
An audit involves performing procedures to obtain audit evidence about the amounts and disclosures in the consolidated financial statements. The procedures selected depend on the auditor’s judgment, including the assessment of the risks of material misstatement of the consolidated financial statements, whether due to fraud or error. In making those risk assessments, the auditor considers internal control relevant to the entity’s preparation and fair presentation of the consolidated financial statements in order to design audit procedures that are appropriate in the circumstances, but not for the purpose of expressing an opinion on the effectiveness of the entity’s internal control. An audit also includes evaluating the appropriateness of accounting policies used and the reasonableness of accounting estimates made by management, as well as evaluating the overall presentation of the consolidated financial statements.
We believe that the audit evidence we have obtained in our audits is sufficient and appropriate to provide a basis for our audit opinion.
Opinion
In our opinion, the consolidated financial statements present fairly, in all material respects, the financial position of Lake Shore Gold Corp. as at December 31, 2014 and December 31, 2013, and its financial performance and its cash flows for the years then ended in accordance with International Financial Reporting Standards as issued by the International Accounting Standards Board.
“Deloitte LLP”
Chartered Professional Accountants, Chartered Accountants
Licensed Public Accountants
March 25, 2015
Toronto, Canada
4
CONSOLIDATED STATEMENTS OF FINANCIAL POSITION
(in thousands of Canadian dollars)
As at December 31, | | Note | | 2014 | | 2013 | |
| | | | | | | |
Assets | | | | | | | |
Current assets | | | | | | | |
Cash and cash equivalents | | | | $ | 54,370 | | $ | 33,120 | |
Receivables and prepaids | | 9 | | 3,697 | | 3,589 | |
Inventories and stockpiled ore | | 10 | | 25,450 | | 20,378 | |
| | | | 83,517 | | 57,087 | |
Non-current assets | | | | | | | |
Available for sale investments | | 11 | | 708 | | 416 | |
Investments in associates | | 12 | | 586 | | 1,749 | |
Restricted cash | | 13 | | 7,418 | | 7,095 | |
Mining interests | | 14 | | 527,449 | | 531,585 | |
| | | | $ | 619,678 | | $ | 597,932 | |
| | | | | | | |
Liabilities | | | | | | | |
Current liabilities | | | | | | | |
Accounts payable and accrued liabilities | | 15 | | $ | 26,531 | | $ | 21,619 | |
Current portion of finance lease obligations | | 16 | | 7,090 | | 3,446 | |
Current portion of long term debt | | 17 | | 6,590 | | 13,339 | |
Current portion of share based liabilities | | 18 | | 394 | | — | |
Deferred premium on flow-through shares | | 21 | | 3,128 | | — | |
| | | | 43,733 | | 38,404 | |
Non-current liabilities | | | | | | | |
Finance lease obligations | | 16 | | 6,851 | | 6,150 | |
Long term debt | | 17 | | 89,708 | | 116,686 | |
Share-based liabilities | | 18 | | 1,694 | | 754 | |
Environmental rehabilitation provision | | 19 | | 5,640 | | 4,770 | |
| | | | 103,893 | | 128,360 | |
| | | | | | | |
Shareholders’ Equity | | | | | | | |
Share capital | | | | 1,033,623 | | 1,017,262 | |
Equity portion of convertible debentures | | 17 | (b) | 14,753 | | 14,753 | |
Reserves | | | | 32,297 | | 31,388 | |
Deficit | | | | (608,621 | ) | (632,235 | ) |
| | | | 472,052 | | 431,168 | |
| | | | $ | 619,678 | | $ | 597,932 | |
Subsequent events (note 14)
Commitments and contractual obligations (note 27)
See accompanying notes to the consolidated financial statements
Approved by the Board
/s/ Alan Moon | | /s/ Arnold Klassen |
Alan C. Moon | | Arnold Klassen |
Director | | Director |
5
CONSOLIDATED STATEMENTS OF COMPREHENSIVE INCOME (LOSS)
(in thousands of Canadian dollars, except per share amounts)
For the years ended December 31, | | Note | | 2014 | | 2013 | |
| | | | | | | |
Revenue | | | | $ | 256,144 | | $ | 192,647 | |
Production costs | | 6 | | (120,303 | ) | (107,491 | ) |
Depletion and depreciation | | | | (71,729 | ) | (60,205 | ) |
Impairment charge | | 14 | | — | | (225,000 | ) |
Earnings (loss) from mine operations | | | | 64,112 | | (200,049 | ) |
General and administrative | | | | (13,534 | ) | (12,555 | ) |
Exploration and evaluation | | 14 | | (3,339 | ) | (1,313 | ) |
Share of loss of investments in associates | | 12 | | (865 | ) | (1,833 | ) |
Write down of investments in associates and available for sale investments | | 11,12 | | (807 | ) | (3,874 | ) |
Earnings (loss) from operations and associates | | | | 45,567 | | (219,624 | ) |
| | | | | | | |
Other (loss) income, net | | 7 | | (3,284 | ) | 5,133 | |
| | | | | | | |
Finance items | | 8 | | | | | |
Finance income | | | | 691 | | 706 | |
Finance expense | | | | (19,360 | ) | (15,382 | ) |
Earnings (loss) from continuing operations | | | | 23,614 | | (229,167 | ) |
Loss from discontinued operations | | 12 | (a(i)) | — | | (4,302 | ) |
Net earnings (loss) | | | | $ | 23,614 | | $ | (233,469 | ) |
| | | | | | | |
Other comprehensive income (loss) | | | | | | | |
Items that may be reclassified subsequently to profit or loss | | | | | | | |
Other comprehensive (loss) income from continuing operations, net of tax | | | | | | | |
Unrealized gain on available for sale investments, net of tax | | 11,12 | (a(ii)) | (237 | ) | 1,786 | |
| | | | | | | |
Other comprehensive income from discontinued operations | | | | | | | |
| | | | | | | |
Exchange differences on translation of foreign operations | | 12 | (a(i)) | — | | 3,967 | |
Comprehensive income (loss) from continuing operations | | | | $ | 23,377 | | $ | (227,381 | ) |
Comprehensive loss from discontinued operations | | | | $ | — | | $ | (335 | ) |
Total comprehensive income (loss) | | | | $ | 23,377 | | $ | (227,716 | ) |
| | | | | | | |
Basic and diluted income (loss) per share | | 21 | (c) | | | | |
Earnings (loss) per share from continuing operations | | | | $ | 0.06 | | $ | (0.55 | ) |
Earnings (loss) per share | | | | $ | 0.06 | | $ | (0.56 | ) |
| | | | | | | |
Weighted average number of common shares outstanding (in 000’s) | | 21 | (c) | | | | |
Basic | | | | 421,158 | | 416,536 | |
Diluted | | | | 426,325 | | 416,536 | |
See accompanying notes to the consolidated financial statements
6
CONSOLIDATED STATEMENTS OF CASH FLOWS
(in thousands of Canadian dollars)
For the years ended December 31, | | Note | | 2014 | | 2013 | |
| | | | | | | |
Operating Activities | | | | | | | |
Net earnings (loss) from continuing operations | | | | $ | 23,614 | | $ | (229,167 | ) |
Impairment charge | | | | — | | 225,000 | |
Depletion and depreciation | | | | 71,775 | | 60,316 | |
Share-based payments expense | | 18,21 | (b(iv)) | 2,668 | | 2,621 | |
Share of loss of investments in associates | | | | 865 | | 1,833 | |
Write down of investments | | | | 807 | | 3,874 | |
Other loss (income), net | | | | 3,284 | | (5,133 | ) |
Realized derivative and foreign exchange gain, net | | 17 | (a(i)) | (2,976 | ) | (2,114 | ) |
Finance income | | | | (691 | ) | (706 | ) |
Interest received | | | | 592 | | 629 | |
Finance expense | | | | 19,360 | | 15,382 | |
Interest paid | | | | (8,907 | ) | (10,120 | ) |
Change in non-cash operating working capital | | 23 | | 865 | | 8,232 | |
Net cash flow provided by continuing operating activities | | | | $ | 111,256 | | $ | 70,647 | |
| | | | | | | |
Investing Activities | | | | | | | |
Additions to mining interests, including movements in working capital | | | | (56,952 | ) | (99,901 | ) |
Restricted cash | | | | (323 | ) | — | |
Proceeds from sale of mining interest | | | | — | | 200 | |
Net cash flow used in investing activities | | | | (57,275 | ) | (99,701 | ) |
| | | | | | | |
Financing Activities | | | | | | | |
Long term debt payments | | 17 | (a) | (47,054 | ) | (21,453 | ) |
Proceeds from long term debt, net of transaction costs | | 17 | (a,b) | — | | 33,450 | |
Proceeds from sale lease back | | 16 | | — | | 7,300 | |
Payment of finance lease obligations | | | | (5,522 | ) | (5,739 | ) |
Common shares issued for cash (net of share issue costs) | | 21 | (a) | 19,310 | | — | |
Exercise of stock options | | | | 494 | | 23 | |
Net cash flow (used in) provided by financing activities of continuing operations | | | | (32,772 | ) | 13,581 | |
| | | | | | | |
Impact of foreign exchange on cash balances | | | | 41 | | (122 | ) |
| | | | | | | |
Increase (decrease) in cash and cash equivalents during the year | | | | $ | 21,250 | | $ | (15,595 | ) |
Cash and cash equivalents at beginning of year | | | | 33,120 | | 48,715 | |
Cash and cash equivalents at end of year | | | | $ | 54,370 | | $ | 33,120 | |
Supplemental cash flow information note 23
See accompanying notes to the consolidated financial statements
7
LAKE SHORE GOLD CORP.
CONSOLIDATED STATEMENTS OF CHANGES IN EQUITY
(in thousands of Canadian dollar except for share information)
| | | | Share capital | | Equity | | Reserves | | | | | |
| | Note | | Shares (‘000s) | | Amount | | portion of
convertible
debentures | | Warrants | | Share-based
payments | | Investment
revaluation
reserve | | Deficit | | Equity | |
At January 1, 2014 | | | | 416,620 | | $ | 1,017,262 | | $ | 14,753 | | $ | 2,469 | | $ | 28,682 | | $ | 237 | | $ | (632,235 | ) | $ | 431,168 | |
Shares issued as part of various agreements | | 21 | (a) | 50 | | 45 | | — | | — | | — | | — | | — | | 45 | |
Flow-through shares issued | | 21 | (a) | 18,200 | | 15,652 | | — | | — | | — | | — | | — | | 15,652 | |
Share-based payments | | 21 | (b(iv)) | — | | — | | — | | — | | 1,334 | | — | | — | | 1,334 | |
Stock-options exercised (including transfer from reserves of $188) | | 21 | (b(ii)) | 563 | | 664 | | — | | — | | (188 | ) | — | | — | | 476 | |
Net earnings and comprehensive income | | | | — | | — | | — | | — | | — | | — | | 23,614 | | 23,614 | |
Other comprehensive loss, net of tax | | | | — | | — | | — | | — | | — | | (237 | ) | — | | (237 | ) |
Total comprehensive income | | | | | | | | | | | | | | (237 | ) | 23,614 | | 23,377 | |
At December 31, 2014 | | | | 435,433 | | $ | 1,033,623 | | $ | 14,753 | | $ | 2,469 | | $ | 29,828 | | $ | — | | $ | (608,621 | ) | $ | 472,052 | |
| | | | Share capital | | | | Reserves | | | | | |
| | Note | | Shares
(‘000s) | | Amount | | Equity portion of
convertible
debentures | | Warrants | | Share-based
payments | | Currency
translation
adjustment | | Investment
revaluation
reserve | | Deficit | | Shareholders’
equity | |
At January 1, 2013 | | | | 415,654 | | $ | 1,016,524 | | $ | 14,753 | | $ | 2,469 | | $ | 26,259 | | $ | (3,967 | ) | $ | (1,549 | ) | $ | (398,766 | ) | $ | 655,723 | |
Shares issued as part of agreements (net of share issue costs of $30) | | 21 | (a) | 936 | | 702 | | — | | — | | — | | — | | — | | — | | 702 | |
Share-based payments | | 21 | (b(iv)) | — | | — | | — | | — | | 2,436 | | — | | — | | — | | 2,436 | |
Stock-options exercised (including transfer from share based payments reserve of $13) | | 21 | (b(ii)) | 30 | | 36 | | — | | — | | (13 | ) | — | | — | | — | | 23 | |
Net loss | | | | | | | | | | | | | | | | | | $ | (233,469 | ) | (233,469 | ) |
Other comprehensive income, net of tax | | | | | | | | | | | | | | 3,967 | | 1,786 | | — | | 5,753 | |
Total comprehensive income | | | | | | | | | | | | | | 3,967 | | 1,786 | | (233,469 | ) | (227,716 | ) |
At December 31, 2013 | | | | 416,620 | | $ | 1,017,262 | | $ | 14,753 | | $ | 2,469 | | $ | 28,682 | | $ | — | | $ | 237 | | $ | (632,235 | ) | $ | 431,168 | |
8
LAKE SHORE GOLD CORP.
NOTES TO THE CONSOLIDATED FINANCIAL STATEMENTS
FOR THE YEARS ENDED DECEMBER 31, 2014 AND 2013
(in thousands of Canadian dollars, except per share amounts)
1. DESCRIPTION OF BUSINESS AND NATURE OF OPERATIONS
Lake Shore Gold Corp. (“Lake Shore Gold” or the “Company”) is a publicly listed company, incorporated in Canada; the Company’s shares are traded on the Toronto Stock Exchange and on the NYSE MKT stock exchange. The head office, principal address and record office are located at 181 University Avenue, Suite 2000, Toronto, Ontario, Canada, M5H 3M7. The Company is primarily engaged in the operation, exploration and development of three gold complexes located in the Timmins Gold Camp in Timmins, Ontario; the Company also has certain exploration properties in Quebec. The Company is in commercial production at its Timmins West Mine and Bell Creek Mine.
2. BASIS OF PREPARATION
Statement of Compliance
These consolidated financial statements have been prepared in accordance with International Financial Reporting Standards (“IFRS”) as issued by the International Accounting Standards Board (“IASB”). The consolidated financial statements were approved by the Board of Directors of the Company on March 25, 2015.
These consolidated financial statements have been prepared under the historical cost convention, except for certain financial instruments measured at fair value, as set out in the accounting policies in note 3.
The preparation of consolidated financial statements in accordance with IFRS requires the use of certain critical accounting estimates. It also requires management to exercise its judgment in the process of applying the Company’s accounting policies. The areas involving a higher degree of judgment or complexity, or areas where assumptions and estimates are significant to the consolidated financial statements are disclosed in note 4.
3. SIGNIFICANT ACCOUNTING POLICIES
The principal accounting policies are set out below:
a) Basis of presentation and consolidation
The consolidated financial statements incorporate the financial statements of the Company and its subsidiaries. Subsidiaries are those entities controlled by the Company. Control exists when the Company is exposed or has rights to the variable returns from the subsidiary and has the ability to affect those returns through its power over the subsidiary. Power is defined as existing rights that give the Company the ability to direct the relevant activities of the subsidiary. The financial statements of the subsidiaries are included in the consolidated financial statements from the date that control is transferred to the Company to the date control ceases. All intercompany transactions, balances, income and expenses are eliminated in full upon consolidation.
An associate is an entity over which the Company has significant influence and that is neither a subsidiary nor an interest in a joint venture. The Company is presumed to have significant influence if it holds, directly or indirectly, 20% or more of the voting power of the investee. If the Company holds less than 20% of the voting power, other relevant factors are examined by the Company to determine whether it has significant
9
LAKE SHORE GOLD CORP.
NOTES TO THE CONSOLIDATED FINANCIAL STATEMENTS
FOR THE YEARS ENDED DECEMBER 31, 2014 AND 2013
(in thousands of Canadian dollars, except per share amounts)
influence. The factors that may enable the exercise of significant influence include the proportion of seats on the board being assigned to the Company, nature of the business decisions that require unanimous consent of the directors, ability to influence the operating, strategic and financing decisions and the existing ownership composition vis-à-vis the Company’s ability to exercise significant influence.
The subsidiaries and associates of the Company as at December 31, 2014 and their principal activities are described below:
Name | | Place of
Incorporation | | Proportion of
Ownership Interest | | Principal Activity |
Subsidiaries | | | | | | |
LSG Holdings Corp. | | British Columbia | | 100 | % | Not active* |
Associates | | | | | | |
Northern Superior Resources | | British Columbia | | 23.78 | % | Exploration |
*In process of winding-up
The financial statements of subsidiaries are prepared for the same reporting periods as the Company, using consistent accounting policies. Where necessary, adjustments are made to bring the accounting policies of the Company’s associates in line with those of the Company. All intercompany balances and transactions have been eliminated upon consolidation.
b) Investments in associates
The Company’s investments in associates are accounted for using the equity method of accounting. Under the equity method, the Company’s investment in an associate is initially recognized at cost and subsequently increased or decreased to recognize the Company’s share of earnings and losses of the associate and for impairment losses after the initial recognition date. The Company’s share of an associate’s losses that are in excess of its investment in the associate are recognized only to the extent that the Company has incurred legal or constructive obligations or made payments on behalf of the associate. The Company’s share of earnings and losses of associates are recognized in net earnings (loss) during the period.
After application of the equity method, the Company determines whether it is necessary to recognize an impairment loss on the Company’s investment in an associate. The Company determines at each statement of financial position date whether there is any objective evidence that the investment in the associate is impaired. If this is the case, the Company calculates the amount of impairment as the difference between the recoverable amount of the associate and its carrying value and recognizes the amount in net earnings (loss). When a group entity transacts with an associate of the Company, profit and losses are eliminated to the extent of the Company’s interest in the relevant associate.
10
LAKE SHORE GOLD CORP.
NOTES TO THE CONSOLIDATED FINANCIAL STATEMENTS
FOR THE YEARS ENDED DECEMBER 31, 2014 AND 2013
(in thousands of Canadian dollars, except per share amounts)
c) Non-current assets held for sale and discontinued operations
Non-current assets are classified as held for sale if their carrying amount will be recovered principally through a sale transaction rather than through continuing use. This condition is regarded as met only when the sale is highly probable and the non-current asset (or disposal group) is available for sale in its present condition. Management must be committed to the sale, which should be expected to qualify for recognition as a completed sale within one year from the date of classification.
When the Company is committed to a sale plan involving loss of control of a subsidiary, all of the assets and liabilities of that subsidiary are classified as held for sale when the criteria described in the above paragraph are met, regardless of whether the Company will retain a non-controlling interest in its former subsidiary after the sale.
A discontinued operation is a component of an entity that either has been disposed of, or that is classified as held for sale, and represents a separate major line of business or geographical area of operations, is a part of a single coordinated plan to dispose of a separate major line of business or geographical area of operations, or is a subsidiary acquired exclusively with a view to resale.
Non-current assets classified as held for sale and discontinued operations are measured at the lower of carrying amount or fair value less costs to sell. Any gain or loss from disposal of a business, together with the results of these operations until the date of disposal, is reported separately as discontinued operations. The financial information of discontinued operations is excluded from the respective captions in the consolidated financial statements and related notes for all years presented.
d) Foreign currency translation
The functional currency for each entity consolidated with the Company is determined by the currency of the primary economic environment in which it operates (the “functional currency”). The consolidated financial statements are presented in Canadian dollars, which is the Company’s functional and reporting currency.
In preparing the financial statements of the individual entities, transactions in currencies other than the entity’s functional currency (foreign currencies) are recognized at the rates of exchange prevailing at the dates of the transactions. At the end of each reporting period, monetary items denominated in foreign currencies are retranslated at the rates prevailing at that date. Non-monetary items carried at fair value that are denominated in foreign currencies are translated at the rates prevailing at the date when the fair value was determined. Non-monetary items that are measured in terms of historical cost in a foreign currency are translated at the rate on the date of transaction.
Foreign operations are translated from their functional currencies into Canadian dollars on consolidation by applying the exchange rate at period-end for assets and liabilities and the average exchange rate for profit and loss items. Exchange differences, including differences that arise relating to long-term intercompany balances that form part of the net investment in a foreign operation, are recognized in other comprehensive income (loss) (as exchange differences on translation of foreign operations). Fair value adjustments arising on the acquisition of a foreign entity are treated as assets and liabilities of the foreign entity and translated
11
LAKE SHORE GOLD CORP.
NOTES TO THE CONSOLIDATED FINANCIAL STATEMENTS
FOR THE YEARS ENDED DECEMBER 31, 2014 AND 2013
(in thousands of Canadian dollars, except per share amounts)
at the closing rate. On the disposal of a foreign operation the accumulated exchange differences in respect of that operation are reclassified to net earnings (loss).
e) Financial instruments
Financial assets and liabilities are recognized when the Company or its subsidiaries become party to the contracts that give rise to them and are classified as loans and receivables, financial instruments fair valued through profit or loss, held-to-maturity, available-for-sale financial assets and other liabilities, as appropriate. The Company considers whether a contract contains an embedded derivative when the entity first becomes a party to it. The embedded derivatives are separated from the host contract if the host contract is not measured at fair value through profit or loss and when the economic characteristics and risks are not closely related to those of the host contract. Reassessment only occurs if there is a change in the terms of the contract that significantly modifies the cash flows that would otherwise be required.
Financial assets at fair value through profit or loss (“FVTPL”)
Financial assets at FVTPL include financial assets held for trading and financial assets designated upon initial recognition as at FVTPL. A financial asset is classified in this category principally for the purpose of selling in the short term, or if so designated by management. The Company holds warrants in certain public companies; the warrants are considered derivatives and measured at fair value, with changes in fair value at each period end recorded in net earnings (loss). Transaction costs are expensed as incurred.
Available-for-sale financial assets
Available-for-sale (“AFS”) financial assets are those non-derivative financial assets that are designated as such or are not classified as loans and receivables, held-to-maturity investments or financial assets at FVTPL. AFS financial assets are measured at fair value upon initial recognition and at each period end, with unrealized gains or losses being recognized as a separate component of equity in other comprehensive income (loss) until the investment is derecognized or until the investment is determined to be impaired, at which time the cumulative gain or loss previously reported in equity is included in net earnings (loss). The Company has classified its investments in certain public companies as available-for-sale.
Loans and receivables
Trade receivables, loans and other receivables that have fixed or determinable payments that are not quoted in an active market are classified as loans and receivable. Loans and receivable are initially recognized at the transaction value and subsequently carried at amortized cost using the effective interest method if the time value of money is significant. Gains and losses are recognized in the statement of comprehensive income (loss) when the loans and receivables are derecognized or impaired, as well as through the amortization process. Interest income is recognized by applying the effective interest rate, except for short term receivables when the recognition of interest would be immaterial.
12
LAKE SHORE GOLD CORP.
NOTES TO THE CONSOLIDATED FINANCIAL STATEMENTS
FOR THE YEARS ENDED DECEMBER 31, 2014 AND 2013
(in thousands of Canadian dollars, except per share amounts)
Other financial liabilities
Other financial liabilities, including borrowings, are recognized initially at fair value, net of transaction costs. After initial recognition, interest bearing loans and borrowings are subsequently measured at amortized cost using the effective interest method. Gains and losses are recognized in net earnings (loss) when the liabilities are derecognized as well as through the amortization process. Borrowings are classified as current liabilities unless the Company has an unconditional right to defer settlement of the liability for at least 12 months after the statement of financial position date, and are derecognized when, and only when, the Company’s obligations are discharged or they expire.
Derivative instruments
Derivative instruments, including embedded derivatives, are recorded at fair value on initial recognition and at each subsequent reporting period. Any gains or losses arising from changes in fair value on derivatives are recorded in the statement of comprehensive income (loss).
Fair values
The fair value of quoted investments is determined by reference to market prices at the close of business on the statement of financial position date. Where there is no active market, fair value is determined using valuation techniques. These include using recent arm’s length market transactions; reference to the current market value of another instrument which is substantially the same; discounted cash flow analysis; and, pricing models.
Financial instruments that are measured subsequent to initial recognition are grouped into a hierarchy based on the degree to which the fair value is observable as follows:
Level 1 fair value measurements are quoted prices (unadjusted) in active markets for identical assets or liabilities;
Level 2 fair value measurements are those derived from inputs other than quoted prices included within Level 1 that are observable for the asset or liability either directly (i.e. as prices) or indirectly (i.e. derived from prices); and
Level 3 fair value measurements are those derived from valuation techniques that include inputs for the asset or liability that are not based on observable market data (unobservable inputs).
Impairment of financial assets
Financial assets, other than those recorded at FVTPL, are assessed for indicators of impairment at each period end. A financial asset is considered impaired when there is objective evidence that, as a result of one or more events that occurred after the initial recognition of the financial asset, the estimated future cash flows of the investments have been adversely impacted.
If an available-for-sale asset is impaired, an amount comprising the difference between its cost (net of any principal payment and amortization) and its fair value is transferred from equity to net earnings (loss), and
13
LAKE SHORE GOLD CORP.
NOTES TO THE CONSOLIDATED FINANCIAL STATEMENTS
FOR THE YEARS ENDED DECEMBER 31, 2014 AND 2013
(in thousands of Canadian dollars, except per share amounts)
cumulative gains or losses previously recognized in other comprehensive income or loss are reclassified to net earnings (loss) in the period. Reversals of impairment in respect of equity instruments classified as available-for-sale are not recognized in net earnings (loss) but included in other comprehensive income (loss).
f) Cash and cash equivalents
Cash and cash equivalents includes cash and short-term money market instruments that are readily convertible to cash with original terms of three months or less.
g) Inventories and stockpiled ore
Inventories are valued at the lower of cost or net realizable value. Inventories include stockpiled ore, gold in circuit and bullion inventories as well as materials and supplies inventory. Cost is determined using the weighted average method. The cost of ore inventories is based on the average cost of production. For this purpose, the costs of production include: (i) materials, equipment, labour and contractor expenses which are directly attributable to the extraction and processing of ore; (ii) depletion and depreciation of property, plant and equipment used in the extraction and processing of ore; and (iii) related production overheads (based on normal operating capacity).
Net realizable value is the estimated selling price in the ordinary course of business, less all estimated costs of completion and costs necessary to make the sale.
h) Mining interests
Mining interests represent capitalized expenditures related to the development of mining properties, related plant and equipment and expenditures arising from property acquisitions. Upon disposal or abandonment, the carrying amounts of mining interests are derecognized and any associated gains or losses are recognized in net earnings (loss).
Mining properties
Purchased mining properties are recognized as assets at their cost of acquisition or at fair value if purchased as part of a business combination. Mineral exploration costs are charged to net earnings (loss) in the year in which they are incurred (“green field exploration”), unless any of the conditions listed as (i) and (ii) are present in any of the mineral properties, in which case the costs of further exploration and development on the property are capitalized:
(i) The Company establishes a National Instrument (“NI”) 43-101 technical report with resources and/or reserves in a property; and/or
(ii) The Board of Directors of the Company approves the start of an advanced exploration program on a property, which requires surface or/and underground work (such as an open pit or underground drifts, shafts and other works, other than exploration drilling and analysis).
14
LAKE SHORE GOLD CORP.
NOTES TO THE CONSOLIDATED FINANCIAL STATEMENTS
FOR THE YEARS ENDED DECEMBER 31, 2014 AND 2013
(in thousands of Canadian dollars, except per share amounts)
Mining properties and process facility assets are amortized upon commencement of commercial production either on a unit-of-production basis over measured and indicated resources included in the mine plan or the life of mine.
Revenues realized before commencement of commercial production (“pre-production revenues”), which are not incidental but are necessary to bring the mine to the condition required to be operating in the manner intended by management, are recorded as a reduction of the respective mining asset.
Commercial production
Capitalization of costs incurred ceases when the related mining property has reached operating levels intended by management. Costs incurred prior to this point, including depreciation of related plant and equipment, are capitalized and proceeds from sales during this period are offset against costs capitalized.
Operating levels intended by management are considered to be reached when operational commissioning of major mine and plant components is complete, operating results are achieved consistently for a period of time and there are indications that these operating results will be continued. Other factors include one or more of the following:
(iii) a significant portion of plant/mill capacity is achieved;
(iv) a significant portion of available funding is directed towards operating activities;
(v) a pre-determined, reasonable period of time has passed;
(vi) a development project significant to the primary business objective of the Company has been completed in terms of significant milestones being achieved; or
(vii) the Company has filed a NI 43-101 technical report for the property.
Costs incurred to maintain current production are included in mine operating costs. These costs include the development and access (tunneling) costs of production drifts to develop the ore body in the current production cycle. During the production phase of a mine, costs incurred that provide access to reserves and resources that will be produced in future periods that would not have otherwise been accessible are capitalized and included in the carrying amount of the related mining property. Capitalized stripping costs are depleted over the estimated recoverable ounces contained in reserves and resources that directly benefit from the stripping activities. Costs for regular waste removal that do not give rise to future economic benefits are included in mine operating costs in the period they are incurred.
Plant and equipment
Plant and equipment is stated at cost less accumulated depreciation and impairment losses. The cost capitalized for plant and equipment includes borrowing costs incurred that are attributable to qualifying plant and equipment as noted in note 3(i). The carrying amounts of plant and equipment are depreciated using either the straight-line or unit-of-production method over the estimated useful lives of the related assets.
15
LAKE SHORE GOLD CORP.
NOTES TO THE CONSOLIDATED FINANCIAL STATEMENTS
FOR THE YEARS ENDED DECEMBER 31, 2014 AND 2013
(in thousands of Canadian dollars, except per share amounts)
The significant classes of depreciable plant and equipment and their estimated useful lives are as follows:
Category | | Rates |
| | |
Mill and related infrastructure | | 20 years or unit-of-production |
Underground infrastructure | | Life of mine |
Vehicles and mobile equipment | | 3-10 years |
Office equipment | | 20% |
Computer equipment | | 30% |
Assets under construction are carried at cost less any recognized impairment loss. Cost includes cost of equipment, cost of labour and installation, project management cost and other indirect costs specifically for assets under construction. When the asset is completed and ready for intended use, the Company reclassifies it from assets under construction to plant and equipment or depletable assets.
Leased assets
Leases in which the Company assumes substantially all risks and rewards of ownership are classified as finance leases. Assets held under finance leases are recognized at the lower of the fair value and the present value of minimum lease payments at inception of the lease, less accumulated depreciation and impairment losses. Lease payments are accounted for as discussed in note 3(k).
Assets held under finance leases are depreciated over their expected useful lives on the same basis as owned assets.
i) Borrowing costs
Borrowing costs directly attributable to the acquisition, construction or production of a qualifying asset (i.e. an asset that necessarily takes a substantial period of time to get ready for its intended use or sale) are capitalized as part of the cost of the asset. All other borrowing costs are expensed in the period they occur.
j) Impairment of assets
Assets that have an indefinite useful life are not subject to amortization and are tested annually for impairment or whenever other indicators exist. Assets that are subject to amortization or depreciation are reviewed for impairment whenever events or changes in circumstances indicate that the carrying amount may not be recoverable. An impairment loss is recognized for the amount by which the asset’s carrying amount exceeds its recoverable amount. The recoverable amount of assets is the greater of their fair value less costs to sell and value in use. Fair value is based on an estimate of the amount that the Company may obtain in a sale transaction on an arm’s-length basis. In assessing value in use, the estimated future cash flows are discounted to their present value using a pre-tax discount rate that reflects current market assessments of the time value of money and the risks specific to the asset. For an asset that does not generate cash inflows largely independent of those from other assets, the recoverable amount is determined for the cash-generating unit to which the asset belongs. The Company’s cash generating units
16
LAKE SHORE GOLD CORP.
NOTES TO THE CONSOLIDATED FINANCIAL STATEMENTS
FOR THE YEARS ENDED DECEMBER 31, 2014 AND 2013
(in thousands of Canadian dollars, except per share amounts)
are the lowest level of identifiable groups of assets that generate cash inflows that are largely independent of the cash inflows from other assets or groups of assets. Where a reasonable and consistent basis of allocation can be identified, corporate assets are also allocated to individual cash-generating units, otherwise they are allocated to the smallest group of cash-generating units for which a reasonable and consistent allocation basis can be identified.
An impairment loss is reversed if there has been a change in the estimates used to determine the recoverable amount. An impairment loss is reversed only to the extent that the asset’s carrying amount does not exceed the carrying amount that would have been determined, net of depreciation or amortization, if no impairment loss had been recognized.
k) Leases
Assets held under finance leases are recognized as discussed in note 3(h). The corresponding liability is recognized as a finance lease obligation. Lease payments are apportioned between finance charges and reduction of the lease obligation to achieve a constant rate of interest on the remaining liability. Finance charges are recorded as a finance expense to profit and loss, unless they are attributable to qualifying assets, in which case they are capitalized.
Operating lease payments are recognized as an expense on a straight-line basis over the lease term, except where another systematic basis is more representative of the time pattern in which economic benefits from the leased asset are consumed.
The Company engages in sale and leaseback transactions as part of the Company’s financing strategy. Where a sale and leaseback transaction results in a finance lease, any excess of sales proceeds over the carrying amount is deferred and amortized over the lease term. Where a sale and leaseback transaction results in an operating lease, and it is clear that the transaction is established at fair value, any profit or loss is recognized immediately. If the sales price is below fair value, the shortfall is recognized in income immediately, except that, if the loss is compensated for by future lease payments at below market prices, it is deferred and amortized in proportion to the lease payments over the period for which the asset is expected to be used. If the sale price is above fair value, the excess over fair value is deferred and amortized over the period the asset is expected to be used.
l) Provisions
Provisions are recognized when the Company or its subsidiaries have a present obligation (legal or constructive) as a result of a past event, it is probable that an outflow of resources will be required to settle the obligation and a reliable estimate can be made of the amount of the obligation. The amount recognized as a provision is the best estimate of the consideration required to settle the present obligation at the end of the reporting period. If the effect of the time value of money is material, provisions are determined by discounting the expected future cash flows at a pre-tax rate that reflects current market assessments of the time value of money and, where appropriate, the risks specific to the liability. Where discounting is used, the increase in the provision due to the passage of time is recognized as a finance cost.
17
LAKE SHORE GOLD CORP.
NOTES TO THE CONSOLIDATED FINANCIAL STATEMENTS
FOR THE YEARS ENDED DECEMBER 31, 2014 AND 2013
(in thousands of Canadian dollars, except per share amounts)
Contingent liabilities are not recognized in the consolidated financial statements, if not estimable and probable, and are disclosed in notes to the financial information unless their occurrence is remote.
Contingent assets are not recognized in the consolidated financial statements, but are disclosed in the notes if their recovery is deemed probable.
Environmental rehabilitation
Provisions for environmental rehabilitation are made in respect of the estimated future costs of closure and restoration and for environmental rehabilitation costs (which include the dismantling and demolition of infrastructure, removal of residual materials and remediation of disturbed areas) in the accounting period when the related environmental disturbance occurs. The provision is discounted using a pre-tax rate, and the unwinding of the discount is included in finance costs. At the time of establishing the provision, a corresponding asset is capitalized and is depreciated over future production from the mining property to which it relates. The provision is reviewed on an annual basis for changes in cost estimates, discount rates and operating lives.
Changes to estimated future costs are recognized in the statement of financial position by adjusting the rehabilitation asset and liability. Increases in estimated costs related to mine production become part of ore inventory. For closed sites, changes to estimated costs are recognized immediately in the profit and loss.
m) Share-based payments
The fair value of the estimated number of stock options awarded to employees, officers and directors that will eventually vest, is recognized as share-based compensation expense over the vesting period of the stock options with a corresponding increase to equity. The fair value of each stock option granted is estimated on the date of the grant using the Black-Scholes option-pricing model and is expensed over the vesting period, based on the Company’s estimate of equity instruments that will eventually vest. At the end of each reporting period, the Company revises its estimate of the number of equity instruments expected to vest. The impact of the revision of the original estimates, if any, is recognized in net earnings (loss) or capitalized in mining properties such that the accumulated expense reflects the revised estimate, with a corresponding adjustment to the share-based payment reserve. The share-based payment cost is recognized in net earnings (loss) or capitalized in mining properties (options granted to individuals involved on specific projects).
Performance share units (“PSUs”) awarded to eligible executives are settled in cash. The fair value of the estimated number of PSUs awarded expected to vest is recognized as share-based compensation expense over the vesting period of the PSUs with a corresponding amount set up as a liability. Until the liability is settled, the fair value of the PSUs is re-measured at the end of each reporting period and at the date of settlement, with changes in fair value recognized as share-based compensation expense or recovery over the vesting period. The fair value of the PSUs is estimated using the market value of the Company’s shares at each period end, discounted based on vesting terms, multiplied by an estimated payout factor (between 100% to 150%).
Deferred share units (“DSUs”) awarded to non-executive directors can be settled in cash, shares or a combination of both as elected by the directors. In the case of a payment in shares, the Company will
18
LAKE SHORE GOLD CORP.
NOTES TO THE CONSOLIDATED FINANCIAL STATEMENTS
FOR THE YEARS ENDED DECEMBER 31, 2014 AND 2013
(in thousands of Canadian dollars, except per share amounts)
purchase the shares on the open market, through a broker, on behalf of the directors. The fair value of the DSUs awarded is recognized as share-based compensation expense at grant date with a corresponding amount set up as a liability. Until the liability is settled, the fair value of the DSUs is re-measured at the end of each reporting period and at the date of settlement, with changes in fair value recognized as share-based compensation expense or recovery in the period. The fair value of DSUs is estimated using the Black-Scholes option-pricing model to determine the expected market value of the underlying Lake Shore Gold shares on settlement date.
n) Defined contribution pension plan
The Company has a defined contribution pension plan which covers all of the Company’s employees. Under the plan provisions, the Company contributes a fixed percentage of the employees’ salaries to the pension plan. The employees are able to direct the contributions into a variety of investment funds offered by the plan. Pension costs associated with the Company’s required contributions under the plan are recognized as an expense when the employees have rendered service entitling them to the contribution and are charged to profit or loss, or capitalized to mining interests for employees directly involved in the specific projects.
o) Deferred income and mining taxes
Taxes, comprising both income taxes and mining taxes accounted for as income taxes, are recognized in net earnings (loss), except where they relate to items recognized in other comprehensive income (loss) or directly in equity, in which case the related taxes are recognized in other comprehensive income (loss) or equity. Deferred income taxes are provided using the balance sheet liability method, providing for unused tax losses, unused tax credits and temporary differences between the carrying amounts of assets and liabilities for financial reporting purposes and the amounts used for taxation purposes. As an exception, deferred tax assets and liabilities are not recognized if the temporary differences arise from the initial recognition of goodwill or an asset or liability in a transaction (other than in a business combination) that affects neither accounting profit nor taxable profit.
Deferred tax assets and liabilities are measured at the tax rates that are expected to apply to the period when the asset is realized or the liability is settled based on the tax rates (and tax laws) that have been enacted or substantively enacted at the statement of financial position date.
A deferred tax asset is recognized only to the extent that it is probable that future taxable profits will be available against which the asset can be utilized. Deferred tax assets are reduced to the extent that it is no longer probable that the related tax benefit will be realized.
Deferred tax assets and liabilities are offset when there is a legally enforceable right to set off current tax assets against current tax liabilities, and when they relate to income taxes levied by the same taxation authority and the Company intends to settle its current assets and liabilities on a net basis.
19
LAKE SHORE GOLD CORP.
NOTES TO THE CONSOLIDATED FINANCIAL STATEMENTS
FOR THE YEARS ENDED DECEMBER 31, 2014 AND 2013
(in thousands of Canadian dollars, except per share amounts)
p) Share capital
Common shares issued by the Company are classified as equity. Incremental costs directly attributable to the issue of new common shares are recognized in equity, net of tax, as a deduction from the share proceeds (share issue costs).
q) Flow-through shares
Under Canadian income tax legislation, a company is permitted to issue flow-through shares whereby the company agrees to incur qualifying expenditures and renounce the related income tax deductions to the investors. The Company allocates the proceeds from the issuance of these shares between the offering of shares and the sale of tax benefits. The allocation is made based on the difference between the quoted price of the shares and the amount the investor pays for the shares. A deferred flow-through premium liability is recognized for the difference. The liability is reversed when the expenditures are made and is recorded in other income. The spending also gives rise to a deferred tax timing difference between the carrying value and tax value of the qualifying expenditure.
r) Revenue recognition
Revenue is measured at the fair value of the consideration received or receivable and represents amounts received for goods sold in the normal course of business, net of discounts and sales related taxes. Revenue from gold sales is recognized to the extent that it is probable that economic benefits will flow to the Company, the revenue can be reliably measured and when all significant risks and rewards of ownership are transferred to the customer, which is when title has passed to the customer. Revenue from by-product sales is recorded as a reduction of production costs.
s) Finance income and costs
Finance income and costs comprise interest income on funds invested, interest expense on borrowings and the accumulation of interest on provisions. Interest income is recognized as it accrues, taking into account the effective yield on the asset.
t) Earnings (loss) per share
Basic earnings (loss) per share is computed by dividing net earnings (loss) available to common shareholders by the weighted average number of outstanding common shares for the period. In computing diluted earnings per share, an adjustment is made for the dilutive effect of the exercise of stock options and warrants. The number of additional shares is calculated by assuming that outstanding stock options, debentures and warrants are exercised and that the proceeds from such exercises were used to acquire common shares at the average market price during the reporting periods. In periods where a net loss is reported, all outstanding options and warrants are excluded from the calculation of diluted loss per share, as they are anti-dilutive.
20
LAKE SHORE GOLD CORP.
NOTES TO THE CONSOLIDATED FINANCIAL STATEMENTS
FOR THE YEARS ENDED DECEMBER 31, 2014 AND 2013
(in thousands of Canadian dollars, except per share amounts)
u) Deferred financing charges
Costs of arranging a loan facility are recorded in the statement of financial position net of the respective facility obligation and amortized using the effective interest method over the term of the respective facility agreement.
v) Other comprehensive income (loss)
Other comprehensive income (loss) is the change in the Company’s net assets that results from transactions, events and circumstances from sources other than the Company’s shareholders and includes items that are not included in net profits such as unrealized gains and losses on financial assets classified as available-for-sale, net of income taxes, gains or losses on certain derivative instruments and foreign currency exchange gains or losses related to foreign subsidiaries which functional currency is different than the functional currency of the Company.
w) Segment reporting
An operating segment is a component of an entity:
(i) that engages in business activities from which it may earn revenues and incur expenses (including revenues and expenses relating to transactions with other components of the same entity);
(ii) whose operating results are regularly reviewed by the entity’s chief operating decision maker to make decisions about resources to be allocated to the segment and assess its performance; and
(iii) for which discrete financial information is available.
The Company’s operating segments are its mining operations segment and exploration and advanced exploration segments.
4. CRITICAL ACCOUNTING JUDGMENTS AND KEY SOURCES OF ESTIMATION UNCERTAINTY
In the application of the Company’s accounting policies, which are described in note 3, management is required to make judgments, estimates and assumptions about the carrying amount and classification of assets and liabilities that are not readily apparent from other sources. The estimates and associated assumptions are based on historical experience and other factors that are considered to be relevant. Actual results may differ from these estimates.
The estimates and underlying assumptions are reviewed on an ongoing basis. Revisions to accounting estimates are recognized in the period in which the estimate is revised if the revisions affect only that period, or in the period of the revision and future periods, if the revision affects both current and future periods.
The following are the critical judgments and areas involving estimates, that management have made in the process of applying the Company’s accounting policies and that have the most significant effect on the amounts recognized in the consolidated financial statements.
21
LAKE SHORE GOLD CORP.
NOTES TO THE CONSOLIDATED FINANCIAL STATEMENTS
FOR THE YEARS ENDED DECEMBER 31, 2014 AND 2013
(in thousands of Canadian dollars, except per share amounts)
CRITICAL JUDGMENTS IN APPLYING ACCOUNTING POLICIES
Commercial production - Operating levels intended by management
Prior to reaching operating levels intended by management, costs incurred are capitalized as part of costs of the related mining property and proceeds from sales are offset against costs capitalized. Depletion of capitalized costs for mining properties begins when operating levels intended by management have been reached. Management considers several factors in determining when a mining property has reached the operating levels intended by management.
Determination of functional currency
In accordance with International Accounting Standards (“IAS”) 21, The Effects of Changes in Foreign Exchange Rates, management determined that the functional currency of its Canadian entities (the Company and its Canadian subsidiaries — note 3(a)) is the Canadian dollar and Mexico pesos for the Company’s subsidiary in Mexico (Minera Golondrina S. de R.L. de C.V. or the “Mexico entity”). The Company disposed of its Mexico entity on May 8, 2013 (note 12(a(i)).
KEY SOURCES OF ESTIMATION UNCERTAINTIES
Useful life of plant and equipment
As discussed in note 3(h), the Company reviews the estimated lives of its plant and equipment at the end of each reporting period. There were no material changes in the lives of plant and equipment for the years ended December 31, 2014 and 2013.
Determination of reserves and resources
Reserves and resources are used in the units of production calculation for depreciation and depletion calculations and in the determination of the timing of environmental rehabilitation costs as well as in the impairment analysis.
There are numerous uncertainties inherent in estimating reserves and resources. Assumptions that are valid at the time of estimation may change significantly when new information becomes available. Changes in the forecast prices of commodities, exchange rates, production costs, or recovery rates as well as new drilling results may change the economic status of reserves and resources and may result in the reserves and resources being revised.
Deferred income taxes
Judgment is required in determining whether deferred tax assets are recognized on the statement of financial position. Deferred tax assets, including those arising from unutilized tax losses require management to assess the likelihood that the Company and/or its subsidiaries will generate taxable earnings in future periods, in order to utilize recognized deferred tax assets. Estimates of future taxable income are based on forecast cash flows from operations and the application of existing tax laws in each
22
LAKE SHORE GOLD CORP.
NOTES TO THE CONSOLIDATED FINANCIAL STATEMENTS
FOR THE YEARS ENDED DECEMBER 31, 2014 AND 2013
(in thousands of Canadian dollars, except per share amounts)
jurisdiction. To the extent that future cash flows and taxable income differ significantly from estimates, the ability of the Company and/or its subsidiaries to realize the net deferred tax assets recorded at the statement of financial position date could be impacted. Additionally, future changes in tax laws in the jurisdictions in which the Company and its subsidiaries operate could limit the ability of the Company to obtain tax deductions in future periods.
Impairment of assets
The carrying amounts of mining properties and plant and equipment are reviewed for impairment if events or changes in circumstances indicate that the carrying value may not be recoverable. If there are indicators of impairment, an exercise is undertaken to determine whether the carrying values are in excess of their recoverable amount. Such review is undertaken on an asset by asset basis, except where such assets do not generate cash flows independent of other assets, and then the review is undertaken at the cash generating unit level (“CGU”).
The assessment requires the use of estimates and assumptions such as, but not limited to, long-term commodity prices, foreign exchange rates, discount rates, future capital requirements, resource estimates, exploration potential and operating performance as well as the CGU definition. It is possible that the actual fair value could be significantly different from those assumptions, and changes in these assumptions will affect the recoverable amount of the mining interests. In the absence of any mitigating valuation factors, adverse changes in valuation assumptions or declines in the fair values of the Company’s CGUs or other assets may, over time, result in impairment charges causing the Company to record material losses.
The Company considers both external and internal sources of information in assessing whether there are any indications that mining interests are impaired. External sources of information the Company considers include changes in the market, economic and legal environment in which the Company operates that are not within its control and affect the recoverable amount of mining interests. Internal sources of information the Company considers include the manner in which mining properties and plant and equipment are being used or are expected to be used and indications of economic performance of the assets. In assessing whether there is objective evidence that the Company’s mining interests represented by its investments in associates are impaired, the Company’s management considers observable data including the carrying amounts of the investees’ net assets as compared to their market capitalization.
Environmental rehabilitation
Significant estimates and assumptions are made in determining the environmental rehabilitation costs as there are numerous factors that will affect the ultimate liability payable. These factors include estimates of the extent and costs of rehabilitation activities, technological changes, regulatory changes, cost increases, and changes in discount rates.
Those uncertainties may result in actual expenditures in the future being different from the amounts currently provided. The provision represents management’s best estimate of the present value of the future rehabilitation costs required.
23
LAKE SHORE GOLD CORP.
NOTES TO THE CONSOLIDATED FINANCIAL STATEMENTS
FOR THE YEARS ENDED DECEMBER 31, 2014 AND 2013
(in thousands of Canadian dollars, except per share amounts)
Share-based payments
Management assesses the fair value of stock options granted, PSUs and DSUs in accordance with the accounting policy stated in note 3(m). The fair value of stock options granted and DSUs is measured using the Black-Scholes option valuation model; the fair value of PSUs is measured using market price of the Company at each period end discounted based on vesting terms, multiplied by an estimated payout factor. The fair value of stock options granted, PSUs and DSUs using valuation models is only an estimate of their potential value and requires the use of estimates and assumptions.
5. CHANGES IN ACCOUNTING POLICIES AND ACCOUNTING STANDARDS ISSUED BUT NOT YET EFFECTIVE
CHANGES IN ACCOUNTING POLICIES
The Company has adopted the following new standards, along with any consequential amendments, effective January 1, 2014. These changes were made in accordance with the applicable transitional provisions.
IAS 32, Financial instruments: presentation
IAS 32, Financial instruments: presentation (“IAS 32”) was amended by the IASB in December 2011. The amendment clarifies that an entity has a legally enforceable right to offset financial assets and financial liabilities if that right is not contingent on a future event and it is enforceable both in the normal course of business and in the event of default, insolvency or bankruptcy of the entity and all counterparties. The amendment to IAS 32 is effective for annual periods beginning on or after January 1, 2014. The amendment to the standard did not have any impact on the Company’s consolidated financial statements.
IAS 36, Impairment of assets
IAS 36, Impairment of assets (“IAS 36”) was amended by the IASB in May 2013. The amendments require the disclosure of the recoverable amount of impaired assets when an impairment loss has been recognized or reversed during the period and additional disclosures about the measurement of the recoverable amount of impaired assets when the recoverable amount is based on fair value less costs of disposal, including the discount rate when a present value technique is used to measure the recoverable amount. The amendments to IAS 36 are effective for annual periods beginning on or after January 1, 2014. The amendments to the standard did not have any impact on the Company’s consolidated financial statements.
IAS 39, Financial instruments: recognition and measurement
IAS 39, Financial instruments: recognition and measurement (“IAS 39”) was amended by the IASB in June 2013. The amendments clarify that novation of a hedging derivative to a clearing counterparty as a consequence of laws or regulations or the introduction of laws or regulations does not terminate hedge accounting. The amendments to IAS 39 are effective for annual periods beginning on or after January 1, 2014. The amendments to the standard did not have any impact on the Company’s consolidated financial statements.
24
LAKE SHORE GOLD CORP.
NOTES TO THE CONSOLIDATED FINANCIAL STATEMENTS
FOR THE YEARS ENDED DECEMBER 31, 2014 AND 2013
(in thousands of Canadian dollars, except per share amounts)
IFRIC 21, Levies
IFRIC 21, Levies (“IFRIC 21”) was issued in May 2013 and is an interpretation of IAS 37, Provisions, Contingent Liabilities and Contingent Assets. The interpretation clarifies the obligating event that gives rise to a liability to pay a levy. IFRIC 21 was effective for periods beginning on or after January 1, 2014. IFRIC 21 did not have a significant impact on the Company’s consolidated financial statements.
Amendments to IFRS 2, Share-based Payments
In the second quarter of 2014, the IASB issued Amendments to IFRS 2, Share-based Payments. The amendments change the definitions of “vesting condition” and “market condition” in the Standard, and add definitions for “performance condition” and “service condition”. They also clarify that any failure to complete a specified service period, even due to the termination of an employee’s employment or a voluntary departure, would result in a failure to satisfy a service condition. This would result in the reversal, in the current period, of compensation expense previously recorded reflecting the fact that the employee failed to complete a specified service condition. These amendments are effective for transactions with a grant date on or after July 1, 2014. These amendments had no impact on the Company’s consolidated financial statements.
Amendments to IFRS 3, Business Combinations (contingent consideration)
In the second quarter of 2014, the IASB issued Amendments to IFRS 3, Business Combinations. The amendments clarify the guidance in respect of the initial classification requirements and subsequent measurement of contingent consideration. This will result in the need to measure the contingent consideration at fair value at each reporting date, irrespective of whether it is a financial instrument or a non-financial asset or liability. Changes in fair value will need to be recognized in profit and loss. These amendments are effective for transactions with acquisition dates on or after July 1, 2014. These amendments had no impact on the Company’s consolidated financial statements.
ACCOUNTING STANDARDS ISSUED BUT NOT YET EFFECTIVE
IFRS 15, Revenue from Contracts and Customers
IFRS 15, Revenue from Contracts and Customers (“IFRS 15”) was issued by the IASB on May 28, 2014, and will replace IAS 18, Revenue, IAS 11, Construction Contracts, and related interpretations on revenue. IFRS 15 sets out the requirements for recognizing revenue that apply to all contracts with customers, except for contracts that are within the scope of the Standards on leases, insurance contracts and financial instruments. IFRS 15 uses a control based approach to recognize revenue which is a change from the risk and reward approach under the current standard. Companies can elect to use either a full or modified retrospective approach when adopting this standard and it is effective for annual periods beginning on or after January 1, 2017. The Company is currently evaluating the impact of IFRS 15 on its consolidated financial statements.
25
LAKE SHORE GOLD CORP.
NOTES TO THE CONSOLIDATED FINANCIAL STATEMENTS
FOR THE YEARS ENDED DECEMBER 31, 2014 AND 2013
(in thousands of Canadian dollars, except per share amounts)
IFRS 9, Financial Instruments
IFRS 9, Financial Instruments (“IFRS 9”) was issued by the IASB on July 24, 2014, and will replace IAS 39, Financial Instruments: Recognition and Measurement. IFRS 9 uses a single approach to determine whether a financial asset is measured at amortized cost or fair value, replacing multiple rules in IAS 39. The approach in IFRS 9 is based on how an entity manages its financial instruments in the context of its business model and the contractual cash flow characteristics of the financial assets. Two measurement categories continue to exist to account for financial liabilities in IFRS 9; fair value through profit or loss (“FVTPL”) and amortized cost. Financial liabilities held-for-trading are measured at FVTPL, and all other financial liabilities are measured at amortized cost unless the fair value option is applied. The treatment of embedded derivatives under the new standard is consistent with IAS 39 and is applied to financial liabilities and non-derivative host contracts not within the scope of this standard. The effective date for this standard is for annual periods beginning on or after January 1, 2018. The Company is currently evaluating the impact of IFRS 9 on its consolidated financial statements.
Amendments to IAS 16, Property, Plant and Equipment, and IAS 38, Intangible Assets: Clarification of Acceptable Methods of Depreciation and Amortization
On May 12, 2014, the IASB issued Amendments to IAS 16, Property, Plant and Equipment, and IAS 38, Intangible Assets. In issuing the amendments, the IASB has clarified that the use of revenue-based methods to calculate the depreciation of a tangible asset is not appropriate because revenue generated by an activity that includes the use of a tangible asset generally reflects factors other than the consumption of the economic benefits embodied in the asset. The IASB has also clarified that revenue is generally presumed to be an inappropriate basis for measuring the consumption of the economic benefits embodied in an intangible asset. This presumption for an intangible asset, however, can be rebutted in certain limited circumstances. The standard is to be applied prospectively for fiscal years beginning on or after January 1, 2016 with early application permitted. The Company is currently evaluating the impact of these amendments on its consolidated financial statements.
IFRS 11, Joint Arrangements
On May 6, 2014 the IASB amended IFRS 11, Joint Arrangements (“IFRS 11”). The amendments add new guidance on how to account for the acquisition of an interest in a joint operation that constitutes a business. The amendments are effective for annual periods beginning on or after January 1, 2016. The Company is currently evaluating the impact of these amendments on its consolidated financial statements.
IFRS 8, Operating Segments
On December 12, 2013 the IASB amended IFRS 8, Operating Segments (“IFRS 8”). The amendments add a disclosure requirement for the aggregation of operating segments and clarify the reconciliation of the total reportable segments’ assets to the entity’s assets. The amendments are effective for annual periods beginning on or after July 1, 2014. The Company is currently evaluating the impact of these amendments on its consolidated financial statements.
26
LAKE SHORE GOLD CORP.
NOTES TO THE CONSOLIDATED FINANCIAL STATEMENTS
FOR THE YEARS ENDED DECEMBER 31, 2014 AND 2013
(in thousands of Canadian dollars, except per share amounts)
IAS 1, Presentation of Financial Statements
On December 18, 2014 the IASB amended IAS 1, Presentation of Financial Statements (“IAS 1”). The amendments to existing IAS 1 requirements relate to materiality; order of the notes; subtotals; accounting policies; and disaggregation. The amendments are effective for annual periods beginning on or after January 1, 2016. The Company is currently evaluating the impact of these amendments on its consolidated financial statements.
IAS 19, Employee Benefits
On November 13, 2013 the IASB amended IAS 19, Employee Benefits (“IAS 19”). The amendments provide additional guidance to IAS 19 on the accounting for contributions from employees or third parties set out in the formal terms of a defined benefit plan. The amendments are effective for annual periods beginning on or after July 1, 2014. IAS 19 was further amended on July 30, 2014. The amendments to IAS 19 clarify the application of the requirements of IAS 19 on determination of the discount rate to a regional market consisting of multiple countries sharing the same currency. The amendments are effective for annual periods beginning on or after January 1, 2016. The amendments do not impact the Company’s consolidated financial statements.
IAS 38, Intangible Assets
On May 12 2014 the IASB amended IAS 38, Intangible Assets (“IAS 38”). The amendments clarify that an amortization method based on revenue is generally presumed to be an inappropriate basis for measuring the consumption of the economic benefits embodied in an intangible asset. However, the amendments provide limited circumstances when a revenue based method can be an appropriate basis for amortization. The amendments are effective for annual periods beginning on or after January 1, 2016. The Company is currently evaluating the impact of these amendments on its consolidated financial statements.
6. PRODUCTION COSTS
For the years ended December 31, | | 2014 | | 2013 | |
Raw materials and consumables | | $ | 54,467 | | $ | 38,883 | |
Salaries, employee benefits and other employee related expenses | | 35,301 | | 32,051 | |
Contractors | | 22,009 | | 18,651 | |
Definition and delineation drilling | | 4,013 | | 4,656 | |
Change in stockpiles and other gold inventories | | (2,825 | ) | 6,956 | |
Royalties | | 5,605 | | 4,379 | |
Rentals and operating leases | | 1,089 | | 974 | |
Share-based payments note 21(b(iv)) | | 408 | | 471 | |
Other | | 236 | | 470 | |
| | $ | 120,303 | | $ | 107,491 | |
27
LAKE SHORE GOLD CORP.
NOTES TO THE CONSOLIDATED FINANCIAL STATEMENTS
FOR THE YEARS ENDED DECEMBER 31, 2014 AND 2013
(in thousands of Canadian dollars, except per share amounts)
7. OTHER (LOSS) INCOME, NET
For the years ended December 31, | | 2014 | | 2013 | |
Unrealized and realized gain on embedded derivatives note 17(a(i)) | | $ | 5,491 | | $ | 8,171 | |
Unrealized and realized foreign exchange loss, net | | (6,044 | ) | (489 | ) |
Gain (loss) on deemed disposition of investments note 12(a) | | 1,038 | | (1,681 | ) |
Write down of unamortized transaction costs on loan prepayment note 17(a) | | (3,356 | ) | — | |
Loss on sale lease back transaction note 16 | | — | | (682 | ) |
Expenditures for disputed property taxes | | (943 | ) | — | |
Amortization of deferred premium on flow through shares note 21(a) | | 530 | | — | |
Other loss, net | | — | | (186 | ) |
Other (loss) income, net | | $ | (3,284 | ) | $ | 5,133 | |
Unrealized and realized foreign exchange loss, net for the year ended December 31, 2014 includes $6,087 of unrealized and realized loss (2013 - $615) from certain embedded derivatives - note 17(a).
Expenditures for disputed property taxes — on November 21, 2014, the Company received a notice of reassessment from the City of Timmins, totaling $943, for additional property taxes payable in respect of the Company’s Timmins West Mine and Bell Creek site (in addition to property taxes the Company had already been assessed and had paid in 2014, and which had been recognized within production costs). The reassessment reflects property values as determined by the Municipal Property Assessment Corporation (“MPAC”). The Company is appealing the property value reassessment and the related taxes payable. Given the complexity of determining the appropriate assessment and the uncertainty of the result of the Company’s appeal, the final amount payable cannot be estimated at this time. In accordance with IFRS, the Company has recognized the maximum amount due of $943 in other income (loss), net. The Company has agreed on a payment schedule with the City of Timmins with respect to the full amount, with $252 paid in December 2014 and the remainder to be paid in 2015, subject to the deduction or refund of any amounts determined not to be payable pursuant to the appeal.
Other loss, net, in 2013 includes a $108 unrealized loss on certain warrants held by the Company and fully expired as at December 31, 2013, a $278 write-off of certain amounts receivable and a $200 gain from the sale of one of its non-core green field exploration properties for same amount.
28
LAKE SHORE GOLD CORP.
NOTES TO THE CONSOLIDATED FINANCIAL STATEMENTS
FOR THE YEARS ENDED DECEMBER 31, 2014 AND 2013
(in thousands of Canadian dollars, except per share amounts)
8. FINANCE ITEMS
For the years ended December 31, | | 2014 | | 2013 | |
| | | | | |
Interest income on bank deposits | | $ | 691 | | $ | 706 | |
Finance income | | $ | 691 | | $ | 706 | |
| | | | | |
Borrowing costs and other interest expense note 17 | | $ | (19,285 | ) | $ | (15,328 | ) |
Unwinding of the discount on environmental rehabilitation provision note 19 | | (75 | ) | (54 | ) |
Finance expense | | $ | (19,360 | ) | $ | (15,382 | ) |
Net finance items | | $ | (18,669 | ) | $ | (14,676 | ) |
Borrowing costs for the years ended December 31, 2014 and 2013 include the following:
For the years ended December 31, | | 2014 | | 2013 | |
Gold Loan interest expense and amortization of transaction costs note 17(a(i)) | | $ | 3,391 | | $ | 5,692 | |
Standby Line interest expense and unwinding of discount note 17(a(ii)) | | 3,966 | | 5,077 | |
Standby Line rollover fee note 17(a) | | 200 | | — | |
Debentures interest and accretion | | 10,885 | | 10,390 | |
Borrowing costs before costs capitalized | | $ | 18,442 | | $ | 21,159 | |
Capitalized in mining interests note 17 | | — | | (6,216 | ) |
Borrowing costs | | $ | 18,442 | | $ | 14,943 | |
Other interest expense includes bank charges and interest expense related to finance leases of $843 for the year ended December 31, 2014 (2013 - $385).
9. RECEIVABLES AND PREPAIDS
As at December 31, | | 2014 | | 2013 | |
Sales tax and government receivables | | $ | 3,319 | | $ | 2,355 | |
Prepaid expenses | | 302 | | 1,184 | |
Other | | 76 | | 50 | |
| | $ | 3,697 | | $ | 3,589 | |
The fair value of receivables approximates their carrying value. None of the amounts included in receivables at December 31, 2014 are past due.
29
LAKE SHORE GOLD CORP.
NOTES TO THE CONSOLIDATED FINANCIAL STATEMENTS
FOR THE YEARS ENDED DECEMBER 31, 2014 AND 2013
(in thousands of Canadian dollars, except per share amounts)
10. INVENTORIES AND STOCKPILED ORE
As at December 31, | | 2014 | | 2013 | |
Gold in circuit | | $ | 8,170 | | $ | 10,068 | |
Stockpiled ore | | 4,304 | | 3,902 | |
Bullion | | 5,118 | | 782 | |
Materials and supplies inventory | | 7,858 | | 5,626 | |
| | $ | 25,450 | | $ | 20,378 | |
The cost of inventories and stockpiled ore recognized as an expense in 2014 and 2013 is $114,698 (excluding royalty expense of $5,605) and $103,112 (excluding royalty expense of $4,379), respectively. There were no write downs or reversals of write downs of inventory to net realizable value during the years ended December 31, 2014 and 2013.
11. AVAILABLE FOR SALE INVESTMENTS
The Company’s available for sale investments are as follows:
For the year ended December 31, | | 2014 | | 2013 | |
Balance beginning of year | | $ | 416 | | $ | 702 | |
Transferred from (to) investments in associates note 12 | | 1,336 | | (395 | ) |
Gain from mark to market of investments | | — | | 109 | |
Write-down | | (1,044 | ) | — | |
| | $ | 708 | | $ | 416 | |
The Company holds investments for sale in certain public companies. At December 31, 2014, the Company wrote down its available for sale investments to their fair value and recorded an impairment charge of $1,044 as the decline in value was considered significant and/or prolonged; the write down was reduced by $237 gain transferred from other comprehensive income (loss).
12. INVESTMENTS IN ASSOCIATES
The Company’s investments in associates are as follows:
| | 2014 | | 2013 | |
As at December 31, | | Net book value | | Fair value | | Net book value | | Fair value | |
Northern Superior Resources Inc. | | $ | 586 | | $ | 1,123 | | $ | 1,349 | | $ | 1,349 | |
IDM Mining LTD (Formerly Revolution Resources Corp.) | | $ | — | | $ | — | | $ | 400 | | $ | 400 | |
| | $ | 586 | | | | $ | 1,749 | | | |
30
LAKE SHORE GOLD CORP.
NOTES TO THE CONSOLIDATED FINANCIAL STATEMENTS
FOR THE YEARS ENDED DECEMBER 31, 2014 AND 2013
(in thousands of Canadian dollars, except per share amounts)
Movements in equity investments for the years ended December 31, 2014 and 2013 are as follows:
| | December 31, 2014 | | December 31, 2013 | |
| | Northern
Superior | | IDM Mining | | Total | | Northern
Superior | | IDM Mining | | Golden
Share | | Total | |
Balance, beginning of year | | $ | 1,349 | | $ | 400 | | $ | 1,749 | | $ | 4,493 | | $ | — | | $ | 868 | | $ | 5,361 | |
Additions / transfer from (to) available for sale investments | | — | | (1,336 | ) | (1,336 | ) | — | | 2,271 | | (176 | ) | 2,095 | |
Gain on disposal of investment | | — | | 1,038 | | 1,038 | | — | | — | | — | | — | |
Company’s share of net loss | | (763 | ) | (102 | ) | (865 | ) | (1,288 | ) | (426 | ) | (119 | ) | (1,833 | ) |
Write-down | | — | | — | | — | | (1,856 | ) | (1,445 | ) | (573 | ) | (3,874 | ) |
Balance, end of year | | $ | 586 | | $ | — | | $ | 586 | | $ | 1,349 | | $ | 400 | | $ | — | | $ | 1,749 | |
(a) IDM Mining LTD (formerly Revolution Resources Corp.)
On June 10, 2014, Revolution Resources Corp. changed its name to IDM Mining Ltd. (“IDM”). On June 13, 2014 the Company’s interest in IDM was diluted to 11.6% (from 22.5%) reflecting Lake Shore Gold’s decision not to participate in a financing by IDM. Effective June 13, 2014 (the “change date”), the investment in IDM was transferred to available for sale investments since IDM is no longer considered an associate of the Company. The Company recorded a gain of $1,038 on the change date representing the difference between the Company’s carrying value of investment in IDM and its market value at that date.
On January 30, 2013 the Company and IDM entered into an agreement for the sale of the Company’s Mexico subsidiary (which held 100% of the Company’s Mexico property portfolio) to IDM for a number of shares of IDM and other consideration.
The agreement closed on May 8, 2013 (“closing date”) at which time the Company received 20 million common shares of IDM, valued at $1,700.
(i) Disposal of the Mexico subsidiary, discontinued operations
The net assets of the Mexico subsidiary were recorded as assets held for sale at December 31, 2012. In the second quarter of 2013, the Company recorded a loss of $4,302 on the disposal of the Mexico subsidiary (loss from discontinued operations), of which $3,967 was transferred from other comprehensive income (loss).
(ii) Deemed disposition of available for sale investment in IDM
At closing date the Company’s interest in IDM increased to 22.4% (from approximately 7% before May 8, 2013) and IDM became an associate of Lake Shore Gold. As such, from May 8, 2013 to June 13, 2014, IDM was accounted for under the equity method of accounting.
Prior to the closing date, the Company’s investment in IDM was considered available for sale and marked to market at each period end with changes in value accumulated in other comprehensive income (loss) as part of investment revaluation reserve. The Company recorded a loss of $1,681 on the transaction (deemed disposition of the available for sale investment in IDM), $1,786 of which was transferred from investment revaluation reserve.
31
LAKE SHORE GOLD CORP.
NOTES TO THE CONSOLIDATED FINANCIAL STATEMENTS
FOR THE YEARS ENDED DECEMBER 31, 2014 AND 2013
(in thousands of Canadian dollars, except per share amounts)
(b) Golden Share Mining Corporation (“Golden Share”).
Effective July 29, 2013, the Company’s ownership in Golden Share was diluted to 7.31% and the Company no longer had the right of board representation; the investment in Golden Share was written down to $176, being its fair value at the transaction date, and transferred to available for sale investments.
During 2013, the Company wrote down its investments in associates to their fair value and recorded an impairment charge of $3,874 as the decline in value was considered significant or prolonged.
Summary financial information for the equity accounted investments, not adjusted for percentage of ownership held by the Company is as follows:
| | Ownership* | | Current
assets* | | Non-current
assets* | | Total
assets* | | Current
liabilities* | | Non-
current
liabilities* | | Total
liabilities* | | Loss** | |
2014 | | | | | | | | | | | | | | | | | |
Northern Superior Resources Inc. | | 23.78 | % | $ | 3,797 | | $ | 1,515 | | $ | 5,312 | | $ | 53 | | $ | — | | $ | 53 | | $ | 2,259 | |
| | | | $ | 3,797 | | $ | 1,515 | | $ | 5,312 | | $ | 53 | | $ | — | | $ | 53 | | $ | 2,259 | |
2013 | | | | | | | | | | | | | | | | | |
Northern Superior Resources Inc. | | 23.82 | % | $ | 6,176 | | $ | 1,542 | | $ | 7,718 | | $ | 129 | | $ | — | | $ | 129 | | $ | 6,487 | |
IDM Mining Ltd. | | 22.45 | % | 260 | | 9,645 | | 9,905 | | 1,769 | | — | | 1,769 | | 1,897 | |
| | | | $ | 6,436 | | $ | 11,187 | | $ | 17,623 | | $ | 1,898 | | $ | — | | $ | 1,898 | | $ | 8,384 | |
*At December 31 values are adjusted to align the policies of the equity-accounted investments to the Company’s accounting policies
** All the equity-accounted investments of the Company are exploration stage entities and as such do not have any sources of revenue, and losses are equal to expenses
13. RESTRICTED CASH
Restricted cash includes secured funds for letters of credit issued by the Company in favor of the Ontario Ministry of Northern Development and Mines as security for the Company’s obligations under the Closure Plans submitted for various properties of $5,521 (2013 - $5,198) and other letters of credit issued under various agreements of $1,897 (2013 - $1,897). These funds are restricted and not available for current operations.
32
LAKE SHORE GOLD CORP.
NOTES TO THE CONSOLIDATED FINANCIAL STATEMENTS
FOR THE YEARS ENDED DECEMBER 31, 2014 AND 2013
(in thousands of Canadian dollars, except per share amounts)
14. MINING INTERESTS
Year ended December 31, 2014 | | Depletable | | Non
depletable | | Total | | Plant and
equipment | | Total | |
Cost | | | | | | | | | | | |
At January 1, 2014 | | $ | 412,059 | | $ | 104,509 | | $ | 516,568 | | $ | 165,666 | | $ | 682,234 | |
Additions | | 43,181 | | 673 | | 43,854 | | 20,781 | | 64,635 | |
Construction in progress | | — | | — | | — | | 4,554 | | 4,554 | |
Cost at December 31, 2014 | | $ | 455,240 | | $ | 105,182 | | $ | 560,422 | | $ | 191,001 | | $ | 751,423 | |
Accumulated depreciation and depletion | | | | | | | | | | | |
At January 1, 2014 | | $ | 93,228 | | $ | — | | $ | 93,228 | | $ | 57,421 | | $ | 150,649 | |
Depreciation | | — | | — | | — | | 13,297 | | 13,297 | |
Depletion | | 60,028 | | — | | 60,028 | | — | | 60,028 | |
Accumulated depreciation and depletion at December 31, 2014 | | $ | 153,256 | | $ | — | | $ | 153,256 | | $ | 70,718 | | $ | 223,974 | |
Carrying value at December 31, 2014 | | $ | 301,984 | | $ | 105,182 | | $ | 407,166 | | $ | 120,283 | | $ | 527,449 | |
Year ended December 31, 2013 | | Depletable | | Non
depletable | | Total | | Plant and
equipment | | Total | |
Cost | | | | | | | | | | | |
At January 1, 2013 | | $ | 501,107 | | $ | 134,605 | | $ | 635,712 | | $ | 176,127 | | $ | 811,839 | |
Additions | | 56,987 | | 302 | | 57,289 | | 3,391 | | 60,680 | |
Construction in progress additions net of transfers | | — | | — | | — | | 38,232 | | 38,232 | |
Change in estimate and discount rate (environmental rehabilitation assets) | | (540 | ) | — | | (540 | ) | — | | (540 | ) |
Sale leaseback transaction | | — | | — | | — | | (2,977 | ) | (2,977 | ) |
Impairment charge | | (145,495 | ) | (30,398 | ) | (175,893 | ) | (49,107 | ) | (225,000 | ) |
Cost at December 31, 2013 | | $ | 412,059 | | $ | 104,509 | | $ | 516,568 | | $ | 165,666 | | $ | 682,234 | |
Accumulated depreciation and depletion | | | | | | | | | | | |
At January 1, 2013 | | $ | 47,779 | | $ | — | | $ | 47,779 | | $ | 43,896 | | $ | 91,675 | |
Sale leaseback transaction | | — | | — | | — | | (821 | ) | (821 | ) |
Depreciation | | — | | — | | — | | 14,346 | | 14,346 | |
Depletion | | 45,449 | | — | | 45,449 | | — | | 45,449 | |
Accumulated depreciation and depletion at December 31, 2013 | | $ | 93,228 | | $ | — | | $ | 93,228 | | $ | 57,421 | | $ | 150,649 | |
Carrying value at December 31, 2013 | | $ | 318,831 | | $ | 104,509 | | $ | 423,340 | | $ | 108,245 | | $ | 531,585 | |
33
LAKE SHORE GOLD CORP.
NOTES TO THE CONSOLIDATED FINANCIAL STATEMENTS
FOR THE YEARS ENDED DECEMBER 31, 2014 AND 2013
(in thousands of Canadian dollars, except per share amounts)
A summary by property of the carrying value at December 31, 2014 and 2013 is as follows:
At December 31, 2014 | | Depletable | | Non-
depletable | | Total Mining
properties | | Plant and
equipment | | Mining interests | |
Timmins West Mine | | $ | 223,735 | | $ | — | | $ | 223,735 | | $ | 26,286 | | $ | 250,021 | |
Bell Creek Mill | | 13,551 | | — | | 13,551 | | 87,851 | | 101,402 | |
Bell Creek Mine | | 64,698 | | — | | 64,698 | | 6,098 | | 70,796 | |
| | 301,984 | | — | | 301,984 | | 120,235 | | 422,219 | |
Exploration and evaluation | | | | | | | | | | | |
Gold River property | | — | | 41,855 | | 41,855 | | — | | 41,855 | |
Fenn-Gib Project | | — | | 37,972 | | 37,972 | | — | | 37,972 | |
Other exploration properties* | | — | | 25,355 | | 25,355 | | — | | 25,355 | |
| | — | | 105,182 | | 105,182 | | — | | 105,182 | |
Corporate | | — | | — | | — | | 48 | | 48 | |
| | $ | 301,984 | | $ | 105,182 | | $ | 407,166 | | $ | 120,283 | | $ | 527,449 | |
*Other exploration properties carrying value at December 31, 2014 includes $13,261 for Other Bell Creek properties, $7,875 for 144 Project and the remaining $4,205 for various other properties
At December 31, 2013 | | Depletable | | Non-
depletable | | Total Mining
properties | | Plant and
equipment | | Mining interests | |
Timmins West Mine | | $ | 247,654 | | $ | — | | $ | 247,654 | | $ | 18,385 | | $ | 266,039 | |
Bell Creek Mill | | 15,367 | | — | | 15,367 | | 84,447 | | 99,814 | |
Bell Creek Mine | | 55,810 | | — | | 55,810 | | 5,260 | | 61,070 | |
| | 318,831 | | — | | 318,831 | | 108,092 | | 426,923 | |
Exploration and evaluation | | | | | | | | | | | |
Gold River property | | — | | 41,595 | | 41,595 | | — | | 41,595 | |
Fenn-Gib Project | | — | | 37,796 | | 37,796 | | — | | 37,796 | |
Other exploration properties* | | — | | 25,118 | | 25,118 | | — | | 25,118 | |
| | — | | 104,509 | | 104,509 | | — | | 104,509 | |
Corporate | | — | | — | | — | | 153 | | 153 | |
| | $ | 318,831 | | $ | 104,509 | | $ | 423,340 | | $ | 108,245 | | $ | 531,585 | |
* Other exploration properties carrying value at December 31, 2013 includes $13,060 for Other Bell Creek properties, $7,875 for 144 Project and the remaining $4,183 for various other properties
Plant and Equipment
Plant and equipment at December 31, 2014, includes $4,634 of construction in progress (December 31, 2013 - $1,538). On August 31, 2013, the Company completed the second phase of the Bell Creek mill expansion to increase the mill capacity to over 3,000 tonnes per day and transferred $73,933 from construction in progress to depreciable assets.
Plant and equipment also includes costs of $28,904 (2013 - $23,266) and accumulated depreciation of $17,320 (2013 - $16,892) related to capital equipment and vehicles under finance leases (note 16).
The depreciation of plant and equipment used in the exploration and capital development activities of mining properties is capitalized in the specific property ($1,374 for the year ended December 31, 2014; $2,418 in 2013).
34
LAKE SHORE GOLD CORP.
NOTES TO THE CONSOLIDATED FINANCIAL STATEMENTS
FOR THE YEARS ENDED DECEMBER 31, 2014 AND 2013
(in thousands of Canadian dollars, except per share amounts)
Borrowing costs incurred from long term debt facilities (note 17) totaling $Nil for the year ended December 31, 2014 (2013 - $6,216) were capitalized to qualifying assets.
Timmins West Mine
Lake Shore Gold owns 100% of the Timmins West Mine which includes the Timmins Deposit and Thunder Creek Deposit. Production from Timmins West Mine and surrounding properties is subject to a 2.25% net smelter royalty (“NSR”). There are several other royalties applicable to various land areas comprising the Timmins West Mine. Only one of these royalties, a 1% NSR royalty related to Thunder Creek Deposit, involves areas of known mineralization.
The Company has an Impact and Benefits Agreement with the Flying Post First Nation and Mattagami First Nation (the “First Nation communities”) in order to promote a cooperative and mutually respectful relationship between the communities and Lake Shore Gold. The agreement establishes a framework for ongoing dialogue and consultation, including providing business, employment and training opportunities for members of the two First Nation communities.
Bell Creek Mine
The Company owns 100% of the Bell Creek Mine and Mill. Production from Bell Creek Mine is subject to 2% NSR, payable to Goldcorp Inc. (“Goldcorp”); the royalty is subject to the recovery by the Company of $6,015 related to Goldcorp’s share of the purchase price of a prior royalty on the mine that will be offset against the royalty payable to Goldcorp. As at December 31, 2014 the Company has royalty expense of $2,655 (2013 - $1,446) to offset against the payment owed by Goldcorp.
Exploration and evaluation
The Company’s acquisition costs for all properties are capitalized in mining interests; all other expenditures related to green field exploration are charged to the statement of comprehensive income (loss). In 2014 the Company incurred $1,098 of exploration and evaluation expenses charged to comprehensive income (loss) (2013 — $1,313).
144 Project
144 property is 100% owned by the Company and is located approximately 500 metres from the Thunder Creek Deposit of the Timmins West Mine. The property is subject to various NSR royalties. The Company spent $2,241 of exploration expenditures in 2014 (2013 - $Nil)
Fenn-Gib Project
The Fenn-Gib Project located approximately 60 kilometres east of Timmins includes the Fenn-Gib and Guibord Main properties on which the Company has a 100% interest. The Company acquired the Project from Barrick Gold Corporation (“Barrick”) in 2011; Barrick retains the right to re-acquire a 51% interest in the Project (excluding the Guibord Main property), and become the Project’s operator, in the event that a resource of at least 5 million ounces is established, for cash consideration representing two times the total
35
LAKE SHORE GOLD CORP.
NOTES TO THE CONSOLIDATED FINANCIAL STATEMENTS
FOR THE YEARS ENDED DECEMBER 31, 2014 AND 2013
(in thousands of Canadian dollars, except per share amounts)
investment by the Company (excluding acquisition costs) in the Fenn-Gib Project at the time the right is exercised.
In October 2013 the Company purchased a 100% interest in certain properties forming part of the Fenn-Gib deposit, which were formerly held under lease, for $200.
Other Bell Creek properties
Other Bell Creek properties include a number of properties acquired in 2007 in the vicinity of the Bell Creek Mine (the “Bell Creek West properties”) as well as the Vogel and Schumacher properties.
The seller has retained a 2% NSR relating to any future production from the Bell Creek West properties; the Company has the right to buy back 1% of the NSR on four of the five blocks of properties for $2,500 for each block.
On January 5, 2015 the Company entered into an agreement to acquire a 100% interest in the Vogel property, located contiguous to the Bell Creek Mine for $654; the agreement closed on March 3, 2015. Previously the Company had a mining lease on the property.
The Company has a mining lease on the Schumacher property located contiguous to the Vogel property. The property is subject to a 2% NSR with advance annual royalty payments of $50 indexed for inflation, for the duration of the lease.
Casa Berardi
In 2012, the Company earned a 50% interest in the Casa Berardi property by spending $5,000 as provided in a joint venture agreement between the Company and Aurizon Mines Ltd. (“Aurizon”) signed in 2007.
The joint venture agreement provides that if an indicated mineral resource of at least 500,000 ounces of gold at a minimum grade of 6.0 grams of gold per tonne (or the economic equivalent thereof) is established, the area containing the resource plus a one kilometer radius surrounding the outer perimeter of the resource may be transferred to a specific property joint venture, in which Aurizon and Lake Shore Gold will each have a 50% interest. Aurizon will then have the right to earn an additional 10% interest in the specific property by funding the costs of a feasibility study. During the year ended December 31, 2013, Aurizon was purchased by Hecla Mining Company.
Other properties
The Company owns 50% to 100% of various other properties. Certain of those properties are subject to NSR agreements between 2% and 3%.
December 31, 2013 Impairment of mining interests
The Company completed an assessment of the carrying value of its cash generating units (“CGUs”) as at December 31, 2013 and, as a result, recorded after-tax non-cash impairment charges aggregating $225,000 relating to the Timmins CGU.
36
LAKE SHORE GOLD CORP.
NOTES TO THE CONSOLIDATED FINANCIAL STATEMENTS
FOR THE YEARS ENDED DECEMBER 31, 2014 AND 2013
(in thousands of Canadian dollars, except per share amounts)
The Timmins CGU is comprised of the Timmins West Mine and the adjoining exploration properties, including Gold River Trend and 144 Project, Bell Creek Mine and Mill and adjoining properties, including Vogel property. Among the indicators triggering the impairment assessment at December 31, 2013 was the fact that the carrying amount of the Company’s net assets was materially higher than the Company’s market capitalization. Contributing to the reduction in the estimated carrying value of the Timmins CGU were lower short and long term gold price assumptions used in the determination of fair value as well as a decrease in resources and reserves.
Key assumptions
The key assumptions used in determining the recoverable amount (fair value less cost to sell) for the Timmins CGU were long-term commodity prices, discount rates, cash costs of production, capital expenditures, foreign exchange rates, and net asset value multiples. To determine the recoverable amount of the Timmins CGU at December 31, 2013, management used:
· discount rates between 7.5% to 8.5% for various assets of the CGU.
· gold price of US$1,300 in 2014 and subsequent years.
· foreign exchange rates (USD/CAD) of 1:1.07 in 2014 increasing gradually to 1.011 in 2019 and beyond.
As at December 31, 2013, the estimated recoverable amount of the Timmins CGU equaled its carrying amount, after giving effect to the impairment charge noted above.
15. ACCOUNTS PAYABLE AND ACCRUED LIABILITIES
As at December 31, | | 2014 | | 2013 | |
Trade payables | | $ | 11,732 | | $ | 4,511 | |
Accrued liabilities | | 11,412 | | 14,646 | |
Salaries and wages payable | | 3,387 | | 2,462 | |
| | $ | 26,531 | | $ | 21,619 | |
The fair value of accounts payable and accrued liabilities approximate their carrying amount. Trade payables relate mainly to the acquisition of materials, supplies and contractor services. These payables do not accrue interest and no guarantees have been granted. Trade payables and accrued liabilities at December 31, 2014 and 2013 are denominated in Canadian dollars.
16. FINANCE LEASE OBLIGATIONS
The Company has entered into equipment and vehicle leases expiring between 2015 and 2017 with interest rates between 0.9% to 6.50%. The Company has the option to purchase the equipment and vehicles leased at the end of the terms of the leases, for a nominal amount. The Company’s obligations under finance leases are secured by the lessor’s title to the leased assets. The fair value of the finance lease liabilities approximates their carrying amount.
37
LAKE SHORE GOLD CORP.
NOTES TO THE CONSOLIDATED FINANCIAL STATEMENTS
FOR THE YEARS ENDED DECEMBER 31, 2014 AND 2013
(in thousands of Canadian dollars, except per share amounts)
| | Minimum lease payments | |
| | December 31, 2014 | | December 31, 2013 | |
| | | | | |
Not later than one year | | $ | 7,670 | | $ | 3,773 | |
Later than one year and not later than five years | | 6,997 | | 6,313 | |
Less: Future finance charges | | (726 | ) | (490 | ) |
Present value of minimum lease payments | | $ | 13,941 | | $ | 9,596 | |
Less: Current portion | | (7,090 | ) | (3,446 | ) |
Non-current portion | | $ | 6,851 | | $ | 6,150 | |
On December 31, 2013, the Company entered into an agreement with Macquarie Technology Services (Canada) Ltd. (“Macquarie”) whereby the Company sold certain mobile equipment to Macquarie for $7,300 and leased them back for a period of 36 months. This lease liability is paid through 12 quarterly installments (with the first and last payment, respectively, on January 1, 2014 and October 1, 2016) and bears interest at 3.7%. At the end of the lease term, the Company has the option of purchasing all the equipment at a price equal to their fair value but no less than $730 and no more than $1,460.
A portion of the equipment leased back under the transaction was accounted for as a finance lease with the remaining treated as operating leases. The Company incurred a loss of $682 on the transaction representing the difference between the portion of the cash payment related to equipment qualifying as operating lease and their net book value.
17. LONG TERM DEBT
As at December 31, | | 2014 | | 2013 | |
Gold Loan (a(i)) | | $ | 6,590 | | $ | 18,458 | |
Standby Line (a(ii)) | | — | | 26,275 | |
Convertible Debentures (b) | | 89,708 | | 85,292 | |
| | $ | 96,298 | | $ | 130,025 | |
Current portion of long term debt and derivatives(a) | | 6,590 | | 13,339 | |
Long term debt | | $ | 89,708 | | $ | 116,686 | |
(a) Sprott Resource Lending Partnership Credit Facility
Credit Facility Agreement
On June 14, 2012, the Company signed a financing agreement (“Initial Agreement”) with Sprott Resource Lending Partnership (“Sprott”) for a credit facility (the “Facility”) totaling up to $70,000, secured by the material assets of the Company. The Facility involves two components, a $35,000 gold loan (the “Gold Loan”), payable monthly from January 31, 2013 to May 31, 2015, and a standby line of credit (the “Standby Line”) for an additional $35,000. The transaction closed on July 16, 2012, at which time the Company
38
LAKE SHORE GOLD CORP.
NOTES TO THE CONSOLIDATED FINANCIAL STATEMENTS
FOR THE YEARS ENDED DECEMBER 31, 2014 AND 2013
(in thousands of Canadian dollars, except per share amounts)
received $35,000 for the Gold Loan. The Standby Line of $35,000 was fully drawn on February 1, 2013. The annual interest rate for the Standby Line was 9.75% compounded monthly.
The Company incurred $6,413 of transaction costs under the Initial Agreement ($2,318 and $4,095 for the Gold Loan and Standby Line, respectively, the latter including $700 incurred in 2013 for the 2% drawdown fee - 885,964 common shares of the Company issued on February 1, 2013). Transaction costs are amortized over the respective life of each of the Gold Loan and Standby Line using the effective interest rate method.
On December 12, 2013, the Company entered into a modification agreement (the “Modification Agreement”) with Sprott whereby the Company agreed to repay the Standby Line through 18 equal monthly payments starting on June 30, 2015 with the final payment due on November 30, 2016; previously, the Standby Line was due in full on January 1, 2015. The Modification Agreement also provided for:
· The increase of the minimum return on the Gold Loan to 7.5% (from 5% under the Initial Agreement); the minimum return does not include any fees paid or payable to Sprott;
· Changes and modifications to the financial covenants (refer to note 25 for more details on covenants remaining and their definition as per the Modification Agreement) as follows:
· The removal of the total indebtedness to tangible net worth ratio covenant;
· The removal of the reserve tail ratio covenant;
· The addition of a minimum balance requirement for cash and cash equivalents of not less than $10,000 at any time as part of the current ratio covenant.
The Company incurred $350 of transaction costs related to the Modification Agreement and paid $1,200 for the 4% rollover fee at December 31, 2013; transaction costs are amortized over the life of the Modification Agreement (together with remaining unamortized transaction costs under the Initial Agreement).
As at December 31, 2014, the Standby Line was fully repaid with $5,000 paid in December 2013 and the remaining balance of $30,000 in 2014, the latter including $10,000 on June 4 without penalty and $20,000 on December 31 together with a 6% prepayment fee ($1,200) and a 1% rollover fee ($200) as provided in the Modification Agreement. $3,356 of unamortized transaction costs were written off as at December 31, 2014.
39
LAKE SHORE GOLD CORP.
NOTES TO THE CONSOLIDATED FINANCIAL STATEMENTS
FOR THE YEARS ENDED DECEMBER 31, 2014 AND 2013
(in thousands of Canadian dollars, except per share amounts)
(i) Gold Loan
As at December 31, | | 2014 | | 2013 | |
Accreted principal, net of unamortized transaction costs | | $ | 7,315 | | $ | 22,754 | |
Embedded Derivative asset | | (1,412 | ) | (6,702 | ) |
Minimum Return Derivative liability | | 687 | | 2,406 | |
| | $ | 6,590 | | $ | 18,458 | |
Current portion of Gold Loan | | 7,315 | | 18,024 | |
Current portion of embedded derivatives | | (725 | ) | (4,685 | ) |
Long term portion of Gold Loan | | $ | — | | $ | 5,119 | |
The Gold Loan is being repaid through 29 monthly cash payments which commenced on January 31, 2013, calculated based on 947 ounces of gold multiplied by the Bloomberg closing gold price prior to the date of payment each month.
The Gold Loan was recorded at $32,682 at initial recognition (fair value, net of transaction costs of $2,318) and is subsequently measured at amortized cost using the effective interest method.
As a result of the indexation of the principal repayments to the movement in the price of gold, the Company has determined that the Gold Loan contains a derivative which is embedded in the Canadian dollar denominated debt instrument (the “Embedded Derivative”). The embedded derivative is the equivalent of a series of 29 gold forward contracts which mature on each of the payment dates; the embedded derivative is marked to market at each period end with changes in fair value recorded as unrealized derivative gain (loss) and unrealized foreign exchange gain (loss), the latter representing the impact of changes in US$/Canadian$ exchange rate on the fair value of the derivative.
As provided in the Modification Agreement, the minimum return (the “floor”) on the Gold Loan is 7.5% and is considered a derivative embedded in the Gold Loan (the “Minimum Return Derivative”) due to the floor being in the money at the time of the modification. The minimum return derivative is equivalent to the additional amount (if any) the Company will have to pay at the maturity of the Gold Loan to ensure the return to Sprott is at least 7.5%; the derivative is marked to market at each period end with changes in fair value recorded as unrealized derivative gain (loss). As at December 31, 2014 the Company recorded a minimum return derivative liability of $687 (December 31, 2013 - $2,406).
40
LAKE SHORE GOLD CORP.
NOTES TO THE CONSOLIDATED FINANCIAL STATEMENTS
FOR THE YEARS ENDED DECEMBER 31, 2014 AND 2013
(in thousands of Canadian dollars, except per share amounts)
Gold Loan changes for the years ended December 31, 2014 and 2013 were as follows:
| | Accreted Principal | | Transaction Costs | | Total | |
At January 1, 2013 | | $ | 37,577 | | $ | (1,948 | ) | $ | 35,629 | |
Cash payments | | (16,453 | ) | — | | (16,453 | ) |
Interest expense | | 4,885 | | 807 | | 5,692 | |
Realized derivative gain | | (2,699 | ) | — | | (2,699 | ) |
Realized foreign exchange loss | | 585 | | — | | 585 | |
At December 31, 2013 | | $ | 23,895 | | $ | (1,141 | ) | $ | 22,754 | |
Cash payments | | (15,854 | ) | — | | (15,854 | ) |
Interest expense | | 2,585 | | 806 | | 3,391 | |
Realized derivative gain | | (4,086 | ) | — | | (4,086 | ) |
Realized foreign exchange loss | | 1,110 | | — | | 1,110 | |
At December 31, 2014 | | $ | 7,650 | | $ | (335 | ) | $ | 7,315 | |
During 2014 the Company capitalized in mining interests $Nil (2013 - $1,747) of interest expense and amortization of transaction costs.
Embedded derivative and minimum return derivative movements for 2014 and 2013 were as follows:
Embedded derivatives | | Embedded Derivative
(asset) liability | | Minimum Return
Derivative liability | | Total | |
At January 1, 2013 | | $ | 1,145 | | $ | — | | $ | 1,145 | |
Unrealized derivative (gain) loss | | (7,878 | ) | 2,406 | | (5,472 | ) |
Unrealized foreign exchange gain | | 30 | | — | | 30 | |
At December 31, 2013 | | $ | (6,703 | ) | $ | 2,406 | | $ | (4,297 | ) |
Unrealized derivative loss (gain) | | 314 | | (1,719 | ) | (1,405 | ) |
Unrealized foreign exchange loss | | 4,977 | | — | | 4,977 | |
At December 31, 2014 | | $ | (1,412 | ) | $ | 687 | | $ | (725 | ) |
(ii) Standby Line
For the years ended December 31, | | 2014 | | 2013 | |
Balance at beginning of year | | $ | 26,275 | | $ | — | |
Loan principal draw down net of transaction costs | | — | | 29,355 | |
Principal payments | | (30,000 | ) | (5,000 | ) |
Loan prepayment penalty | | (1,200 | ) | — | |
Write down of unamortized transaction costs | | 3,356 | | — | |
Interest expense and unwinding of discount | | 3,966 | | 5,077 | |
Interest payments | | (2,397 | ) | (3,157 | ) |
Balance at end of year | | $ | — | | $ | 26,275 | |
41
LAKE SHORE GOLD CORP.
NOTES TO THE CONSOLIDATED FINANCIAL STATEMENTS
FOR THE YEARS ENDED DECEMBER 31, 2014 AND 2013
(in thousands of Canadian dollars, except per share amounts)
For the year ended December 31, 2014 the Company capitalized in mining interests $Nil (2013 - $1,447) of interest expense and unwinding of discount.
(b) Convertible Debentures
For the years ended December 31, | | 2014 | | 2013 | |
Balance at beginning of year | | $ | 85,292 | | $ | 81,778 | |
Interest expense and unwinding of discount | | 10,885 | | 10,390 | |
Interest payments | | (6,469 | ) | (6,876 | ) |
Balance at end of year | | $ | 89,708 | | $ | 85,292 | |
In September 2012, the Company issued 103,500 of Convertible Unsecured Debentures (the “Debentures”) for an aggregate principal amount of $103,500 which bear annual interest at 6.25%, payable semi-annually in arrears on March 31 and September 30 of each year, starting from March 31, 2013, and maturing on September 30, 2017.
The Debenture holders may convert the Debentures at their option at any time prior to the maturity date. The Debentures are convertible into common shares of the Company at a conversion rate of 714.2857 common shares of the Company for every $1 amount principal of the Debentures, subject to adjustment in certain events.
The Debentures are redeemable in cash or in the Company’s shares starting from September 30, 2015 provided the volume weighted average price of the Company’s shares on the TSX for 20 consecutive trading days ending five days prior to the date on which notice of redemption is given (the “current market price”) is at least $1.82 per common share. The number of shares to be issued will be determined by dividing the principal amount of Debentures to be redeemed by 95% of the current market price.
The option of the holders to convert the Debentures into common shares of the Company resulted in accounting for the Debentures at inception as a compound financial instrument with $82,512 ($78,626 net of transaction costs of $3,886 — refer below) recorded as long term debt, being the fair value of the principal and interest cash payments, and the remaining $20,988 (or $20,000 net of transaction costs of $988 — refer below) recorded as equity and representing the value of the holder conversion option. The debt component is subsequently measured at amortized cost using the effective interest method.
The Company incurred transaction costs of $4,875 related to the issuance of the Debentures (including underwriter fees of $4,140) which are proportionately allocated between the debt and equity component and netted against each; the portion allocated to the debt component ($3,886) is amortized over the term of the Debentures using the effective interest rate method.
In 2014 the Company capitalized in mining interests $Nil (2013 - $3,022) of interest expense and unwinding of discount.
42
LAKE SHORE GOLD CORP.
NOTES TO THE CONSOLIDATED FINANCIAL STATEMENTS
FOR THE YEARS ENDED DECEMBER 31, 2014 AND 2013
(in thousands of Canadian dollars, except per share amounts)
18. SHARE-BASED LIABILITIES
As at December 31, | | 2014 | | 2013 | |
| | | | | |
Performance share units (i) | | $ | 1,395 | | $ | 435 | |
Deferred share units (ii) | | 693 | | 319 | |
Total share-based liabilities | | $ | 2,088 | | $ | 754 | |
Current portion | | $ | 394 | | $ | — | |
Long term portion | | $ | 1,694 | | $ | 754 | |
(i) The Company has a Performance Share Unit Plan (the “PSU plan”) whereby PSUs are issued to eligible executives as determined by the Company’s Board of Directors. PSUs issued under the PSU plan entitle the holder to a cash payment at the end of a three year performance period equal to a target settlement ranging from 100% to 150% (the “payout factor”) of the current market value of the underlying Lake Shore Gold shares, to be determined at the end of the performance period based on the performance of the underlying Lake Shore Gold shares.
In 2014 and 2013, the Company issued 1,230,865 and 2,576,978 PSUs, respectively. The fair value of the PSUs at December 31, 2014 and 2013 is based on the market value of the Company’s shares, discounted based on vesting terms and adjusted for the estimated payout factor (100% for December 31, 2014 and 2013). The discount rate used is 10.2% for December 31, 2014 and 2013.
Changes to the PSUs liability are as follows:
For the year ended December 31, | | 2014 | | 2013 | |
Balance, beginning of year | | $ | 435 | | $ | 255 | |
Share based payment expense | | 960 | | 180 | |
Total performance share units liability | | $ | 1,395 | | $ | 435 | |
Current portion | | $ | 394 | | $ | — | |
Long term portion | | $ | 1,001 | | $ | 435 | |
(ii) The Company has a Deferred Share Unit Plan (the “DSU plan”) whereby the non-executive Directors of the Company can elect to receive their annual compensation in cash, DSUs or a combination of both. Under the plan, additional DSUs may be issued to non-executive Directors of the Company as determined by the Company’s Board of Directors. DSUs issued under the DSU plan entitle the holder upon retirement to a cash payment, shares of the Company or a combination of both, as elected by the holder. In the case of a payment in shares, the Company will purchase the shares on the open market, through a broker, on behalf of the holder.
In 2014 and 2013, the Company issued 548,631 and 1,076,862 DSUs, respectively. The fair value of the DSUs at December 31, 2014 and 2013 was determined using the Black-Scholes option pricing model with the following assumptions: expected volatility based on past history of 72% to 83% (2013 - 74% to 84%) risk-free interest rate of 1.03% to 2.4% (2013 - 1.07% to 3.0%), dividend rate of $Nil and expected life ranging between 3.0 — 10.0 years (2013 - 1.0 — 10.0 years).
43
LAKE SHORE GOLD CORP.
NOTES TO THE CONSOLIDATED FINANCIAL STATEMENTS
FOR THE YEARS ENDED DECEMBER 31, 2014 AND 2013
(in thousands of Canadian dollars, except per share amounts)
Changes to the DSUs liability are as follows:
For the year ended December 31, | | 2014 | | 2013 | |
Balance, beginning of year | | $ | 319 | | $ | 224 | |
Share based payment expense | | 374 | | 95 | |
Total deferred share units liability | | $ | 693 | | $ | 319 | |
19. ENVIRONMENTAL REHABILITATION PROVISION
Environmental rehabilitation provision represents the discounted values of the estimated cost for site reclamation and remediation of the Bell Creek Mill ($3,120), Bell Creek Mine ($800) and Timmins West Mine ($1,420) as well as liability for some other projects ($300). This includes site restoration, rehabilitation and remediation of tailing ponds, roads, mine infrastructure and plant and equipment.
The present value of the provision has been calculated using a real pre-tax annual discount rate, based on Bank of Canada treasury bonds of an appropriate tenure as at December 31, 2014 and 2013 (0.47% to 1.25% at December 31, 2014 and 1.14% to 1.89% at December 31, 2013); estimated remaining life of mine of 6 years for the Timmins West Mine, 13 years for Bell Creek Mine and 16 years for the Bell Creek Mill as at December 31, 2014 (7, 15 and 17 years, respectively for Timmins West Mine, Bell Creek Mine and Bell Creek Mill at December 31, 2013); the cash flows have been adjusted to reflect the risk attached to these cash flows. Uncertainties in the timing for use of this provision include changes in the future that could impact the timing of closing the mines, as new resources and reserves are discovered. Letters of credit of $5,521 have been issued to the Ministry of Northern Development and Mines (note 13); the funds supporting the letters of credit will be used to cover expenses incurred for site reclamation and remediation upon the closure of the mines. The total undiscounted estimated rehabilitation provision is $6,600.
The liability is accreted over time through charges to finance costs and, the associated costs capitalized on the related assets are amortized for the Timmins West Mine, Bell Creek Mine and Bell Creek Mill over the respective lives of the mines and the mill.
Changes to the environmental rehabilitation provision are as follows:
For the year ended December 31, | | 2014 | | 2013 | |
Balance, beginning of year | | $ | 4,770 | | $ | 5,257 | |
Revisions in estimates | | 795 | | (541 | ) |
Unwinding of the discount | | 75 | | 54 | |
Total environmental rehabilitation provision | | $ | 5,640 | | $ | 4,770 | |
44
LAKE SHORE GOLD CORP.
NOTES TO THE CONSOLIDATED FINANCIAL STATEMENTS
FOR THE YEARS ENDED DECEMBER 31, 2014 AND 2013
(in thousands of Canadian dollars, except per share amounts)
20. DEFERRED TAXES
The provision for income and mining taxes included in net earnings (loss) represents an effective rate different than the statutory rate of 25% (2013 — 25%) computed by applying the cumulative Canadian federal and provincial income tax rates to the income (loss) before taxes due to the following:
For the year ended December 31, | | 2014 | | 2013 | |
Income (loss) from continuing operation before taxes | | $ | 23,614 | | $ | (229,167 | ) |
Computed income tax expense (recovery) at Canadian statutory rates | | 5,904 | | (57,292 | ) |
Non-deductible expenses | | 279 | | 2,252 | |
Changes in the unrecognized deferred tax assets | | (6,183 | ) | 55,040 | |
Deferred tax recovery | | $ | — | | $ | — | |
Deferred income tax
Deferred tax assets and liabilities have been offset where they relate to income taxes levied by the same taxation authority and the Company has the legal right and intent to offset.
As at December 31, | | 2014 | | 2013 | |
| | | | | |
Deferred income tax assets | | | | | |
Operating losses carried forward | | $ | — | | $ | 1,803 | |
Share issue costs | | 3,934 | | 4,368 | |
Total deferred income tax assets | | $ | 3,934 | | $ | 6,171 | |
| | | | | |
Deferred income tax liabilities | | | | | |
| | | | | |
Long term debt | | $ | (3,934 | ) | (6,171 | ) |
Total deferred income tax liability | | $ | (3,934 | ) | $ | (6,171 | ) |
Net deferred income tax asset | | $ | — | | $ | — | |
Unrecognized deferred tax assets and liabilities
Deferred tax assets have not been recognized in respect of the following items:
As at December 31, | | 2014 | | 2013 | |
Income tax: | | | | | |
Tax losses | | $ | 118,120 | | $ | 163,700 | |
Deductible temporary differences | | $ | 84,500 | | $ | 93,200 | |
Federal investment tax credits | | $ | 17,200 | | $ | 17,200 | |
| | | | | |
Mining tax: | | | | | |
Deductible temporary differences | | $ | 132,400 | | $ | 229,600 | |
45
LAKE SHORE GOLD CORP.
NOTES TO THE CONSOLIDATED FINANCIAL STATEMENTS
FOR THE YEARS ENDED DECEMBER 31, 2014 AND 2013
(in thousands of Canadian dollars, except per share amounts)
The tax losses and deductible temporary differences not recognized expire as noted below and can be applied against future taxable profit. Deferred tax assets have not been recognized in respect of these items because the Company does not have a history of taxable earnings.
Income tax:
Type | | Amount | | Expiry date | |
Net operating losses | | $ | 118,120 | | 2029-2033 | |
Deductible temporary differences | | $ | 84,500 | | N/A | |
Federal investment tax credits | | $ | 17,200 | | 2026-2033 | |
Mining tax:
Type | | Amount | | Expiry date | |
Deductible temporary differences | | $ | 132,400 | | N/A | |
| | | | | | |
The Company has deductible temporary differences of a capital nature of $33,100 (2013 - $29,400), the benefit of which have not been recognized in the consolidated financial statements.
21. SHAREHOLDERS’ EQUITY
a) Share capital
On December 3, 2014, the Company raised gross proceeds of $15,093 through the issuance of 12,900,000 flow-through common shares under a private placement at $1.17 per flow-through share. The net proceeds from the flow-through financing of $14,350 were recorded as share capital ($11,575) and deferred premium liability ($2,775).
On May 22, 2014, the Company raised gross proceeds of $5,035 through the issuance of 5,300,000 flow-through common shares under a private placement at $0.95 per flow-through share. The net proceeds from the flow-through financing of $4,960 were recorded as share capital ($4,077) and deferred premium liability ($883).
During the year ended December 31, 2014, the Company amortized $530 of deferred premium (recorded in other (loss) income).
The Company has until December 31, 2015 to spend the flow-through funds raised in 2014 on eligible Canadian exploration expenditures (“CEE”). The Company has spent $2,980 on CEE to December 31, 2014.
In 2013, 885,964 common shares of the Company valued at $700 were issued to Sprott (note 17(a)) representing the 2% drawdown fee for the Standby Line.
46
LAKE SHORE GOLD CORP.
NOTES TO THE CONSOLIDATED FINANCIAL STATEMENTS
FOR THE YEARS ENDED DECEMBER 31, 2014 AND 2013
(in thousands of Canadian dollars, except per share amounts)
As part of an agreement with Flying Post First Nation and Mattagami First Nation (note 14), Lake Shore Gold issued 50,000 common shares of the Company to the two First Nation communities in each of the 2014 and 2013 (valued at $45 and $32, respectively).
b) Reserves
i) Share Options
As at December 31, 2014, the Company had 21,915,856 options outstanding of which 12,459,522 are exercisable. Under the Company’s stock option plan, options may not be granted for a term exceeding ten years and the minimum exercise price cannot be less than the volume weighted average closing price of the Company’s common shares on the Toronto Stock Exchange, for the five trading days preceding the grant of the option. All options granted to date have been for a term of five years. The maximum number of options issuable by the Company is 7% of the issued and outstanding common shares. The Board of Directors determines the vesting terms of the options which may vary between grants; all outstanding grants vest in three equal amounts in a three year period from the grant date.
Movements in share options during the years ended December 31, 2014 and 2013 were as follows:
| | December 31, 2014 | | December 31, 2013 | |
| | Number of
options | | Weighted-
average
exercise price | | Number of options | | Weighted-
average
exercise price | |
Outstanding, beginning of year | | 24,245,365 | | $ | 1.89 | | 23,087,535 | | $ | 2.32 | |
Granted | | 3,607,290 | | $ | 0.84 | | 7,527,615 | | $ | 0.41 | |
Exercised | | (563,000 | ) | $ | 0.86 | | (30,000 | ) | $ | 0.79 | |
Forfeited | | (5,373,799 | ) | $ | 2.69 | | (6,339,785 | ) | $ | 1.72 | |
Outstanding, end of year | | 21,915,856 | | $ | 1.55 | | 24,245,365 | | $ | 1.89 | |
Exercisable, end of year | | 12,459,522 | | | | 12,689,750 | | | |
During the year ended December 31, 2014, the Company granted 3,607,290 (2013 - 7,527,615) stock options to its employees which vest over a period of 3 years, are exercisable at a weighted average price of $0.84 per option (2013 - $0.41), expire in five years from date of issuance, and have a total fair value of $1,449 (2013 - $1,533): The weighted average fair value at grant date was $0.40 for the year ended December 31, 2014 ($0.20 for the year ended December 31, 2013).
The fair value of stock options granted during 2014 and 2013 is estimated at the time of the grant using the Black-Scholes option pricing model with assumptions as follows: expected volatility based on past history of 81% to 94% (2013 - 63% to 92%), risk-free interest rate of 1.0% to 1.4% (2013 - 0.99% to 1.5%), forfeiture rate of 7.6% to 8.3% (2013 — 7.6% to 8.7%), dividend rate of 0% and expected life ranging between 1.6 - 3.5 years for different vesting tranches of options granted for both years.
47
LAKE SHORE GOLD CORP.
NOTES TO THE CONSOLIDATED FINANCIAL STATEMENTS
FOR THE YEARS ENDED DECEMBER 31, 2014 AND 2013
(in thousands of Canadian dollars, except per share amounts)
ii) Share Options Exercised
The following table outlines share options exercised during the year ended December 31, 2014:
Grant price | | Number of options
exercised | | Exercise dates | | Weighted average
closing share price at
exercise date | |
$0.41-$0.99 | | 563,000 | | March 4 to December 3, 2014 | | $ | 1.15 | |
| | 563,000 | | | | $ | 1.15 | |
For the year ended December 31, 2013:
Grant price | | Number of options
exercised | | Exercise dates | | Weighted average
closing share price at
exercise date | |
$0.55-$0.99 | | 30,000 | | January 15, 2013 | | $ | 0.91 | |
| | 30,000 | | | | $ | 0.91 | |
iii) Share Options outstanding at the end of the year
The following table summarizes information concerning outstanding and exercisable options at December 31, 2014:
Exercise price | | Options
outstanding | | Options
exercisable | | Remaining
contractual life
(years) | | Expiry dates | |
$0.37-$0.99 | | 13,914,856 | | 4,464,522 | | 3.36 | | November 14, 2017 to November 5, 2019 | |
$1.00-$1.99 | | 1,971,000 | | 1,965,000 | | 1.86 | | October 30, 2016 to March 23, 2017 | |
$2.00-$2.99 | | 30,000 | | 30,000 | | 1.51 | | July 3, 2016 | |
$3.00-$3.99 | | 6,000,000 | | 6,000,000 | | 0.77 | | May 2, 2015 to May 31, 2016 | |
| | 21,915,856 | | 12,459,522 | | | | | |
iv) Share-based payment expense
The cost of share-based payments is allocated to production costs (options granted to employees involved in the commercial operations at the mines and mill), general and administrative costs (options granted to directors and corporate employees), exploration expenses (options granted to individuals involved in exploration work on the green field exploration stage properties), and capitalized as part of mining properties (options granted to individuals involved on the specific projects capitalized). The Company capitalized $Nil of share-based payments for the year ended December 31, 2014 ($149 in 2013).
48
LAKE SHORE GOLD CORP.
NOTES TO THE CONSOLIDATED FINANCIAL STATEMENTS
FOR THE YEARS ENDED DECEMBER 31, 2014 AND 2013
(in thousands of Canadian dollars, except per share amounts)
The allocation of share-based payments on the consolidated statement of comprehensive income (loss) for the year ended December 31, 2014 and 2013 is as follows:
For the year ended December 31, | | 2014 | | 2013 | |
General and administrative | | $ | 926 | | $ | 1,706 | |
Production costs, note 6 | | 408 | | 471 | |
Exploration | | — | | 110 | |
Total share-based payments | | $ | 1,334 | | $ | 2,287 | |
c) Basic and diluted income (loss) per share
The basic and diluted income (loss) per share for the years ended December 31, 2014 and 2013 is calculated as shown in the table below. The diluted income per share for the year ended December 31, 2014 includes the impact of certain outstanding options; the impact of the outstanding convertible debentures is not included in the calculations as the impact would be anti-dilutive. The calculation of diluted loss per share for year ended December 31, 2013 does not include impact of the outstanding options and convertible debentures as the impact would have been anti-dilutive.
For the year ended December 31, | | 2014 | | 2013 | |
| | | | | |
Earnings (loss) from continuing operations | | $ | 23,614 | | $ | (229,167 | ) |
Weighted average basic number of common shares outstanding (in ‘000s) | | 421,158 | | 416,536 | |
Basic earnings (loss) per share from continuing operations | | $ | 0.06 | | $ | (0.55 | ) |
| | | | | |
Weighted average diluted number of common shares outstanding (in ‘000s) | | 426,325 | | 416,536 | |
Diluted earnings (loss) per share from continuing operations | | $ | 0.06 | | $ | (0.55 | ) |
For the year ended December 31, | | 2014 | | 2013 | |
Net earnings (loss) | | $ | 23,614 | | $ | (233,469 | ) |
Weighted average basic number of common shares outstanding (in ‘000s) | | 421,158 | | 416,536 | |
Basic earnings (loss) per share | | $ | 0.06 | | $ | (0.56 | ) |
Weighted average diluted number of common shares outstanding (in ‘000s) | | 426,325 | | 416,536 | |
Diluted earnings (loss) per share | | $ | 0.06 | | $ | (0.56 | ) |
49
LAKE SHORE GOLD CORP.
NOTES TO THE CONSOLIDATED FINANCIAL STATEMENTS
FOR THE YEARS ENDED DECEMBER 31, 2014 AND 2013
(in thousands of Canadian dollars, except per share amounts)
Weighted average diluted number of common shares for years ended December 31, 2014 and 2013 is calculated as follows:
For the year ended December 31, | | 2014 | | 2013 | |
Weighted average commons share outstanding | | 421,158 | | 416,536 | |
In the money shares-share options (in ‘000s) | | 5,167 | | — | |
Weighted average diluted number of common shares outstanding | | 426,325 | | 416,536 | |
22. DEFINED CONTRIBUTION PENSION PLAN
The Company has a defined contribution pension plan which covers all the Company’s employees. The only obligation of the Company with respect to the plan is to make the specified contributions. During the year ended December 31, 2014, the Company recorded $1,679 of pension expense (2013 - $1,576) in the consolidated statement of comprehensive income (loss) and capitalized $296 to mining properties (2013 - $426) in the consolidated statement of financial position.
23. SUPPLEMENTAL CASH FLOW INFORMATION
For the year ended December 31, | | 2014 | | 2013 | |
| | | | | |
Change in operating working capital | | | | | |
(Increase) decrease in receivables and prepaids | | $ | (508 | ) | $ | 2,201 | |
(Increase) decrease in inventories and stockpiled ore | | (6,538 | ) | 7,227 | |
Increase (decrease) in accounts payable and accrued liabilities | | 7,911 | | (1,196 | ) |
| | $ | 865 | | $ | 8,232 | |
| | | | | |
Cash and cash equivalents at December 31 consist of: | | | | | |
Cash | | $ | 24,195 | | $ | 33,120 | |
Short term investments | | 30,175 | | — | |
| | $ | 54,370 | | $ | 33,120 | |
50
LAKE SHORE GOLD CORP.
NOTES TO THE CONSOLIDATED FINANCIAL STATEMENTS
FOR THE YEARS ENDED DECEMBER 31, 2014 AND 2013
(in thousands of Canadian dollars, except per share amounts)
For the year ended December 31, | | 2014 | | 2013 | |
| | | | | |
Mining interests | | | | | |
Reduction in working capital related to mining interests | | $ | (892 | ) | $ | (9,242 | ) |
Additions on finance lease assets | | 9,270 | | 5,899 | |
Changes in mine closure assets | | 795 | | (541 | ) |
Shares issued as part of mining property agreements | | 45 | | $ | 32 | |
Non cash borrowing costs capitalized | | — | | 6,205 | |
Shares received as part of the Mexico subsidiary disposal | | — | | (1,700 | ) |
Stock option expense capitalized | | — | | 149 | |
| | $ | 9,218 | | $ | 802 | |
| | | | | |
Assets held for sale | | | | | |
Translation of foreign operations | | — | | $ | 3,967 | |
| | $ | — | | $ | 3,967 | |
| | | | | |
Share Capital | | | | | |
Transfer of amounts from reserves | | 188 | | 13 | |
Shares issued for mining properties | | 45 | | 32 | |
Shares issued for financing agreement note 17(a) | | — | | 700 | |
Deferred premium on flow-through financing note 21(a) | | 3,658 | | — | |
| | $ | 3,891 | | $ | 745 | |
24. SEGMENTED INFORMATION
The Company has two operating segments: mining operations and exploration and advanced exploration. Corporate, which is not an operating segment, includes all the corporate growth and development activities and the corporate team that provides administrative, technical, financial and other support to all of the Company’s business units. Other corporate expenses include general and administrative costs and the Company’s share of loss of its equity investments; finance (loss) income, net, bank and debt interest and other charges and interest earned on cash and cash equivalents. The information reported below is based on the information provided to the Chief Executive Officer, who is the chief operating decision maker.
51
LAKE SHORE GOLD CORP.
NOTES TO THE CONSOLIDATED FINANCIAL STATEMENTS
FOR THE YEARS ENDED DECEMBER 31, 2014 AND 2013
(in thousands of Canadian dollars, except per share amounts)
As at and for the year ended December 31, 2014
| | Mining
operations* | | Exploration and
advanced
exploration** | | Corporate | | Total | |
Revenues | | $ | 256,144 | | $ | — | | $ | — | | $ | 256,144 | |
Earnings from mine operations | | $ | 64,112 | | $ | — | | $ | — | | $ | 64,112 | |
General and administrative | | — | | — | | (13,534 | ) | (13,534 | ) |
Exploration | | — | | (3,339 | ) | — | | (3,339 | ) |
Share of loss of investments in associates | | — | | — | | (865 | ) | (865 | ) |
Write down of available for sale investments | | — | | — | | (807 | ) | (807 | ) |
Earnings (loss) from operations and associates | | $ | 64,112 | | $ | (3,339 | ) | $ | (15,206 | ) | $ | 45,567 | |
Other loss, net | | — | | — | | (3,284 | ) | (3,284 | ) |
Finance loss, net | | — | | — | | (18,669 | ) | (18,669 | ) |
Net earnings (loss) | | $ | 64,112 | | $ | (3,339 | ) | $ | (37,159 | ) | $ | 23,614 | |
Expenditures on mining interests including movements on working capital | | $ | 56,296 | | $ | 656 | | $ | — | | $ | 56,952 | |
| | | | | | | | | |
Total assets | | $ | 454,611 | | $ | 105,182 | | $ | 59,885 | | $ | 619,678 | |
Total liabilities | | $ | 42,024 | | $ | — | | $ | 105,602 | | $ | 147,626 | |
As at and for the year ended December 31, 2013
| | Mining
operations* | | Exploration and
advanced
exploration** | | Corporate | | Total | |
Revenues | | $ | 192,647 | | $ | — | | $ | — | | $ | 192,647 | |
Loss from mine operations | | $ | (200,049 | ) | $ | — | | $ | — | | $ | (200,049 | ) |
General and administrative | | — | | — | | (12,555 | ) | (12,555 | ) |
Exploration | | — | | (1,313 | ) | — | | (1,313 | ) |
Write down of investments in associates | | — | | — | | (3,874 | ) | (3,874 | ) |
Share of loss of investments in associates | | | | | | (1,833 | ) | (1,833 | ) |
Loss from operations and associates | | $ | (200,049 | ) | $ | (1,313 | ) | $ | (18,262 | ) | $ | (219,624 | ) |
Other loss, net | | — | | — | | 5,133 | | 5,133 | |
Finance loss (net) | | — | | — | | (14,676 | ) | (14,676 | ) |
Loss from continuing operations | | (200,049 | ) | (1,313 | ) | (27,805 | ) | (229,167 | ) |
Loss from discontinued operations | | — | | (4,302 | ) | — | | (4,302 | ) |
Net loss | | $ | (200,049 | ) | $ | (5,615 | ) | $ | (27,805 | ) | $ | (233,469 | ) |
Expenditures on mining interests including movements on working capital | | $ | 99,849 | | $ | 52 | | $ | — | | $ | 99,901 | |
| | | | | | | | | |
Total assets | | $ | 454,350 | | $ | 104,568 | | $ | 39,014 | | $ | 597,932 | |
Total liabilities | | $ | 33,086 | | $ | — | | $ | 133,678 | | $ | 166,764 | |
52
LAKE SHORE GOLD CORP.
NOTES TO THE CONSOLIDATED FINANCIAL STATEMENTS
FOR THE YEARS ENDED DECEMBER 31, 2014 AND 2013
(in thousands of Canadian dollars, except per share amounts)
* Mining operations include activities related to the Company’s Timmins West Mine, Bell Creek Mine and Bell Creek Mill.
** Exploration and advanced exploration include green field exploration (which is expensed on the consolidated statement of income (loss)) as well as properties capitalized as per the Company’s policy (other than expenditures on properties forming part of mining operations).
The Company sells its gold bullion through several brokers and there is no economic dependence; the Company does not have any long term sales contracts.
25. FINANCIAL INSTRUMENTS
MANAGEMENT OF CAPITAL RISK
The Company manages its capital structure and makes adjustments to it to effectively support the acquisition, exploration and development of mineral properties. In the definition of capital, the Company includes, as disclosed on its consolidated statement of financial position: share capital, equity portion of convertible debentures, deficit, reserves and long-term debt (as disclosed in note 17).
The Company’s capital at December 31, 2014 and 2013 is as follows:
As at December 31, | | 2014 | | 2013 | |
Share capital | | $ | 1,033,623 | | $ | 1,017,262 | |
Equity portion of convertible debentures | | 14,753 | | 14,753 | |
Reserves | | 32,297 | | 31,388 | |
Deficit | | (608,621 | ) | (632,235 | ) |
Long term debt note 17 | | 96,298 | | 130,025 | |
| | $ | 568,350 | | $ | 561,193 | |
The Company believes it has sufficient funds to finance its current core operating, development and exploration expenditures. Longer term, the Company may pursue opportunities to raise additional capital through equity and/or debt markets as it progresses with its projects and properties. The Company will continue to assess new properties and seek to acquire an interest in additional properties if it feels there is sufficient geologic or economic potential and if it has adequate financial resources to do so.
Management reviews its capital management approach on an ongoing basis and believes that its approach, given the relative size of the Company, is reasonable.
The Sprott debt facility (note 17(a)) has certain financial covenants, which must be maintained on an ongoing basis, as follows:
· Leverage ratio of less than or equal to 3;
· Current ratio of no less than 1.10; and
· Cash and cash equivalents balance of not less than $10,000 (added effective December 12, 2013, effective date of the Modification Agreement (note 17(a)).
53
LAKE SHORE GOLD CORP.
NOTES TO THE CONSOLIDATED FINANCIAL STATEMENTS
FOR THE YEARS ENDED DECEMBER 31, 2014 AND 2013
(in thousands of Canadian dollars, except per share amounts)
Below are the definitions as provided in the agreement:
· Leverage ratio at a certain date is the ratio of net indebtedness to rolling EBITDA;
· EBITDA is defined as the Company’s earnings before interest, income taxes, depreciation and amortization under IFRS;
· Rolling EBITDA is the sum of EBITDA for the current quarter and for the three immediate preceding quarters;
· Current ratio is equal to current assets of the Company divided by current liabilities under IFRS. The December 12, 2013 Modification Agreement provide for certain exclusions from current liabilities; and
· Total indebtedness at a certain date includes the total borrowings of the Company (including the Facility, finance lease obligations but excluding accounts payable and accrued liabilities and environmental obligations);
Non-compliance with the financial covenants could result in the Company having to immediately repay the outstanding balance of the Sprott debt facility. Throughout 2014 and 2013 and as at December 31, 2014 and 2013 the Company was in full compliance with all applicable debt covenants.
Neither the Company nor its subsidiaries are subject to any other externally imposed capital requirements and do not have exposure to asset-backed commercial paper or similar products.
The Sprott debt facility is scheduled to be fully paid on May 29, 2015 with the last payment on the Gold Loan at which time the covenants will no longer be applicable.
54
LAKE SHORE GOLD CORP.
NOTES TO THE CONSOLIDATED FINANCIAL STATEMENTS
FOR THE YEARS ENDED DECEMBER 31, 2014 AND 2013
(in thousands of Canadian dollars, except per share amounts)
CARRYING VALUES OF FINANCIAL INSTRUMENTS
The carrying values of the financial assets and liabilities at December 31, 2014 and 2013 are as follows:
As at December 31, | | 2014 | | 2013 | |
Financial Assets | | | | | |
At fair value through profit or loss | | | | | |
Cash and cash equivalents | | $ | 54,370 | | $ | 33,120 | |
Restricted cash | | 7,418 | | 7,095 | |
Embedded derivative asset note 17(a) | | 1,412 | | 6,703 | |
| | $ | 63,200 | | $ | 46,918 | |
Loans and receivable, measured at amortized cost | | | | | |
Receivables note 9 | | $ | 3,395 | | $ | 2,405 | |
| | | | | |
Available-for-sale, measured at fair value | | | | | |
Investments in public companies note 11 | | $ | 708 | | $ | 416 | |
| | | | | |
Financial Liabilities | | | | | |
At fair value through profit or loss | | | | | |
Minimum Return Derivative liability note 17(a(i)) | | $ | 687 | | $ | 2,406 | |
| | | | | |
Other financial liabilities, measured at fair value | | | | | |
Share-based liabilities note 18 | | $ | 2,088 | | $ | 754 | |
| | | | | |
Other financial liabilities, measured at amortized cost | | | | | |
Accounts payable and accrued liabilities | | $ | 26,531 | | $ | 21,619 | |
Long term debt note 17 | | $ | 96,298 | | $ | 130,025 | |
| | $ | 122,829 | | $ | 151,644 | |
FAIR VALUES OF FINANCIAL INSTRUMENTS
The fair values of cash and cash equivalents, restricted cash, receivables and accounts payable and accrued liabilities approximate their carrying values due to the short-term to maturity of these financial instruments. The fair value of debentures at December 31, 2014 is $97,021 (December 31, 2013 - $79,809).
55
LAKE SHORE GOLD CORP.
NOTES TO THE CONSOLIDATED FINANCIAL STATEMENTS
FOR THE YEARS ENDED DECEMBER 31, 2014 AND 2013
(in thousands of Canadian dollars, except per share amounts)
The fair value hierarchy of financial instruments measured at fair value on the balance sheet is as follows:
As at December 31, | | 2014 | | 2013 | |
| | Level 1 | | Level 1 | |
| | | | | |
Cash and cash equivalents | | $ | 54,370 | | $ | 33,120 | |
Restricted cash | | $ | 7,418 | | $ | 7,095 | |
Investments in public companies note 11 | | $ | 708 | | $ | 416 | |
Standby Line liability note 17(a(ii)) | | $ | — | | $ | 30,000 | |
| | Level 2 | | Level 2 | |
| | | | | |
Gold loan liability | | $ | 7,049 | | $ | 21,192 | |
Embedded derivative asset liability note 17(a(i)) | | $ | 1,412 | | $ | 6,703 | |
Minimum Return Derivative liability note 17(a(i)) | | $ | 687 | | $ | 2,406 | |
Share-based liabilities note 18 | | $ | 2,088 | | $ | 754 | |
The Company does not have any financial instruments measured using Level 3 inputs. The Company does not offset financial assets with financial liabilities and there were no transfers between Level 1 and Level 2 input financial instruments.
The fair value of the gold loan liability and embedded derivative (asset) liability are determined by discounting future payments based on forward gold prices and forward US$/Canadian$ foreign exchange rates.
The fair value of share-based liabilities is determined based on option pricing models that utilize a variety of inputs that are a combination of quoted prices and market corroborated inputs.
RISK MANAGEMENT POLICIES
The Company is exposed to financial risks sensitive to changes in commodity prices, foreign exchange and interest rates. The Company’s Board of Directors has overall responsibility for the establishment and oversight of the risk management framework. Currently the Company has not entered into any material options, forward or future contracts to manage its price-related exposures. Similarly, derivative financial instruments are not used to reduce these financial risks.
The Company’s risk exposures and the impact on the Company’s financial instruments are summarized below:
Credit Risk
The Company’s credit risk is primarily attributable to receivables, which mainly consist of sales tax due from the Federal Government of Canada. The Company’s surplus cash at December 31, 2014, is invested in liquid low risk accounts in A rated Canadian Banks. The Company has no significant concentration of credit risk arising from operations. Management believes that the credit risk concentration with respect to financial instruments included in other assets is remote.
56
LAKE SHORE GOLD CORP.
NOTES TO THE CONSOLIDATED FINANCIAL STATEMENTS
FOR THE YEARS ENDED DECEMBER 31, 2014 AND 2013
(in thousands of Canadian dollars, except per share amounts)
Liquidity Risk
The Company’s approach to managing liquidity risk is to ensure that it will have sufficient liquidity to meet liabilities when due. The Company has a planning and budgeting process in place to help determine the funds required to support the Company’s normal operating requirements on an ongoing basis and its expansionary plans. In the normal course of business, the Company enters into contracts that give rise to commitments for future payments as disclosed in notes 14, 16 and 27. All of the Company’s financial liabilities are subject to normal trade terms.
Market Risk
a. Interest rate risk
The Company is exposed to interest rate fluctuations related to interest earned on its cash on hand. The Company’s current policy is to invest surplus cash in low risk investments with banking institutions. The Company periodically monitors the investments it makes and is satisfied with the credit ratings of its banks and investments.
The Company’s surplus cash at December 31, 2014, is invested in liquid and low risk accounts in A rated Canadian Banks. The Company is exposed to short term interest rates through the interest earned on cash balances. A 1% change in short term rates would change the interest income and net earnings (loss) of the Company, assuming that all other variables remain constant, by approximately $470 in 2014 (2013 - $260).
b. Price risk
The Company is exposed to price risk with respect to fluctuation in gold prices which impacts the future economic feasibility of its mining interests and cash earnings from its operating mines. The Company is also exposed to price risk with respect to its gold loan facility (note 17(a)), which will be repaid using a fixed amount of gold ounces multiplied by the Bloomberg gold closing price on the date of payment.
The Company has not entered into any material derivative financial instruments to manage exposure to price risk. Gold prices are affected by numerous factors such as the sale or purchase of gold by various central banks and financial institutions, interest rates, exchange rates, inflation or deflation, fluctuations in the value of the US dollar and foreign currencies, global and regional supply and demand, and the political and economic conditions of major gold producing countries throughout the world. A 10% change in gold prices would result in approximately $25,058 change in the Company’s net earnings for 2014 (2013 - $19,500); the change in the net earnings includes $Nil for 2014 (2013 - $300) change in the mark to market value of gold loan derivatives.
c. Foreign currency exchange risk
The Company is exposed to foreign currency exchange risk with respect to future gold sales, since gold sales are denominated in United States Dollars (US$) and the Company’s functional currency is Canadian dollar. The movements on US$ rates may impact the future economic feasibility of the Company’s mining interests.
57
LAKE SHORE GOLD CORP.
NOTES TO THE CONSOLIDATED FINANCIAL STATEMENTS
FOR THE YEARS ENDED DECEMBER 31, 2014 AND 2013
(in thousands of Canadian dollars, except per share amounts)
The Company is also exposed to foreign currency exchange risk with respect to its gold loan facility (note 17(a)), which will be repaid using a fixed amount of gold ounces multiplied by the Bloomberg gold closing price on the date of payment (gold price is denominated in US$). A 10% change in the US$/CAD$ exchange rate would change the unrealized foreign exchange gain (loss) and net earnings of the Company for 2014, assuming that all other variables remains constant, by approximately $592 in 2014 (2013 - $300).
26. RELATED PARTY TRANSACTIONS
Balances and transactions between the Company and its subsidiaries have been eliminated on consolidation and are not disclosed in this note.
Compensation of key management personnel
The remuneration of directors and other members of key executive management personnel (Chief Executive Officer, Senior Vice President and Chief Financial Officer, Vice President of Operations and Senior Vice President of Exploration) during the years ended December 31, 2014 and 2013 are as follows:
For the year ended December 31, | | 2014 | | 2013 | |
Salaries and directors’ fees | | $ | 3,300 | | $ | 2,256 | |
Benefits | | 162 | | 174 | |
Share-based payments | | 1,638 | | 1,584 | |
| | $ | 5,100 | | $ | 4,014 | |
Share-based payments include the share-based payment expense for options granted of $702 (2013 - $1,337), PSUs $562 (2013 - $151) and DSUs $374 (2013 - $96); there were no post-employment benefits, or other long term benefits during the years ended December 31, 2014 and 2013. There was $358 termination benefits paid for 2014 (2013 - $Nil).
Related party transactions are measured at the exchange amount which is the consideration agreed to between the parties.
58
LAKE SHORE GOLD CORP.
NOTES TO THE CONSOLIDATED FINANCIAL STATEMENTS
FOR THE YEARS ENDED DECEMBER 31, 2014 AND 2013
(in thousands of Canadian dollars, except per share amounts)
27. COMMITMENTS AND CONTRACTUAL OBLIGATIONS
In addition to royalty commitments and contractual obligations under various property agreements (note 14), the Company’s existing contractual obligations are as follows:
| | Payments Due by Period | |
Contractual obligations | | Total | | Less than a
year | | 1-3 years | | 4-5 years | | After 5
years | |
Accounts payable and accrued liabilities | | $ | 26,531 | | $ | 26,531 | | $ | — | | $ | — | | $ | — | |
Finance leases and other | | $ | 15,936 | | $ | 7,605 | | $ | 7,642 | | $ | 689 | | $ | — | |
Environmental rehabilitation provision | | $ | 5,640 | | $ | — | | $ | — | | $ | — | | $ | 5,640 | |
Long term debt - principal and interest payments | | $ | 129,452 | | $ | 12,997 | | $ | 116,455 | | $ | — | | $ | — | |
| | $ | 177,559 | | $ | 47,133 | | $ | 124,097 | | $ | 689 | | $ | 5,640 | |
59
| ANNUAL GENERAL MEETING TMX Broadcast Centre The Exchange Tower 130 King Street West Toronto, Ontario, Canada M5X 1J2 April 29, 2015 at 4:30 p.m. Corporate Information Board of Directors Alan Moon, Chair (1) (3) (4) Anthony Makuch (2) Peter Crossgrove (1) (4) (5) Diane Francis (1) (3) (4) Jonathan Gill (2) (4) (5) Frank Hallam (2) (3) Ingrid Hibbard Arnold Klassen (1) (3) (5) (1) Corporate Governance and Nominating Committee (2) Health, Safety, Environment and Community Committee (3) Audit Committee (4) Compensation Committee (5) Technical Advisory Committee Head Office 181 University Ave., Suite 2000, Toronto, Ontario, Canada M5H 3M7 Tel: 416 703 6298 | Fax: 416 703 7764 | Internet: www.lsgold.com Investor Relations Mark Utting Vice-President, Investor Relations Tel: 416-703-6298 x 2226 Timmins Operations and Exploration P.O. Box 1067 Timmins, Ontario, Canada P4N 7H9 Tel: 705-269-4344 Fax: 705-268-1794 Officers Anthony (Tony) Makuch, President & CEO Philip Yee, Senior Vice-President & CFO Eric Kallio, Senior Vice-President, Exploration Alasdair Federico, Vice-President, General Counsel & Corporate Secretary Tina Ouellette, Vice-President, Human Resources Mark Utting, Vice-President, Investor Relations Peter Van Alphen, Vice-President, Operations Natasha Vaz, Vice-President, Technical Services Merushe (Meri) Verli, Vice-President, Finance Transfer Agent Computershare Investor Services Inc. Toll-free within North America 1 (800) 564 6253 International: (514) 982 7555 Email: service@computershare.com Manage your shares online at Computershare’s Investor Centre at www-us.computershare.com/investor Auditors Deloitte LLP 181 Bay Street, Suite 1400 Toronto, Ontario, Canada M5J 2V1 Stock Exchange Listings: TSX – LSG, NYSE MKT – LSG |
| LAKE SHORE GOLD CORP. 181 University Ave., Suite 2000 Toronto, Ontario, Canada M5H 3M7 tel 416 703 6298 fax 416 703 7764 www.lsgold.com |