Regions Financial (RF) 8-KRegulation FD Disclosure
Filed: 3 Nov 05, 12:00am
| BancAnalysts Association of Boston November 3, 2005 D. Bryan Jordan Executive Vice President and Chief Financial Officer Regions Financial Corporation |
| FORWARD-LOOKING STATEMENT The information contained in this presentation may include forward-looking statements that reflect Regions' current views with respect to future events and financial performance. You should not place undue reliance on these statements as the forward-looking statements are based on current expectations and general assumptions and are subject to various risks, uncertainties, and other factors that may cause actual results to differ materially from the views, beliefs, and projections expressed in such statements. Such forward-looking statements are made in good faith by Regions pursuant to the "safe harbor" provisions of the Private Securities Litigation Reform Act of 1995. The words "believe", "expect", "anticipate", "project", and similar expressions signify forward-looking statements. Readers are cautioned not to place undue reliance on any forward-looking statements made by or on behalf of Regions. Any such statement speaks only as of the date the statement was made. Regions undertakes no obligation to update or revise any forward-looking statements. Some factors which may affect the accuracy of our projections apply generally to the financial services industry, including: (a) the easing of restrictions on participants in the financial services industry, such as banks, securities brokers and dealers, investment companies, and finance companies, may increase our competitive pressures: (b) possible changes in interest rates may increase our funding costs and reduce our earning asset yields, thus reducing our margins; (c) possible changes in general economic and business conditions in the United States and the South in general and in the communities we serve in particular may lead to a deterioration in credit quality, thereby increasing our provisioning costs, or a reduced demand for credit, thereby reducing our earning assets; (d) the existence or exacerbation of general geopolitical instability and uncertainty, including the threat or occurrence of acts of terror or the occurrence or escalation of hostilities; (e) possible changes in trade, monetary and fiscal policies, laws, and regulations, and other activities of governments, agencies, and similar organizations, including changes in accounting standards, may have an adverse effect on our business; and (f) possible changes in consumer and business spending and saving habits and in employment levels could have an effect on our ability to grow our assets and to attract deposits. Other factors which may affect the accuracy of our projections are specific to Regions, including (i) the cost and other effects of material contingencies, including litigation contingencies; (ii) our ability to expand into new markets and to maintain profit margins in the face of pricing pressures; (iii) our ability to keep pace with technological changes; (iv) our ability to develop competitive new products and services in a timely manner and the acceptance of such products and services by Regions customers and potential Regions customers; (v) our ability to effectively manage interest rate risk, credit risk and operational risk; (vi) our ability to manage fluctuations in the value of our assets and liabilities and off-balance sheet exposures so as to maintain sufficient capital liquidity to support our business; and (vii) our ability to achieve the earnings expectations related to the businesses that we have recently acquired or may acquire in the future, which in turn depends on a variety of factors, including: our ability to achieve anticipated cost savings and revenue enhancements with respect to acquired operations: the assimilation of acquired operations to the Regions corporate culture, including the ability to instill our credit practices and efficient approach to acquired operations; and the continued growth of the markets that the acquired entities serve, consistent with recent historical experience. |
| Overview of Regions How Regions is Improving Profitable Growth |
| * Based on annualized YTD05 financial results as of September 30 Regions Financial Corporation $85 billion in assets Approximately $15 billion in market capitalization $4.7 billion* in revenues from diversified sources 5 million customers Strong banking franchise in South, Midwest and Texas with over 1,300 branches Over 280 brokerage offices in 16 states One of Top 15 U.S. banking companies |
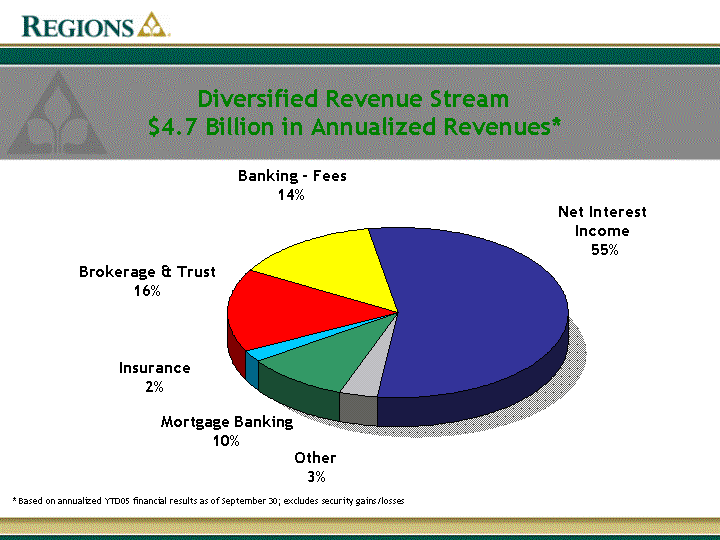
| Diversified Revenue Stream $4.7 Billion in Annualized Revenues* Net II Other Mortgage Insurance Brokerage Fees 55 3.5 10 2 16 14 Insurance 2% Net Interest Income 55% Mortgage Banking 10% Brokerage & Trust 16% Banking - Fees 14% * Based on annualized YTD05 financial results as of September 30; excludes security gains/losses Other 3% |
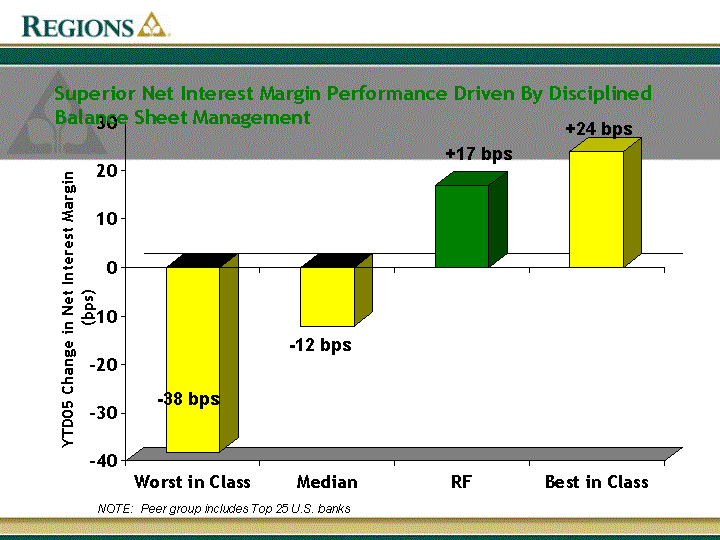
| Worst in Class Median RF Best in Class East -38 -12 17 24 Superior Net Interest Margin Performance Driven By Disciplined Balance Sheet Management YTD05 Change in Net Interest Margin (bps) +17 bps - -12 bps - -38 bps +24 bps NOTE: Peer group includes Top 25 U.S. banks |
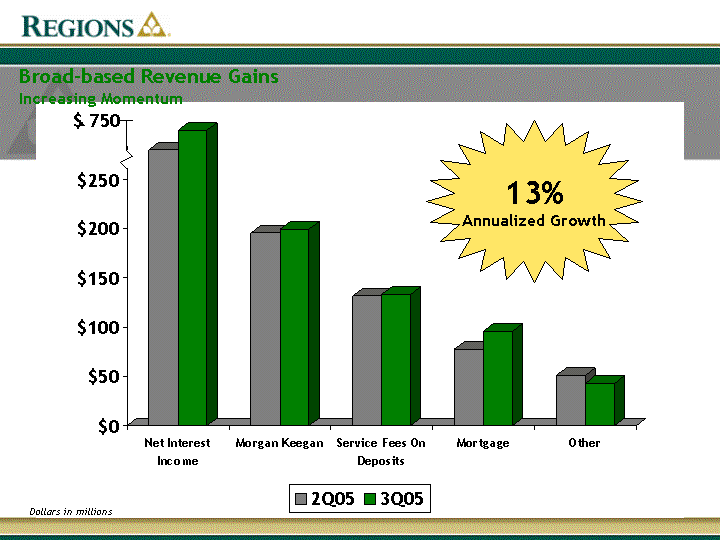
| Net Interest Income Morgan Keegan Service Fees On Deposits Mortgage Other 2Q05 280 195.6 131.7 78 50.7 3Q05 300 199.4 132.9 95.9 43 13% Annualized Growth Broad-based Revenue Gains Increasing Momentum Dollars in millions $ 750 |
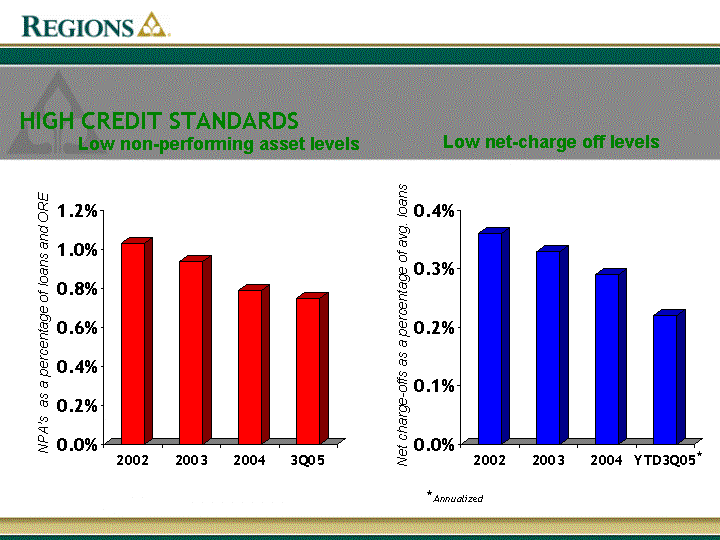
| HIGH CREDIT STANDARDS 2002 2003 2004 3Q05 East 0.0103 0.0094 0.0079 0.0075 2002 2003 2004 YTD3Q05 East 0.0036 0.0033 0.0029 0.0022 Low non-performing asset levels Low net-charge off levels Net charge-offs as a percentage of avg. loans NPA's as a percentage of loans and ORE * *Annualized |
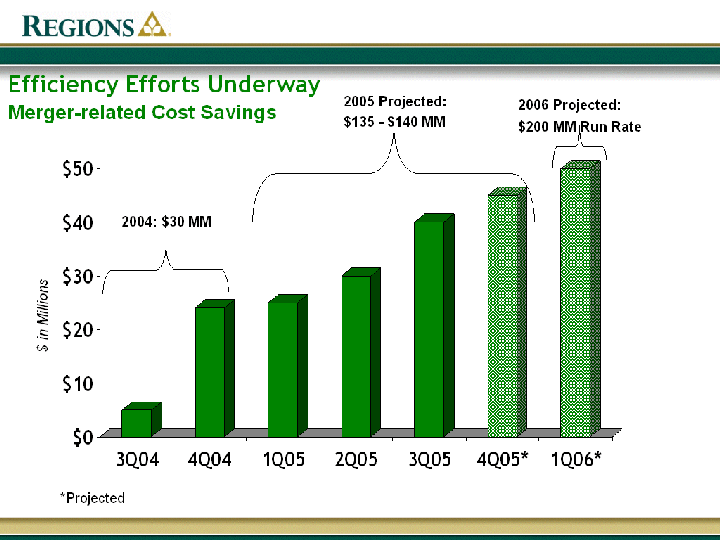
| Efficiency Efforts Underway 3Q04 4Q04 1Q05 2Q05 3Q05 4Q05* 1Q06* East 5 24 25 30 40 45 50 Merger-related Cost Savings 2004: $30 MM 2005 Projected: $135 - $140 MM *Projected $ in Millions 2006 Projected: $200 MM Run Rate |
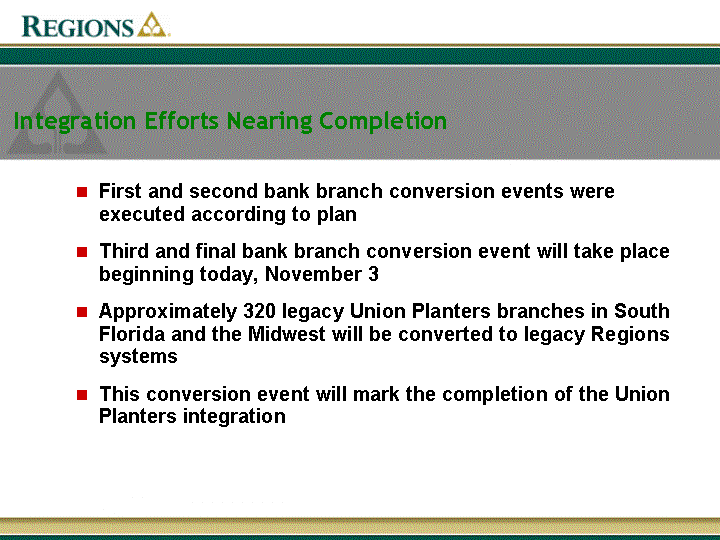
| Integration Efforts Nearing Completion First and second bank branch conversion events were executed according to plan Third and final bank branch conversion event will take place beginning today, November 3 Approximately 320 legacy Union Planters branches in South Florida and the Midwest will be converted to legacy Regions systems This conversion event will mark the completion of the Union Planters integration |
| Overview of Regions How Regions is Improving Profitable Growth |
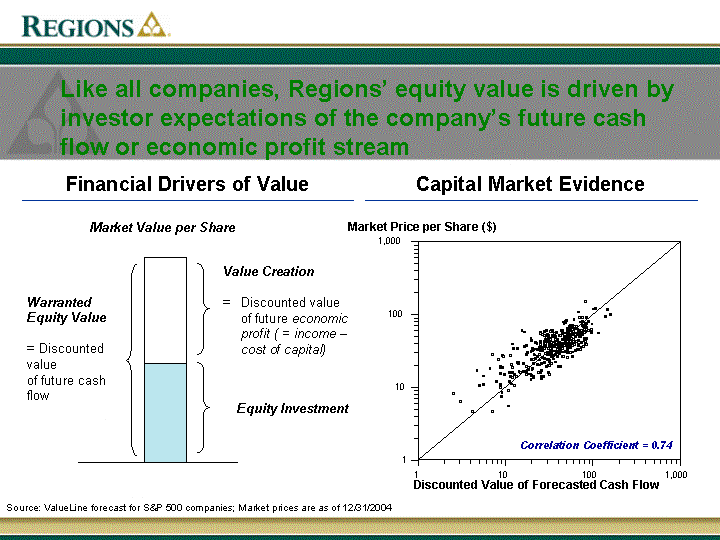
| Financial Drivers of Value Capital Market Evidence Like all companies, Regions' equity value is driven by investor expectations of the company's future cash flow or economic profit stream Discounted Value of Forecasted Cash Flow Market Price per Share ($) 1 10 100 1,000 1 10 100 1,000 Correlation Coefficient = 0.74 Source: ValueLine forecast for S&P 500 companies; Market prices are as of 12/31/2004 Value Creation = Discounted value of future economic profit ( = income - cost of capital) Market Value per Share Warranted Equity Value = Discounted value of future cash flow Equity Investment |

| Growth Vs Returns Note: Cost of Equity of 10%; M/B = Market to Book Ratio Improving shareholder value requires both improved returns and profitable growth Year 5 ROE expectations Growth Creates Value (ROE > COE) Value Neutral (ROE = COE) Growth Consumes Value (ROE < COE) 15% 10% 5% 25% 20% 0% 2% 4% 6% 8% 5-year GROWTH expectations 12% 10% M/B = 2 M/B =4 M/B=1 RF M/B =3 |
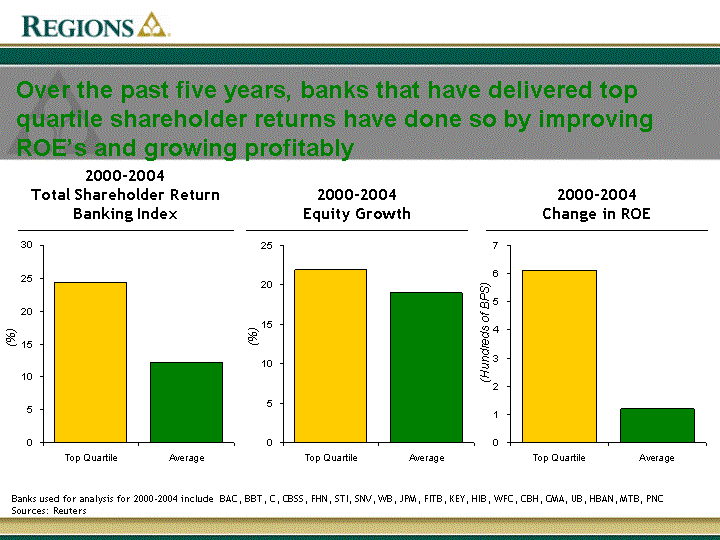
| Top Quartile 24.4 Average 12.3 Over the past five years, banks that have delivered top quartile shareholder returns have done so by improving ROE's and growing profitably Banks used for analysis for 2000-2004 include BAC, BBT, C, CBSS, FHN, STI, SNV, WB, JPM, FITB, KEY, HIB, WFC, CBH, CMA, UB, HBAN, MTB, PNC Sources: Reuters 2000-2004 Total Shareholder Return Banking Index 2000-2004 Equity Growth 2000-2004 Change in ROE Top Quartile 21.9 Average 19 Top Quartile 6.1 Average 1.2 (%) (%) (Hundreds of BPS) |
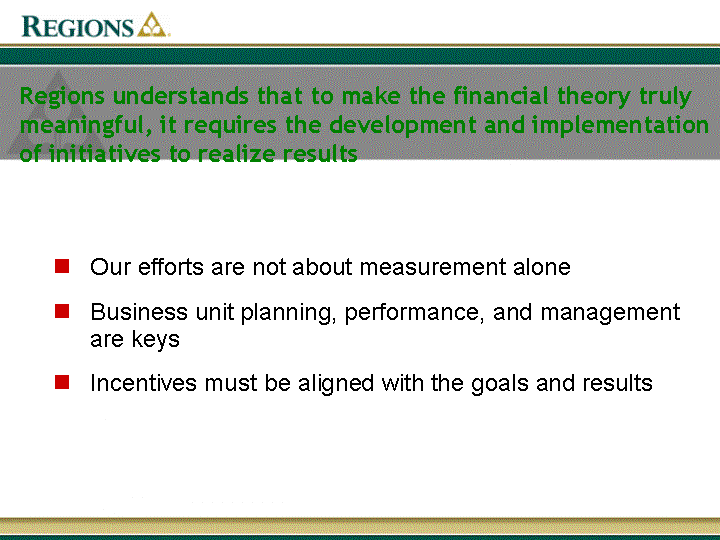
| Regions understands that to make the financial theory truly meaningful, it requires the development and implementation of initiatives to realize results Our efforts are not about measurement alone Business unit planning, performance, and management are keys Incentives must be aligned with the goals and results |
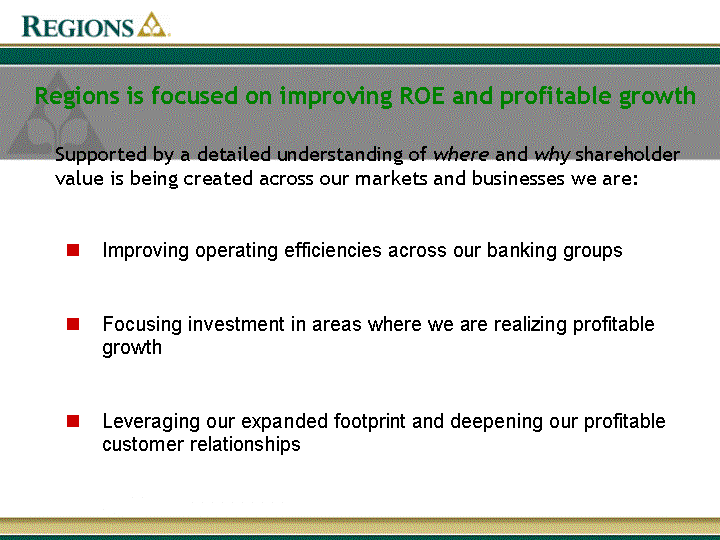
| Regions is focused on improving ROE and profitable growth Improving operating efficiencies across our banking groups Focusing investment in areas where we are realizing profitable growth Leveraging our expanded footprint and deepening our profitable customer relationships Supported by a detailed understanding of where and why shareholder value is being created across our markets and businesses we are: |
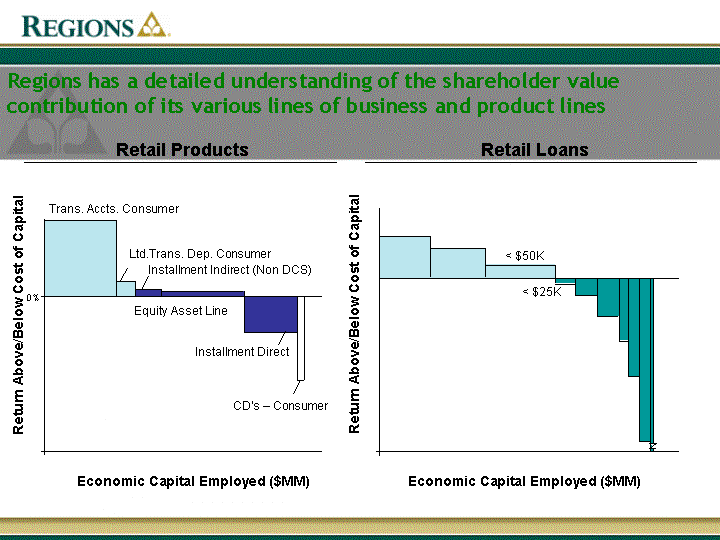
| Regions has a detailed understanding of the shareholder value contribution of its various lines of business and product lines Economic Capital Employed ($MM) 0% Trans. Accts. Consumer Ltd.Trans. Dep. Consumer Installment Indirect (Non DCS) Equity Asset Line Installment Direct CD's - Consumer Retail Products Economic Capital Employed ($MM) < $50K < $25K Retail Loans Return Above/Below Cost of Capital Return Above/Below Cost of Capital |

| Deposits Drive Branch Profitability Opportunities exist for profitable growth in all market types Urbanicity vs. Profitability 139 294 264 338 272 Urbanicity # Branches Urban Suburban Rural EP 1-3 4 5 6 7 Regions has good performing branches in every market type... Median Branch Most profitable Least profitable |
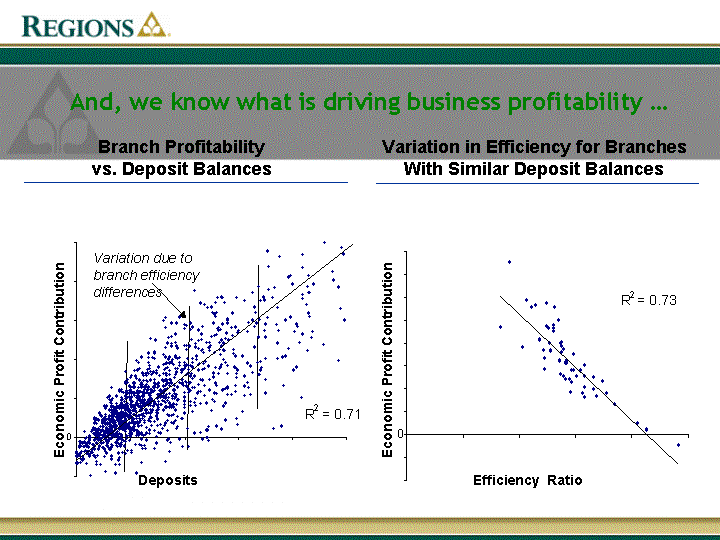
| Branch Profitability vs. Deposit Balances Variation in Efficiency for Branches With Similar Deposit Balances Economic Profit Contribution Economic Profit Contribution Deposits Variation due to branch efficiency differences R 2 = 0.71 0 R 2 = 0.73 0 Efficiency Ratio And, we know what is driving business profitability ... |
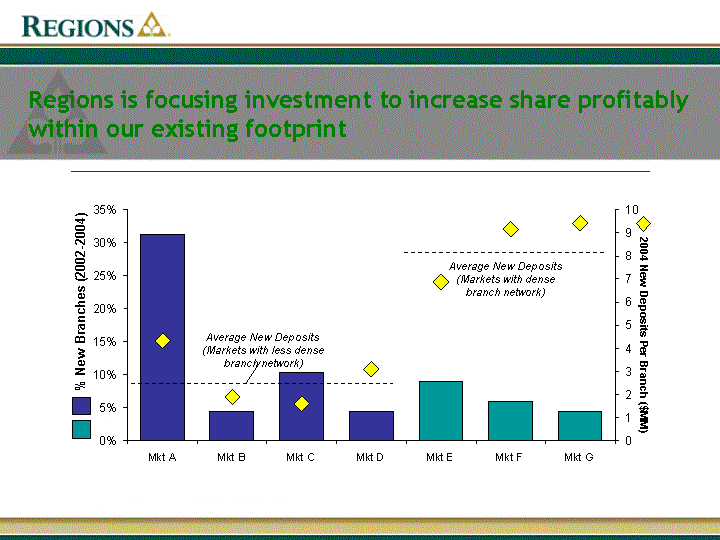
| Mkt A Mkt B Mkt C Mkt D Mkt E Mkt F Mkt G Deposit Growth/Branch 0.313 0.045 0.104 0.045 0.09 0.06 0.045 % New Branches 4.327 1.891 1.6 3.1 6.863 9.157 9.419 Regions is focusing investment to increase share profitably within our existing footprint 2004 New Deposits Per Branch ($MM) Average New Deposits (Markets with less dense branch network) Average New Deposits (Markets with dense branch network) % New Branches (2002-2004) |
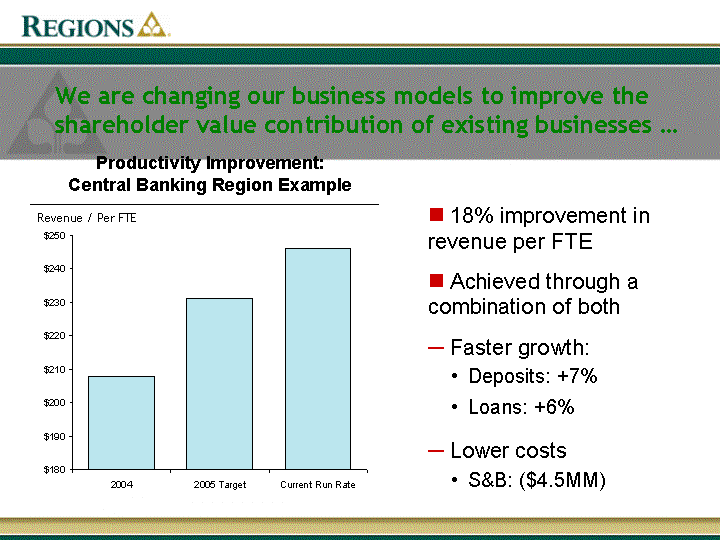
| Productivity Improvement: Central Banking Region Example We are changing our business models to improve the shareholder value contribution of existing businesses ... 2004 208 2005 Target 231 Current Run Rate 246 Revenue / Per FTE 18% improvement in revenue per FTE Achieved through a combination of both Faster growth: Deposits: +7% Loans: +6% Lower costs S&B: ($4.5MM) |
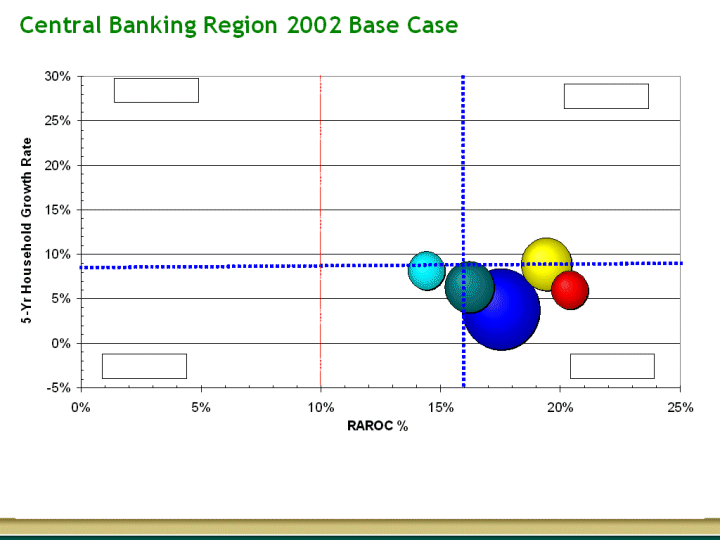
| Central Banking Region 2002 Base Case |
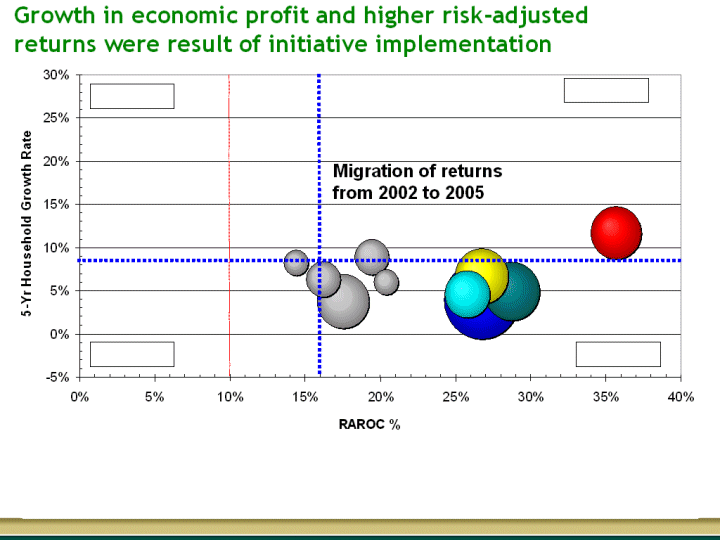
| Growth in economic profit and higher risk-adjusted returns were result of initiative implementation Migration of returns from 2002 to 2005 |
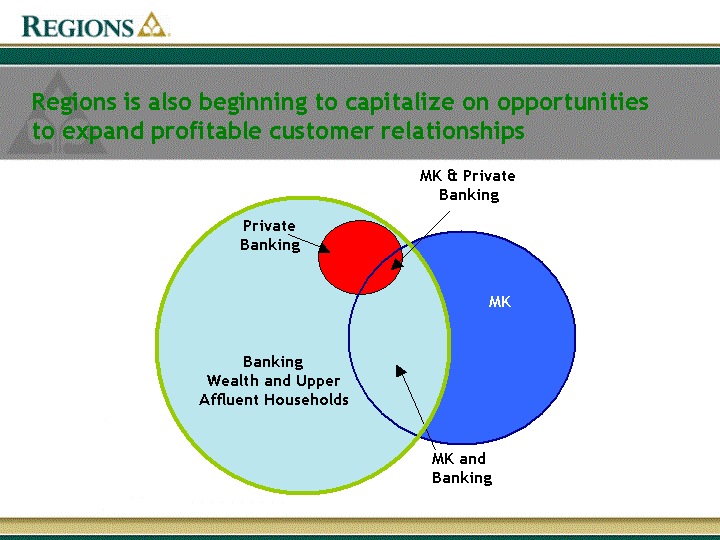
| Regions is also beginning to capitalize on opportunities to expand profitable customer relationships MK MK and Banking MK & Private Banking Private Banking Banking Wealth and Upper Affluent Households |

| Regions Bank Morgan Keegan Regions Insurance Group Regions has a strong presence in very attractive markets and is making business model and resource allocation changes to improve profitable growth |
| Regions is focused on improving shareholder value We have a detailed understanding of where and why shareholder value is being created across and within our business portfolio Our successful merger has provided new opportunities to improve the value contribution of our existing businesses and realize profitable expansion within our expanded geographic footprint We are in the process of implementing business model changes and refocusing investments to increase both growth and return on capital |