 Citigroup 2007 Beyond the Basics Financial Services Forum May 22, 2007 Exhibit 99.1 |
 |
 A Top Ten U.S. Bank Holding Company › Market Capitalization $26 billion 10th › Assets $138 billion 10th › Loans, net of unearned income $94 billion 9th › Deposits $95 billion 8th › Branches 1,913 7th › ATMs 2,590 8th National Rank 1 1 As of March 31, 2007. |
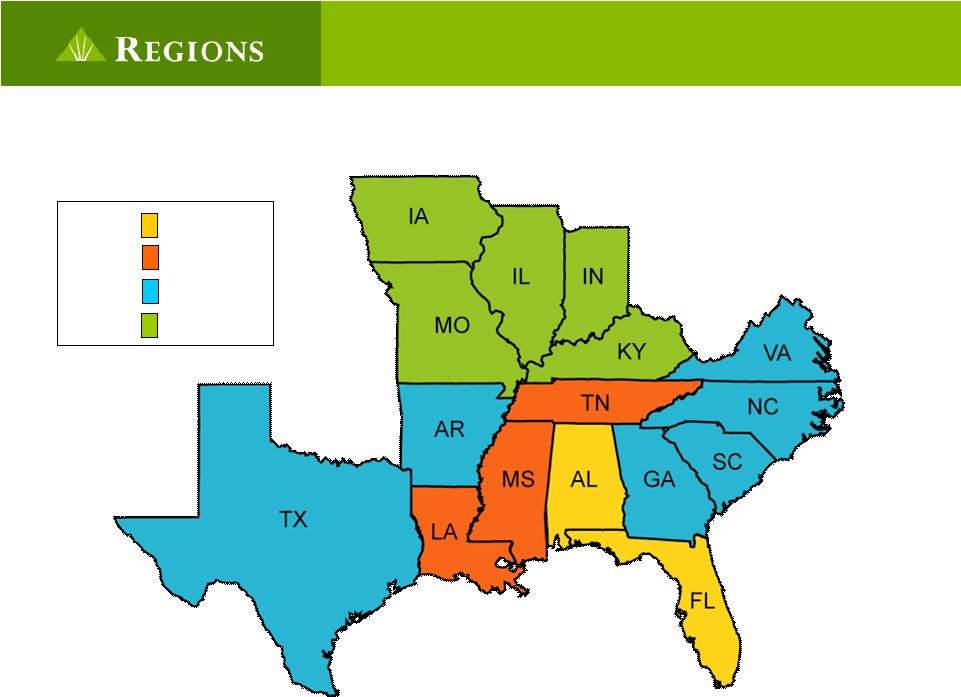
 Franchise Footprint Source: SNL DataSource. Deposit data as of 30-Jun-2006. State Dep. ($B) Mkt. Share Rank AL $20.8 30% #1 FL 18.4 5 #4 TN 17.6 17 #2 LA 7.8 11 #3 MS 6.5 16 #1 GA 5.5 3 #6 AR 4.4 10 #1 TX 2.9 1 #19 MO 2.3 2 #7 IN 1.9 2 #10 Other 4.3 — — Regions Morgan Keegan Insurance |
 Strong Local Market Share 10.9 Citigroup 14.9 SunTrust 15.1 National City 15.4 AmSouth 15.7 Regions 17.8 US Bancorp 18.7 Fifth Third 18.8 Bank of America 19.2 JPMorgan Chase 20.3 Wachovia 20.4 Regions / AmSouth 21.3 BB&T 23.8% Wells Fargo Weighted Average Market Share 1 Top U.S. Banks Regions compares favorably in terms of local market share relative to other top 10 banking franchises 1 Deposit weighted by county. Excludes deposits from branches with > $10bn of deposits. Based on June 30, 2006 data. Note: Excludes divested branches. |
 Key Integration Accomplishments › Announced Organizational Decisions › Identified Major Systems and Started Conversions › Completed Divestitures › Began Executing Branch Consolidation Plans › Cost Saves on Track › Capital Management |
 Organizational Structure Geographies Lines of Business Alabama Midwest East Florida West Tennessee Mississippi Morgan Keegan Matrix Business Model Private Banking Trust & Asset Mgmt Mortgage Consumer Banking Commercial Banking Business Banking |
 Conversion Timeline Combined Product Set & Incentives Complete Sale of Divested Branches 1Q07 2Q07 3Q07 4Q07 1Q08 2Q08 Brokerage Conversion Mortgage Origination & Servicing Conversion • Phase One Branch Conversion • Trust Conversion • Phase Three Branch Conversion • Phase Four Branch Conversion • Achieve $400 MM Annual Run-rate in Cost Saves • Phase Two Branch Conversion |
 Required Branch Divestitures All divestitures completed in 1Q07. Expected impact to pre-tax income: $23MM per quarter. $1.5 $2.0 39 Alabama $1.7 $2.7 52 Total .1 .4 7 Tennessee .1 .3 6 Mississippi Total Loans ($B) Total Deposits ($B) # of Branches State |
 Branch Conversion Schedule Event 1 3Q07 Event 2 4Q07 Event 3 1Q08 Event 4 2Q08 |
 Net Cost Saves: On-track $0 $100 $200 $300 $400 2008E 2007E 4Q06 $7 MM Estimated $150 MM Estimated $400 MM Net Cost Savings Full run-rate achieved by 2Q 2008 |
 Branch Consolidations 55 Tennessee 2 Arkansas 156 Total 2 Missouri 2 Georgia 12 Mississippi 17 Louisiana 31 Alabama 35 Florida Targeted closure dates to coincide with system conversions Significant source of efficiency gain Event 1 Event 2 Event 3 Event 4 |
 Capital Management – A Strategic Opportunity › During 2Q07: • Lowered overall cost of capital by issuing $700MM 6.625% Enhanced Trust Preferred Securities • Executed accelerated 14.2MM share repurchase › Capital ratios remain strong 6.20 6.52 Tangible Common 11.40 11.22 Total Risk Based 7.90% 7.96% Tier 1 Capital Projected 2Q07 1Q07 |
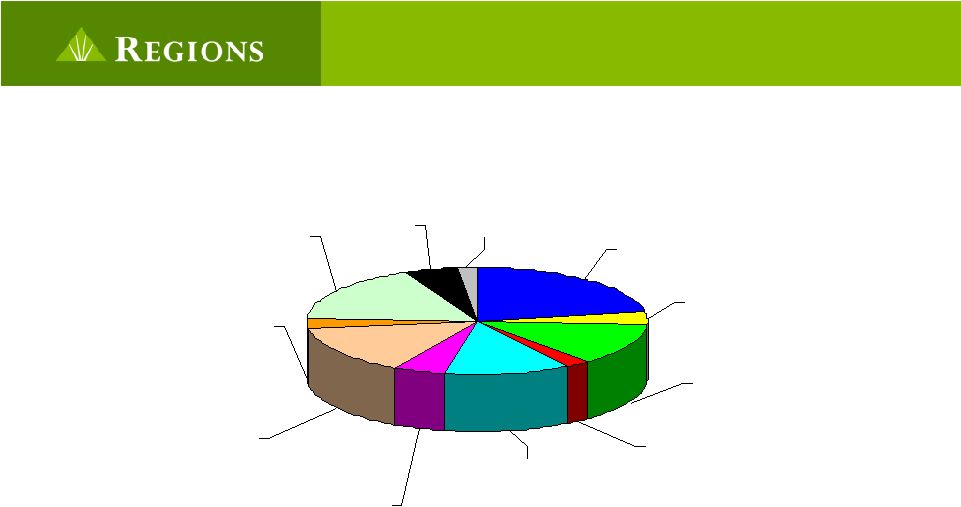
 Total Loan Portfolio – March 31, 2007 Loan Portfolio per Call Report Schedule RC-C › Over 50% of the Commercial and Industrial and Commercial Real Estate portfolio is under $3 million in note size Indirect 5% Other Consumer 2% Home Equity 17% Alt A 3% Owner Occupied Real Estate 12% Multifamily 2% Land and Other Construction 13% 1-4 Family Construction 4% Commercial / Leasing 22% Other Commercial Real Estate 5% Residential First Mortgage 15% |
 Commercial Real Estate (CRE) › The CRE portfolio is diversified by product, loan size, and by geography › Our CRE portfolio is very granular with the average note size under $500 thousand › This average note size is reflective of real estate done in our Community Banks › These loans are generally underwritten based on the individual borrower’s financial strength and consequently provide a different risk profile than larger CRE loans › The Top 5 MSA concentrations are Atlanta, Miami, Nashville, Tampa, and Birmingham, all of which are under 10% |
 Commercial Real Estate by Product Other Commercial Real Estate 14% Owner Occupied Real Estate 33% Multifamily 4% Land and Other Construction 37% 1-4 Family Construction 12% › Owner Occupied Commercial Real Estate is based on the credit strength of the operating company (borrower) and does not depend on the real estate for repayment Commercial Real Estate by Product per Call Report Schedule RC-C |
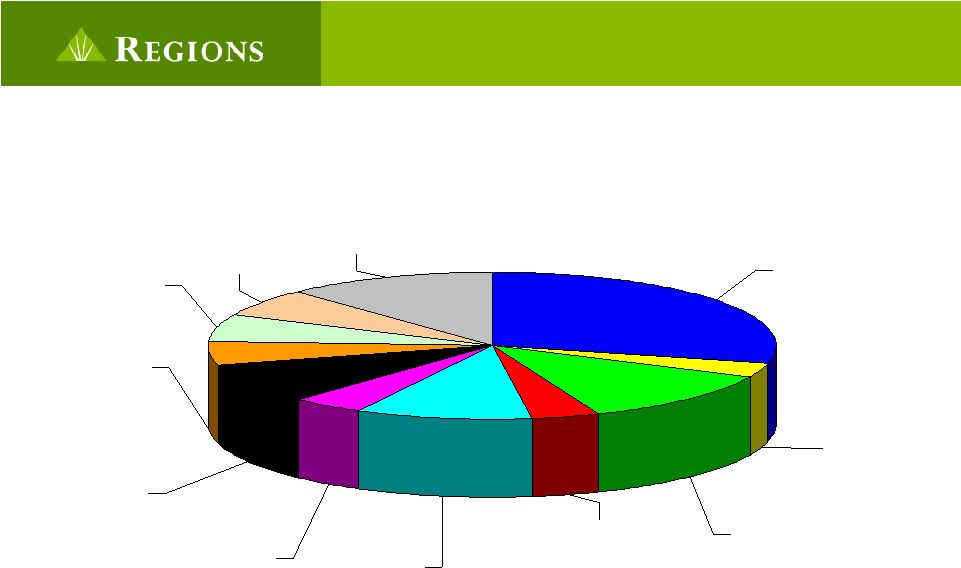
 Commercial Real Estate by Geography NC 6% Other 12% TX 6% LA 5% AL 10% AR 4% GA 12% MO 3% FL 29% SC 4% TN 9% |
 Florida Real Estate › Florida Commercial Real Estate: › 29% of our Commercial Real Estate outstandings are in Florida › 75% of the Florida outstandings are in the following high-growth MSAs: Tampa Bay Area, Miami, Panhandle, Orlando, Jacksonville, Naples, and Ft. Myers › Florida Consumer Real Estate: › Our Consumer exposure has low default probabilities as evidenced by the high average FICO scores of over 720 › There is good protection in the property as evidenced by an average LTV of 72%, which does not reflect past price appreciation › Florida economy: › Despite the slowdown in the housing markets, the Florida economy continues to perform well › The unemployment rate is 3.3%, improved since last year and below the national average › Jobs lost in the residential construction area have been largely offset by gains in heavy and civil engineering construction and ongoing growth in Florida’s core economy |
 Consumer Real Estate Portfolio › Average Loan Size = $125 thousand › 71% are first lien position › Weighted Average LTV FICO › Total Portfolio 72% 730 › Alt A 73% 729 › No negative amortizing mortgages › No Option Adjustable Rate Mortgages › EquiFirst sold 1Q2007 Remaining Loan Portfolio 65% Home Equity 17% Alt A 3% Residential First Mortgage 15% |
 * * * * * * |