Exhibit 99.2
| | |
 | | FINANCIAL SUPPLEMENT TO FOURTH QUARTER 2007 EARNINGS RELEASE |
Summary
Quarterly earnings of $0.10 per diluted share (GAAP); excluding $0.14 in after-tax merger charges, earnings were $0.24 (non-GAAP - see page 19 for additional details)
| | • | | Fourth quarter earnings were significantly affected by aggressive actions taken to address the decline in residential-related real estate demand and values within footprint |
| | • | | Earnings reflect: $358 million loan loss provision - $251 million above charge-offs; non-merger charges of $134 million - see page 12 of supplement for details |
Allowance for credit losses increases to 1.45 percent; higher charge-offs/NPAs
| | • | | Allowance for credit losses increases to 1.45 percent of loans at December 31, 2007 from 1.19 percent at September 30, 2007 |
| | • | | Net charge-offs of $107.5 million (annualized 0.45 percent of average loans versus 0.27 percent in 3Q07) |
| | • | | Non-performing assets increased to $864.1 million or 0.90 percent of loans and OREO versus 0.62 percent at September 30, 2007 |
| | • | | Residential builder portfolio primary driver of non-performing asset increase |
| | • | | Expect additional charge-off and non-performing asset increases in 2008 as housing downturn continues |
Aggressively managing problematic residential builder portfolio
| | • | | Thoroughly reviewed $7.2 billion residential builder portfolio and increased related loan loss reserves accordingly |
| | • | | Approximately $850 million has been identified for transfer into special assets during 4Q07 |
| | • | | Established a specifically tailored and detailed work-out program |
| | • | | Shifted experienced real estate lenders to oversee work-out execution and actively manage the portfolio |
| | • | | Balance of diversified $95 billion loan portfolio generally performing satisfactorily, including residential first mortgage and home equity portfolios |
Merger integration 100 percent complete
| | • | | Successfully completed all branch system consolidations— common customer platform in place, with second-to-none product set, industry leading support systems and highly trained personnel |
| | • | | Achieved approximately 87 percent customer retention rate throughout integration —above that of the typical bank not undergoing a merger |
| | • | | Associates’ full energy now focused on handling today’s industry challenges and on successfully executing our newly adopted three-year strategic plan |
Cost saves continue to exceed expectations
| | • | | Realized $108 million in merger cost saves during 4Q07, bringing the year-to-date total to $345 million versus $300 million target |
| | • | | Likely to exceed targeted $500 million 2Q08 run-rate |
| | • | | Pre-tax merger-related charges of $150.2 million in 4Q07 |
Strong fee-based revenue largely offsets softer spread revenue
| | • | | Non-interest revenue, excluding securities transactions, up an annualized 16 percent linked-quarter |
| | • | | Net interest income down slightly, reflecting 13 basis points linked-quarter net interest margin drop to 3.61 percent |
| | • | | Modest loan growth, an annualized 2 percent on average, linked-quarter |
Morgan Keegan achieves record quarterly revenue
| | • | | Revenue rose to $350.9 million 4Q07, $32.5 million above 3Q07 |
| | • | | Outstanding quarter for fixed income capital markets due to higher customer demand |
| | • | | Loss on MK mutual funds investment was driver of decline in 4Q07 net income |
| | • | | Investment banking and M&A-related deal flow was strong during the quarter and will continue into 2008 |
Capital position remains strong
| | • | | Tangible equity to tangible assets of 5.88 percent at December 31, 2007, compared to 6.02 percent as of September 30, 2007 |
| | • | | Repurchased 3.8 million common shares in 4Q07 |
FINANCIAL SUPPLEMENT TO
FOURTH QUARTER 2007 EARNINGS RELEASE
PAGE 2
Regions Financial Corporation and Subsidiaries
Consolidated Balance Sheets
(Unaudited)
($ amounts in thousands)
| | | | | | | | | | | | | | | | | | | | |
| | | 12/31/07 | | | 9/30/07 | | | 6/30/07 | | | 3/31/07 | | | 12/31/06 | |
Assets: | | | | | | | | | | | | | | | | | | | | |
Cash and due from banks | | $ | 3,720,365 | | | $ | 2,902,340 | | | $ | 2,796,196 | | | $ | 2,991,232 | | | $ | 3,550,742 | |
Interest-bearing deposits in other banks | | | 31,706 | | | | 29,895 | | | | 73,963 | | | | 37,365 | | | | 270,601 | |
Federal funds sold and securities purchased under agreements to resell | | | 1,177,170 | | | | 706,378 | | | | 1,158,771 | | | | 1,154,994 | | | | 896,075 | |
Trading account assets | | | 907,300 | | | | 1,355,007 | | | | 1,606,130 | | | | 1,490,374 | | | | 1,442,994 | |
Securities available for sale | | | 17,318,074 | | | | 16,957,077 | | | | 17,414,407 | | | | 18,361,050 | | | | 18,514,332 | |
Securities held to maturity | | | 50,935 | | | | 49,559 | | | | 44,452 | | | | 46,008 | | | | 47,728 | |
Loans held for sale | | | 720,924 | | | | 792,142 | | | | 1,596,425 | | | | 1,175,650 | | | | 3,308,064 | |
Loans held for sale - divestitures | | | — | | | | — | | | | — | | | | — | | | | 1,612,237 | |
Margin receivables | | | 504,614 | | | | 525,953 | | | | 590,811 | | | | 555,580 | | | | 570,063 | |
Loans, net of unearned income | | | 95,378,847 | | | | 94,373,632 | | | | 94,014,488 | | | | 94,168,260 | | | | 94,550,602 | |
Allowance for loan losses | | | (1,321,244 | ) | | | (1,070,716 | ) | | | (1,061,873 | ) | | | (1,056,260 | ) | | | (1,055,953 | ) |
| | | | | | | | | | | | | | | | | | | | |
Net loans | | | 94,057,603 | | | | 93,302,916 | | | | 92,952,615 | | | | 93,112,000 | | | | 93,494,649 | |
Premises and equipment, net | | | 2,610,851 | | | | 2,473,339 | | | | 2,422,256 | | | | 2,372,800 | | | | 2,398,494 | |
Interest receivable | | | 615,711 | | | | 664,974 | | | | 626,514 | | | | 627,918 | | | | 666,410 | |
Excess purchase price | | | 11,491,673 | | | | 11,453,078 | | | | 11,243,287 | | | | 11,191,675 | | | | 11,175,647 | |
Mortgage servicing rights (MSRs) | | | 321,308 | | | | 377,201 | | | | 400,056 | | | | 367,222 | | | | 374,871 | |
Other identifiable intangible assets | | | 759,832 | | | | 804,328 | | | | 809,827 | | | | 914,410 | | | | 957,834 | |
Other assets | | | 6,753,651 | | | | 5,841,002 | | | | 3,886,762 | | | | 3,669,790 | | | | 4,088,280 | |
| | | | | | | | | | | | | | | | | | | | |
Total Assets | | $ | 141,041,717 | | | $ | 138,235,189 | | | $ | 137,622,472 | | | $ | 138,068,068 | | | $ | 143,369,021 | |
| | | | | | | | | | | | | | | | | | | | |
Liabilities and Stockholders’ Equity: | | | | | | | | | | | | | | | | | | | | |
Deposits: | | | | | | | | | | | | | | | | | | | | |
Non-interest-bearing | | $ | 18,417,266 | | | $ | 18,834,856 | | | $ | 19,136,419 | | | $ | 19,942,928 | | | $ | 20,175,482 | |
Non-interest-bearing - divestitures | | | — | | | | — | | | | — | | | | — | | | | 533,295 | |
Interest-bearing | | | 76,357,702 | | | | 74,605,074 | | | | 75,919,972 | | | | 75,393,720 | | | | 78,281,120 | |
Interest-bearing - divestitures | | | — | | | | — | | | | — | | | | — | | | | 2,238,072 | |
| | | | | | | | | | | | | | | | | | | | |
Total deposits | | | 94,774,968 | | | | 93,439,930 | | | | 95,056,391 | | | | 95,336,648 | | | | 101,227,969 | |
Borrowed funds: | | | | | | | | | | | | | | | | | | | | |
Short-term borrowings: | | | | | | | | | | | | | | | | | | | | |
Federal funds purchased and securities sold under agreements to repurchase | | | 8,820,235 | | | | 8,063,739 | | | | 8,207,250 | | | | 8,159,929 | | | | 7,676,254 | |
Other short-term borrowings | | | 2,299,887 | | | | 1,727,346 | | | | 1,882,114 | | | | 2,356,205 | | | | 1,990,817 | |
| | | | | | | | | | | | | | | | | | | | |
Total short-term borrowings | | | 11,120,122 | | | | 9,791,085 | | | | 10,089,364 | | | | 10,516,134 | | | | 9,667,071 | |
Long-term borrowings | | | 11,324,790 | | | | 10,817,491 | | | | 9,287,926 | | | | 8,593,117 | | | | 8,642,649 | |
| | | | | | | | | | | | | | | | | | | | |
Total borrowed funds | | | 22,444,912 | | | | 20,608,576 | | | | 19,377,290 | | | | 19,109,251 | | | | 18,309,720 | |
Other liabilities | | | 3,998,808 | | | | 4,340,334 | | | | 3,492,404 | | | | 3,308,003 | | | | 3,129,878 | |
| | | | | | | | | | | | | | | | | | | | |
Total Liabilities | | | 121,218,688 | | | | 118,388,840 | | | | 117,926,085 | | | | 117,753,902 | | | | 122,667,567 | |
Stockholders’ equity: | | | | | | | | | | | | | | | | | | | | |
Common stock | | | 7,347 | | | | 7,346 | | | | 7,344 | | | | 7,320 | | | | 7,303 | |
Additional paid-in capital | | | 16,544,651 | | | | 16,527,540 | | | | 16,500,425 | | | | 16,447,358 | | | | 16,339,726 | |
Retained earnings | | | 4,439,505 | | | | 4,632,033 | | | | 4,489,078 | | | | 4,289,354 | | | | 4,493,245 | |
Treasury stock | | | (1,370,761 | ) | | | (1,270,922 | ) | | | (1,063,779 | ) | | | (368,837 | ) | | | (7,548 | ) |
Accumulated other comprehensive income (loss) | | | 202,287 | | | | (49,648 | ) | | | (236,681 | ) | | | (61,029 | ) | | | (131,272 | ) |
| | | | | | | | | | | | | | | | | | | | |
Total Stockholders’ Equity | | | 19,823,029 | | | | 19,846,349 | | | | 19,696,387 | | | | 20,314,166 | | | | 20,701,454 | |
| | | | | | | | | | | | | | | | | | | | |
Total Liabilities & SE | | $ | 141,041,717 | | | $ | 138,235,189 | | | $ | 137,622,472 | | | $ | 138,068,068 | | | $ | 143,369,021 | |
| | | | | | | | | | | | | | | | | | | | |
FINANCIAL SUPPLEMENT TO
FOURTH QUARTER 2007 EARNINGS RELEASE
PAGE 3
Regions Financial Corporation and Subsidiaries
Consolidated Statements of Income (1)(6)
(Unaudited)
($ amounts in thousands, except per share data)
| | | | | | | | | | | | | | | | | | | | |
| | | Quarter Ended | |
| | | 12/31/07 | | | 9/30/07 | | | 6/30/07 | | | 3/31/07 | | | 12/31/06 | |
Interest income on: | | | | | | | | | | | | | | | | | | | | |
Loans, including fees | | $ | 1,674,690 | | | $ | 1,742,172 | | | $ | 1,734,278 | | | $ | 1,773,404 | | | $ | 1,587,494 | |
Securities: | | | | | | | | | | | | | | | | | | | | |
Taxable | | | 202,669 | | | | 210,932 | | | | 218,123 | | | | 224,319 | | | | 200,917 | |
Tax-exempt | | | 9,361 | | | | 10,020 | | | | 10,831 | | | | 11,048 | | | | 9,807 | |
| | | | | | | | | | | | | | | | | | | | |
Total securities | | | 212,030 | | | | 220,952 | | | | 228,954 | | | | 235,367 | | | | 210,724 | |
Loans held for sale | | | 10,090 | | | | 12,302 | | | | 21,363 | | | | 48,342 | | | | 35,935 | |
Federal funds sold and securities purchased under agreements to resell | | | 17,032 | | | | 18,154 | | | | 17,162 | | | | 16,373 | | | | 15,877 | |
Trading account assets | | | 11,822 | | | | 10,271 | | | | 15,785 | | | | 15,620 | | | | 22,608 | |
Margin receivables | | | 8,160 | | | | 8,754 | | | | 9,289 | | | | 9,610 | | | | 9,576 | |
Time deposits in other banks | | | 344 | | | | 515 | | | | 649 | | | | 1,179 | | | | 1,376 | |
| | | | | | | | | | | | | | | | | | | | |
Total interest income | | | 1,934,168 | | | | 2,013,120 | | | | 2,027,480 | | | | 2,099,895 | | | | 1,883,590 | |
Interest expense on: | | | | | | | | | | | | | | | | | | | | |
Deposits | | | 625,600 | | | | 673,585 | | | | 677,239 | | | | 687,459 | | | | 597,255 | |
Short-term borrowings | | | 107,077 | | | | 115,092 | | | | 116,637 | | | | 120,661 | | | | 102,984 | |
Long-term borrowings | | | 157,279 | | | | 144,662 | | | | 128,269 | | | | 122,737 | | | | 123,199 | |
| | | | | | | | | | | | | | | | | | | | |
Total interest expense | | | 889,956 | | | | 933,339 | | | | 922,145 | | | | 930,857 | | | | 823,438 | |
| | | | | | | | | | | | | | | | | | | | |
Net interest income | | | 1,044,212 | | | | 1,079,781 | | | | 1,105,335 | | | | 1,169,038 | | | | 1,060,152 | |
Provision for loan losses | | | 358,000 | | | | 90,000 | | | | 60,000 | | | | 47,000 | | | | 59,825 | |
| | | | | | | | | | | | | | | | | | | | |
Net interest income after provision for loan losses | | | 686,212 | | | | 989,781 | | | | 1,045,335 | | | | 1,122,038 | | | | 1,000,327 | |
Non-interest income: | | | | | | | | | | | | | | | | | | | | |
Service charges on deposit accounts | | | 292,709 | | | | 288,296 | | | | 297,638 | | | | 284,097 | | | | 247,591 | |
Brokerage and investment banking | | | 227,808 | | | | 209,413 | | | | 207,372 | | | | 186,195 | | | | 199,697 | |
Trust department income | | | 60,798 | | | | 62,449 | | | | 64,590 | | | | 63,482 | | | | 51,510 | |
Mortgage income | | | 28,047 | | | | 29,806 | | | | 40,830 | | | | 37,021 | | | | 44,134 | |
Securities gains (losses), net | | | (45 | ) | | | 23,994 | | | | (32,806 | ) | | | 304 | | | | (20 | ) |
Other | | | 123,661 | | | | 115,186 | | | | 119,177 | | | | 125,813 | | | | 94,657 | |
| | | | | | | | | | | | | | | | | | | | |
Total non-interest income | | | 732,978 | | | | 729,144 | | | | 696,801 | | | | 696,912 | | | | 637,569 | |
Non-interest expense: | | | | | | | | | | | | | | | | | | | | |
Salaries and employee benefits | | | 678,859 | | | | 581,425 | | | | 602,646 | | | | 608,939 | | | | 606,165 | |
Net occupancy expense | | | 106,252 | | | | 120,753 | | | | 93,175 | | | | 93,531 | | | | 90,968 | |
Furniture and equipment expense | | | 80,346 | | | | 74,127 | | | | 74,048 | | | | 72,809 | | | | 59,306 | |
Impairment (recapture) of MSR’s | | | 23,000 | | | | 20,000 | | | | (38,000 | ) | | | 1,000 | | | | 27,000 | |
Other | | | 459,799 | | | | 349,089 | | | | 325,866 | | | | 332,687 | | | | 307,761 | |
| | | | | | | | | | | | | | | | | | | | |
Total non-interest expense (2) | | | 1,348,256 | | | | 1,145,394 | | | | 1,057,735 | | | | 1,108,966 | | | | 1,091,200 | |
| | | | | | | | | | | | | | | | | | | | |
Income before income taxes from continuing operations | | | 70,934 | | | | 573,531 | | | | 684,401 | | | | 709,984 | | | | 546,696 | |
Income taxes | | | (181 | ) | | | 179,291 | | | | 230,669 | | | | 235,908 | | | | 174,701 | |
| | | | | | | | | | | | | | | | | | | | |
Income from continuing operations | | | 71,115 | | | | 394,240 | | | | 453,732 | | | | 474,076 | | | | 371,995 | |
| | | | | | | | | | | | | | | | | | | | |
Loss from discontinued operations before income taxes | | | (765 | ) | | | (122 | ) | | | (682 | ) | | | (215,818 | ) | | | (17,718 | ) |
Income tax benefit from discontinued operations | | | (291 | ) | | | (46 | ) | | | (259 | ) | | | (74,723 | ) | | | (7,274 | ) |
| | | | | | | | | | | | | | | | | | | | |
Loss from discontinued operations, net of tax | | | (474 | ) | | | (76 | ) | | | (423 | ) | | | (141,095 | ) | | | (10,444 | ) |
| | | | | | | | | | | | | | | | | | | | |
Net income | | $ | 70,641 | | | $ | 394,164 | | | $ | 453,309 | | | $ | 332,981 | | | $ | 361,551 | |
| | | | | | | | | | | | | | | | | | | | |
Weighted-average shares outstanding–during quarter: | | | | | | | | | | | | | | | | | | | | |
Basic (3) | | | 695,518 | | | | 700,589 | | | | 709,322 | | | | 726,921 | | | | 638,830 | |
Diluted (3) | | | 696,895 | | | | 704,485 | | | | 715,564 | | | | 734,534 | | | | 646,372 | |
Actual shares outstanding–end of quarter (3) | | | 693,636 | | | | 697,332 | | | | 704,398 | | | | 721,825 | | | | 730,076 | |
Earnings per share from continuing operations (4): | | | | | | | | | | | | | | | | | | | | |
Basic | | $ | 0.10 | | | $ | 0.56 | | | $ | 0.64 | | | $ | 0.65 | | | $ | 0.58 | |
Diluted | | $ | 0.10 | | | $ | 0.56 | | | $ | 0.63 | | | $ | 0.65 | | | $ | 0.58 | |
Earnings per share from discontinued operations (4): | | | | | | | | | | | | | | | | | | | | |
Basic | | $ | 0.00 | | | $ | 0.00 | | | $ | 0.00 | | | $ | (0.19 | ) | | $ | (0.02 | ) |
Diluted | | $ | 0.00 | | | $ | 0.00 | | | $ | 0.00 | | | $ | (0.19 | ) | | $ | (0.02 | ) |
Earnings per share (4): | | | | | | | | | | | | | | | | | | | | |
Basic | | $ | 0.10 | | | $ | 0.56 | | | $ | 0.64 | | | $ | 0.46 | | | $ | 0.57 | |
Diluted | | $ | 0.10 | | | $ | 0.56 | | | $ | 0.63 | | | $ | 0.45 | | | $ | 0.56 | |
Cash dividends declared per share (5) | | $ | 0.38 | | | $ | 0.36 | | | $ | 0.36 | | | $ | 0.36 | | | $ | 0.35 | |
Taxable equivalent net interest income from continuing operations | | $ | 1,050,419 | | | $ | 1,086,575 | | | $ | 1,111,969 | | | $ | 1,175,546 | | | $ | 1,094,092 | |
See notes to the Consolidated Statements of Income on page 5
FINANCIAL SUPPLEMENT TO
FOURTH QUARTER 2007 EARNINGS RELEASE
PAGE 4
Regions Financial Corporation and Subsidiaries
Consolidated Statements of Income (1)(6)
(Unaudited)
($ amounts in thousands, except per share data)
| | | | | | | | |
| | | Year Ended December 31 | |
| | | 2007 | | | 2006 | |
Interest income on: | | | | | | | | |
Loans, including fees | | $ | 6,924,544 | | | $ | 4,792,906 | |
Securities: | | | | | | | | |
Taxable | | | 856,043 | | | | 606,665 | |
Tax-exempt | | | 41,260 | | | | 33,679 | |
| | | | | | | | |
Total securities | | | 897,303 | | | | 640,344 | |
Loans held for sale | | | 92,097 | | | | 69,444 | |
Federal funds sold and securities purchased under agreements to resell | | | 68,721 | | | | 51,445 | |
Trading account assets | | | 53,498 | | | | 54,538 | |
Margin receivables | | | 35,813 | | | | 37,541 | |
Time deposits in other banks | | | 2,687 | | | | 2,900 | |
| | | | | | | | |
Total interest income | | | 8,074,663 | | | | 5,649,118 | |
Interest expense on: | | | | | | | | |
Deposits | | | 2,663,883 | | | | 1,680,167 | |
Short-term borrowings | | | 459,467 | | | | 275,497 | |
Long-term borrowings | | | 552,947 | | | | 385,152 | |
| | | | | | | | |
Total interest expense | | | 3,676,297 | | | | 2,340,816 | |
| | | | | | | | |
Net interest income | | | 4,398,366 | | | | 3,308,302 | |
Provision for loan losses | | | 555,000 | | | | 142,373 | |
| | | | | | | | |
Net interest income after provision for loan losses | | | 3,843,366 | | | | 3,165,929 | |
Non-interest income: | | | | | | | | |
Service charges on deposit accounts | | | 1,162,740 | | | | 721,998 | |
Brokerage and investment banking | | | 830,788 | | | | 669,448 | |
Trust department income | | | 251,319 | | | | 158,161 | |
Mortgage income | | | 135,704 | | | | 178,688 | |
Securities gains (losses), net | | | (8,553 | ) | | | 8,123 | |
Other | | | 483,837 | | | | 293,302 | |
| | | | | | | | |
Total non-interest income | | | 2,855,835 | | | | 2,029,720 | |
Non-interest expense: | | | | | | | | |
Salaries and employee benefits | | | 2,471,869 | | | | 1,859,851 | |
Net occupancy expense | | | 413,711 | | | | 254,628 | |
Furniture and equipment expense | | | 301,330 | | | | 157,897 | |
Impairment of MSR’s | | | 6,000 | | | | 16,000 | |
Other | | | 1,467,441 | | | | 915,652 | |
| | | | | | | | |
Total non-interest expense (2) | | | 4,660,351 | | | | 3,204,028 | |
| | | | | | | | |
Income before income taxes from continuing operations | | | 2,038,850 | | | | 1,991,621 | |
Income taxes | | | 645,687 | | | | 619,100 | |
| | | | | | | | |
Income from continuing operations | | | 1,393,163 | | | | 1,372,521 | |
| | | | | | | | |
Loss from discontinued operations before income taxes | | | (217,387 | ) | | | (32,605 | ) |
Income tax benefit from discontinued operations | | | (75,319 | ) | | | (13,229 | ) |
| | | | | | | | |
Loss from discontinued operations, net of tax | | | (142,068 | ) | | | (19,376 | ) |
| | | | | | | | |
Net income | | $ | 1,251,095 | | | $ | 1,353,145 | |
| | | | | | | | |
Weighted-average shares outstanding— year-to-date: | | | | | | | | |
Basic (3) | | | 707,981 | | | | 501,681 | |
Diluted (3) | | | 712,743 | | | | 506,989 | |
Actual shares outstanding— end of quarter (3) | | | 693,636 | | | | 730,076 | |
Earnings per share from continuing operations (4): | | | | | | | | |
Basic | | $ | 1.97 | | | $ | 2.74 | |
Diluted | | $ | 1.95 | | | $ | 2.71 | |
Earnings per share from discontinued operations (4): | | | | | | | | |
Basic | | $ | (0.20 | ) | | $ | (0.04 | ) |
Diluted | | $ | (0.20 | ) | | $ | (0.04 | ) |
Earnings per share (4): | | | | | | | | |
Basic | | $ | 1.77 | | | $ | 2.70 | |
Diluted | | $ | 1.76 | | | $ | 2.67 | |
Cash dividends declared per share | | $ | 1.46 | | | $ | 1.40 | |
Taxable equivalent net interest income from continuing operations | | $ | 4,424,509 | | | $ | 3,423,490 | |
See notes to the Consolidated Statements of Income on page 5.
FINANCIAL SUPPLEMENT TO
FOURTH QUARTER 2007 EARNINGS RELEASE
PAGE 5
| (1) | Regions Financial Corporation and AmSouth Bancorporation merged effective November 4, 2006. The merger was accounted for as a purchase of AmSouth by Regions. As a result, periods ending prior to November 4, 2006, reflect legacy Regions data on a stand-alone basis |
| (2) | Merger-related charges total $150.2 million in 4Q07, $91.8 million in 3Q07, $59.9 million in 2Q07, $49.0 million in 1Q07, and $87.6 million in 4Q06. |
For the full year 2007, $350.9 million of merger charges are included in non-interest expense. See pages 12 and 19 for additional detail
| (3) | On November 4, 2006, 277 million shares were issued in the AmSouth transaction; as a result, the weighted-average shares outstanding calculation for the 4Q06 includes approximately one month of pre-AmSouth merger share count and two months of post-AmSouth merger share count |
| (4) | Certain per share amounts may not appear to reconcile due to rounding |
| (5) | In 4Q07, in addition to the dividend paid, the Board of Directors declared a $0.38 per share dividend payable January 2, 2008 |
| (6) | Certain amounts in the prior periods have been reclassified to reflect current period presentation |
FINANCIAL SUPPLEMENT TO
FOURTH QUARTER 2007 EARNINGS RELEASE
PAGE 6
Regions Financial Corporation and Subsidiaries
Consolidated Average Daily Balances and Yield/Rate Analysis Including Discontinued Operations (1) (2)
($ amounts in thousands; yields on taxable-equivalent basis)
| | | | | | | | | | | | | | | | | | | | | | | | | | | | | | | | | | | | | | | | | | | | | | | | | | |
| | | Quarter Ended | |
| | | 12/31/07 | | | 9/30/07 | | | 6/30/07 | | | 3/31/07 | | | 12/31/06 | |
| | | Average
Balance | | | Income/
Expense | | Yield/
Rate | | | Average
Balance | | | Income/
Expense | | Yield/
Rate | | | Average
Balance | | | Income/
Expense | | Yield/
Rate | | | Average
Balance | | | Income/
Expense | | Yield/
Rate | | | Average
Balance | | | Income/
Expense | | Yield/
Rate | |
Assets | | | | | | | | | | | | | | | | | | | | | | | | | | | | | | | | | | | | | | | | | | | | | | | | | | |
Interest-earning assets: | | | | | | | | | | | | | | | | | | | | | | | | | | | | | | | | | | | | | | | | | | | | | | | | | | |
Interest-bearing deposits in other banks | | $ | 31,039 | | | $ | 344 | | 4.40 | % | | $ | 51,740 | | | $ | 515 | | 3.95 | % | | $ | 39,767 | | | $ | 649 | | 6.55 | % | | $ | 80,520 | | | $ | 1,179 | | 5.94 | % | | $ | 125,467 | | | $ | 1,376 | | 4.35 | % |
Federal funds sold and securities purchased under agreement to resell | | | 1,093,155 | | | | 17,032 | | 6.18 | % | | | 1,141,666 | | | | 18,154 | | 6.31 | % | | | 1,124,636 | | | | 17,162 | | 6.12 | % | | | 1,061,976 | | | | 16,373 | | 6.25 | % | | | 1,098,535 | | | | 15,878 | | 5.73 | % |
Trading account assets | | | 1,188,273 | | | | 12,020 | | 4.01 | % | | | 1,213,485 | | | | 10,385 | | 3.40 | % | | | 1,555,939 | | | | 15,963 | | 4.12 | % | | | 1,475,097 | | | | 15,911 | | 4.37 | % | | | 1,419,868 | | | | 23,168 | | 6.47 | % |
Securities: | | | | | | | | | | | | | | | | | | | | | | | | | | | | | | | | | | | | | | | | | | | | | | | | | | |
Taxable | | | 16,407,051 | | | | 202,669 | | 4.90 | % | | | 16,545,332 | | | | 210,932 | | 5.06 | % | | | 17,245,705 | | | | 218,123 | | 5.07 | % | | | 17,748,027 | | | | 224,319 | | 5.13 | % | | | 16,263,163 | | | | 201,354 | | 4.91 | % |
Tax-exempt | | | 724,152 | | | | 14,300 | | 7.83 | % | | | 722,663 | | | | 15,235 | | 8.36 | % | | | 737,522 | | | | 16,430 | | 8.94 | % | | | 763,297 | | | | 16,786 | | 8.92 | % | | | 648,747 | | | | 14,540 | | 8.89 | % |
Loans held for sale | | | 663,284 | | | | 10,089 | | 6.03 | % | | | 779,918 | | | | 12,303 | | 6.26 | % | | | 1,323,479 | | | | 21,363 | | 6.47 | % | | | 3,427,285 | | | | 67,196 | | 7.95 | % | | | 2,689,490 | | | | 50,113 | | 7.39 | % |
Loans held for sale-divestitures | | | — | | | | — | | — | | | | — | | | | — | | — | | | | — | | | | — | | — | | | | 1,150,548 | | | | 21,520 | | 7.59 | % | | | 1,042,964 | | | | 20,087 | | 7.64 | % |
Margin receivables | | | 541,915 | | | | 8,160 | | 5.97 | % | | | 521,497 | | | | 8,754 | | 6.66 | % | | | 532,037 | | | | 9,289 | | 7.00 | % | | | 554,896 | | | | 9,610 | | 7.02 | % | | | 540,805 | | | | 9,576 | | 7.03 | % |
Loans, net of unearned income | | | 94,783,954 | | | | 1,675,761 | | 7.01 | % | | | 94,309,811 | | | | 1,743,636 | | 7.34 | % | | | 94,051,511 | | | | 1,735,135 | | 7.40 | % | | | 94,338,760 | | | | 1,745,475 | | 7.50 | % | | | 83,058,620 | | | | 1,591,768 | | 7.60 | % |
| | | | | | | | | | | | | | | | | | | | | | | | | | | | | | | | | | | | | | | | | | | | | | | | | | |
Total interest-earning assets | | | 115,432,823 | | | $ | 1,940,375 | | 6.67 | % | | | 115,286,112 | | | $ | 2,019,914 | | 6.95 | % | | | 116,610,596 | | | $ | 2,034,114 | | 7.00 | % | | | 120,600,406 | | | $ | 2,118,369 | | 7.12 | % | | | 106,887,659 | | | $ | 1,927,860 | | 7.16 | % |
Allowance for loan losses | | | (1,070,916 | ) | | | | | | | | | (1,062,432 | ) | | | | | | | | | (1,056,832 | ) | | | | | | | | | (1,061,769 | ) | | | | | | | | | (985,310 | ) | | | | | | |
Cash and due from banks | | | 2,831,323 | | | | | | | | | | 2,751,656 | | | | | | | | | | 2,803,967 | | | | | | | | | | 3,010,446 | | | | | | | | | | 2,605,261 | | | | | | | |
Other assets | | | 21,511,015 | | | | | | | | | | 19,901,093 | | | | | | | | | | 19,180,861 | | | | | | | | | | 19,414,608 | | | | | | | | | | 16,070,226 | | | | | | | |
| | | | | | | | | | | | | | | | | | | | | | | | | | | | | | | | | | | | | | | | | | | | | | | | | | |
| | $ | 138,704,245 | | | | | | | | | $ | 136,876,429 | | | | | | | | | $ | 137,538,592 | | | | | | | | | $ | 141,963,691 | | | | | | | | | $ | 124,577,836 | | | | | | | |
| | | | | | | | | | | | | | | | | | | | | | | | | | | | | | | | | | | | | | | | | | | | | | | | | | |
Liabilities and Stockholders’ Equity | | | | | | | | | | | | | | | | | | | | | | | | | | | | | | | | | | | | | | | | | | | | | | | | | | |
Interest-bearing liabilities: | | | | | | | | | | | | | | | | | | | | | | | | | | | | | | | | | | | | | | | | | | | | | | | | | | |
Savings accounts | | $ | 3,669,700 | | | $ | 2,236 | | 0.24 | % | | $ | 3,756,311 | | | $ | 2,795 | | 0.30 | % | | $ | 3,861,380 | | | $ | 2,884 | | 0.30 | % | | $ | 3,905,299 | | | $ | 2,964 | | 0.31 | % | | $ | 3,572,985 | | | $ | 3,097 | | 0.34 | % |
Interest-bearing transaction accounts | | | 15,029,192 | | | | 64,376 | | 1.70 | % | | | 15,268,807 | | | | 79,618 | | 2.07 | % | | | 15,816,958 | | | | 84,334 | | 2.14 | % | | | 16,113,504 | | | | 83,343 | | 2.10 | % | | | 13,338,852 | | | | 62,898 | | 1.87 | % |
Money market accounts | | | 23,141,502 | | | | 172,708 | | 2.96 | % | | | 23,853,236 | | | | 214,371 | | 3.57 | % | | | 23,542,158 | | | | 206,100 | | 3.51 | % | | | 22,558,401 | | | | 190,814 | | 3.43 | % | | | 19,734,554 | | | | 168,029 | | 3.38 | % |
Certificates of deposit of $100,000 or more | | | 11,223,401 | | | | 134,851 | | 4.77 | % | | | 10,872,861 | | | | 133,290 | | 4.86 | % | | | 12,443,318 | | | | 152,413 | | 4.91 | % | | | 13,271,108 | | | | 155,935 | | 4.77 | % | | | 12,045,318 | | | | 142,757 | | 4.70 | % |
Other interest-bearing deposit accounts | | | 22,727,144 | | | | 251,429 | | 4.39 | % | | | 21,337,142 | | | | 243,511 | | 4.53 | % | | | 20,686,433 | | | | 231,508 | | 4.49 | % | | | 22,356,006 | | | | 242,312 | | 4.40 | % | | | 19,572,951 | | | | 208,500 | | 4.23 | % |
Interest-bearing deposits - divestitures | | | — | | | | — | | — | | | | — | | | | — | | — | | | | — | | | | — | | — | | | | 1,517,504 | | | | 12,091 | | 3.23 | % | | | 1,450,645 | | | | 11,974 | | 3.27 | % |
| | | | | | | | | | | | | | | | | | | | | | | | | | | | | | | | | | | | | | | | | | | | | | | | | | |
Total interest-bearing deposits | | | 75,790,939 | | | | 625,600 | | 3.27 | % | | | 75,088,357 | | | | 673,585 | | 3.56 | % | | | 76,350,247 | | | | 677,239 | | 3.56 | % | | | 79,721,822 | | | | 687,459 | | 3.50 | % | | | 69,715,305 | | | | 597,255 | | 3.40 | % |
Federal funds purchased and securities sold under agreement to repurchase | | | 8,557,902 | | | | 92,310 | | 4.28 | % | | | 8,121,636 | | | | 98,522 | | 4.81 | % | | | 7,461,579 | | | | 90,460 | | 4.86 | % | | | 8,174,934 | | | | 96,303 | | 4.78 | % | | | 7,333,018 | | | | 87,816 | | 4.75 | % |
Other short-term borrowings | | | 1,554,759 | | | | 14,767 | | 3.77 | % | | | 1,598,989 | | | | 16,570 | | 4.11 | % | | | 2,251,296 | | | | 26,177 | | 4.66 | % | | | 2,213,107 | | | | 24,358 | | 4.46 | % | | | 1,539,329 | | | | 15,169 | | 3.91 | % |
Long-term borrowings | | | 11,054,567 | | | | 157,279 | | 5.64 | % | | | 10,085,073 | | | | 144,662 | | 5.69 | % | | | 9,014,112 | | | | 128,269 | | 5.71 | % | | | 8,606,381 | | | | 122,737 | | 5.78 | % | | | 8,159,959 | | | | 123,199 | | 5.99 | % |
| | | | | | | | | | | | | | | | | | | | | | | | | | | | | | | | | | | | | | | | | | | | | | | | | | |
Total interest-bearing liabilities | | | 96,958,167 | | | $ | 889,956 | | 3.64 | % | | | 94,894,055 | | | $ | 933,339 | | 3.90 | % | | | 95,077,234 | | | $ | 922,145 | | 3.89 | % | | | 98,716,244 | | | $ | 930,857 | | 3.82 | % | | | 86,747,611 | | | $ | 823,439 | | 3.77 | % |
Non-interest-bearing deposits | | | 18,249,585 | | | | | | | | | | 18,850,607 | | | | | | | | | | 19,233,146 | | | | | | | | | | 19,694,403 | | | | | | | | | | 17,535,467 | | | | | | | |
Other liabilities | | | 3,627,697 | | | | | | | | | | 3,338,644 | | | | | | | | | | 3,187,936 | | | | | | | | | | 3,100,313 | | | | | | | | | | 3,108,830 | | | | | | | |
Stockholders’ equity | | | 19,868,796 | | | | | | | | | | 19,793,123 | | | | | | | | | | 20,040,276 | | | | | | | | | | 20,452,731 | | | | | | | | | | 17,185,928 | | | | | | | |
| | | | | | | | | | | | | | | | | | | | | | | | | | | | | | | | | | | | | | | | | | | | | | | | | | |
| | $ | 138,704,245 | | | | | | | | | $ | 136,876,429 | | | | | | | | | $ | 137,538,592 | | | | | | | | | $ | 141,963,691 | | | | | | | | | $ | 124,577,836 | | | | | | | |
| | | | | | | | | | | | | | | | | | | | | | | | | | | | | | | | | | | | | | | | | | | | | | | | | | |
Net interest income/margin FTE basis | | | | | | $ | 1,050,419 | | 3.61 | % | | | | | | $ | 1,086,575 | | 3.74 | % | | | | | | $ | 1,111,969 | | 3.82 | % | | | | | | $ | 1,187,512 | | 3.99 | % | | | | | | $ | 1,104,421 | | 4.10 | % |
| | | | | | | | | | | | | | | | | | | | | | | | | | | | | | | | | | | | | | | | | | | | | | | | | | |
| (1) | Regions Financial Corporation and AmSouth Bancorporation merged effective November 4, 2006. The merger was accounted for as a purchase of AmSouth by Regions. As a result, periods ending prior to November 4, 2006, reflect legacy Regions data on a stand-alone basis |
| (2) | Certain amounts in prior periods have been reclassified to reflect current period presentation |
FINANCIAL SUPPLEMENT TO
FOURTH QUARTER 2007 EARNINGS RELEASE
PAGE 7
Regions Financial Corporation and Subsidiaries
Consolidated Average Daily Balances and Yield/Rate Analysis Including Discontinued Operations(1)(2)
($ amounts in thousands; yields on taxable equivalent basis)
| | | | | | | | | | | | | | | | | | | | |
| | | Year Ended December 31 | |
| | | 2007 | | | 2006 | |
| | | Average
Balance | | | Revenue/
Expense | | Yield/ Rate | | | Average
Balance | | | Revenue/
Expense | | Yield/
Rate | |
Assets | | | | | | | | | | | | | | | | | | | | |
Interest-earning assets: | | | | | | | | | | | | | | | | | | | | |
Interest-bearing deposits in other banks | | $ | 50,634 | | | $ | 2,687 | | 5.31 | % | | $ | 64,766 | | | $ | 2,900 | | 4.48 | % |
Federal funds sold and securities purchased under agreement to resell | | | 1,105,543 | | | | 68,721 | | 6.22 | % | | | 961,127 | | | | 51,445 | | 5.35 | % |
Trading account assets | | | 1,357,016 | | | | 54,279 | | 4.00 | % | | | 1,112,239 | | | | 55,741 | | 5.01 | % |
Securities: | | | | | | | | | | | | | | | | | | | | |
Taxable securities | | | 16,981,646 | | | | 856,043 | | 5.04 | % | | | 12,638,833 | | | | 608,171 | | 4.81 | % |
Tax-exempt | | | 736,762 | | | | 62,751 | | 8.52 | % | | | 470,003 | | | | 50,961 | | 10.84 | % |
Loans held for sale | | | 1,538,813 | | | | 110,950 | | 7.21 | % | | | 2,286,604 | | | | 176,672 | | 7.73 | % |
Loans held for sale-divestitures | | | 283,697 | | | | 21,521 | | 7.59 | % | | | 262,884 | | | | 20,087 | | 7.64 | % |
Margin receivables | | | 537,507 | | | | 35,813 | | 6.66 | % | | | 546,755 | | | | 37,541 | | 6.87 | % |
Loans, net of unearned income | | | 94,372,061 | | | | 6,900,007 | | 7.31 | % | | | 64,765,653 | | | | 4,805,931 | | 7.42 | % |
| | | | | | | | | | | | | | | | | | | | |
Total interest-earning assets | | | 116,963,679 | | | | 8,112,772 | | 6.94 | % | | | 83,108,864 | | | | 5,809,449 | | 6.99 | % |
Allowance for loan losses | | | (1,063,011 | ) | | | | | | | | | (833,691 | ) | | | | | | |
Cash and due from banks | | | 2,848,590 | | | | | | | | | | 2,153,838 | | | | | | | |
Other non-earning assets | | | 20,007,361 | | | | | | | | | | 11,371,266 | | | | | | | |
| | | | | | | | | | | | | | | | | | | | |
| | $ | 138,756,619 | | | | | | | | | $ | 95,800,277 | | | | | | | |
| | | | | | | | | | | | | | | | | | | | |
Liabilities and Stockholders’ Equity | | | | | | | | | | | | | | | | | | | | |
Interest-bearing liabilities: | | | | | | | | | | | | | | | | | | | | |
Savings accounts | | $ | 3,797,413 | | | $ | 10,879 | | 0.29 | % | | $ | 3,205,123 | | | $ | 12,356 | | 0.39 | % |
Interest-bearing transaction accounts | | | 15,553,355 | | | | 311,672 | | 2.00 | % | | | 10,664,995 | | | | 168,320 | | 1.58 | % |
Money market accounts | | | 23,277,009 | | | | 783,993 | | 3.37 | % | | | 14,157,010 | | | | 436,459 | | 3.08 | % |
Certificates of deposit of $100,000 or more | | | 11,944,103 | | | | 576,487 | | 4.83 | % | | | 8,855,396 | | | | 394,844 | | 4.46 | % |
Other interest-bearing deposit accounts | | | 21,776,494 | | | | 968,761 | | 4.45 | % | | | 16,252,687 | | | | 656,214 | | 4.04 | % |
Interest-bearing deposits - divestitures | | | 374,179 | | | | 12,091 | | 3.23 | % | | | 365,642 | | | | 11,974 | | 3.27 | % |
| | | | | | | | | | | | | | | | | | | | |
Total interest-bearing deposits | | | 76,722,553 | | | | 2,663,883 | | 3.47 | % | | | 53,500,853 | | | | 1,680,167 | | 3.14 | % |
Federal funds purchased and securities sold under agreement to repurchase | | | 8,080,179 | | | | 377,595 | | 4.67 | % | | | 5,162,196 | | | | 233,208 | | 4.52 | % |
Other short-term borrowings | | | 1,901,897 | | | | 81,872 | | 4.30 | % | | | 1,089,223 | | | | 42,289 | | 3.88 | % |
Long-term borrowings | | | 9,697,823 | | | | 552,947 | | 5.70 | % | | | 6,855,601 | | | | 385,152 | | 5.62 | % |
| | | | | | | | | | | | | | | | | | | | |
Total interest-bearing liabilities | | | 96,402,452 | | | | 3,676,297 | | 3.81 | % | | | 66,607,873 | | | | 2,340,816 | | 3.51 | % |
Non-interest bearing deposits | | | 19,002,548 | | | | | | | | | | 13,965,594 | | | | | | | |
Other liabilities | | | 3,315,160 | | | | | | | | | | 2,858,178 | | | | | | | |
Stockholders’ equity | | | 20,036,459 | | | | | | | | | | 12,368,632 | | | | | | | |
| | | | | | | | | | | | | | | | | | | | |
| | $ | 138,756,619 | | | | | | | | | $ | 95,800,277 | | | | | | | |
| | | | | | | | | | | | | | | | | | | | |
Net interest income/margin FTE basis | | | | | | $ | 4,436,475 | | 3.79 | % | | | | | | $ | 3,468,633 | | 4.17 | % |
| | | | | | | | | | | | | | | | | | | | |
| (1) | Regions Financial Corporation and AmSouth Bancorporation merged effective November 4, 2006. The merger was accounted for as a purchase of AmSouth by Regions. As a result, periods ending prior to November 4, 2006, reflect legacy Regions data on a stand-alone basis. |
| (2) | Certain amounts in the prior periods have been reclassified to reflect current period presentation |
FINANCIAL SUPPLEMENT TO
FOURTH QUARTER 2007 EARNINGS RELEASE
PAGE 8
Regions Financial Corporation and Subsidiaries
Selected Ratios (1)
| | | | | | | | | | | | | | | | | | | | |
| | | As of and for Quarter Ended | |
| | | 12/31/07 | | | 9/30/07 | | | 6/30/07 | | | 3/31/07 | | | 12/31/06 | |
Return on average assets* | | | 0.20 | % | | | 1.14 | % | | | 1.32 | % | | | 0.95 | % | | | 1.15 | % |
Return on average equity* | | | 1.41 | % | | | 7.90 | % | | | 9.07 | % | | | 6.60 | % | | | 8.35 | % |
Return on average tangible equity* | | | 3.67 | % | | | 20.14 | % | | | 22.89 | % | | | 16.29 | % | | | 19.59 | % |
Stockholders’ equity per share | | $ | 28.58 | | | $ | 28.46 | | | $ | 27.96 | | | $ | 28.14 | | | $ | 28.36 | |
Stockholders’ equity to total assets | | | 14.05 | % | | | 14.36 | % | | | 14.31 | % | | | 14.71 | % | | | 14.44 | % |
Tangible stockholders’ equity to tangible assets | | | 5.88 | % | | | 6.02 | % | | | 6.09 | % | | | 6.52 | % | | | 6.53 | % |
Allowance for credit losses as a percentage of loans, net of unearned income (2) | | | 1.45 | % | | | 1.19 | % | | | 1.19 | % | | | 1.18 | % | | | 1.17 | % |
Allowance for loan losses as a percentage of loans, net of unearned income | | | 1.39 | % | | | 1.13 | % | | | 1.13 | % | | | 1.12 | % | | | 1.12 | % |
Net interest margin (FTE) | | | 3.61 | % | | | 3.74 | % | | | 3.82 | % | | | 3.99 | % | | | 4.10 | % |
Loans, net of unearned income, to total deposits | | | 100.64 | % | | | 101.00 | % | | | 98.90 | % | | | 98.77 | % | | | 93.40 | % |
Net charge-offs as a percentage of average loans* | | | 0.45 | % | | | 0.27 | % | | | 0.23 | % | | | 0.20 | % | | | 0.27 | % |
Total non-performing assets (excluding loans 90 days past due) as a percentage of loans and other real estate | | | 0.90 | % | | | 0.62 | % | | | 0.62 | % | | | 0.45 | % | | | 0.40 | % |
Total non-performing assets (including loans 90 days past due) as a percentage of loans and other real estate | | | 1.28 | % | | | 0.97 | % | | | 0.84 | % | | | 0.67 | % | | | 0.55 | % |
| (1) | Regions Financial Corporation and AmSouth Bancorporation merged effective November 4, 2006. The merger was accounted for as a purchase of AmSouth by Regions. As a result, periods ending prior to November 4, 2006, reflect legacy Regions data on a stand-alone basis |
| (2) | The allowance for credit losses reflects the allowance related to both loans on the balance sheet and exposure related to unfunded commitments and standby letters of credit |
FINANCIAL SUPPLEMENT TO
FOURTH QUARTER 2007 EARNINGS RELEASE
PAGE 9
Loans (1)(2)
| | | | | | | | | | | | | | | | | | | | | | |
| | | Loan Portfolio - Period End Data | |
| ($ amounts in thousands) | | | | | | | | | | | | | | | | | | | | | | |
| | | | | | |
| | | 12/31/2007 | | 9/30/07 | | 6/30/07 | | 3/31/07 | | 12/31/06 | | 12/31/2007 vs.
9/30/2007* | |
Commercial | | $ | 20,906,617 | | $ | 23,565,882 | | $ | 25,123,355 | | $ | 24,188,205 | | $ | 24,145,411 | | $ | (2,659,265 | ) | | -44.8 | % |
Real estate- mortgage | | | 39,343,128 | | | 35,337,366 | | | 33,646,480 | | | 34,505,573 | | | 35,230,343 | | | 4,005,762 | | | 45.0 | % |
Real estate- construction | | | 14,025,491 | | | 14,237,083 | | | 14,311,192 | | | 14,357,801 | | | 14,121,030 | | | (211,592 | ) | | -5.9 | % |
Home equity lending | | | 14,962,007 | | | 14,835,319 | | | 14,819,443 | | | 14,845,348 | | | 14,888,599 | | | 126,688 | | | 3.4 | % |
Indirect lending | | | 3,938,113 | | | 4,015,142 | | | 4,052,637 | | | 4,050,317 | | | 4,037,539 | | | (77,029 | ) | | -7.6 | % |
Other consumer | | | 2,203,491 | | | 2,382,840 | | | 2,061,381 | | | 2,221,016 | | | 2,127,680 | | | (179,349 | ) | | -29.9 | % |
| | | | | | | | | | | | | | | | | | | | | | |
| | $ | 95,378,847 | | $ | 94,373,632 | | $ | 94,014,488 | | $ | 94,168,260 | | $ | 94,550,602 | | $ | 1,005,215 | | | 4.2 | % |
| | | | | | | | | | | | | | | | | | | | | | |
| |
| | | Loan Portfolio - Average Balances | |
| ($ amounts in thousands) | | | | | | | | | | | | | | | | | | | | | | |
| | | | | | |
| | | 4Q07 | | 3Q07 | | 2Q07 | | 1Q07 | | 4Q06 | | 4Q07 vs. 3Q07* | |
Commercial | | $ | 22,913,251 | | $ | 24,146,621 | | $ | 24,623,331 | | $ | 24,094,090 | | $ | 21,242,803 | | $ | (1,233,370 | ) | | -20.3 | % |
Real estate- mortgage | | | 36,660,193 | | | 34,923,454 | | | 34,060,372 | | | 34,922,144 | | | 31,361,533 | | | 1,736,739 | | | 19.7 | % |
Real estate- construction | | | 14,104,126 | | | 14,232,360 | | | 14,295,420 | | | 14,221,432 | | | 12,289,921 | | | (128,234 | ) | | -3.6 | % |
Home equity lending | | | 14,888,685 | | | 14,774,085 | | | 14,836,871 | | | 14,858,209 | | | 12,402,944 | | | 114,600 | | | 3.1 | % |
Indirect lending | | | 3,975,744 | | | 4,044,072 | | | 4,059,108 | | | 4,007,349 | | | 3,141,590 | | | (68,328 | ) | | -6.7 | % |
Other consumer | | | 2,241,955 | | | 2,189,219 | | | 2,176,409 | | | 2,235,536 | | | 2,619,829 | | | 52,736 | | | 9.6 | % |
| | | | | | | | | | | | | | | | | | | | | | |
| | $ | 94,783,954 | | $ | 94,309,811 | | $ | 94,051,511 | | $ | 94,338,760 | | $ | 83,058,620 | | $ | 474,143 | | | 2.0 | % |
| | | | | | | | | | | | | | | | | | | | | | |
| (1) | Regions Financial Corporation and AmSouth Bancorporation merged effective November 4, 2006. The merger was accounted for as a purchase of AmSouth by Regions. As a result, 4Q06 average balances include approximately two months of AmSouth operations compared to full quarter inclusion during 2007 |
| (2) | Certain amounts in the prior periods have been reclassified to reflect current period presentation |
| * | Linked-quarter percentage changes are presented on an annualized basis |
| | • | | Linked-quarter loan classification comparisons have been impacted by conversion-related re-mapping in 3Q07 and 4Q07, with a portion of commercial loans reclassifying as real estate mortgage loans |
| | • | | $ 1.6 billion of loans were reclassified to held-for-sale in 4Q06 in connection with the 52 branches that were divested in 1Q07 |
| | • | | The AmSouth transaction added $36.5 billion of loans in 4Q06 |
FINANCIAL SUPPLEMENT TO
FOURTH QUARTER 2007 EARNINGS RELEASE
PAGE 10
Deposits (1)(2)
| | | | | | | | | | | | | | | | | | | | | | |
| | | Deposit Portfolio - Period End Data | |
| ($ amounts in thousands) | | | | | | | | | | | | | | | | | | | | | | |
| | | | | | |
| | | 12/31/2007 | | 9/30/07 | | 6/30/07 | | 3/31/07 | | 12/31/06 | | 12/31/2007 vs.
9/30/2007* | |
Interest-Free Deposits | | $ | 18,417,266 | | $ | 18,834,856 | | $ | 19,136,419 | | $ | 19,942,928 | | $ | 20,175,482 | | $ | (417,590 | ) | | -8.8 | % |
Interest-Bearing Checking | | | 15,846,139 | | | 15,208,224 | | | 15,685,340 | | | 16,426,436 | | | 15,899,813 | | | 637,915 | | | 16.6 | % |
Savings | | | 3,646,632 | | | 3,692,087 | | | 3,795,701 | | | 3,937,346 | | | 3,882,533 | | | (45,455 | ) | | -4.9 | % |
Money Market | | | 22,416,912 | | | 23,501,476 | | | 23,926,358 | | | 23,057,284 | | | 22,802,258 | | | (1,084,564 | ) | | -18.3 | % |
| | | | | | | | | | | | | | | | | | | | | | |
Total Low-Cost Deposits, | | | | | | | | | | | | | | | | | | | | | | |
excluding divestitures | | | 60,326,949 | | | 61,236,643 | | | 62,543,818 | | | 63,363,994 | | | 62,760,086 | | | (909,694 | ) | | -5.9 | % |
Divestitures - Interest-Free | | | — | | | — | | | — | | | — | | | 533,295 | | | — | | | NM | |
Divestitures - Other Low-Cost | | | — | | | — | | | — | | | — | | | 1,177,671 | | | — | | | NM | |
| | | | | | | | | | | | | | | | | | | | | | |
Total Low-Cost Deposits | | | 60,326,949 | | | 61,236,643 | | | 62,543,818 | | | 63,363,994 | | | 64,471,052 | | | (909,694 | ) | | -5.9 | % |
CD’s < $100K | | | 14,085,405 | | | 14,434,255 | | | 14,693,540 | | | 14,985,322 | | | 15,104,520 | | | (348,850 | ) | | -9.6 | % |
CD’s > $100K | | | 12,089,630 | | | 10,076,459 | | | 11,602,951 | | | 12,979,072 | | | 12,776,086 | | | 2,013,171 | | | 79.3 | % |
Other Interest-Bearing Deposits | | | 8,272,984 | | | 7,692,573 | | | 6,216,082 | | | 4,008,261 | | | 7,815,910 | | | 580,411 | | | 29.9 | % |
Divestitures - Time | | | — | | | — | | | — | | | — | | | 1,060,401 | | | — | | | NM | |
| | | | | | | | | | | | | | | | | | | | | | |
| | $ | 94,774,968 | | $ | 93,439,930 | | $ | 95,056,391 | | $ | 95,336,648 | | $ | 101,227,969 | | $ | 1,335,038 | | | 5.7 | % |
| | | | | | | | | | | | | | | | | | | | | | |
| |
| | | Deposit Portfolio - Average Balances | |
| ($ amounts in thousands) | | | | | | | | | | | | | | | | | | | | | | |
| | | | | | |
| | | 4Q07 | | 3Q07 | | 2Q07 | | 1Q07 | | 4Q06 | | 4Q07 vs. 3Q07* | |
Interest-Free Deposits | | $ | 18,249,585 | | $ | 18,850,607 | | $ | 19,233,146 | | $ | 19,324,381 | | $ | 17,175,508 | | $ | (601,022 | ) | | -12.6 | % |
Interest-Bearing Checking | | | 15,029,192 | | | 15,268,807 | | | 15,816,958 | | | 16,113,504 | | | 13,338,852 | | | (239,615 | ) | | -6.2 | % |
Savings | | | 3,669,700 | | | 3,756,311 | | | 3,861,380 | | | 3,905,299 | | | 3,572,985 | | | (86,611 | ) | | -9.1 | % |
Money Market | | | 23,141,502 | | | 23,853,236 | | | 23,542,158 | | | 22,558,401 | | | 19,734,554 | | | (711,734 | ) | | -11.8 | % |
| | | | | | | | | | | | | | | | | | | | | | |
Total Low-Cost Deposits, | | | | | | | | | | | | | | | | | | | | | | |
excluding divestitures | | | 60,089,979 | | | 61,728,961 | | | 62,453,642 | | | 61,901,585 | | | 53,821,899 | | | (1,638,982 | ) | | -10.5 | % |
Divestitures - Interest-Free | | | — | | | — | | | — | | | 370,022 | | | 359,957 | | | — | | | NM | |
Divestitures - Other Low-Cost | | | — | | | — | | | — | | | 796,266 | | | 763,757 | | | — | | | NM | |
| | | | | | | | | | | | | | | | | | | | | | |
Total Low-Cost Deposits | | | 60,089,979 | | | 61,728,961 | | | 62,453,642 | | | 63,067,873 | | | 54,945,613 | | | (1,638,982 | ) | | -10.5 | % |
CD’s < $100K | | | 14,192,418 | | | 14,600,278 | | | 14,773,277 | | | 15,124,475 | | | 13,758,120 | | | (407,860 | ) | | -11.1 | % |
CD’s > $100K | | | 11,223,401 | | | 10,872,861 | | | 12,443,318 | | | 13,271,108 | | | 12,045,318 | | | 350,540 | | | 12.8 | % |
Other Interest-Bearing Deposits | | | 8,534,726 | | | 6,736,864 | | | 5,913,156 | | | 7,231,531 | | | 5,814,833 | | | 1,797,862 | | | 105.9 | % |
Divestitures - Time | | | — | | | — | | | — | | | 721,238 | | | 686,891 | | | — | | | NM | |
| | | | | | | | | | | | | | | | | | | | | | |
| | $ | 94,040,524 | | $ | 93,938,964 | | $ | 95,583,393 | | $ | 99,416,225 | | $ | 87,250,775 | | $ | 101,560 | | | 0.4 | % |
| | | | | | | | | | | | | | | | | | | | | | |
| (1) | Regions Financial Corporation and AmSouth Bancorporation merged effective November 4, 2006. The merger was accounted for as a purchase of AmSouth by Regions. As a result, 4Q06 average balances include approximately two months of AmSouth operations compared to full quarter inclusion during 2007 |
| (2) | Certain amounts in the prior periods have been reclassified to reflect current period presentation |
| * | Linked-quarter percentage changes are presented on an annualized basis |
| | • | | $ 2.8 billion of deposits were reclassified to held-for-sale in 4Q06 in connection with the 52 branches that were divested in 1Q07 |
| | • | | The AmSouth transaction added $37.6 billion of deposits in 4Q06 |
FINANCIAL SUPPLEMENT TO
FOURTH QUARTER 2007 EARNINGS RELEASE
PAGE 11
Operating Revenue from Continuing Operations (1)(2)
Revenue
| | | | | | | | | | | | | | | | | | | | | | |
($ amounts in thousands) | | 4Q07 | | 3Q07 | | 2Q07 | | 1Q07 | | 4Q06 | | 4Q07 vs. 3Q07* | |
Net Interest Income (TE basis) | | $ | 1,050,419 | | $ | 1,086,575 | | $ | 1,111,969 | | $ | 1,175,546 | | $ | 1,094,092 | | $ | (36,156 | ) | | -13.2 | % |
Non-Interest Income (excl. sec. gains/losses) | | | 733,023 | | | 705,150 | | | 729,607 | | | 696,608 | | | 637,589 | | | 27,873 | | | 15.7 | % |
| | | | | | | | | | | | | | | | | | | | | | |
Total Revenue (excl. sec. gains/losses, TE basis) | | $ | 1,783,442 | | $ | 1,791,725 | | $ | 1,841,576 | | $ | 1,872,154 | | $ | 1,731,681 | | $ | (8,283 | ) | | -1.8 | % |
| | | | | | | | | | | | | | | | | | | | | | |
| (1) | Regions Financial Corporation and AmSouth Bancorporation merged effective November 4, 2006. The merger was accounted for as a purchase of AmSouth by Regions. As a result, periods ending prior to November 4, 2006, reflect legacy Regions data on a stand-alone basis |
| (2) | Certain amounts in the prior periods have been reclassified to reflect current period presentation |
| * | Linked-quarter percentage changes are presented on an annualized basis |
| | • | | Net interest margin of 3.61% in 4Q07 compared to 3.74% in 3Q07 |
| | • | | Regions’ balance sheet positioning is neutral to slightly asset sensitive as of December 31, 2007 |
| | • | | Fee income, excluding securities gains/losses, increased linked-quarter, due in large part to higher brokerage income and commercial credit fee income |
FINANCIAL SUPPLEMENT TO
FOURTH QUARTER 2007 EARNINGS RELEASE
PAGE 12
Non-Interest Income and Expense from Continuing Operations (1)(2)
Non-interest Income and Expense
Non-interest Income
| | | | | | | | | | | | | | | | | | | | | | | | | |
($ amounts in thousands) | | 4Q07 | | | 3Q07 | | 2Q07 | | | 1Q07 | | 4Q06 | | | 4Q07 vs. 3Q07* | |
Service charges on deposit accounts | | $ | 292,709 | | | $ | 288,296 | | $ | 297,638 | | | $ | 284,097 | | $ | 247,591 | | | $ | 4,413 | | | 6.1 | % |
Brokerage and investment banking | | | 227,808 | | | | 209,413 | | | 207,372 | | | | 186,195 | | | 199,697 | | | | 18,395 | | | 34.8 | % |
Trust department income | | | 60,798 | | | | 62,449 | | | 64,590 | | | | 63,482 | | | 51,510 | | | | (1,651 | ) | | -10.5 | % |
Mortgage income | | | 28,047 | | | | 29,806 | | | 40,830 | | | | 37,021 | | | 44,134 | | | | (1,759 | ) | | -23.4 | % |
Securities gains (losses), net | | | (45 | ) | | | 23,994 | | | (32,806 | ) | | | 304 | | | (20 | ) | | | (24,039 | ) | | NM | |
Commercial credit fee income | | | 35,568 | | | | 29,217 | | | 18,971 | | | | 20,574 | | | 24,477 | | | | 6,351 | | | 86.2 | % |
Insurance premiums & commissions | | | 23,320 | | | | 23,340 | | | 25,476 | | | | 27,229 | | | 21,556 | | | | (20 | ) | | -0.3 | % |
Other | | | 64,773 | | | | 62,629 | | | 74,730 | | | | 78,010 | | | 48,624 | | | | 2,144 | | | 13.6 | % |
| | | | | | | | | | | | | | | | | | | | | | | | | |
Total non-interest income | | $ | 732,978 | | | $ | 729,144 | | $ | 696,801 | | | $ | 696,912 | | $ | 637,569 | | | $ | 3,834 | | | 2.1 | % |
| | | | | | | | | | | | | | | | | | | | | | | | | |
| | | | | | | |
| Non-interest Expense** | | | | | | | | | | | | | | | | | | | | | | | | | |
| | | | | | |
($ amounts in thousands) | | 4Q07 | | | 3Q07 | | 2Q07 | | | 1Q07 | | 4Q06 | | | 4Q07 vs. 3Q07* | |
Salaries and employee benefits | | $ | 581,635 | | | $ | 566,614 | | $ | 579,599 | | | $ | 585,408 | | $ | 540,510 | | | $ | 15,021 | | | 10.5 | % |
Net occupancy expense | | | 102,361 | | | | 99,325 | | | 88,490 | | | | 89,701 | | | 87,495 | | | | 3,036 | | | 12.1 | % |
Furniture and equipment expense | | | 78,669 | | | | 72,185 | | | 73,056 | | | | 72,564 | | | 58,879 | | | | 6,484 | | | 35.6 | % |
Impairment (recapture) of MSR’s1 | | | 23,000 | | | | 20,000 | | | (38,000 | ) | | | 1,000 | | | 27,000 | | | | 3,000 | | | 59.5 | % |
Professional fees | | | 43,212 | | | | 27,533 | | | 29,568 | | | | 17,105 | | | 25,974 | | | | 15,679 | | | 225.9 | % |
Marketing expense | | | 29,062 | | | | 20,756 | | | 19,624 | | | | 21,711 | | | 21,995 | | | | 8,306 | | | 158.8 | % |
Amortization of core deposit intangible | | | 42,100 | | | | 37,432 | | | 32,702 | | | | 43,112 | | | 32,890 | | | | 4,668 | | | 49.5 | % |
Amortization of MSR’s | | | 21,183 | | | | 17,308 | | | 20,384 | | | | 20,042 | | | 19,406 | | | | 3,875 | | | 88.8 | % |
Other | | | 276,872 | | | | 192,456 | | | 192,385 | | | | 209,330 | | | 189,413 | | | | 84,416 | | | 174.0 | % |
| | | | | | | | | | | | | | | | | | | | | | | | | |
Total non-interest expense, excluding merger charges | | | 1,198,094 | | | | 1,053,609 | | | 997,808 | | | | 1,059,973 | | | 1,003,562 | | | | 144,485 | | | 54.4 | % |
Merger-related charges | | | 150,162 | | | | 91,785 | | | 59,927 | | | | 48,993 | | | 87,638 | | | | 58,377 | | | 252.3 | % |
| | | | | | | | | | | | | | | | | | | | | | | | | |
Total non-interest expense | | $ | 1,348,256 | | | $ | 1,145,394 | | $ | 1,057,735 | | | $ | 1,108,966 | | $ | 1,091,200 | | | $ | 202,862 | | | 70.3 | % |
| | | | | | | | | | | | | | | | | | | | | | | | | |
| (1) | Regions Financial Corporation and AmSouth Bancorporation merged effective November 4, 2006. The merger was accounted for as a purchase of AmSouth by Regions. As a result, periods ending prior to November 4, 2006, reflect legacy Regions data on a stand-alone basis |
| (2) | Certain amounts in prior periods have been reclassified to reflect current period presentation |
| * | Linked-quarter percentage changes are presented on an annualized basis |
| ** | Individual expense categories are presented excluding merger-related charges, which are presented in a separate line item in the above table |
| | • | | Brokerage income increased in 4Q07 primarily due to higher fixed-income revenues at Morgan Keegan |
| | • | | Commercial credit fee income was higher in 4Q07 as a result of increased customer derivative activity |
| | • | | 4Q07 mortgage income was impacted by a $4.4 million1loss on a sale of a portion of out-of-market mortgage servicing portfolio |
| | • | | 4Q07 other non-interest income includes a $7.3 million gain on the sale of assets, $6.7 million incremental BOLI earnings compared to 3Q07; and $9.4 million1 in write-downs of tax-preferenced low-income housing investments |
| | • | | 3Q07 other non-interest income included a $10.5 million gain related to sale of a residual interest in a former subsidiary |
| | • | | 4Q07 salary costs rose due to higher commissions at Morgan Keegan, which were tied to strong brokerage and investment banking activity revenues during the quarter |
| | • | | Furniture and equipment expense increases in 4Q07 reflect depreciation related to capital additions and higher maintenance, rental and property taxes |
| | • | | Professional fees increased in 4Q07 due to special assets litigation resulting from recent credit cycle deterioration and higher legal costs |
| | • | | 4Q07 marketing expense increased due mainly to campaigns run to coincide with the branch conversions |
| | • | | Amortization of core deposit intangibles increased during 4Q07 reflecting higher deposit outflows |
| | • | | Other non-interest expense includes the $51.5 million1 charge related to Regions’ ownership interest in the Visa antitrust lawsuit settlements and other related litigation; $38.5 million1 loss related to two Morgan Keegan mutual fund investments; and $7.5 million1 in Other Real Estate losses. Lowering non-interest expense in 4Q07 was a $10.3 million change in expense related to an investment in energy-related tax credits. |
| | • | | Merger-related cost saves of $108 million, $102 million, $84 million and $51 million are reflected in 4Q07, 3Q07, 2Q07 and 1Q07 non-interest expense, respectively. |
| | • | | Primary drivers of “merger-related charges” are personnel and marketing expenses, mainly related to October and December conversion events. See page 3 for individual expense categories including merger-related charges. |
1 | Items included in the $134 million of 4Q07 non-merger charges |
FINANCIAL SUPPLEMENT TO
FOURTH QUARTER 2007 EARNINGS RELEASE
PAGE 13
Morgan Keegan (1)
Morgan Keegan
Summary Income Statement
| | | | | | | | | | | | | | | | | | | | | | |
($ amounts in thousands) | | 4Q07 | | 3Q07 | | 2Q07 | | 1Q07 | | 4Q06 | | 4Q07 vs. 3Q07* | |
Revenues: | | | | | | | | | | | | | | | | | | | | | | |
Commissions | | $ | 82,502 | | $ | 82,071 | | $ | 77,563 | | $ | 72,405 | | $ | 72,645 | | $ | 431 | | | 2.1 | % |
Principal transactions | | | 56,216 | | | 43,916 | | | 43,838 | | | 37,597 | | | 42,691 | | | 12,300 | | | 111.1 | % |
Investment banking | | | 57,192 | | | 48,958 | | | 48,579 | | | 36,750 | | | 42,441 | | | 8,234 | | | 66.7 | % |
Interest | | | 33,772 | | | 35,388 | | | 39,820 | | | 40,031 | | | 40,186 | | | (1,616 | ) | | -18.1 | % |
Trust fees and services | | | 56,736 | | | 55,803 | | | 57,185 | | | 56,121 | | | 44,189 | | | 933 | | | 6.6 | % |
Investment advisory | | | 52,168 | | | 42,146 | | | 48,088 | | | 41,792 | | | 48,713 | | | 10,022 | | | 94.3 | % |
Other | | | 12,357 | | | 10,134 | | | 13,761 | | | 17,303 | | | 16,614 | | | 2,223 | | | 87.0 | % |
| | | | | | | | | | | | | | | | | | | | | | |
Total revenues | | | 350,943 | | | 318,416 | | | 328,834 | | | 301,999 | | | 307,479 | | | 32,527 | | | 40.5 | % |
Expenses: | | | | | | | | | | | | | | | | | | | | | | |
Interest expense | | | 19,790 | | | 21,790 | | | 25,046 | | | 23,983 | | | 24,996 | | | (2,000 | ) | | -36.4 | % |
Non-interest expense | | | 291,022 | | | 225,469 | | | 225,074 | | | 206,108 | | | 207,314 | | | 65,553 | | | 115.3 | % |
| | | | | | | | | | | | | | | | | | | | | | |
Total expenses | | | 310,812 | | | 247,259 | | | 250,120 | | | 230,091 | | | 232,310 | | | 63,553 | | | 102.0 | % |
| | | | | | | | | | | | | | | | | | | | | | |
Income before income taxes | | | 40,131 | | | 71,157 | | | 78,714 | | | 71,908 | | | 75,169 | | | (31,026 | ) | | -173.0 | % |
Income taxes | | | 15,068 | | | 26,000 | | | 28,603 | | | 26,367 | | | 28,230 | | | (10,932 | ) | | -166.8 | % |
| | | | | | | | | | | | | | | | | | | | | | |
Net income | | $ | 25,063 | | $ | 45,157 | | $ | 50,111 | | $ | 45,541 | | $ | 46,939 | | $ | (20,094 | ) | | -176.5 | % |
| | | | | | | | | | | | | | | | | | | | | | |
Breakout of Revenue by Division
| | | | | | | | | | | | | | | | | | | | | | | | |
($ amounts in thousands) | | Private
Client | | | Fixed-
income
Capital
Markets | | | Equity
Capital
Markets | | | Regions
MK Trust | | | Asset
Management | | | Interest & Other | |
Three months ended December 31, 2007: | | | | | | | | | | | | | | | | | | | | | | | | |
$ amount of revenue | | $ | 99,005 | | | $ | 79,544 | | | $ | 29,940 | | | $ | 56,743 | | | $ | 50,066 | | | $ | 35,645 | |
% of gross revenue | | | 28.2 | % | | | 22.7 | % | | | 8.5 | % | | | 16.2 | % | | | 14.3 | % | | | 10.1 | % |
Three months ended September 30, 2007: | | | | | | | | | | | | | | | | | | | | | | | | |
$ amount of revenue | | $ | 97,577 | | | $ | 55,647 | | | $ | 30,191 | | | $ | 55,803 | | | $ | 47,646 | | | $ | 31,552 | |
% of gross revenue | | | 30.6 | % | | | 17.5 | % | | | 9.5 | % | | | 17.5 | % | | | 15.0 | % | | | 9.9 | % |
Year Ended December 31, 2007 | | | | | | | | | | | | | | | | | | | | | | | | |
$ amount of revenue | | $ | 393,511 | | | $ | 244,407 | | | $ | 103,289 | | | $ | 225,853 | | | $ | 188,905 | | | $ | 144,227 | |
% of gross revenue | | | 30.3 | % | | | 18.8 | % | | | 7.9 | % | | | 17.4 | % | | | 14.5 | % | | | 11.1 | % |
Year Ended December 31, 2006 | | | | | | | | | | | | | | | | | | | | | | | | |
$ amount of revenue | | $ | 305,098 | | | $ | 187,425 | | | $ | 103,282 | | | $ | 131,218 | | | $ | 149,511 | | | $ | 152,137 | |
% of gross revenue | | | 29.7 | % | | | 18.2 | % | | | 10.0 | % | | | 12.8 | % | | | 14.5 | % | | | 14.8 | % |
| (1) | Regions Financial Corporation and AmSouth Bancorporation merged effective November 4, 2006. The merger was accounted for as a purchase of AmSouth by Regions. As a result, periods ending prior to November 4, 2006, reflect legacy Regions data on a stand-alone basis. |
| * | Linked-quarter percentage changes are presented on an annualized basis |
| | • | | Principal transactions revenue increased an annualized 111% linked-quarter, driven by volume of trades in the fixed income business |
| | • | | Investment banking revenues increased an annualized 67% linked-quarter in connection with higher deal activity during 4Q07 |
| | • | | Investment advisory fees were up 4Q07 compared to 3Q07 as a result of increases in the oil and gas-related activity |
| | • | | The linked-quarter increase in non-interest expense was primarily a result of the $38.5 million loss related to investments in two Morgan Keegan mutual funds as well as commission-related increases in compensation |
| | • | | 21,300 new accounts were opened in 4Q07 compared to 24,600 in 3Q07 and 17,300 in 4Q06 |
| | • | | Total customer assets were $80.0 billion at December 31, 2007, compared to $82.6 billion at September 30, 2007 and $69.2 billion at December 31, 2006 |
FINANCIAL SUPPLEMENT TO
FOURTH QUARTER 2007 EARNINGS RELEASE
PAGE 14
Credit Quality (1)(2)
Credit Quality
| | | | | | | | | | | | | | | | | | | | | | | | | | | | |
| | | As of and for Quarter Ended | | | YTD
12/31/07 | | | YTD
12/31/06 | |
($ in thousands) | | 12/31/07 | | | 9/30/07 | | | 6/30/07 | | | 3/31/07 | | | 12/31/06 | | | |
Allowance for credit losses (ACL) | | $ | 1,379,498 | | | $ | 1,126,554 | | | $ | 1,118,229 | | | $ | 1,110,324 | | | $ | 1,107,788 | | | $ | 1,379,498 | | | $ | 1,107,788 | |
Provision for loan losses from continuing operations | | $ | 358,000 | | | $ | 90,000 | | | $ | 60,000 | | | $ | 47,000 | | | $ | 59,825 | | | $ | 555,000 | | | $ | 142,373 | |
Provision for unfunded credit losses | | $ | 2,416 | | | $ | (518 | ) | | $ | 2,292 | | | $ | 2,229 | | | $ | — | | | $ | 6,419 | | | $ | — | |
Net loans charged-off:* | | | | | | | | | | | | | | | | | | | | | | | | | | | | |
Commercial | | $ | 34,742 | | | $ | 19,161 | | | $ | 17,406 | | | $ | 2,044 | | | $ | 15,164 | | | $ | 73,353 | | | $ | 37,541 | |
Real estate - mortgage | | | 20,409 | | | | 6,392 | | | | 11,432 | | | | 11,108 | | | | 10,083 | | | | 49,341 | | | | 41,233 | |
Real estate - construction | | | 16,036 | | | | 5,230 | | | | 709 | | | | 8,572 | | | | 1,170 | | | | 30,547 | | | | 6,987 | |
Home equity lending | | | 11,513 | | | | 11,701 | | | | 8,774 | | | | 8,686 | | | | 14,078 | | | | 40,674 | | | | 29,720 | |
Indirect lending | | | 7,752 | | | | 4,395 | | | | 3,975 | | | | 4,416 | | | | 5,154 | | | | 20,538 | | | | 10,541 | |
Other consumer | | | 17,020 | | | | 16,242 | | | | 11,611 | | | | 11,196 | | | | 10,500 | | | | 56,069 | | | | 13,919 | |
| | | | | | | | | | | | | | | | | | | | | | | | | | | | |
Total | | $ | 107,472 | | | $ | 63,121 | | | $ | 53,907 | | | $ | 46,022 | | | $ | 56,149 | | | $ | 270,522 | | | $ | 139,941 | |
| | | | | | | | | | | | | | | | | | | | | | | | | | | | |
Net loan charge-offs as a % of average loans, annualized * | | | | | | | | | | | | | | | | | | | | | | | | | | | | |
Commercial | | | 0.60 | % | | | 0.31 | % | | | 0.28 | % | | | 0.03 | % | | | 0.28 | % | | | 0.31 | % | | | 0.22 | % |
Real estate - mortgage | | | 0.22 | % | | | 0.07 | % | | | 0.13 | % | | | 0.13 | % | | | 0.13 | % | | | 0.14 | % | | | 0.16 | % |
Real estate - construction | | | 0.45 | % | | | 0.15 | % | | | 0.02 | % | | | 0.24 | % | | | 0.04 | % | | | 0.21 | % | | | 0.08 | % |
Home equity lending | | | 0.31 | % | | | 0.31 | % | | | 0.24 | % | | | 0.24 | % | | | 0.45 | % | | | 0.27 | % | | | 0.34 | % |
Indirect lending | | | 0.77 | % | | | 0.43 | % | | | 0.39 | % | | | 0.45 | % | | | 0.65 | % | | | 0.51 | % | | | 0.59 | % |
Other consumer | | | 3.01 | % | | | 2.94 | % | | | 2.14 | % | | | 2.03 | % | | | 1.59 | % | | | 2.54 | % | | | 0.60 | % |
| | | | | | | | | | | | | | | | | | | | | | | | | | | | |
Total | | | 0.45 | % | | | 0.27 | % | | | 0.23 | % | | | 0.20 | % | | | 0.27 | % | | | 0.29 | % | | | 0.22 | % |
| | | | | | | | | | | | | | | | | | | | | | | | | | | | |
Non-performing assets (NPAs): | | | | | | | | | | | | | | | | | | | | | | | | | | | | |
Non-accrual loans* | | $ | 743,589 | | | $ | 494,693 | | | $ | 501,175 | | | $ | 349,833 | | | $ | 306,471 | | | | | | | | | |
Foreclosed properties | | | 120,465 | | | | 93,649 | | | | 83,834 | | | | 72,658 | | | | 72,663 | | | | | | | | | |
| | | | | | | | | | | | | | | | | | | | | | | | | | | | |
Total | | $ | 864,054 | | | $ | 588,342 | | | $ | 585,009 | | | $ | 422,491 | | | $ | 379,134 | | | | | | | | | |
| | | | | | | | | | | | | | | | | | | | | | | | | | | | |
Loans past due > 90 days* | | $ | 356,685 | | | $ | 332,116 | | | $ | 204,829 | | | $ | 204,296 | | | $ | 143,868 | | | | | | | | | |
Credit Ratios: | | | | | | | | | | | | | | | | | | | | | | | | | | | | |
ACL/Loans, net | | | 1.45 | % | | | 1.19 | % | | | 1.19 | % | | | 1.18 | % | | | 1.17 | % | | | | | | | | |
ALL/Loans, net | | | 1.39 | % | | | 1.13 | % | | | 1.13 | % | | | 1.12 | % | | | 1.12 | % | | | | | | | | |
NPAs (ex. 90+ past due)/loans and foreclosed properties | | | 0.90 | % | | | 0.62 | % | | | 0.62 | % | | | 0.45 | % | | | 0.40 | % | | | | | | | | |
NPAs (inc. 90+ past due)/loans and foreclosed properties | | | 1.28 | % | | | 0.97 | % | | | 0.84 | % | | | 0.67 | % | | | 0.55 | % | | | | | | | | |
| * | See page 15 for loan portfolio (risk view) breakout |
Allowance for Credit Losses
($ amounts in thousands)
| | | | | | | | |
| | | Year Ended December 31 | |
| | | 2007 | | | 2006 | |
Balance at beginning of year | | $ | 1,107,788 | | | $ | 783,536 | |
Net loans charged off | | | (270,522 | ) | | | (139,941 | ) |
Allowance allocated to sold loans | | | (19,369 | ) | | | (14,140 | ) |
Allowance of purchased institutions at acquisition | | | — | | | | 335,833 | |
Provision for loan losses, from continuing operations | | | 555,000 | | | | 142,373 | |
Provision for loan losses, from discontinued operations | | | 182 | | | | 127 | |
Provision for unfunded credit commitments | | | 6,419 | | | | — | |
| | | | | | | | |
Balance at end of period | | $ | 1,379,498 | | | $ | 1,107,788 | |
| | | | | | | | |
Components: | | | | | | | | |
Allowance for loan losses | | | 1,321,244 | | | | 1,055,953 | |
Reserve for unfunded credit commitments | | | 58,254 | | | | 51,835 | |
| | | | | | | | |
Allowance for credit losses | | $ | 1,379,498 | | | $ | 1,107,788 | |
| | | | | | | | |
| (1) | Regions Financial Corporation and AmSouth Bancorporation merged effective November 4, 2006. The merger was accounted for as a purchase of AmSouth by Regions. As a result, periods ending prior to November 4, 2006, reflect legacy Regions data on a stand-alone basis |
| (2) | Certain amounts in prior periods have been reclassified to reflect current period presentation |
FINANCIAL SUPPLEMENT TO
FOURTH QUARTER 2007 EARNINGS RELEASE
PAGE 15
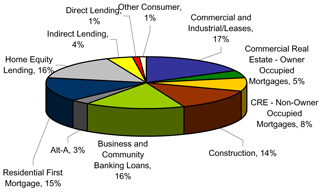
Loan Portfolio - Risk View
Total Loan Portfolio - $95.4 billion
| | | | | | |
($ in thousands) | | Outstanding | | % of Total
Loans | |
Commercial | | | | | | |
Commercial and Industrial/Leases | | $ | 16,533,176 | | 17 | % |
Commercial Real Estate - Owner Occupied Mortgages | | | 4,436,631 | | 5 | % |
| | | | | | |
Total Commercial | | | 20,969,807 | | 22 | % |
Commercial Real Estate | | | | | | |
CRE - Non-Owner Occupied Mortgages | | | 8,057,504 | | 8 | % |
Construction | | | 12,893,068 | | 14 | % |
| | | | | | |
Total Commercial Real Estate | | | 20,950,572 | | 22 | % |
Business and Community Banking Loans | | | 15,540,443 | | 16 | % |
Residential First Mortgage | | | | | | |
Alt-A | | | 2,830,062 | | 3 | % |
Residential First Mortgage | | | 14,129,484 | | 15 | % |
| | | | | | |
Total Residential First Mortgage | | | 16,959,546 | | 18 | % |
Consumer | | | | | | |
Home Equity Lending | | | 14,962,007 | | 16 | % |
Indirect Lending | | | 3,938,113 | | 4 | % |
Direct Lending | | | 1,066,184 | | 1 | % |
Other Consumer | | | 992,175 | | 1 | % |
| | | | | | |
Total Other Consumer | | | 20,958,479 | | 22 | % |
| | | | | | |
Total Loans | | $ | 95,378,847 | | 100 | % |
| | | | | | |
Fourth Quarter 2007 Net Charge-offs, Non-accrual and 90+ Days Past Due Loans
| | | | | | | | | | | | | | | | | | |
($ in thousands) | | 90+ Past Due | | % of Loans* | | | Non-accrual
loans | | % of Loans* | | | Net Charge-
offs | | % of Avg
Loans* | |
Commercial | | | | | | | | | | | | | | | | | | |
Commercial and Industrial/Leases | | $ | 5,984 | | 0.04 | % | | $ | 55,355 | | 0.33 | % | | $ | 24,784 | | 0.49 | % |
Commercial Real Estate - Owner Occupied | | | 1,112 | | 0.03 | % | | | 105,494 | | 2.38 | % | | | 2,643 | | 0.13 | % |
| | | | | | | | | | | | | | | | | | |
Total Commercial | | | 7,096 | | 0.03 | % | | | 160,849 | | 0.77 | % | | | 27,427 | | 0.39 | % |
Commercial Real Estate | | | | | | | | | | | | | | | | | | |
CRE - Non-Owner Occupied Mortgages | | | 7,625 | | 0.09 | % | | | 148,539 | | 1.84 | % | | | 9,903 | | 0.73 | % |
Construction | | | 18,535 | | 0.14 | % | | | 304,941 | | 2.37 | % | | | 16,111 | | 0.48 | % |
| | | | | | | | | | | | | | | | | | |
Total Commercial Real Estate | | | 26,160 | | 0.12 | % | | | 453,480 | | 2.16 | % | | | 26,014 | | 0.55 | % |
Business and Community Banking Loans | | | 10,638 | | 0.07 | % | | | 75,930 | | 0.49 | % | | | 10,313 | | 0.39 | % |
Residential First Mortgage | | | | | | | | | | | | | | | | | | |
Alt-A | | | 41,125 | | 1.45 | % | | | 8,534 | | 0.30 | % | | | 1,822 | | 0.26 | % |
Residential First Mortgage | | | 113,281 | | 0.80 | % | | | 38,177 | | 0.27 | % | | | 5,611 | | 0.16 | % |
| | | | | | | | | | | | | | | | | | |
Total Residential First Mortgage | | | 154,406 | | 0.91 | % | | | 46,711 | | 0.28 | % | | | 7,433 | | 0.18 | % |
Consumer | | | | | | | | | | | | | | | | | | |
Home Equity Lending | | | 146,808 | | 0.98 | % | | | 6,611 | | 0.04 | % | | | 11,513 | | 0.31 | % |
Indirect Lending | | | 6,002 | | 0.15 | % | | | 8 | | 0.00 | % | | | 7,752 | | 0.77 | % |
Direct Lending | | | 2,997 | | 0.28 | % | | | — | | 0.00 | % | | | 2,911 | | 1.09 | % |
Other Consumer | | | 2,578 | | 0.26 | % | | | — | | 0.00 | % | | | 14,109 | | 5.21 | % |
| | | | | | | | | | | | | | | | | | |
Total Other Consumer | | | 158,385 | | 0.76 | % | | | 6,619 | | 0.03 | % | | | 36,285 | | 0.69 | % |
| | | | | | | | | | | | | | | | | | |
Total Loans | | $ | 356,685 | | 0.37 | % | | $ | 743,589 | | 0.78 | % | | $ | 107,472 | | 0.45 | % |
| | | | | | | | | | | | | | | | | | |
| * | Percentage of related loan category outstandings |
FINANCIAL SUPPLEMENT TO
FOURTH QUARTER 2007 EARNINGS RELEASE
PAGE 16
Commercial Real Estate - $21.0 billion
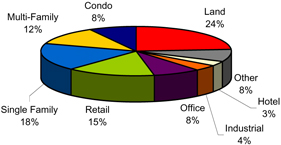
| | • | | Portfolio well-diversified by product type |
| | • | | $7.2 billion residential homebuilder portfolio is a subset of the Commercial Real Estate portfolio with the majority of the residential homebuilder portfolio found in land and single family sectors |
| | • | | Proactively reducing certain concentrations |
| | • | | Land balances down $1.1 billion since December 2006 |
| | • | | Condominium balances down $644 million since December 2006 |
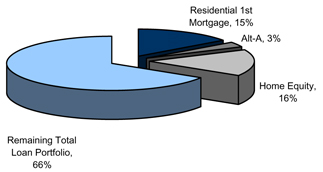
Consumer Real Estate - $31.9 Billion
Total Loan Portfolio
| | | | | | | | | | | | | | |
| | | Outstandings* | | Wgtd Avg.
LTV | | | Wgtd Avg.
FICO | | Avg. Loan
Size | | % in 1st
Lien | |
Home Equity Lending | | $ | 14,962,007 | | 74 | % | | 733 | | $ | 70,964 | | 41 | % |
Residential 1st Mortg | | | 14,129,484 | | 67 | % | | 725 | | | 174,006 | | 100 | % |
Alt-A | | | 2,830,062 | | 72 | % | | 711 | | | 175,737 | | 100 | % |
| | | | | | | | | | | | | | |
Total Consumer RE Portfolio | | $ | 31,921,553 | | 71 | % | | 727 | | $ | 119,495 | | 71 | % |
| | | | | | | | | | | | | | |
FINANCIAL SUPPLEMENT TO
FOURTH QUARTER 2007 EARNINGS RELEASE
PAGE 17
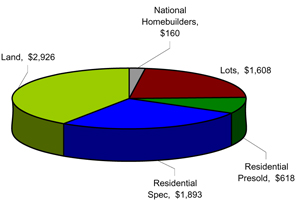
Residential Homebuilder Portfolio - $7.2 billion
Portfolio Breakout by Category
$ in millions)
Geographic Breakout
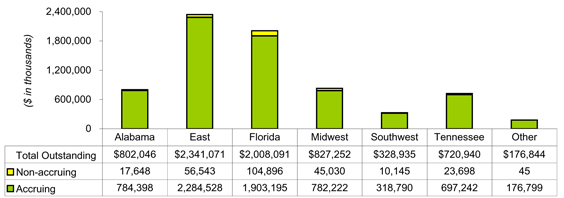
1 | East consists of Georgia, North Carolina, and South Carolina |
2 | Midwest consists of Arkansas, Illinois, Indiana, Iowa, Kentucky, Missouri, and Texas |
3 | Southwest consists of Louisiana and Mississippi |
Product Breakout
($ in thousands)
| | | | | | | | | | | | | | | | | | | | | | | | | | | | | | |
| | | Lots | | Residential Presold | | Residential Spec | | Land | | National
Homebuilders | | Total Portfolio |
| | | $ | | %* | | $ | | %* | | $ | | %* | | $ | | %* | | $ | | %* | | $ | | %* |
90+ Past Due | | | 8,306 | | 0.52 | | | 892 | | 0.14 | | | 4,921 | | 0.26 | | | 5,218 | | 0.18 | | | — | | — | | | 19,337 | | 0.27 |
Non-Accruing Loans | | | 68,269 | | 4.25 | | | 31,750 | | 5.14 | | | 100,640 | | 5.31 | | | 57,346 | | 1.96 | | | — | | — | | | 258,005 | | 3.58 |
Average Note Size: | | | | | | | | | | | | | | | | | | | | | | | | | | | | | | |
Total Portfolio | | | 290 | | — | | | 350 | | — | | | 240 | | — | | | 1,148 | | — | | | 4,721 | | — | | | 405 | | — |
East | | | 203 | | — | | | 247 | | — | | | 225 | | — | | | 1,078 | | — | | | — | | — | | | 307 | | — |
Florida | | | 843 | | — | | | 965 | | — | | | 529 | | — | | | 3,626 | | — | | | — | | — | | | 1,265 | | — |
| | | | | | | | | | | | | | | | | | | | | | | | | | | | | | |
Outstandings | | $ | 1,607,794 | | | | $ | 617,628 | | | | $ | 1,893,567 | | | | $ | 2,925,685 | | | | $ | 160,505 | | | | $ | 7,205,179 | | |
| | | | | | | | | | | | | | | | | | | | | | | | | | | | | | |
| * | Percentage of related product outstandings |
| | • | | Average note size of the homebuilder portfolio is $405,000 |
| | • | | Non-accruing loans represent 3.58 percent of the total homebuilder portfolio with the highest concentrations in Florida and the East |
| | • | | 4Q07 net charge-offs (individually exceeding $1 million) in the homebuilder portfolio were $11 million |
| | • | | At 4Q07 approximately $850 million of the $7.2 billion homebuilder portfolio was identified for transfer into special assets department |
FINANCIAL SUPPLEMENT TO
FOURTH QUARTER 2007 EARNINGS RELEASE
PAGE 18
Additional Financial and Operational Data
| | | | | | | | | | |
| | | 12/31/07 | | 9/30/07 | | 6/30/07 | | 3/31/07 | | 12/31/06 |
Associate headcount | | 33,161 | | 33,630 | | 34,293 | | 34,138 | | 36,517 |
Authorized shares remaining under buyback program (see note below) | | 23.1MM | | 27.6MM | | 34.2MM | | 53.9MM | | 13.9MM |
Total branch outlets (1) | | 1,965 | | 2,022 | | 2,081 | | 2,088 | | 2,126 |
ATMs | | 2,490 | | 2,549 | | 2,581 | | 2,590 | | 2,664 |
Morgan Keegan offices | | 416 | | 430 | | 446 | | 453 | | 319 |
| (1) | Regions divested 52 branches in connection with the AmSouth merger, which occurred during 1Q07 |
| | • | | During 4Q07, 3.8 million shares were repurchased at an average price of $26.48 |
Merger-Related Items
(Pre-tax dollars in thousands)
| | | | | | | | | | |
| | | Income Statement
Effect | | Excess Purchase
Price | | | Total |
Year ended December 31, 2006 | | $ | 88,658 | | $ | 185,378 | | | $ | 274,036 |
First Quarter 2007 | | | 48,993 | | | 3,537 | | | | 52,530 |
Second Quarter 2007 | | | 59,927 | | | 4,090 | | | | 64,017 |
Third Quarter 2007 | | | 91,785 | | | 118 | | | | 91,903 |
Fourth Quarter 2007 | | | 150,162 | | | (10,648 | ) | | | 139,514 |
| | | | | | | | | | |
Total | | $ | 439,525 | | $ | 182,475 | | | $ | 622,000 |
| | | | | | | | | | |
FINANCIAL SUPPLEMENT TO
FOURTH QUARTER 2007 EARNINGS RELEASE
PAGE 19
Reconciliation to GAAP Financial Measures
The table below presents computations of earnings and certain other financial measures excluding discontinued operations and merger charges (non-GAAP). Merger charges and discontinued operations are included in financial results presented in accordance with generally accepted accounting principles (GAAP). Regions believes the exclusion of merger charges in expressing earnings and certain other financial measures, including “earnings per share from continuing operations, excluding merger charges” and “return on average tangible equity, excluding discontinued operations and merger charges”, provides a meaningful base for period-to-period comparisons, which management believes will assist investors in analyzing the operating results of the Company and predicting future performance. These non-GAAP financial measures are also used by management to assess the performance of Regions’ business, because management does not consider merger charges to be relevant to ongoing operating results. Management and the Board of Directors utilize these non-GAAP financial measures for the following purposes: Preparation of Regions’ operating budgets; calculation of performance-based annual incentive bonuses for certain executives; calculation of performance-based multi-year incentive bonuses for certain executives; monthly financial performance reporting, including segment reporting; monthly close-out “flash” reporting of consolidated results (management only); and presentations to investors of company performance. Regions believes that presenting these non-GAAP financial measures will permit investors to assess the performance of the Company on the same basis as that applied by management and the Board of Directors. Non-GAAP financial measures have inherent limitations, are not required to be uniformly applied and are not audited. To mitigate these limitations, Regions has policies in place to address expenses that qualify as merger charges and procedures in place to approve and segregate merger charges from other normal operating expenses to ensure that the Company’s operating results are properly reflected for period-to-period comparisons. Although these non-GAAP financial measures are frequently used by stakeholders in the evaluation of a company, they have limitations as analytical tools, and should not be considered in isolation, or as a substitute for analyses of results as reported under GAAP. In particular, a measure of earnings that excludes merger charges does not represent the amount that effectively accrues directly to stockholders (i.e., merger charges are a reduction in earnings and stockholders’ equity).
| | | | | | | | | | | | | | | | | | | | | | | | | | | | | | |
| | | | | As of and for Quarter Ended | | | As of and for Year Ended | |
($ amounts in thousands, except per share data) | | | | 12/31/07 | | | 9/30/07 | | | 6/30/07 | | | 3/31/07 | | | 12/31/06 | | | 12/31/07 | | | 12/31/06 | |
INCOME | | | | | | | | | | | | | | | | | | | | | | | | | | | | | | |
Income from continuing operations (GAAP) | | | | $ | 71,115 | | | $ | 394,240 | | | $ | 453,732 | | | $ | 474,076 | | | $ | 371,995 | | | $ | 1,393,163 | | | $ | 1,372,521 | |
Loss from discontinued operations, net of tax | | | | | (474 | ) | | | (76 | ) | | | (423 | ) | | | (141,095 | ) | | | (10,444 | ) | | | (142,068 | ) | | | (19,376 | ) |
| | | | | | | | | | | | | | | | | | | | | | | | | | | | | | |
Net income (GAAP) | | A | | $ | 70,641 | | | $ | 394,164 | | | $ | 453,309 | | | $ | 332,981 | | | $ | 361,551 | | | $ | 1,251,095 | | | $ | 1,353,145 | |
| | | | | | | | | | | | | | | | | | | | | | | | | | | | | | |
Income from continuing operations (GAAP) | | | | $ | 71,115 | | | $ | 394,240 | | | $ | 453,732 | | | $ | 474,076 | | | $ | 371,995 | | | $ | 1,393,163 | | | $ | 1,372,521 | |
Merger-related charges, pre-tax | | | | | | | | | | | | | | | | | | | | | | | | | | | | | | |
Salaries and employee benefits | | | | | 97,224 | | | | 14,811 | | | | 23,047 | | | | 23,531 | | | | 65,655 | | | | 158,613 | | | | 65,693 | |
Net occupancy expense | | | | | 3,891 | | | | 21,428 | | | | 4,685 | | | | 3,830 | | | | 3,473 | | | | 33,834 | | | | 3,473 | |
Furniture and equipment expense | | | | | 1,677 | | | | 1,942 | | | | 992 | | | | 245 | | | | 427 | | | | 4,856 | | | | 427 | |
Other | | | | | 47,370 | | | | 53,604 | | | | 31,203 | | | | 21,387 | | | | 18,083 | | | | 153,564 | | | | 19,066 | |
| | | | | | | | | | | | | | | | | | | | | | | | | | | | | | |
Total merger-related charges, pre-tax | | | | | 150,162 | | | | 91,785 | | | | 59,927 | | | | 48,993 | | | | 87,638 | | | | 350,867 | | | | 88,659 | |
Merger-related charges, net of tax | | | | | 93,505 | | | | 56,501 | | | | 37,155 | | | | 30,376 | | | | 59,299 | | | | 217,537 | | | | 60,320 | |
| | | | | | | | | | | | | | | | | | | | | | | | | | | | | | |
Income excluding discontinued operations and merger charges (non-GAAP) | | B | | $ | 164,620 | | | $ | 450,741 | | | $ | 490,887 | | | $ | 504,452 | | | $ | 431,294 | | | $ | 1,610,700 | | | $ | 1,432,841 | |
| | | | | | | | | | | | | | | | | | | | | | | | | | | | | | |
Weighted-average shares outstanding - diluted | | C | | | 696,895 | | | | 704,485 | | | | 715,564 | | | | 734,534 | | | | 646,372 | | | | 712,743 | | | | 506,989 | |
Earnings per share, excluding discontinued operations and merger charges - diluted | | B/C | | $ | 0.24 | | | $ | 0.64 | | | $ | 0.69 | | | $ | 0.69 | | | $ | 0.67 | | | $ | 2.26 | | | $ | 2.83 | |
| | | | | | | | | | | | | | | | | | | | | | | | | | | | | | |
RETURN ON AVERAGE TANGIBLE EQUITY | | | | | | | | | | | | | | | | | | | | | | | | | | | | | | |
Average equity (GAAP) | | D | | $ | 19,868,796 | | | $ | 19,793,123 | | | $ | 20,040,276 | | | $ | 20,452,731 | | | $ | 17,185,928 | | | $ | 20,036,459 | | | $ | 12,368,632 | |
Average intangible assets (GAAP) | | | | | 12,232,365 | | | | 12,026,887 | | | | 12,097,753 | | | | 12,165,061 | | | | 9,862,793 | | | | 12,130,417 | | | | 6,449,657 | |
| | | | | | | | | | | | | | | | | | | | | | | | | | | | | | |
Average tangible equity | | E | | $ | 7,636,431 | | | $ | 7,766,236 | | | $ | 7,942,523 | | | $ | 8,287,670 | | | $ | 7,323,135 | | | $ | 7,906,042 | | | $ | 5,918,975 | |
Average equity, excluding discontinued operations | | F | | $ | 19,868,796 | | | $ | 19,793,123 | | | $ | 20,040,276 | | | $ | 20,360,732 | | | $ | 17,039,768 | | | $ | 20,013,170 | | | $ | 12,215,207 | |
Average intangible assets, excluding discontinued operations | | | | | 12,232,365 | | | | 12,026,887 | | | | 12,097,753 | | | | 12,165,061 | | | | 9,862,793 | | | | 12,130,417 | | | | 6,449,657 | |
| | | | | | | | | | | | | | | | | | | | | | | | | | | | | | |
| | G | | $ | 7,636,431 | | | $ | 7,766,236 | | | $ | 7,942,523 | | | $ | 8,195,671 | | | $ | 7,176,975 | | | $ | 7,882,753 | | | $ | 5,765,550 | |
Return on average tangible equity* | | A/E | | | 3.67 | % | | | 20.14 | % | | | 22.89 | % | | | 16.29 | % | | | 19.59 | % | | | 15.82 | % | | | 22.86 | % |
| | | | | | | | | | | | | | | | | | | | | | | | | | | | | | |
Return on average tangible equity, ex. discontinued operations and merger charges (non-GAAP)* | | B/G | | | 8.55 | % | | | 23.03 | % | | | 24.79 | % | | | 24.96 | % | | | 23.84 | % | | | 20.43 | % | | | 24.85 | % |
| | | | | | | | | | | | | | | | | | | | | | | | | | | | | | |
| * | Income statement amounts have been annualized in calculation |
FINANCIAL SUPPLEMENT TO
FOURTH QUARTER 2007 EARNINGS RELEASE
PAGE 20
Forward-Looking Statements
This financial supplement to Regions’ fourth quarter 2007 earnings release may include forward-looking statements about Regions Financial Corporation within the meaning of the Private Securities Litigation Reform Act of 1995. Statements that are not historical or current facts, including statements about beliefs and expectations, are forward-looking statements. The words “believe,” “expect,” “anticipate,” “project,” and similar expressions often signify forward-looking statements. Such statements involve inherent risks and uncertainties. Regions cautions that actual results and events could differ materially from expectations expressed in forward-looking statements as a result of factors such as possible changes in economic and business conditions and interest rates; the current stresses in the financial markets; Regions’ ability to attract and retain customers; the effects of geopolitical instability and risks such as terrorist attacks; the effects of weather and natural disasters such as hurricanes; possible changes in laws and regulations and governmental monetary and fiscal policies; the cost and other effects of legal and administrative cases and similar contingencies; possible changes in the creditworthiness of customers and the possible impairment of collectibility of loans; increased competition from both banks and non-banks; and effects of critical accounting policies and judgments. For discussion of these and other risks that may cause actual results to differ from expectations, please look under the caption “Forward Looking Statements” in Regions’ Annual Report on Form 10-K for the year ended December 31, 2006 and in subsequently-filed Forms 10-Q, as on file with the Securities and Exchange Commission. You should not place undue reliance on any forward-looking statements, which speak only as of the date made. Regions assumes no obligation to update or revise any forward-looking statements that are made from time to time.
Regions’ Investor Relations contact is List Underwood at (205) 801-0265; Regions’ Media contact is Tim Deighton at (205) 264-5277.