Credit Suisse 2008 Financial Services Forum February 7, 2008 Exhibit 99.1 |
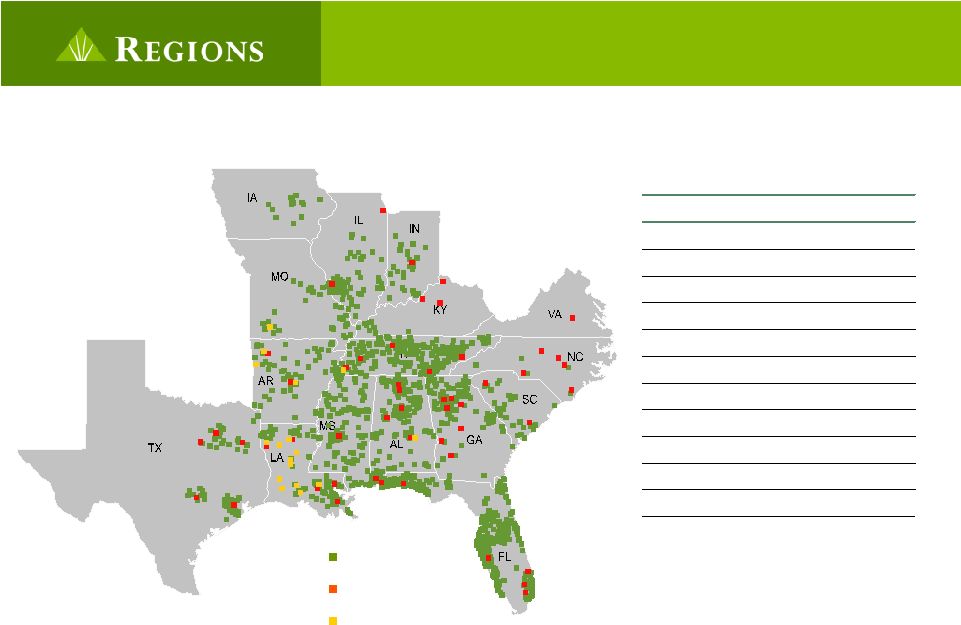
FORWARD LOOKING STATEMENTS The information contained in this presentation may include forward-looking statements which reflect Regions’ current views with respect to future events and financial performance. The Private Securities Litigation Reform Act of 1995 ("the Act") provides a safe harbor for forward-looking statements which are identified as such and are accompanied by the identification of important factors that could cause actual results to differ materially from the forward-looking statements. For these statements, we, together with our subsidiaries, unless the context implies otherwise, claim the protection afforded by the safe harbor in the Act. Forward-looking statements are not based on historical information, but rather are related to future operations, strategies, financial results, or other developments. Forward-looking statements are based on management's expectations as well as certain assumptions and estimates made by, and information available to, management at the time the statements are made. Those statements are based on general assumptions and are subject to various risks, uncertainties, and other factors that may cause actual results to differ materially from the views, beliefs, and projections expressed in such statements. These risks, uncertainties and other factors include, but are not limited to, those described below: Regions' ability to achieve the earnings expectations related to businesses that have been acquired, including its merger with AmSouth Bancorporation, or that may be acquired in the future, which in turn depends on a variety of factors, including: Regions' ability to achieve the anticipated cost savings and revenue enhancements with respect to the acquired operations, or lower than expected revenues from continuing operations; the assimilation of the combined companies’ corporate cultures; the continued growth of the markets that the acquired entities serve, consistent with recent historical experience; difficulties related to the integration of the businesses, including integration of information systems and retention of key personnel. Regions' ability to expand into new markets and to maintain profit margins in the face of competitive pressures. Regions' ability to keep pace with technological changes. Regions' ability to develop competitive new products and services in a timely manner and the acceptance of such products and services by Regions' customers and potential customers. Regions' ability to effectively manage interest rate risk, market risk, credit risk, operational risk, legal risk, and regulatory and compliance risk. Regions' ability to manage fluctuations in the value of assets and liabilities and off-balance sheet exposure so as to maintain sufficient capital and liquidity to support Regions' business. The cost and other effects of material contingencies, including litigation contingencies. The effects of increased competition from both banks and non-banks. Further easing of restrictions on participants in the financial services industry, such as banks, securities brokers and dealers, investment companies and finance companies, may increase competitive pressures. The effects of current stresses in the financial markets. Possible changes in interest rates may increase funding costs and reduce earning asset yields, thus reducing margins. Possible changes in general economic and business conditions in the United States in general and in the communities Regions serves in particular. Possible changes in the creditworthiness of customers and the possible impairment of collectibility of loans. The effects of geopolitical instability and risks such as terrorist attacks. Possible changes in trade, monetary and fiscal policies, laws, and regulations, and other activities of governments, agencies, and similar organizations, including changes in accounting standards, may have an adverse effect on business. Possible changes in consumer and business spending and saving habits could affect Regions' ability to increase assets and to attract deposits. The effects of weather and natural disasters such as hurricanes. The words "believe," "expect," "anticipate," "project," and similar expressions often signify forward-looking-statements. You should not place undue reliance on any forward-looking statements. Any such statement speaks only as of the date the statement was made. Regions assumes no obligation to update or revise any forward-looking-statements. |
Company Profile Company Profile Integration Update 4Q07 Financial Performance and Credit Quality 2008-2010 Strategic Initiatives Overview |
Regions is Among the Largest U.S. Banks Market Capitalization $16 billion Assets $141 billion Loans, net of unearned income $95 billion Deposits $95 billion Branches 1,965 ATMs 2,490 NOTE: As of December 31, 2007. |
Franchise Footprint Source: SNL DataSource and Regions as of June 30, 2007 State Dep. ($B) Mkt. Share Rank AL $18.2 25% #1 FL 17.7 5 #4 TN 16.7 16 #2 LA 7.6 10 #3 MS 6.2 15 #1 GA 5.5 3 #6 AR 4.3 9 #2 TX 3.0 1 #18 IL 2.4 1 #24 MO 2.3 2 #8 IN 2.0 2 #9 Other 2.4 — — Regions Morgan Keegan Insurance |
Regions compares favorably in terms of local market share relative to other top 10 banking franchises 1 Deposit weighted by county. Excludes deposits from branches with > $10bn of deposits. Based on June 30, 2007 data. 16.6% Median 7.9 Citigroup 13.2 National City 14.3 SunTrust 16.0 JP Morgan Chase 16.4 Bank of America 16.6 U.S. Bancorp 17.2 Fifth Third 18.3 Wachovia 18.5 Regions 19.1 Wells Fargo 21.8% BB&T Market Share (1) Name Average Weighted Weighted Average Market Share |
10.5% 10.0% 8.1% 8.0% 7.9% 7.0% 6.9% 5.9% 5.7% 4.5% 4.2% 3.7% 3.4% 3.4% 3.3% 2.8% 0.0% 2.0% 4.0% 6.0% 8.0% 10.0% 12.0% Fast Growing Footprint Projected Population Growth (2007-2012) of Market Footprint (1) Source: SNL Financial. Data as of June 2007. Pro forma for completed/pending M&A. 1 Deposit weighted by State. National Average 6.3% |
Morgan Keegan – Among the Largest Regional Full-Service Brokerage and Investment Banking Firms Revenue ($M) Pre-Tax Income ($M) Financial Performance 416 Office Locations Revenue Composition (2007) Profile Founded in 1969 Acquired by Regions in 2001 1,282 financial advisors 416 offices in 19 states Record revenues of $1.3 billion in 2007 98,700 new accounts opened in 2007 $80 billion of customer assets $81 billion of trust assets #1 underwriter of long-term municipal bonds in the south central U.S. for 14 consecutive years #11 book-running manager in 2006 ($8.6 billion, 445 issues) Private Client 30% Fixed Income Capital Markets 19% Equity Capital Markets 8% Regions MK Trust 17% Other 11% Asset Mgmt 15% $810 $1,029 $1,300 2005 2006 2007 $161 $239 $262 2005 2006 2007 |
Company Profile Integration Update Integration Update 4Q07 Financial Performance and Credit Quality 2008-2010 Strategic Initiatives Overview |
Merger Integration Complete Combined Product Set & Incentives Complete Sale of Divested Branches 1Q07 2Q07 3Q07 4Q07 Brokerage Conversion Mortgage Origination & Servicing Conversion Trust Conversion Event Two Branch Conversion and Consolidations Event Three Branch Conversion and Consolidations Event One Branch Conversion and Consolidations Pre-conversion Branch Consolidations |
443,000 hours of training completed in preparation for branch conversions in which we converted: 1,945 branches 7.2 million deposit accounts 840,000 loan accounts Consolidated 160 branches in overlapping markets Merger Integration Complete |
2007 2007 2008 2008 $0 $200 $400 $600 Original Target Actually Achieved New Target $400 Exceeding Original Cost Saves $ in millions $345 $500 |
Company Profile Integration Update 4Q07 Financial Performance 4Q07 Financial Performance and Credit Quality and Credit Quality 2008-2010 Strategic Initiatives Overview |
Increased credit allowance for loan losses Aggressively managing residential homebuilder portfolio Strong fee-based revenue, particularly Morgan Keegan Cost saves exceed expectations Non-merger-related charges incurred during the quarter Capital position remains strong Fourth Quarter Financial Performance |
› Visa Settlement $51.5 million › Morgan Keegan Investment Loss $38.5 million › Mortgage Servicing Valuation $27.4 million Adjustment and Loss on Sale › Low Income Housing Investment $ 9.4 million Impairment › Foreclosed Real Estate Writedown $ 7.0 million 4Q07 Unusual Items |
Financial Performance $ 0.24 EPS – diluted 0.45 % Net Charge-Off Ratio Asset Quality 0.90 % Nonperforming Assets as a % of Loans 1.45 % Allowance for Credit Losses as a % of Loans 8.55 % Return on Avg. Tangible Equity 65.9 % Operating Efficiency 3.61 % Net Interest Margin Profitability As Reported NOTE: Ratios are excluding discontinued operations and merger-related charges. For a reconciliation of these amounts to GAAP financial measures and a statement of why management believes these measures provide useful information to investors, see Regions' 8-K filed January 22, 2008 announcing preliminary results of operations for the period ended December 31, 2007. 4Q07 Financial Summary |
Credit Quality Trends 0.45% 0.90% 0.37% 0.27% 0.20% 0.23% 0.27% 0.62% 0.62% 0.45% 0.40% 0.15% 0.22% 0.22% 0.35% 0.00% 0.20% 0.40% 0.60% 0.80% 1.00% 4Q06 1Q07 2Q07 3Q07 4Q07 NPAs/Loans and OREO Net Charge-Offs/Average Loans Delinquent Loans (90+ Past Due) |
Diversified Loan Portfolio C&I, 17% CRE- Owner Occupied Mortgages, 5% CRE- Non-owner Occupied Mortgages, 8% Construction, 14% Business and Community Banking, 16% Alt-A, 3% Residential 1st Mortgage, 15% Home Equity Lending, 16% Indirect Lending, 4% Direct Lending, 1% Other Consumer, 1% Total Loan Portfolio - $95.4 billion |
Commercial Real Estate Portfolio - $21.0 billion CRE Portfolio by Product CRE Portfolio Characteristics CRE portfolio is diversified by product, loan size, and by geography CRE portfolio is very granular with the average note size under $600 thousand Top 5 MSA concentrations are Atlanta, Miami, Nashville, Tampa, and Birmingham, all of which are under 10% $7.2 billion homebuilder portfolio is a subset of the CRE portfolio, with the majority being found in the land and single family sectors Proactively reducing certain concentrations Multi-Family, 12% Single Family, 18% Retail, 15% Office, 8% Industrial, 4% Hotel, 3% Other, 8% Land, 24% Condo , 8% |
Residential Homebuilder Portfolio - $7.2 billion Land, $2,926 Residential Spec, $1,893 Residential Presold, $618 Lots, $1,608 National Homebuilders, $160 Product Breakout $ %* $ %* $ %* $ %* $ %* $ %* 90+ Past Due 8,306 0.52 892 0.14 4,921 0.26 5,218 0.18 - - 19,337 0.27 Non-Accruing Loans 68,269 4.25 31,750 5.14 100,640 5.31 57,346 1.96 - - 258,005 3.58 Average Note Size: Total Portfolio 290 - 350 - 240 - 1,148 - 4,721 - 405 - East 203 - 247 - 225 - 1,078 - - - 307 - Florida 843 - 965 - 529 - 3,626 - - - 1,265 - Outstandings 1,607,794 $ 617,628 $ 1,893,567 $ 2,925,685 $ 160,505 $ 7,205,179 $ National Homebuilders Total Portfolio Lots Residential Presold Residential Spec Land ($ in thousands) * Percentage related to product outstandings |
Residential Homebuilder Portfolio - $7.2 billion 0 600,000 1,200,000 1,800,000 2,400,000 Total Outstanding $802,046 $2,341,071 $2,008,091 $827,252 $328,935 $720,940 $176,844 Non-accruing 17,648 56,543 104,896 45,030 10,145 23,698 45 Accruing 784,398 2,284,528 1,903,195 782,222 318,790 697,242 176,799 Alabama East Florida Midwest Southwest Tennessee Other Residential Homebuilder Portfolio - $7.2 billion Geographic Breakout ($ in thousands) |
Consumer Real Estate Portfolio - $31.9 billion Residential First Mortgage 15% Alt A 3% Home Equity 16% Remaining Loan Portfolio 66% NOTE: As of December 31, 2007. Wgtd Avg. Wgtd Avg. Outstandings* LTV FICO Home Equity Lending 14,962,007 $ 74% 733 70,964 $ 41% Residential 1st Mortg 14,129,484 67% 725 174,006 100% Alt-A 2,830,062 72% 711 175,737 100% Total Consumer RE Portfolio 31,921,553 $ 71% 727 119,495 $ 71% * $ in thousands Avg. Loan Size % in 1st Lien |
Excellent Loss Experience versus Peers NOTE: Industry peers include FITB, KEY, NCC, STI, USB, WFC, WM Home Equity Regions 0.24% 0.31% 0.31% Industry Peers 0.46% 0.64% 1.02% Residential First Mortgage Regions 0.12% 0.13% 0.18% Industry Peers 0.22% 0.30% 0.63% Net Charge-offs 2Q07 3Q07 4Q07 |
6.5% 6.3% 6.1% 5.9% 5.7% 5.5% 5.3% 5.2% 5.0% 4.3% 4.1% 0.0% 1.0% 2.0% 3.0% 4.0% 5.0% 6.0% 7.0% Strong Capital Position Tangible Equity / Tangible Assets Source: SNL DataSource, Tangible Equity/Tangible Assets as of December 31, 2007. 5.5% Median |
Company Profile Integration Update 4Q07 Financial Performance and Credit Quality 2008-2010 Strategic Initiatives 2008-2010 Strategic Initiatives Overview Overview |
Five Strategic Initiatives › Leverage full depth of Morgan Keegan capabilities among all Lines of Business › Grow the emerging and mass affluent customer segment through a fully integrated approach › Increase core customer deposits to optimize the profitability of balance sheet growth › Enhance overall company productivity › Deliver reliable, consistent service quality across all Lines of Business to improve customer satisfaction and retention Two Additional Corporate-Wide Initiatives › Identify new revenue streams › Identify new operating efficiencies |
Business Forum Scope and Structure Purpose: To lead and manage the consistent execution of Line of Business strategy across the company. Six Business Forums Will Focus On: › Branch Performance › Affluent Market › Branch Non-interest Revenue › Middle Market › Community Banking › Business Banking |
Business Forum Scope and Structure Responsibilities › Lead/drive the execution of Line of Business strategy › Provide oversight and guidance › Ensure swift adoption and adherence to all risk management policies and practices › Ensure prudent/effective use of company resources Execution Details › Monthly meeting sessions › Work plans with targeted deliverables › Monthly progress reports to Heads of General Bank and Lines of Business |
Operating According to Ten Guiding Principles › Provide uncompromised service › Drive revenue › Maintain momentum › Be fast, Be nimble › Control, monitor and report › Be consistent in best practices › Be resourceful › Invest in innovation › Grow customers › People + Partnerships = Performance |
Challenging Banking Environment Regions is well positioned despite challenging operating environment: Growth driven by strategic initiatives Relatively neutral balance sheet positioning Strong Morgan Keegan contribution Merger opportunities mitigate industry downturn, allow for increased operating leverage Exceeding merger-related cost saves Continued strong liquidity and capital ratios |
******* ******* ******* |