Exhibit 99.2
| | |
 | | FINANCIAL SUPPLEMENT TO FOURTH QUARTER 2008 EARNINGS RELEASE |
Summary
Quarterly loss of $9.01 per diluted share driven by goodwill impairment; excluding goodwill impairment loss of 35 cents per diluted share
| | • | | Significant fourth quarter drivers include: $6.0 billion non-cash goodwill impairment charge; |
$275 million tax settlement benefit covering tax years 1999-2006; $1.150 billion loan loss provision - $733 million above third quarter, primarily the result of an aggressive stance taken in disposing of non-performing assets; changes in interest rates necessitated a $99 million or 9 cent per diluted share mortgage servicing rights (MSR) impairment charge; preferred stock issuance through the Treasury’s Capital Purchase Program cost $26.2 million or 4 cents per diluted share for 7 weeks outstanding
Disposition of problem assets drives increase in net charge-offs; provision for loan losses and allowancefor credit losses increase
| | • | | Sold or transferred to held for sale approximately $1 billion of non-performing loans and foreclosed properties |
| | • | | Losses related to non-performing asset sales or marks taken on held for sale loan transfers equate to $479 million or 43 cents per diluted share |
| | • | | Net charge-offs increased to $796 million or 3.19 percent of average loans in the fourth quarter, compared to $416 million or 1.68% in the third quarter. The majority of the increase was attributable to aggressive non-performing asset dispositions. |
| | • | | Allowance for credit losses increased $353 million in fourth quarter to 1.95% of loans as compared to 1.57% in the third quarter |
| | • | | Non-performing assets decreased $53 million versus the previous quarter, to 1.76% of loans and foreclosed properties, a 3 basis point decline as compared to 1.79% in the third quarter. Excluding loans held for sale, NPA ratio decreased $347 million to $1.3 billion or 1.33 percent of loans and foreclosed properties - a 33 basis point decline versus the prior quarter. |
Decline in distressed loan portfolio exposure continues; Florida remains central pressure point
| | • | | Residential homebuilder exposure continues to decline as a result of intense focus on property dispositions as well |
as paydowns
| | • | | Homebuilder balances totaled $4.4 billion at quarter-end, a $799 million decrease compared to third quarter |
| | • | | Condominium exposure down to $946 million, declining $668 million or by 41% since the beginning of 2008 |
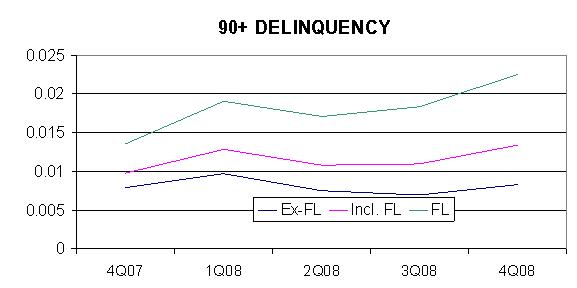
| | • | | Home equity charge-offs increased modestly to an annualized 1.72% of related loans vs. 1.59% in the third quarter |
| | • | | Florida second lien home equity losses, affected by high unemployment and further property devaluations, rise to 4.37 percent in the fourth quarter as compared to 4.28 percent in the third quarter |
| | • | | Proactive approach in contacting and helping home equity customers and actions such as fortifying the collections function |
are mitigating losses; dedicated Florida workout team focused solely on home equity lending
| | • | | Closed or reduced high-risk home equity lines |
| | • | | Emerging stress in Florida residential first mortgage and retail commercial real estate portfolios |
Net interest margin impacted by falling short-term rates
| | • | | Taxable-equivalent net interest income increased slightly to $933 million in the fourth quarter. However, adjusting for a third quarter SILO leverage lease charge, taxable-equivalent net interest income declined $41 million. |
| | • | | Net interest margin fell 14 basis points from third to fourth quarter or 28 basis points as adjusted for the SILO charge, pressured by declining short-term interest rates |
| | • | | Loan spread expansion and a return to more rational industry-wide deposit pricing expected to stabilize or improve margin in 2Q09 |
Customer deposit funding gaining momentum
| | • | | Average customer deposits grew 4 percent in the fourth quarter; up 7 percent on an ending basis |
| | • | | CD and money market balances grew in response to competitive offers and customers’ desire to lock in rates in a falling rate environment |
| | • | | Ending low-cost deposits increased 4 percent; positive impact to interest-free and money market categories from rate offers and introduction of new Consumer and Business checking products |
| | • | | Not participating in brokered retail CD programs |
Non-interest income affected by economic weakness; non-interest expense impacted by sizable non-cash charge
| | • | | Non-interest revenue decreased 2 percent to $702 million in the fourth quarter, including lower service charges, a result of a weak economy impacted by lower transaction volumes and overall activity. Lower linked quarter trust income, affected by lower asset valuations from declining markets, as well as a third quarter benefit from energy-related brokered transactions, was also a factor. |
| | • | | Non-interest expense, excluding the impact of goodwill, MSR impairment, and merger charges increased $81 million or 7 percent, driven by higher deposit-based and Morgan Keegan incentives, legal and professional fees, and valuation related charges |
| | • | | MSR impairment charges (non-cash adjustments driven primarily by interest rate changes) totaled $99 million or |
9 cents per diluted share in the fourth quarter as compared to $11 million, or 1 cent per diluted share in the third quarter
Strengthened balance sheet and liquidity positioning
| | • | | Regions’ participation in the Treasury Capital Purchase Program added $3.5 billion to Tier 1 capital |
| | • | | Tier 1 ratio an estimated 10.39 percent at December 31, 2008, $5 billion above “well capitalized” threshold |
| | • | | Tangible common equity ratio of 5.23 at December 31, 2008; decline versus third quarter due to an increase in tangible assets primarily related to an increase in invested funds from preferred share and debt issuances |
| | • | | Significant available liquidity from Federal Reserve, FHLB, unpledged securities, and unused lines; total exceeds $45 billion |
| | • | | Remaining TLGP capacity exceeds $4 billion |
| | • | | Minimal holding company long-term debt maturities in the next 2 years |
FINANCIAL SUPPLEMENT TO
FOURTH QUARTER 2008 EARNINGS RELEASE
PAGE 2
Regions Financial Corporation and Subsidiaries
Consolidated Balance Sheets
(Unaudited)
| | | | | | | | | | | | | | | | | | | | |
($ amounts in thousands) | | Quarter Ended | |
| | 12/31/08 | | | 9/30/08 | | | 6/30/08 | | | 3/31/08 | | | 12/31/07 | |
Assets: | | | | | | | | | | | | | | | | | | | | |
Cash and due from banks | | $ | 2,642,509 | | | $ | 2,985,950 | | | $ | 3,160,519 | | | $ | 3,061,324 | | | $ | 3,720,365 | |
Federal funds sold and securities purchased under agreements to resell | | | 790,097 | | | | 542,042 | | | | 949,379 | | | | 852,306 | | | | 993,070 | |
Trading account assets | | | 1,050,270 | | | | 1,267,918 | | | | 1,482,702 | | | | 1,518,960 | | | | 1,091,400 | |
Securities available for sale | | | 18,849,482 | | | | 17,632,912 | | | | 17,724,907 | | | | 17,766,260 | | | | 17,318,074 | |
Securities held to maturity | | | 47,306 | | | | 50,494 | | | | 48,244 | | | | 49,790 | | | | 50,935 | |
Loans held for sale | | | 1,282,437 | | | | 1,053,977 | | | | 677,098 | | | | 756,500 | | | | 720,924 | |
Other interest-earning assets | | | 8,436,693 | | | | 616,816 | | | | 579,892 | | | | 664,582 | | | | 536,320 | |
Loans, net of unearned income | | | 97,418,685 | | | | 98,711,810 | | | | 98,266,579 | | | | 96,385,431 | | | | 95,378,847 | |
Allowance for loan losses | | | (1,826,149 | ) | | | (1,472,141 | ) | | | (1,471,524 | ) | | | (1,376,486 | ) | | | (1,321,244 | ) |
| | | | | | | | | | | | | | | | | | | | |
Net loans | | | 95,592,536 | | | | 97,239,669 | | | | 96,795,055 | | | | 95,008,945 | | | | 94,057,603 | |
Premises and equipment, net | | | 2,786,043 | | | | 2,730,301 | | | | 2,726,249 | | | | 2,665,813 | | | | 2,610,851 | |
Interest receivable | | | 458,120 | | | | 511,897 | | | | 510,323 | | | | 549,470 | | | | 615,711 | |
Goodwill | | | 5,548,295 | | | | 11,529,091 | | | | 11,515,095 | | | | 11,510,096 | | | | 11,491,673 | |
Mortgage servicing rights (MSRs) | | | 160,890 | | | | 263,138 | | | | 271,392 | | | | 268,784 | | | | 321,308 | |
Other identifiable intangible assets | | | 638,392 | | | | 674,719 | | | | 708,655 | | | | 746,460 | | | | 759,832 | |
Other assets | | | 7,964,740 | | | | 7,193,571 | | | | 7,286,785 | | | | 8,829,681 | | | | 6,753,651 | |
| | | | | | | | | | | | | | | | | | | | |
Total Assets | | $ | 146,247,810 | | | $ | 144,292,495 | | | $ | 144,436,295 | | | $ | 144,248,971 | | | $ | 141,041,717 | |
| | | | | | | | | | | | | | | | | | | | |
Liabilities and Stockholders’ Equity: | | | | | | | | | | | | | | | | | | | | |
Deposits: | | | | | | | | | | | | | | | | | | | | |
Non-interest-bearing | | $ | 18,456,668 | | | $ | 18,044,840 | | | $ | 18,334,239 | | | $ | 18,182,582 | | | $ | 18,417,266 | |
Interest-bearing | | | 72,447,222 | | | | 71,175,708 | | | | 71,569,410 | | | | 71,004,827 | | | | 76,357,702 | |
| | | | | | | | | | | | | | | | | | | | |
Total deposits | | | 90,903,890 | | | | 89,220,548 | | | | 89,903,649 | | | | 89,187,409 | | | | 94,774,968 | |
Borrowed funds: | | | | | | | | | | | | | | | | | | | | |
Short-term borrowings: | | | | | | | | | | | | | | | | | | | | |
Federal funds purchased and securities sold under agreements to repurchase | | | 3,142,493 | | | | 10,427,005 | | | | 8,663,628 | | | | 8,450,346 | | | | 8,820,235 | |
Other short-term borrowings | | | 12,679,469 | | | | 7,114,553 | | | | 8,926,603 | | | | 8,716,951 | | | | 2,299,887 | |
| | | | | | | | | | | | | | | | | | | | |
Total short-term borrowings | | | 15,821,962 | | | | 17,541,558 | | | | 17,590,231 | | | | 17,167,297 | | | | 11,120,122 | |
Long-term borrowings | | | 19,231,277 | | | | 14,168,524 | | | | 13,318,656 | | | | 12,357,225 | | | | 11,324,790 | |
| | | | | | | | | | | | | | | | | | | | |
Total borrowed funds | | | 35,053,239 | | | | 31,710,082 | | | | 30,908,887 | | | | 29,524,522 | | | | 22,444,912 | |
Other liabilities | | | 3,477,844 | | | | 3,656,586 | | | | 3,915,265 | | | | 5,515,119 | | | | 3,998,808 | |
| | | | | | | | | | | | | | | | | | | | |
Total Liabilities | | | 129,434,973 | | | | 124,587,216 | | | | 124,727,801 | | | | 124,227,050 | | | | 121,218,688 | |
Stockholders’ equity: | | | | | | | | | | | | | | | | | | | | |
Preferred stock | | | 3,307,382 | | | | — | | | | — | | | | — | | | | — | |
Common stock | | | 7,357 | | | | 7,358 | | | | 7,358 | | | | 7,358 | | | | 7,347 | |
Additional paid-in capital | | | 16,814,730 | | | | 16,606,677 | | | | 16,588,382 | | | | 16,560,302 | | | | 16,544,651 | |
Retained earnings (deficit) | | | (1,868,752 | ) | | | 4,445,375 | | | | 4,436,660 | | | | 4,494,573 | | | | 4,439,505 | |
Treasury stock | | | (1,425,646 | ) | | | (1,423,620 | ) | | | (1,370,761 | ) | | | (1,370,761 | ) | | | (1,370,761 | ) |
Accumulated other comprehensive income (loss) | | | (22,234 | ) | | | 69,489 | | | | 46,855 | | | | 330,449 | | | | 202,287 | |
| | | | | | | | | | | | | | | | | | | | |
Total Stockholders’ Equity | | | 16,812,837 | | | | 19,705,279 | | | | 19,708,494 | | | | 20,021,921 | | | | 19,823,029 | |
| | | | | | | | | | | | | | | | | | | | |
Total Liabilities & SE | | $ | 146,247,810 | | | $ | 144,292,495 | | | $ | 144,436,295 | | | $ | 144,248,971 | | | $ | 141,041,717 | |
| | | | | | | | | | | | | | | | | | | | |
FINANCIAL SUPPLEMENT TO
FOURTH QUARTER 2008 EARNINGS RELEASE
PAGE 3
Regions Financial Corporation and Subsidiaries
Consolidated Statements of Income (2)
(Unaudited)
| | | | | | | | | | | | | | | | | | | | |
| | | Quarter Ended | |
($ amounts in thousands, except per share data) | | 12/31/08 | | | 9/30/08 | | | 6/30/08 | | | 3/31/08 | | | 12/31/07 | |
Interest income on: | | | | | | | | | | | | | | | | | | | | |
Loans, including fees | | $ | 1,327,885 | | | $ | 1,318,463 | | | $ | 1,374,702 | | | $ | 1,528,821 | | | $ | 1,674,690 | |
Securities: | | | | | | | | | | | | | | | | | | | | |
Taxable | | | 211,424 | | | | 207,927 | | | | 208,140 | | | | 200,131 | | | | 202,669 | |
Tax-exempt | | | 9,475 | | | | 10,958 | | | | 9,949 | | | | 9,714 | | | | 9,361 | |
| | | | | | | | | | | | | | | | | | | | |
Total securities | | | 220,899 | | | | 218,885 | | | | 218,089 | | | | 209,845 | | | | 212,030 | |
Loans held for sale | | | 8,622 | | | | 8,515 | | | | 9,598 | | | | 8,998 | | | | 10,089 | |
Federal funds sold and securities purchased under agreements to resell | | | 2,100 | | | | 4,914 | | | | 4,494 | | | | 7,116 | | | | 11,188 | |
Trading account assets | | | 10,996 | | | | 12,701 | | | | 18,073 | | | | 20,632 | | | | 17,666 | |
Other interest-earning assets | | | 11,004 | | | | 4,927 | | | | 5,711 | | | | 7,400 | | | | 8,505 | |
| | | | | | | | | | | | | | | | | | | | |
Total interest income | | | 1,581,506 | | | | 1,568,405 | | | | 1,630,667 | | | | 1,782,812 | | | | 1,934,168 | |
Interest expense on: | | | | | | | | | | | | | | | | | | | | |
Deposits | | | 407,458 | | | | 391,271 | | | | 422,151 | | | | 503,190 | | | | 625,600 | |
Short-term borrowings | | | 69,259 | | | | 101,690 | | | | 85,350 | | | | 113,089 | | | | 107,077 | |
Long-term borrowings | | | 180,630 | | | | 153,842 | | | | 143,456 | | | | 149,048 | | | | 157,279 | |
| | | | | | | | | | | | | | | | | | | | |
Total interest expense | | | 657,347 | | | | 646,803 | | | | 650,957 | | | | 765,327 | | | | 889,956 | |
| | | | | | | | | | | | | | | | | | | | |
Net interest income | | | 924,159 | | | | 921,602 | | | | 979,710 | | | | 1,017,485 | | | | 1,044,212 | |
Provision for loan losses | | | 1,150,000 | | | | 417,000 | | | | 309,000 | | | | 181,000 | | | | 358,000 | |
| | | | | | | | | | | | | | | | | | | | |
Net interest income (loss) after provision for loan losses | | | (225,841 | ) | | | 504,602 | | | | 670,710 | | | | 836,485 | | | | 686,212 | |
Non-interest income: | | | | | | | | | | | | | | | | | | | | |
Service charges on deposit accounts | | | 288,126 | | | | 294,038 | | | | 294,182 | | | | 271,613 | | | | 292,709 | |
Brokerage, investment banking and capital markets | | | 240,820 | | | | 241,000 | | | | 272,217 | | | | 273,431 | | | | 253,822 | |
Trust department income | | | 51,573 | | | | 66,474 | | | | 58,537 | | | | 56,938 | | | | 60,798 | |
Mortgage income | | | 34,100 | | | | 33,030 | | | | 24,926 | | | | 45,620 | | | | 28,046 | |
Securities gains (losses), net | | | (105 | ) | | | 165 | | | | 792 | | | | 91,643 | | | | (45 | ) |
Other | | | 87,272 | | | | 84,632 | | | | 93,315 | | | | 168,892 | | | | 97,648 | |
| | | | | | | | | | | | | | | | | | | | |
Total non-interest income | | | 701,786 | | | | 719,339 | | | | 743,969 | | | | 908,137 | | | | 732,978 | |
Non-interest expense: | | | | | | | | | | | | | | | | | | | | |
Salaries and employee benefits | | | 561,948 | | | | 551,802 | | | | 598,770 | | | | 643,419 | | | | 678,859 | |
Net occupancy expense | | | 113,697 | | | | 110,587 | | | | 111,259 | | | | 106,602 | | | | 106,252 | |
Furniture and equipment expense | | | 78,879 | | | | 87,805 | | | | 87,288 | | | | 80,569 | | | | 80,346 | |
Impairment (recapture) of MSR’s | | | 99,000 | | | | 11,000 | | | | (67,000 | ) | | | 42,000 | | | | 23,000 | |
Goodwill impairment | | | 6,000,000 | | | | — | | | | — | | | | — | | | | — | |
Other | | | 419,155 | | | | 366,519 | | | | 410,807 | | | | 377,508 | | | | 459,799 | |
| | | | | | | | | | | | | | | | | | | | |
Total non-interest expense (1) | | | 7,272,679 | | | | 1,127,713 | | | | 1,141,124 | | | | 1,250,098 | | | | 1,348,256 | |
| | | | | | | | | | | | | | | | | | | | |
Income (loss) from continuing operations before income taxes | | | (6,796,734 | ) | | | 96,228 | | | | 273,555 | | | | 494,524 | | | | 70,934 | |
Income taxes | | | (578,707 | ) | | | 5,870 | | | | 66,909 | | | | 157,814 | | | | (181 | ) |
Income (loss) from continuing operations | | | (6,218,027 | ) | | | 90,358 | | | | 206,646 | | | | 336,710 | | | | 71,115 | |
Loss from discontinued operations before income taxes | | | (431 | ) | | | (17,501 | ) | | | (406 | ) | | | (67 | ) | | | (765 | ) |
Income tax benefit from discontinued operations | | | (162 | ) | | | (6,604 | ) | | | (153 | ) | | | (25 | ) | | | (291 | ) |
| | | | | | | | | | | | | | | | | | | | |
Loss from discontinued operations, net of tax | | | (269 | ) | | | (10,897 | ) | | | (253 | ) | | | (42 | ) | | | (474 | ) |
| | | | | | | | | | | | | | | | | | | | |
Net income (loss) | | $ | (6,218,296 | ) | | $ | 79,461 | | | $ | 206,393 | | | $ | 336,668 | | | $ | 70,641 | |
| | | | | | | | | | | | | | | | | | | | |
Income (loss) from continuing operations available to common shareholders | | $ | (6,244,263 | ) | | $ | 90,358 | | | $ | 206,646 | | | $ | 336,710 | | | $ | 71,115 | |
| | | | | | | | | | | | | | | | | | | | |
Net income (loss) available to common shareholders | | $ | (6,244,532 | ) | | $ | 79,461 | | | $ | 206,393 | | | $ | 336,668 | | | $ | 70,641 | |
| | | | | | | | | | | | | | | | | | | | |
| | | | | |
Weighted-average shares outstanding–during quarter: | | | | | | | | | | | | | | | | | | | | |
Basic | | | 693,000 | | | | 695,950 | | | | 695,978 | | | | 695,098 | | | | 695,518 | |
Diluted | | | 693,000 | | | | 696,205 | | | | 696,346 | | | | 695,548 | | | | 696,895 | |
Actual shares outstanding–end of quarter | | | 691,366 | | | | 691,956 | | | | 694,729 | | | | 694,721 | | | | 693,636 | |
Earnings (loss) per share from continuing operations: | | | | | | | | | | | | | | | | | | | | |
Basic | | $ | (8.97 | ) | | $ | 0.13 | | | $ | 0.30 | | | $ | 0.48 | | | $ | 0.10 | |
Diluted | | $ | (8.97 | ) | | $ | 0.13 | | | $ | 0.30 | | | $ | 0.48 | | | $ | 0.10 | |
Earnings (loss) per share available to common shareholders (3): | | | | | | | | | | | | | | | | | | | | |
Basic | | $ | (9.01 | ) | | $ | 0.11 | | | $ | 0.30 | | | $ | 0.48 | | | $ | 0.10 | |
Diluted | | $ | (9.01 | ) | | $ | 0.11 | | | $ | 0.30 | | | $ | 0.48 | | | $ | 0.10 | |
Common dividends declared per share | | $ | 0.10 | | | $ | 0.10 | | | $ | 0.38 | | | $ | 0.38 | | | $ | 0.38 | |
Taxable equivalent net interest income from continuing operations | | $ | 933,059 | | | $ | 930,609 | | | $ | 989,524 | | | $ | 1,026,489 | | | $ | 1,050,416 | |
See notes to the Consolidated Statements of Income on page 5.
FINANCIAL SUPPLEMENT TO
FOURTH QUARTER 2008 EARNINGS RELEASE
PAGE 4
Regions Financial Corporation and Subsidiaries
Consolidated Statements of Income (2)
(Unaudited)
| | | | | | | | |
($ amounts in thousands, except per share data) | | Year Ended
December 31 | |
| | 2008 | | | 2007 | |
Interest income on: | | | | | | | | |
Loans, including fees | | $ | 5,549,871 | | | $ | 6,924,544 | |
Securities: | | | | | | | | |
Taxable | | | 827,622 | | | | 856,043 | |
Tax-exempt | | | 40,096 | | | | 41,260 | |
| | | | | | | | |
Total securities | | | 867,718 | | | | 897,303 | |
Loans held for sale | | | 35,733 | | | | 92,097 | |
Federal funds sold and securities purchased under agreements to resell | | | 18,624 | | | | 50,801 | |
Trading account assets | | | 62,402 | | | | 71,418 | |
Other interest-earning assets | | | 29,042 | | | | 38,500 | |
| | | | | | | | |
Total interest income | | | 6,563,390 | | | | 8,074,663 | |
Interest expense on: | | | | | | | | |
Deposits | | | 1,724,070 | | | | 2,663,883 | |
Short-term borrowings | | | 369,388 | | | | 459,467 | |
Long-term borrowings | | | 626,976 | | | | 552,947 | |
| | | | | | | | |
Total interest expense | | | 2,720,434 | | | | 3,676,297 | |
| | | | | | | | |
Net interest income | | | 3,842,956 | | | | 4,398,366 | |
Provision for loan losses | | | 2,057,000 | | | | 555,000 | |
| | | | | | | | |
Net interest income after provision for loan losses | | | 1,785,956 | | | | 3,843,366 | |
Non-interest income: | | | | | | | | |
Service charges on deposit accounts | | | 1,147,959 | | | | 1,162,740 | |
Brokerage, investment banking and capital markets | | | 1,027,468 | | | | 894,621 | |
Trust department income | | | 233,522 | | | | 251,319 | |
Mortgage income | | | 137,676 | | | | 135,704 | |
Securities gains (losses), net | | | 92,495 | | | | (8,553 | ) |
Other | | | 434,111 | | | | 420,004 | |
| | | | | | | | |
Total non-interest income | | | 3,073,231 | | | | 2,855,835 | |
Non-interest expense: | | | | | | | | |
Salaries and employee benefits | | | 2,355,939 | | | | 2,471,869 | |
Net occupancy expense | | | 442,145 | | | | 413,711 | |
Furniture and equipment expense | | | 334,541 | | | | 301,330 | |
Impairment of MSR’s | | | 85,000 | | | | 6,000 | |
Goodwill impairment | | | 6,000,000 | | | | — | |
Other | | | 1,573,989 | | | | 1,467,441 | |
| | | | | | | | |
Total non-interest expense (1) | | | 10,791,614 | | | | 4,660,351 | |
| | | | | | | | |
Income (loss) from continuing operations before income taxes | | | (5,932,427 | ) | | | 2,038,850 | |
Income taxes | | | (348,114 | ) | | | 645,687 | |
Income (loss) from continuing operations | | | (5,584,313 | ) | | | 1,393,163 | |
Loss from discontinued operations before income taxes | | | (18,405 | ) | | | (217,387 | ) |
Income tax benefit from discontinued operations | | | (6,944 | ) | | | (75,319 | ) |
| | | | | | | | |
Loss from discontinued operations, net of tax | | | (11,461 | ) | | | (142,068 | ) |
Net income (loss) | | $ | (5,595,774 | ) | | $ | 1,251,095 | |
| | | | | | | | |
Income (loss) from continuing operations available to common shareholders | | $ | (5,610,549 | ) | | $ | 1,393,163 | |
| | | | | | | | |
Net income (loss) available to common shareholders | | $ | (5,622,010 | ) | | $ | 1,251,095 | |
| | | | | | | | |
Weighted-average shares outstanding—year-to-date: | | | | | | | | |
Basic | | | 695,003 | | | | 707,981 | |
Diluted | | | 695,003 | | | | 712,743 | |
Actual shares outstanding—end of period | | | 691,366 | | | | 693,636 | |
| | |
Earnings (loss) per share from continuing operations: | | | | | | | | |
Basic | | $ | (8.03 | ) | | $ | 1.97 | |
Diluted | | $ | (8.03 | ) | | $ | 1.95 | |
Earnings (loss) per share available to common shareholders (3): | | | | | | | | |
Basic | | $ | (8.09 | ) | | $ | 1.77 | |
Diluted | | $ | (8.09 | ) | | $ | 1.76 | |
Common dividends declared per share | | $ | 0.96 | | | $ | 1.46 | |
Taxable equivalent net interest income from continuing operations | | $ | 3,879,681 | | | $ | 4,436,475 | |
See notes to the Consolidated Statements of Income on page 5.
FINANCIAL SUPPLEMENT TO
FOURTH QUARTER 2008 EARNINGS RELEASE
PAGE 5
| (1) | Merger-related charges total $24.5 million in 3Q08, $100.1 million in 2Q08, $75.6 million in 1Q08 and $150.2 million in 4Q07. |
See page 21 for additional detail.
| (2) | Certain amounts in the prior periods have been classified to reflect current period presentation |
| (3) | Includes preferred stock expense |
FINANCIAL SUPPLEMENT TO
FOURTH QUARTER 2008 EARNINGS RELEASE
PAGE 6
Regions Financial Corporation and Subsidiaries
Consolidated Average Daily Balances and Yield/Rate Analysis Including Discontinued Operations (1)
($ amounts in thousands; yields on taxable-equivalent basis)
| | | | | | | | | | | | | | | | | | | | | | | | | | | | | | | | | | | | | | | | | | | | | | | | | | |
| | | Quarter Ended | |
| | | 12/31/08 | | | 9/30/08 | | | 6/30/08 | | | 3/31/08 | | | 12/31/07 | |
| | | Average
Balance | | | Income/
Expense | | Yield/
Rate | | | Average
Balance | | | Income/
Expense | | Yield/
Rate | | | Average
Balance | | | Income/
Expense | | Yield/
Rate | | | Average
Balance | | | Income/
Expense | | Yield/
Rate | | | Average
Balance | | | Income/
Expense | | Yield/
Rate | |
Assets | | | | | | | | | | | | | | | | | | | | | | | | | | | | | | | | | | | | | | | | | | | | | | | | | | |
Interest-earning assets: | | | | | | | | | | | | | | | | | | | | | | | | | | | | | | | | | | | | | | | | | | | | | | | | | | |
Federal funds sold and securities purchased under agreements to resell | | | 608,438 | | | | 2,099 | | 1.37 | % | | | 999,678 | | | | 4,914 | | 1.96 | % | | | 883,561 | | | | 4,494 | | 2.05 | % | | | 981,195 | | | | 7,116 | | 2.92 | % | | | 992,144 | | | | 11,188 | | 4.47 | % |
Trading account assets | | | 1,333,709 | | | | 11,730 | | 3.50 | % | | | 1,347,642 | | | | 13,747 | | 4.06 | % | | | 1,399,711 | | | | 19,262 | | 5.53 | % | | | 1,813,533 | | | | 21,030 | | 4.66 | % | | | 1,289,284 | | | | 17,864 | | 5.50 | % |
Securities: | | | | | | | | | | | | | | | | | | | | | | | | | | | | | | | | | | | | | | | | | | | | | | | | | | |
Taxable | | | 17,080,811 | | | | 211,424 | | 4.92 | % | | | 16,962,182 | | | | 207,927 | | 4.88 | % | | | 16,977,622 | | | | 208,140 | | 4.93 | % | | | 16,565,408 | | | | 200,131 | | 4.86 | % | | | 16,407,051 | | | | 202,669 | | 4.90 | % |
Tax-exempt | | | 799,674 | | | | 14,378 | | 7.15 | % | | | 767,277 | | | | 16,612 | | 8.61 | % | | | 719,535 | | | | 15,220 | | 8.51 | % | | | 727,662 | | | | 14,856 | | 8.21 | % | | | 724,152 | | | | 14,300 | | 7.83 | % |
Loans held for sale | | | 823,361 | | | | 8,622 | | 4.17 | % | | | 563,015 | | | | 8,514 | | 6.02 | % | | | 650,096 | | | | 9,598 | | 5.94 | % | | | 620,722 | | | | 8,998 | | 5.83 | % | | | 663,284 | | | | 10,089 | | 6.03 | % |
Other earning assets | | | 5,604,251 | | | | 11,004 | | 0.78 | % | | | 581,740 | | | | 4,927 | | 3.37 | % | | | 636,245 | | | | 5,711 | | 3.61 | % | | | 642,804 | | | | 7,400 | | 4.63 | % | | | 572,954 | | | | 8,504 | | 5.89 | % |
Loans, net of unearned income (2) | | | 99,134,008 | | | | 1,331,149 | | 5.34 | % | | | 98,333,257 | | | | 1,320,771 | | 5.34 | % | | | 97,194,350 | | | | 1,378,056 | | 5.70 | % | | | 95,718,586 | | | | 1,532,285 | | 6.44 | % | | | 94,783,954 | | | | 1,675,758 | | 7.01 | % |
| | | | | | | | | | | | | | | | | | | | | | | | | | | | | | | | | | | | | | | | | | | | | | | | | | |
Total interest-earning assets | | | 125,384,252 | | | $ | 1,590,406 | | 5.05 | % | | | 119,554,791 | | | $ | 1,577,412 | | 5.25 | % | | | 118,461,120 | | | $ | 1,640,481 | | 5.57 | % | | | 117,069,910 | | | $ | 1,791,816 | | 6.16 | % | | | 115,432,823 | | | $ | 1,940,372 | | 6.67 | % |
Allowance for loan losses | | | (1,456,809 | ) | | | | | | | | | (1,490,838 | ) | | | | | | | | | (1,370,777 | ) | | | | | | | | | (1,332,583 | ) | | | | | | | | | (1,070,916 | ) | | | | | | |
Cash and due from banks | | | 2,499,193 | | | | | | | | | | 2,420,550 | | | | | | | | | | 2,424,758 | | | | | | | | | | 2,746,249 | | | | | | | | | | 2,831,323 | | | | | | | |
Other assets | | | 21,647,103 | | | | | | | | | | 22,756,459 | | | | | | | | | | 23,045,528 | | | | | | | | | | 23,391,604 | | | | | | | | | | 21,511,015 | | | | | | | |
| | | | | | | | | | | | | | | | | | | | | | | | | | | | | | | | | | | | | | | | | | | | | | | | | | |
| | $ | 148,073,739 | | | | | | | | | $ | 143,240,962 | | | | | | | | | $ | 142,560,629 | | | | | | | | | $ | 141,875,180 | | | | | | | | | $ | 138,704,245 | | | | | | | |
| | | | | | | | | | | | | | | | | | | | | | | | | | | | | | | | | | | | | | | | | | | | | | | | | | |
Liabilities and Stockholders’ Equity | | | | | | | | | | | | | | | | | | | | | | | | | | | | | | | | | | | | | | | | | | | | | | | | | | |
Interest-bearing liabilities: | | | | | | | | | | | | | | | | | | | | | | | | | | | | | | | | | | | | | | | | | | | | | | | | | | |
Savings accounts | | $ | 3,690,776 | | | $ | 1,072 | | 0.12 | % | | $ | 3,774,330 | | | $ | 1,010 | | 0.11 | % | | $ | 3,810,211 | | | $ | 1,000 | | 0.11 | % | | $ | 3,699,304 | | | $ | 1,268 | | 0.14 | % | | $ | 3,669,700 | | | $ | 2,236 | | 0.24 | % |
Interest-bearing transaction accounts | | | 14,393,100 | | | | 20,011 | | 0.55 | % | | | 14,830,665 | | | | 28,529 | | 0.77 | % | | | 15,396,516 | | | | 32,057 | | 0.84 | % | | | 15,620,128 | | | | 46,525 | | 1.20 | % | | | 15,029,192 | | | | 64,376 | | 1.70 | % |
Money market accounts | | | 18,431,738 | | | | 87,943 | | 1.90 | % | | | 17,534,433 | | | | 70,589 | | 1.60 | % | | | 18,314,710 | | | | 70,968 | | 1.56 | % | | | 18,801,773 | | | | 96,719 | | 2.07 | % | | | 19,290,437 | | | | 140,577 | | 2.89 | % |
Time deposits | | | 31,849,414 | | | | 292,568 | | 3.65 | % | | | 30,167,854 | | | | 272,975 | | 3.60 | % | | | 29,932,613 | | | | 292,402 | | 3.93 | % | | | 29,573,584 | | | | 315,860 | | 4.30 | % | | | 28,588,955 | | | | 324,892 | | 4.51 | % |
Foreign deposits | | | 3,395,035 | | | | 5,864 | | 0.69 | % | | | 4,592,450 | | | | 18,168 | | 1.57 | % | | | 5,635,370 | | | | 25,724 | | 1.84 | % | | | 6,005,430 | | | | 42,818 | | 2.87 | % | | | 9,212,655 | | | | 93,519 | | 4.03 | % |
| | | | | | | | | | | | | | | | | | | | | | | | | | | | | | | | | | | | | | | | | | | | | | | | | | |
Total interest-bearing deposits | | | 71,760,063 | | | | 407,458 | | 2.26 | % | | | 70,899,732 | | | | 391,271 | | 2.20 | % | | | 73,089,420 | | | | 422,151 | | 2.32 | % | | | 73,700,219 | | | | 503,190 | | 2.75 | % | | | 75,790,939 | | | | 625,600 | | 3.27 | % |
Federal funds purchased and securities sold under agreements to repurchase | | | 4,458,517 | | | | 12,103 | | 1.08 | % | | | 9,906,410 | | | | 51,596 | | 2.07 | % | | | 7,683,304 | | | | 39,353 | | 2.06 | % | | | 8,753,109 | | | | 67,940 | | 3.12 | % | | | 8,557,902 | | | | 92,310 | | 4.28 | % |
Other short-term borrowings | | | 14,259,653 | | | | 57,156 | | 1.59 | % | | | 8,014,170 | | | | 50,094 | | 2.49 | % | | | 7,097,347 | | | | 45,997 | | 2.61 | % | | | 5,389,754 | | | | 45,149 | | 3.37 | % | | | 1,554,759 | | | | 14,767 | | 3.77 | % |
Long-term borrowings | | | 16,068,876 | | | | 180,630 | | 4.47 | % | | | 13,363,762 | | | | 153,842 | | 4.58 | % | | | 12,925,634 | | | | 143,456 | | 4.46 | % | | | 11,653,966 | | | | 149,048 | | 5.14 | % | | | 11,054,567 | | | | 157,279 | | 5.64 | % |
| | | | | | | | | | | | | | | | | | | | | | | | | | | | | | | | | | | | | | | | | | | | | | | | | | |
Total interest-bearing liabilities | | | 106,547,109 | | | $ | 657,347 | | 2.45 | % | | | 102,184,074 | | | $ | 646,803 | | 2.52 | % | | | 100,795,705 | | | $ | 650,957 | | 2.60 | % | | | 99,497,048 | | | $ | 765,327 | | 3.09 | % | | | 96,958,167 | | | $ | 889,956 | | 3.64 | % |
Net interest spread | | | | | | | | | 2.60 | % | | | | | | | | | 2.73 | % | | | | | | | | | 2.97 | % | | | | | | | | | 3.07 | % | | | | | | | | | 3.03 | % |
| | | | | | | | | | | | | | | | | | | | | | | | | | | | | | | | | | | | | | | | | | | | | | | | | | |
Non-interest-bearing deposits | | | 17,773,390 | | | | | | | | | | 17,690,915 | | | | | | | | | | 17,814,075 | | | | | | | | | | 17,602,501 | | | | | | | | | | 18,249,585 | | | | | | | |
Other liabilities | | | 3,343,346 | | | | | | | | | | 3,652,505 | | | | | | | | | | 4,168,681 | | | | | | | | | | 4,931,717 | | | | | | | | | | 3,627,697 | | | | | | | |
Stockholders’ equity | | | 20,409,894 | | | | | | | | | | 19,713,468 | | | | | | | | | | 19,782,168 | | | | | | | | | | 19,843,914 | | | | | | | | | | 19,868,796 | | | | | | | |
| | | | | | | | | | | | | | | | | | | | | | | | | | | | | | | | | | | | | | | | | | | | | | | | | | |
| | $ | 148,073,739 | | | | | | | | | $ | 143,240,962 | | | | | | | | | $ | 142,560,629 | | | | | | | | | $ | 141,875,180 | | | | | | | | | $ | 138,704,245 | | | | | | | |
| | | | | | | | | | | | | | | | | | | | | | | | | | | | | | | | | | | | | | | | | | | | | | | | | | |
Net interest income/margin FTE basis | | | | | | $ | 933,059 | | 2.96 | % | | | | | | $ | 930,609 | | 3.10 | % | | | | | | $ | 989,524 | | 3.36 | % | | | | | | $ | 1,026,489 | | 3.53 | % | | | | | | $ | 1,050,416 | | 3.61 | % |
| | | | | | | | | | | | | | | | | | | | | | | | | | | | | | | | | | | | | | | | | | | | | | | | | | |
| (1) | Certain amounts in prior periods have been reclassified to reflect current period presentation |
| (2) | 3Q08 loan income includes a $43.1 million reduction for the impact of a leveraged lease tax settlement. The yield on loans adjusted to exclude the settlement would be 5.52% in 3Q08. |
FINANCIAL SUPPLEMENT TO
FOURTH QUARTER 2008 EARNINGS RELEASE
PAGE 7
Regions Financial Corporation and Subsidiaries
Consolidated Average Daily Balances and Yield/Rate Analysis (1)
($ amounts in thousands; yields on taxable equivalent basis)
| | | | | | | | | | | | | | | | | | | | |
| | | Year Ended December 31 | |
| | | 2008 | | | 2007 | |
| | | Average
Balance | | | Revenue/
Expense | | Yield/
Rate | | | Average
Balance | | | Revenue/
Expense | | Yield/
Rate | |
Assets | | | | | | | | | | | | | | | | | | | | |
Interest-earning assets: | | | | | | | | | | | | | | | | | | | | |
Federal funds sold and securities purchased under agreements to resell | | | 867,868 | | | | 18,623 | | 2.15 | % | | | 1,020,994 | | | | 50,801 | | 4.98 | % |
Trading account assets | | | 1,472,922 | | | | 65,769 | | 4.47 | % | | | 1,441,565 | | | | 72,199 | | 5.01 | % |
Securities: | | | | | | | | | | | | | | | | | | | | |
Taxable securities | | | 16,897,189 | | | | 827,622 | | 4.90 | % | | | 16,981,646 | | | | 856,043 | | 5.04 | % |
Tax-exempt | | | 753,700 | | | | 61,065 | | 8.10 | % | | | 736,762 | | | | 62,751 | | 8.52 | % |
Loans held for sale | | | 664,456 | | | | 35,733 | | 5.38 | % | | | 1,538,813 | | | | 110,950 | | 7.21 | % |
Loans held for sale-divestitures | | | — | | | | — | | — | | | | 283,697 | | | | 21,521 | | 7.59 | % |
Other earning assets | | | 1,872,964 | | | | 29,042 | | 1.55 | % | | | 588,141 | | | | 38,500 | | 6.55 | % |
Loans, net of unearned income (2) | | | 97,601,272 | | | | 5,562,261 | | 5.70 | % | | | 94,372,061 | | | | 6,900,007 | | 7.31 | % |
| | | | | | | | | | | | | | | | | | | | |
Total interest-earning assets | | | 120,130,371 | | | | 6,600,115 | | 5.49 | % | | | 116,963,679 | | | | 8,112,772 | | 6.94 | % |
Allowance for loan losses | | | (1,413,085 | ) | | | | | | | | | (1,063,011 | ) | | | | | | |
Cash and due from banks | | | 2,522,344 | | | | | | | | | | 2,848,590 | | | | | | | |
Other non-earning assets | | | 22,707,395 | | | | | | | | | | 20,007,361 | | | | | | | |
| | | | | | | | | | | | | | | | | | | | |
| | $ | 143,947,025 | | | | | | | | | $ | 138,756,619 | | | | | | | |
| | | | | | | | | | | | | | | | | | | | |
Liabilities and Stockholders’ Equity | | | | | | | | | | | | | | | | | | | | |
Interest-bearing liabilities: | | | | | | | | | | | | | | | | | | | | |
Savings accounts | | $ | 3,743,595 | | | $ | 4,350 | | 0.12 | % | | $ | 3,797,413 | | | $ | 10,879 | | 0.29 | % |
Interest-bearing transaction accounts | | | 15,057,653 | | | | 127,123 | | 0.84 | % | | | 15,553,355 | | | | 311,672 | | 2.00 | % |
Money market accounts | | | 18,269,092 | | | | 326,219 | | 1.79 | % | | | 19,455,402 | | | | 629,187 | | 3.23 | % |
Time deposits | | | 30,384,297 | | | | 1,173,804 | | 3.86 | % | | | 29,862,940 | | | | 1,352,093 | | 4.53 | % |
Foreign deposits | | | 4,902,080 | | | | 92,574 | | 1.89 | % | | | 7,679,264 | | | | 347,961 | | 4.53 | % |
Interest-bearing deposits - divestitures | | | — | | | | — | | — | | | | 374,179 | | | | 12,091 | | 3.23 | % |
| | | | | | | | | | | | | | | | | | | | |
Total interest-bearing deposits | | | 72,356,717 | | | | 1,724,070 | | 2.38 | % | | | 76,722,553 | | | | 2,663,883 | | 3.47 | % |
Federal funds purchased and securities sold under agreements to repurchase | | | 7,697,505 | | | | 170,993 | | 2.22 | % | | | 8,080,179 | | | | 377,595 | | 4.67 | % |
Other short-term borrowings | | | 8,703,601 | | | | 198,395 | | 2.28 | % | | | 1,901,897 | | | | 81,872 | | 4.30 | % |
Long-term borrowings | | | 13,509,689 | | | | 626,976 | | 4.64 | % | | | 9,697,823 | | | | 552,947 | | 5.70 | % |
| | | | | | | | | | | | | | | | | | | | |
Total interest-bearing liabilities | | | 102,267,512 | | | | 2,720,434 | | 2.66 | % | | | 96,402,452 | | | | 3,676,297 | | 3.81 | % |
Net interest spread | | | | | | | | | 2.83 | % | | | | | | | | | 3.13 | % |
| | | | | | | | | | | | | | | | | | | | |
Non-interest bearing deposits | | | 17,720,285 | | | | | | | | | | 19,002,548 | | | | | | | |
Other liabilities | | | 4,019,821 | | | | | | | | | | 3,315,160 | | | | | | | |
Stockholders’ equity | | | 19,939,407 | | | | | | | | | | 20,036,459 | | | | | | | |
| | | | | | | | | | | | | | | | | | | | |
| | $ | 143,947,025 | | | | | | | | | $ | 138,756,619 | | | | | | | |
| | | | | | | | | | | | | | | | | | | | |
Net interest income/margin FTE basis | | | | | | $ | 3,879,681 | | 3.23 | % | | | | | | $ | 4,436,475 | | 3.79 | % |
| | | | | | | | | | | | | | | | | | | | |
| (1) | Certain amounts in prior periods have been reclassified to reflect current period presentation |
| (2) | 2008 loan income includes a $43.1 million reduction for the impact of a leveraged lease tax settlement. The yield on loans adjusted to exclude the settlement would be 5.74% |
FINANCIAL SUPPLEMENT TO
FOURTH QUARTER 2008 EARNINGS RELEASE
PAGE 8
Regions Financial Corporation and Subsidiaries
Selected Ratios
| | | | | | | | | | | | | | | | | | | | |
| | | As of and for Quarter Ended | |
| | | 12/31/08 | | | 9/30/08 | | | 6/30/08 | | | 3/31/08 | | | 12/31/07 | |
Return on average assets* | | | NM | | | | 0.22 | % | | | 0.58 | % | | | 0.95 | % | | | 0.20 | % |
Return on average common equity* | | | NM | | | | 1.60 | % | | | 4.20 | % | | | 6.82 | % | | | 1.41 | % |
Return on average tangible common equity* | | | NM | | | | 4.20 | % | | | 10.98 | % | | | 17.84 | % | | | 3.67 | % |
Common equity per share | | $ | 19.53 | | | $ | 28.48 | | | $ | 28.37 | | | $ | 28.82 | | | $ | 28.58 | |
Tangible common book value per share | | $ | 10.59 | | | $ | 10.84 | | | $ | 10.77 | | | $ | 11.18 | | | $ | 10.92 | |
Stockholders’ equity to total assets | | | 11.50 | % | | | 13.66 | % | | | 13.65 | % | | | 13.88 | % | | | 14.05 | % |
Tangible common stockholders’ equity to tangible assets | | | 5.23 | % | | | 5.69 | % | | | 5.67 | % | | | 5.90 | % | | | 5.88 | % |
Tangible common stockholders’ equity to tangible assets (excluding other comprehensive income) | | | 5.24 | % | | | 5.64 | % | | | 5.64 | % | | | 5.64 | % | | | 5.72 | % |
Tier 1 Capital (2) | | | 10.39 | % | | | 7.47 | % | | | 7.48 | % | | | 7.30 | % | | | 7.29 | % |
Total Risk-Based Capital (2) | | | 14.65 | % | | | 11.70 | % | | | 11.77 | % | | | 11.07 | % | | | 11.25 | % |
Allowance for credit losses as a percentage of loans, net of unearned income (1) | | | 1.95 | % | | | 1.57 | % | | | 1.56 | % | | | 1.49 | % | | | 1.45 | % |
Allowance for loan losses as a percentage of loans, net of unearned income | | | 1.87 | % | | | 1.49 | % | | | 1.50 | % | | | 1.43 | % | | | 1.39 | % |
Net interest margin (FTE) (3) | | | 2.96 | % | | | 3.10 | % | | | 3.36 | % | | | 3.53 | % | | | 3.61 | % |
Loans, net of unearned income, to total deposits | | | 107.17 | % | | | 110.64 | % | | | 109.30 | % | | | 108.07 | % | | | 100.64 | % |
Net charge-offs as a percentage of average loans* | | | 3.19 | % | | | 1.68 | % | | | 0.86 | % | | | 0.53 | % | | | 0.45 | % |
Non-performing assets (excluding loans 90 days past due)
as a percentage of loans and other real estate | | | 1.76 | % | | | 1.79 | % | | | 1.65 | % | | | 1.25 | % | | | 0.90 | % |
Non-performing assets (excluding loans 90 days past due)
as a percentage of loans and other real estate (4) | | | 1.33 | % | | | 1.66 | % | | | 1.65 | % | | | 1.25 | % | | | 0.90 | % |
Non-performing assets (including loans 90 days past due)
as a percentage of loans and other real estate | | | 2.33 | % | | | 2.25 | % | | | 2.09 | % | | | 1.73 | % | | | 1.28 | % |
Non-performing assets (including loans 90 days past due)as a percentage of loans and other real estate (4) | | | 1.89 | % | | | 2.12 | % | | | 2.08 | % | | | 1.73 | % | | | 1.28 | % |
| (1) | The allowance for credit losses reflects the allowance related to both loans on the balance sheet and exposure related to unfunded commitments and standby letters of credit |
| (2) | Current quarter Tier 1 and Total Risk-based Capital ratios are estimated |
| (3) | 3Q08 lower by 14 bps resulting from the impact of a leveraged lease tax settlement in the quarter |
| (4) | Excludes loans held for sale |
FINANCIAL SUPPLEMENT TO
FOURTH QUARTER 2008 EARNINGS RELEASE
PAGE 9
Loans (1)
Loan Portfolio - Period End Data
| | | | | | | | | | | | | | | | | | | | | | | | | | | | | |
($ amounts in thousands) | | 12/31/08 | | 9/30/08 | | 6/30/08 | | 3/31/08 | | 12/31/07 | | 12/31/08
vs. 9/30/08 | | | 12/31/08
vs. 12/31/07 | |
Commercial and industrial | | $ | 23,595,418 | | $ | 23,511,223 | | $ | 23,241,719 | | $ | 21,721,738 | | $ | 20,906,617 | | $ | 84,195 | | | 0.4 | % | | $ | 2,688,801 | | | 12.9 | % |
Residential first mortgage | | | 15,839,016 | | | 16,190,711 | | | 16,464,099 | | | 16,763,350 | | | 16,959,546 | | | (351,695 | ) | | -2.2 | % | | | (1,120,530 | ) | | -6.6 | % |
Commercial real estate | | | 26,208,325 | | | 25,720,059 | | | 24,919,399 | | | 24,694,372 | | | 23,107,176 | | | 488,266 | | | 1.9 | % | | | 3,101,149 | | | 13.4 | % |
Construction | | | 10,634,063 | | | 11,620,174 | | | 12,001,490 | | | 11,961,974 | | | 13,301,898 | | | (986,111 | ) | | -8.5 | % | | | (2,667,835 | ) | | -20.1 | % |
Home equity | | | 16,130,255 | | | 15,848,995 | | | 15,446,740 | | | 15,034,850 | | | 14,962,007 | | | 281,260 | | | 1.8 | % | | | 1,168,248 | | | 7.8 | % |
Indirect | | | 3,853,770 | | | 4,211,078 | | | 4,145,457 | | | 3,961,782 | | | 3,938,113 | | | (357,308 | ) | | -8.5 | % | | | (84,343 | ) | | -2.1 | % |
Other consumer | | | 1,157,838 | | | 1,609,570 | | | 2,047,675 | | | 2,247,365 | | | 2,203,490 | | | (451,732 | ) | | -28.1 | % | | | (1,045,652 | ) | | -47.5 | % |
| | | | | | | | | | | | | | | | | | | | | | | | | | | | | |
| | $ | 97,418,685 | | $ | 98,711,810 | | $ | 98,266,579 | | $ | 96,385,431 | | $ | 95,378,847 | | $ | (1,293,125 | ) | | -1.3 | % | | $ | 2,039,838 | | | 2.1 | % |
| | | | | | | | | | | | | | | | | | | | | | | | | | | | | |
|
| Loan Portfolio - Average Balances | |
| | | | | | | |
($ amounts in thousands) | | 4Q08 | | 3Q08 | | 2Q08 | | 1Q08 | | 4Q07 | | 4Q08
vs. 3Q08 | | | 4Q08
vs. 4Q07 | |
Commercial and industrial | | $ | 24,121,842 | | $ | 22,915,564 | | $ | 22,403,228 | | $ | 21,168,719 | | $ | 22,913,252 | | $ | 1,206,278 | | | 5.3 | % | | $ | 1,208,590 | | | 5.3 | % |
Residential first mortgage | | | 16,004,588 | | | 16,303,753 | | | 16,577,757 | | | 16,809,947 | | | 16,498,108 | | | (299,165 | ) | | -1.8 | % | | | (493,520 | ) | | -3.0 | % |
Commercial real estate | | | 25,886,699 | | | 25,206,590 | | | 24,741,421 | | | 24,037,892 | | | 20,722,764 | | | 680,109 | | | 2.7 | % | | | 5,163,935 | | | 24.9 | % |
Construction | | | 11,583,984 | | | 12,042,140 | | | 12,151,436 | | | 12,406,900 | | | 13,543,446 | | | (458,156 | ) | | -3.8 | % | | | (1,959,462 | ) | | -14.5 | % |
Home equity | | | 16,035,825 | | | 15,659,363 | | | 15,252,902 | | | 14,997,751 | | | 14,888,685 | | | 376,462 | | | 2.4 | % | | | 1,147,140 | | | 7.7 | % |
Indirect | | | 4,043,477 | | | 4,214,428 | | | 4,038,990 | | | 3,954,999 | | | 3,975,744 | | | (170,951 | ) | | -4.1 | % | | | 67,733 | | | 1.7 | % |
Other consumer | | | 1,457,593 | | | 1,991,419 | | | 2,028,616 | | | 2,342,378 | | | 2,241,955 | | | (533,826 | ) | | -26.8 | % | | | (784,362 | ) | | -35.0 | % |
| | | | | | | | | | | | | | | | | | | | | | | | | | | | | |
| | $ | 99,134,008 | | $ | 98,333,257 | | $ | 97,194,350 | | $ | 95,718,586 | | $ | 94,783,954 | | $ | 800,751 | | | 0.8 | % | | $ | 4,350,054 | | | 4.6 | % |
| | | | | | | | | | | | | | | | | | | | | | | | | | | | | |
| (1) | Certain amounts in the prior periods have been reclassified to reflect current period presentation |
| | • | | 1Q08 loan classifications reflect an approximate $722 million reclassification of balances from construction to commercial real estate, effective 1/1/08 |
FINANCIAL SUPPLEMENT TO
FOURTH QUARTER 2008 EARNINGS RELEASE
PAGE 10
Deposits (1)
Deposit Portfolio - Period End Data
| | | | | | | | | | | | | | | | | | | | | | | | | | | | | |
($ amounts in thousands) | | 12/31/08 | | 9/30/08 | | 6/30/08 | | 3/31/08 | | 12/31/07 | | 12/31/08
vs. 9/30/08 | | | 12/31/08
vs. 12/31/07 | |
Customer Deposits | | | | | | | | | | | | | | | | | | | | | | | | | | | | | |
Interest-Free Deposits | | $ | 18,456,668 | | $ | 18,044,840 | | $ | 18,334,239 | | $ | 18,182,582 | | $ | 18,417,266 | | $ | 411,828 | | | 2.3 | % | | $ | 39,402 | | | 0.2 | % |
Interest-Bearing Checking | | | 15,022,207 | | | 14,616,324 | | | 15,380,301 | | | 15,603,984 | | | 15,846,139 | | | 405,883 | | | 2.8 | % | | | (823,932 | ) | | -5.2 | % |
Savings | | | 3,662,949 | | | 3,708,541 | | | 3,819,138 | | | 3,792,550 | | | 3,646,632 | | | (45,592 | ) | | -1.2 | % | | | 16,317 | | | 0.4 | % |
Money Market | | | 19,470,885 | | | 17,098,015 | | | 17,993,169 | | | 18,649,389 | | | 18,934,309 | | | 2,372,870 | | | 13.9 | % | | | 536,576 | | | 2.8 | % |
Money Market - Foreign | | | 1,812,446 | | | 2,454,107 | | | 3,122,234 | | | 3,089,721 | | | 3,482,603 | | | (641,661 | ) | | -26.1 | % | | | (1,670,157 | ) | | -48.0 | % |
| | | | | | | | | | | | | | | | | | | | | | | | | | | | | |
Low Cost Deposits | | | 58,425,155 | | | 55,921,827 | | | 58,649,081 | | | 59,318,226 | | | 60,326,949 | | | 2,503,328 | | | 4.5 | % | | | (1,901,794 | ) | | -3.2 | % |
| | | | | | | | | | | | | | | | | | | | | | | | | | | | | |
Time Deposits | | | 32,368,499 | | | 29,287,705 | | | 27,376,268 | | | 26,910,200 | | | 26,507,459 | | | 3,080,794 | | | 10.5 | % | | | 5,861,040 | | | 22.1 | % |
| | | | | | | | | | | | | | | | | | | | | | | | | | | | | |
Total Customer Deposits | | | 90,793,654 | | | 85,209,532 | | | 86,025,349 | | | 86,228,426 | | | 86,834,408 | | | 5,584,122 | | | 6.6 | % | | | 3,959,246 | | | 4.6 | % |
| | | | | | | | | | | | | | | | | | | | | | | | | | | | | |
Corporate Treasury Deposits | | | | | | | | | | | | | | | | | | | | | | | | | | | | | |
Time Deposits | | | 110,236 | | | 1,123,213 | | | 3,085,874 | | | 2,552,983 | | | 2,791,386 | | | (1,012,977 | ) | | -90.2 | % | | | (2,681,150 | ) | | -96.1 | % |
Other Foreign Deposits | | | — | | | 2,887,803 | | | 792,426 | | | 406,000 | | | 5,149,174 | | | (2,887,803 | ) | | -100.0 | % | | | (5,149,174 | ) | | -100.0 | % |
| | | | | | | | | | | | | | | | | | | | | | | | | | | | | |
Total Corporate Treasury Deposits | | | 110,236 | | | 4,011,016 | | | 3,878,300 | | | 2,958,983 | | | 7,940,560 | | | (3,900,780 | ) | | -97.3 | % | | | (7,830,324 | ) | | -98.6 | % |
| | | | | | | | | | | | | | | | | | | | | | | | | | | | | |
Total Deposits | | $ | 90,903,890 | | $ | 89,220,548 | | $ | 89,903,649 | | $ | 89,187,409 | | $ | 94,774,968 | | $ | 1,683,342 | | | 1.9 | % | | $ | (3,871,078 | ) | | -4.1 | % |
| | | | | | | | | | | | | | | | | | | | | | | | | | | | | |
|
| Deposit Portfolio - Average Balances | |
($ amounts in thousands) | | 4Q08 | | 3Q08 | | 2Q08 | | 1Q08 | | 4Q07 | | 4Q08
vs. 3Q08 | | | 4Q08
vs. 4Q07 | |
Customer Deposits | | | | | | | | | | | | | | | | | | | | | | | | | | | | | |
Interest-Free Deposits | | $ | 17,773,390 | | $ | 17,690,914 | | $ | 17,814,075 | | $ | 17,602,501 | | $ | 18,249,585 | | $ | 82,476 | | | 0.5 | % | | $ | (476,195 | ) | | -2.6 | % |
Interest-Bearing Checking | | | 14,393,100 | | | 14,830,665 | | | 15,396,516 | | | 15,620,128 | | | 15,029,192 | | | (437,565 | ) | | -3.0 | % | | | (636,092 | ) | | -4.2 | % |
Savings | | | 3,690,776 | | | 3,774,330 | | | 3,810,211 | | | 3,699,304 | | | 3,669,700 | | | (83,554 | ) | | -2.2 | % | | | 21,076 | | | 0.6 | % |
Money Market | | | 18,431,738 | | | 17,534,433 | | | 18,314,710 | | | 18,801,773 | | | 19,290,437 | | | 897,305 | | | 5.1 | % | | | (858,699 | ) | | -4.5 | % |
Money Market - Foreign | | | 2,133,088 | | | 2,859,674 | | | 3,112,534 | | | 3,213,214 | | | 3,851,066 | | | (726,586 | ) | | -25.4 | % | | | (1,717,978 | ) | | -44.6 | % |
| | | | | | | | | | | | | | | | | | | | | | | | | | | | | |
Low Cost Deposits | | | 56,422,092 | | | 56,690,016 | | | 58,448,046 | | | 58,936,920 | | | 60,089,980 | | | (267,924 | ) | | -0.5 | % | | | (3,667,888 | ) | | -6.1 | % |
| | | | | | | | | | | | | | | | | | | | | | | | | | | | | |
Time Deposits | | | 31,442,107 | | | 27,769,797 | | | 27,247,666 | | | 26,717,380 | | | 26,716,422 | | | 3,672,310 | | | 13.2 | % | | | 4,725,685 | | | 17.7 | % |
| | | | | | | | | | | | | | | | | | | | | | | | | | | | | |
Total Customer Deposits | | | 87,864,199 | | | 84,459,813 | | | 85,695,712 | | | 85,654,300 | | | 86,806,402 | | | 3,404,386 | | | 4.0 | % | | | 1,057,797 | | | 1.2 | % |
| | | | | | | | | | | | | | | | | | | | | | | | | | | | | |
Corporate Treasury Deposits | | | | | | | | | | | | | | | | | | | | | | | | | | | | | |
Time Deposits | | | 407,307 | | | 2,398,056 | | | 2,684,946 | | | 2,856,204 | | | 1,872,532 | | | (1,990,749 | ) | | -83.0 | % | | | (1,465,225 | ) | | -78.2 | % |
Other Foreign Deposits | | | 1,261,948 | | | 1,732,776 | | | 2,522,837 | | | 2,792,216 | | | 5,361,590 | | | (470,828 | ) | | -27.2 | % | | | (4,099,642 | ) | | -76.5 | % |
| | | | | | | | | | | | | | | | | | | | | | | | | | | | | |
Total Corporate Treasury Deposits | | | 1,669,255 | | | 4,130,832 | | | 5,207,783 | | | 5,648,420 | | | 7,234,122 | | | (2,461,577 | ) | | -59.6 | % | | | (5,564,867 | ) | | -76.9 | % |
| | | | | | | | | | | | | | | | | | | | | | | | | | | | | |
Total Deposits | | $ | 89,533,454 | | $ | 88,590,645 | | $ | 90,903,495 | | $ | 91,302,720 | | $ | 94,040,524 | | $ | 942,809 | | | 1.1 | % | | $ | (4,507,070 | ) | | -4.8 | % |
| | | | | | | | | | | | | | | | | | | | | | | | | | | | | |
| (1) | Certain amounts in the prior periods have been reclassified to reflect current period presentation |
FINANCIAL SUPPLEMENT TO
FOURTH QUARTER 2008 EARNINGS RELEASE
PAGE 11
Operating Revenue from Continuing Operations (1)
Revenue
| | | | | | | | | | | | | | | | | | | | | | | | | | | | | |
($ amounts in thousands) | | 4Q08 | | 3Q08 | | 2Q08 | | 1Q08 | | 4Q07 | | 4Q08
vs. 3Q08 | | | 4Q08
vs. 4Q07 | |
Net Interest Income (TE basis) | | $ | 933,059 | | $ | 930,609 | | $ | 989,524 | | $ | 1,026,489 | | $ | 1,050,416 | | $ | 2,450 | | | 0.3 | % | | $ | (117,357 | ) | | -11.2 | % |
Non-Interest Income (excl. sec. gains/losses) | | | 701,891 | | | 719,174 | | | 743,177 | | | 816,494 | | | 733,023 | | | (17,283 | ) | | -2.4 | % | | | (31,132 | ) | | -4.2 | % |
| | | | | | | | | | | | | | | | | | | | | | | | | | | | | |
Total Revenue (excl. sec. gains/losses, TE basis) | | $ | 1,634,950 | | $ | 1,649,783 | | $ | 1,732,701 | | $ | 1,842,983 | | $ | 1,783,439 | | $ | (14,833 | ) | | -0.9 | % | | $ | (148,489 | ) | | -8.3 | % |
| | | | | | | | | | | | | | | | | | | | | | | | | | | | | |
| (1) | Certain amounts in the prior periods have been reclassified to reflect current period presentation |
| | • | | Net interest margin of 2.96% in 4Q08 compared to 3.10% in 3Q08 |
| | • | | Net interest margin in 3Q08 was negatively impacted by 14 bps due to a leveraged lease tax settlement |
Therefore comparable linked quarter margin declined 28 bps
| | • | | Regions’ balance sheet positioning is asset-sensitive as of December 31, 2008 |
FINANCIAL SUPPLEMENT TO
FOURTH QUARTER 2008 EARNINGS RELEASE
PAGE 12
Non-Interest Income and Expense from Continuing Operations (1)
Non-interest Income and Expense
Non-interest Income
| | | | | | | | | | | | | | | | | | | | | | | | | | | | | | | | |
($ amounts in thousands) | | 4Q08 | | | 3Q08 | | 2Q08 | | | 1Q08 | | 4Q07 | | | 4Q08
vs. 3Q08 | | | 4Q08
vs. 4Q07 | |
Service charges on deposit accounts | | $ | 288,126 | | | $ | 294,038 | | $ | 294,182 | | | $ | 271,613 | | $ | 292,709 | | | $ | (5,912 | ) | | -2.0 | % | | $ | (4,583 | ) | | -1.6 | % |
Brokerage, investment banking and capital markets | | | 240,820 | | | | 241,000 | | | 272,217 | | | | 273,431 | | | 253,822 | | | | (180 | ) | | -0.1 | % | | | (13,002 | ) | | -5.1 | % |
Trust department income | | | 51,573 | | | | 66,474 | | | 58,537 | | | | 56,938 | | | 60,798 | | | | (14,901 | ) | | -22.4 | % | | | (9,225 | ) | | -15.2 | % |
Mortgage income | | | 34,100 | | | | 33,030 | | | 24,926 | | | | 45,620 | | | 28,046 | | | | 1,070 | | | 3.2 | % | | | 6,054 | | | 21.6 | % |
Securities gains (losses), net | | | (105 | ) | | | 165 | | | 792 | | | | 91,643 | | | (45 | ) | | | (270 | ) | | -163.6 | % | | | (60 | ) | | -133.3 | % |
Insurance income | | | 26,346 | | | | 26,007 | | | 26,818 | | | | 30,899 | | | 23,320 | | | | 339 | | | 1.3 | % | | | 3,026 | | | 13.0 | % |
Other | | | 60,926 | | | | 58,625 | | | 66,497 | | | | 137,993 | | | 74,328 | | | | 2,301 | | | 3.9 | % | | | (13,402 | ) | | -18.0 | % |
| | | | | | | | | | | | | | | | | | | | | | | | | | | | | | | | |
Total non-interest income | | $ | 701,786 | | | $ | 719,339 | | $ | 743,969 | | | $ | 908,137 | | $ | 732,978 | | | $ | (17,553 | ) | | -2.4 | % | | $ | (31,192 | ) | | -4.3 | % |
| | | | | | | | | | | | | | | | | | | | | | | | | | | | | | | | |
| | | | | | | |
| Non-interest Expense* | | | | | | | | | | | | | | | | | | | | | | | | | |
| | | | | | | |
($ amounts in thousands) | | 4Q08 | | | 3Q08 | | 2Q08 | | | 1Q08 | | 4Q07 | | | 4Q08
vs. 3Q08 | | | 4Q08
vs. 4Q07 | |
Salaries and employee benefits (w/o merger) | | $ | 561,948 | | | $ | 527,287 | | $ | 551,973 | | | $ | 581,330 | | $ | 581,634 | | | $ | 34,661 | | | 6.6 | % | | $ | (19,686 | ) | | -3.4 | % |
Net occupancy expense | | | 113,697 | | | | 110,587 | | | 109,327 | | | | 105,203 | | | 102,361 | | | | 3,110 | | | 2.8 | % | | | 11,336 | | | 11.1 | % |
Furniture and equipment expense | | | 78,879 | | | | 87,805 | | | 82,159 | | | | 80,713 | | | 78,669 | | | | (8,926 | ) | | -10.2 | % | | | 210 | | | 0.3 | % |
Impairment (recapture) of MSR’s | | | 99,000 | | | | 11,000 | | | (67,000 | ) | | | 42,000 | | | 23,000 | | | | 88,000 | | | 800.0 | % | | | 76,000 | | | 330.4 | % |
Loss on early extinguishment of debt | | | — | | | | — | | | — | | | | 65,405 | | | — | | | | — | | | NM | | | | — | | | NM | |
Professional fees | | | 73,673 | | | | 51,594 | | | 49,342 | | | | 32,173 | | | 43,212 | | | | 22,079 | | | 42.8 | % | | | 30,461 | | | 70.5 | % |
Marketing expense | | | 21,282 | | | | 23,263 | | | 18,995 | | | | 20,684 | | | 29,062 | | | | (1,981 | ) | | -8.5 | % | | | (7,780 | ) | | -26.8 | % |
Amortization of core deposit intangible | | | 32,071 | | | | 33,011 | | | 34,013 | | | | 35,045 | | | 42,100 | | | | (940 | ) | | -2.8 | % | | | (10,029 | ) | | -23.8 | % |
Amortization of MSR’s | | | 16,201 | | | | 12,881 | | | 22,057 | | | | 24,292 | | | 21,183 | | | | 3,320 | | | 25.8 | % | | | (4,982 | ) | | -23.5 | % |
Other real estate owned expense | | | 32,244 | | | | 43,468 | | | 20,109 | | | | 6,945 | | | 8,965 | | | | (11,224 | ) | | -25.8 | % | | | 23,279 | | | 259.7 | % |
Other | | | 243,684 | | | | 202,302 | | | 220,091 | | | | 180,710 | | | 267,908 | | | | 41,382 | | | 20.5 | % | | | (24,224 | ) | | -9.0 | % |
| | | | | | | | | | | | | | | | | | | | | | | | | | | | | | | | |
| | | | | | | | | |
Total non-interest expense, excluding merger charges and goodwill impairment | | | 1,272,679 | | | | 1,103,198 | | | 1,041,066 | | | | 1,174,500 | | | 1,198,094 | | | | 169,481 | | | 15.4 | % | | | 74,585 | | | 6.2 | % |
Merger-related charges | | | — | | | | 24,515 | | | 100,058 | | | | 75,598 | | | 150,162 | | | | (24,515 | ) | | -100.0 | % | | | (150,162 | ) | | -100.0 | % |
Goodwill impairment charge | | | 6,000,000 | | | | — | | | — | | | | — | | | — | | | | 6,000,000 | | | NM | | | | 6,000,000 | | | NM | |
| | | | | | | | | | | | | | | | | | | | | | | | | | | | | | | | |
Total non-interest expense | | $ | 7,272,679 | | | $ | 1,127,713 | | $ | 1,141,124 | | | $ | 1,250,098 | | $ | 1,348,256 | | | $ | 6,144,966 | | | NM | | | $ | 5,924,423 | | | NM | |
| | | | | | | | | | | | | | | | | | | | | | | | | | | | | | | | |
| (1) | Certain amounts in prior periods have been reclassified to reflect current period presentation |
| * | Individual expense categories are presented excluding merger-related charges and goodwill impairment, which are presented in separate line items in the above table |
| | • | | A $6 billion non-cash goodwill impairment charge was booked due to the estimated value of equity being less than the book value of equity within the General Banking/Treasury segment |
| | • | | Service charges decreased $5.9 million linked quarter, due to a weak economy causing lower transaction volumes and reduced account activity |
| | • | | 4Q08 brokerage revenues remained consistent on a linked quarter basis due to increased sales activities from Morgan Keegan offset by lower capital markets revenues |
| | • | | Trust income decrease of $14.9 million in the fourth quarter, affected by lower asset valuations from declining markets. Also, third quarter trust income reflected higher fees from energy-related brokered transactions. |
| | • | | 2Q08 mortgage income reflects a $15 million loss on sale of mortgage servicing rights |
| | • | | 1Q08 other non-interest income reflects a $62.8 million gain on the redemption of Visa shares |
| | • | | Non-interest expense, excluding MSR impairment and recapture, merger-related charges, and goodwill impairment increased 7% during 4Q08 as compared to 3Q08 |
| | • | | Salaries and benefits expense rose in 4Q08 resulting from increased incentive costs tied to deposit growth and higher incentives related to increased brokerage revenues at Morgan Keegan |
| | • | | 4Q08 linked quarter increase in professional fees is due to higher legal costs |
| | • | | Decline in 3Q08 amortization of mortgage servicing rights is due to a change in the interest rate environment and a sale of a GNMA servicing rights portfolio in the previous quarter |
| | • | | 4Q08 other real estate owned expense decreased $11 million as compared to the third quarter, which included the impact of a higher level of asset sales |
| | • | | Other non-interest expense reflects losses on Morgan Keegan Mutual Funds totaling $2.8 million, $8.8 million, $13.4 million, $24.5 million, and $38.5 million for 4Q08, 3Q08, 2Q08, 1Q08 and 4Q07, respectively |
| | • | | 4Q08 other non-interest expense reflects $10 million increases in both contributions and losses on loans moved to held for sale during 3Q08 and a $21 million increase in securities-related valuation adjustments |
| | • | | 1Q08 includes $28.4 million Visa litigation expense reduction related to Visa’s IPO. Also included in other non-interest expense during 1Q08 is a $11.4 million annual subsidiary dividend payment. |
| | • | | 4Q07 other non-interest expense includes a $51.5 million charge related to Regions’ ownership interest in the Visa antitrust lawsuit settlements and other related litigation |
FINANCIAL SUPPLEMENT TO
FOURTH QUARTER 2008 EARNINGS RELEASE
PAGE 13
Morgan Keegan
Morgan Keegan
Summary Income Statement (excluding merger-related charges)
| | | | | | | | | | | | | | | | | | | | | | | | | | | | | |
($ amounts in thousands) | | 4Q08 | | 3Q08 | | 2Q08 | | 1Q08 | | 4Q07 | | 4Q08
vs. 3Q08 | | | 4Q08
vs. 4Q07 | |
Revenues: | | | | | | | | | | | | | | | | | | | | | | | | | | | | | |
Commissions | | $ | 56,075 | | $ | 60,725 | | $ | 64,615 | | $ | 67,801 | | $ | 82,502 | | $ | (4,650 | ) | | -7.7 | % | | $ | (26,427 | ) | | -32.0 | % |
Principal transactions | | | 98,445 | | | 46,312 | | | 52,615 | | | 70,045 | | | 56,216 | | | 52,133 | | | 112.6 | % | | | 42,229 | | | 75.1 | % |
Investment banking | | | 43,301 | | | 41,000 | | | 70,587 | | | 55,010 | | | 57,192 | | | 2,301 | | | 5.6 | % | | | (13,891 | ) | | -24.3 | % |
Interest | | | 16,649 | | | 21,890 | | | 27,143 | | | 29,454 | | | 33,772 | | | (5,241 | ) | | -23.9 | % | | | (17,123 | ) | | -50.7 | % |
Trust fees and services | | | 53,930 | | | 65,688 | | | 56,850 | | | 54,085 | | | 56,736 | | | (11,758 | ) | | -17.9 | % | | | (2,806 | ) | | -4.9 | % |
Investment advisory | | | 49,973 | | | 49,446 | | | 54,685 | | | 52,432 | | | 52,168 | | | 527 | | | 1.1 | % | | | (2,195 | ) | | -4.2 | % |
Other | | | 10,020 | | | 8,193 | | | 12,790 | | | 10,423 | | | 12,357 | | | 1,827 | | | 22.3 | % | | | (2,337 | ) | | -18.9 | % |
| | | | | | | | | | | | | | | | | | | | | | | | | | | | | |
Total revenues | | | 328,393 | | | 293,254 | | | 339,285 | | | 339,250 | | | 350,943 | | | 35,139 | | | 12.0 | % | | | (22,550 | ) | | -6.4 | % |
Expenses: | | | | | | | | | | | | | | | | | | | | | | | | | | | | | |
Interest expense | | | 7,334 | | | 11,380 | | | 11,644 | | | 15,470 | | | 19,790 | | | (4,046 | ) | | -35.6 | % | | | (12,456 | ) | | -62.9 | % |
Non-interest expense | | | 277,508 | | | 232,630 | | | 266,937 | | | 274,738 | | | 291,022 | | | 44,878 | | | 19.3 | % | | | (13,514 | ) | | -4.6 | % |
| | | | | | | | | | | | | | | | | | | | | | | | | | | | | |
Total expenses | | | 284,842 | | | 244,010 | | | 278,581 | | | 290,208 | | | 310,812 | | | 40,832 | | | 16.7 | % | | | (25,970 | ) | | -8.4 | % |
| | | | | | | | | | | | | | | | | | | | | | | | | | | | | |
Income before income taxes | | | 43,551 | | | 49,244 | | | 60,704 | | | 49,042 | | | 40,131 | | | (5,693 | ) | | -11.6 | % | | | 3,420 | | | 8.5 | % |
Income taxes | | | 15,406 | | | 18,262 | | | 22,463 | | | 18,069 | | | 15,068 | | | (2,856 | ) | | -15.6 | % | | | 338 | | | 2.2 | % |
| | | | | | | | | | | | | | | | | | | | | | | | | | | | | |
Net income1 | | $ | 28,145 | | $ | 30,982 | | $ | 38,241 | | $ | 30,973 | | $ | 25,063 | | $ | (2,837 | ) | | -9.2 | % | | $ | 3,082 | | | 12.3 | % |
| | | | | | | | | | | | | | | | | | | | | | | | | | | | | |
1 | 2Q08 and 1Q08 net income do not include merger-related charges of $0.5 million and $17.2 million pre-tax, or $0.3 million and $11.0 million after-tax, respectively. |
Breakout of Revenue by Division
| | | | | | | | | | | | | | | | | | | | | | | | |
($ amounts in thousands) | | Private
Client | | | Fixed-
income
Capital
Markets | | | Equity
Capital
Markets | | | Regions
MK
Trust | | | Asset
Management | | | Interest
& Other | |
Three months ended December 31, 2008: | | | | | | | | | | | | | | | | | | | | | | | | |
$ amount of revenue | | $ | 81,260 | | | $ | 109,710 | | | $ | 22,967 | | | $ | 53,931 | | | $ | 46,131 | | | $ | 14,394 | |
% of gross revenue | | | 24.7 | % | | | 33.4 | % | | | 7.0 | % | | | 16.4 | % | | | 14.0 | % | | | 4.5 | % |
Three months ended September 30, 2008: | | | | | | | | | | | | | | | | | | | | | | | | |
$ amount of revenue | | $ | 82,269 | | | $ | 73,237 | | | $ | 24,118 | | | $ | 65,688 | | | $ | 46,624 | | | $ | 1,318 | |
% of gross revenue | | | 28.1 | % | | | 25.0 | % | | | 8.2 | % | | | 22.4 | % | | | 15.9 | % | | | 0.4 | % |
Year Ended December 31, 2008: | | | | | | | | | | | | | | | | | | | | | | | | |
$ amount of revenue | | $ | 339,438 | | | $ | 369,887 | | | $ | 127,929 | | | $ | 230,551 | | | $ | 177,352 | | | $ | 55,025 | |
% of gross revenue | | | 26.1 | % | | | 28.5 | % | | | 9.8 | % | | | 17.7 | % | | | 13.6 | % | | | 4.3 | % |
Year Ended December 31, 2007: | | | | | | | | | | | | | | | | | | | | | | | | |
$ amount of revenue | | $ | 393,511 | | | $ | 244,407 | | | $ | 103,289 | | | $ | 225,853 | | | $ | 188,905 | | | $ | 144,227 | |
% of gross revenue | | | 30.3 | % | | | 18.8 | % | | | 7.9 | % | | | 17.4 | % | | | 14.5 | % | | | 11.1 | % |
| | • | | The significant increase in principal transactions on a linked quarter basis is primarily due to stronger fixed income institutional business as institutional customers invested heavily in municipal securities, mortgage-backed securities, and treasury securities during the 4th Quarter. |
| | • | | Trust fees and services revenue, as well as Regions MK Trust division revenue, decreased due to the drop in trust assets during the quarter. Also, 3Q08 trust income reflected higher fees from energy-related brokered transactions. |
| | • | | Non-interest expenses increased during 4Q08 driven by higher commissions, a result of higher brokerage revenues, compensation, and legal expenses |
| | • | | Fixed income capital markets revenues reflect increased purchases of safe-haven assets, including treasuries, by institutional investors |
FINANCIAL SUPPLEMENT TO
FOURTH QUARTER 2008 EARNINGS RELEASE
PAGE 14
Credit Quality (1)
Credit Quality
| | | | | | | | | | | | | | | | | | | | | | | | | | | | |
| | | As of and for Quarter Ended | | | YTD | |
($ in thousands) | | 12/31/08 | | | 9/30/08 | | | 6/30/08 | | | 3/31/08 | | | 12/31/07 | | | 12/31/08 | | | 12/31/07 | |
Allowance for credit losses (ACL) | | $ | 1,899,679 | | | $ | 1,546,363 | | | $ | 1,536,346 | | | $ | 1,432,271 | | | $ | 1,379,498 | | | $ | 1,899,679 | | | $ | 1,379,498 | |
Provision for loan losses from continuing operations | | $ | 1,150,000 | | | $ | 417,000 | | | $ | 309,000 | | | $ | 181,000 | | | $ | 358,000 | | | $ | 2,057,000 | | | $ | 555,000 | |
Provision for unfunded credit losses | | $ | (692 | ) | | $ | 9,401 | | | $ | 9,036 | | | $ | (2,469 | ) | | $ | 2,416 | | | $ | 15,276 | | | $ | 6,419 | |
Net loans charged-off:* | | | | | | | | | | | | | | | | | | | | | | | | | | | | |
Commercial and industrial | | $ | 74,734 | | | $ | 53,991 | | | $ | 28,171 | | | $ | 52,146 | | | $ | 37,048 | | | $ | 209,042 | | | $ | 73,353 | |
Residential first mortgage | | | 42,116 | | | | 18,368 | | | | 11,501 | | | | 9,462 | | | | 7,433 | | | | 81,447 | | | | 7,443 | |
Commercial real estate | | | 276,767 | | | | 59,277 | | | | 31,850 | | | | 11,035 | | | | 12,976 | | | | 378,929 | | | | 41,898 | |
Construction | | | 304,643 | | | | 198,676 | | | | 46,036 | | | | 13,138 | | | | 16,036 | | | | 562,493 | | | | 30,547 | |
Home equity lending | | | 69,228 | | | | 62,540 | | | | 73,406 | | | | 21,072 | | | | 11,513 | | | | 226,246 | | | | 40,674 | |
Indirect lending | | | 14,563 | | | | 10,173 | | | | 8,038 | | | | 8,381 | | | | 7,752 | | | | 41,155 | | | | 20,538 | |
Other consumer | | | 13,941 | | | | 13,359 | | | | 9,949 | | | | 10,524 | | | | 14,714 | | | | 47,773 | | | | 56,069 | |
| | | | | | | | | | | | | | | | | | | | | | | | | | | | |
Total | | $ | 795,992 | | | $ | 416,384 | | | $ | 208,951 | | | $ | 125,758 | | | $ | 107,472 | | | $ | 1,547,085 | | | $ | 270,522 | |
| | | | | | | | | | | | | | | | | | | | | | | | | | | | |
Net loan charge-offs as a % of average loans, annualized * | | | | | | | | | | | | | | | | | | | | | | | | | | | | |
Commercial and industrial | | | 1.23 | % | | | 0.94 | % | | | 0.51 | % | | | 0.99 | % | | | 0.64 | % | | | 0.92 | % | | | 0.33 | % |
Residential first mortgage | | | 1.05 | % | | | 0.45 | % | | | 0.28 | % | | | 0.23 | % | | | 0.18 | % | | | 0.50 | % | | | 0.12 | % |
Commercial real estate | | | 4.25 | % | | | 0.94 | % | | | 0.52 | % | | | 0.18 | % | | | 0.25 | % | | | 1.52 | % | | | 0.15 | % |
Construction | | | 10.46 | % | | | 6.56 | % | | | 1.52 | % | | | 0.43 | % | | | 0.47 | % | | | 4.67 | % | | | 0.22 | % |
Home equity lending | | | 1.72 | % | | | 1.59 | % | | | 1.94 | % | | | 0.57 | % | | | 0.31 | % | | | 1.46 | % | | | 0.27 | % |
Indirect lending | | | 1.43 | % | | | 0.96 | % | | | 0.80 | % | | | 0.85 | % | | | 0.77 | % | | | 1.01 | % | | | 0.51 | % |
Other consumer | | | 3.80 | % | | | 2.67 | % | | | 1.97 | % | | | 1.81 | % | | | 2.60 | % | | | 2.45 | % | | | 2.31 | % |
| | | | | | | | | | | | | | | | | | | | | | | | | | | | |
Total | | | 3.19 | % | | | 1.68 | % | | | 0.86 | % | | | 0.53 | % | | | 0.45 | % | | | 1.59 | % | | | 0.29 | % |
| | | | | | | | | | | | | | | | | | | | | | | | | | | | |
Non-performing assets (NPAs) | | $ | 1,717,986 | | | $ | 1,770,739 | | | $ | 1,629,449 | | | $ | 1,204,429 | | | $ | 864,054 | | | | | | | | | |
Non-performing assets held for sale | | | 423,255 | | | | 128,771 | | | | 8,615 | | | | — | | | | — | | | | | | | | | |
| | | | | | | | | | | | | | | | | | | | | | | | | | | | |
Non-performing assets, excluding loans held for sale | | $ | 1,294,731 | | | $ | 1,641,968 | | | $ | 1,620,834 | | | $ | 1,204,429 | | | $ | 864,054 | | | | | | | | | |
Foreclosed properties | | | 242,961 | | | | 201,345 | | | | 210,330 | | | | 180,228 | | | | 120,465 | | | | | | | | | |
| | | | | | | | | | | | | | | | | | | | | | | | | | | | |
Non-accrual loans* | | $ | 1,051,770 | | | $ | 1,440,623 | | | $ | 1,410,504 | | | $ | 1,024,201 | | | $ | 743,589 | | | | | | | | | |
| | | | | | | | | | | | | | | | | | | | | | | | | | | | |
Loans past due > 90 days* | | $ | 554,358 | | | $ | 457,090 | | | $ | 431,958 | | | $ | 467,375 | | | $ | 356,685 | | | | | | | | | |
Restructured loans not included in categories above | | $ | 454,731 | | | $ | 138,688 | | | $ | 101,559 | | | | — | | | | — | | | | | | | | | |
Credit Ratios: | | | | | | | | | | | | | | | | | | | | | | | | | | | | |
ACL/Loans, net | | | 1.95 | % | | | 1.57 | % | | | 1.56 | % | | | 1.49 | % | | | 1.45 | % | | | | | | | | |
ALL/Loans, net | | | 1.87 | % | | | 1.49 | % | | | 1.50 | % | | | 1.43 | % | | | 1.39 | % | | | | | | | | |
NPAs (ex. 90+ past due)/Loans and foreclosed properties | | | 1.76 | % | | | 1.79 | % | | | 1.65 | % | | | 1.25 | % | | | 0.90 | % | | | | | | | | |
NPAs (ex. 90+ past due)/Loans and foreclosed properties - excludes loans held for sale | | | 1.33 | % | | | 1.66 | % | | | 1.65 | % | | | 1.25 | % | | | 0.90 | % | | | | | | | | |
NPAs (inc. 90+ past due)/Loans and foreclosed properties | | | 2.33 | % | | | 2.25 | % | | | 2.09 | % | | | 1.73 | % | | | 1.28 | % | | | | | | | | |
NPAs (inc. 90+ past due)/Loans and foreclosed properties - excludes loans held for sale | | | 1.89 | % | | | 2.12 | % | | | 2.08 | % | | | 1.73 | % | | | 1.28 | % | | | | | | | | |
| * | See page 15 for loan portfolio (risk view) breakout |
Allowance for Credit Losses
| | | | | | | | |
| | | Year Ended December 31 | |
($ amounts in thousands) | | 2008 | | | 2007 | |
Balance at beginning of year | | $ | 1,379,498 | | | $ | 1,107,788 | |
Net loans charged-off | | | (1,547,085 | ) | | | (270,522 | ) |
Allowance allocated to sold loans | | | (5,010 | ) | | | (19,369 | ) |
Provision for loan losses, from continuing operations | | | 2,057,000 | | | | 555,000 | |
Provision for loan losses, from discontinued operations | | | — | | | | 182 | |
Provision for unfunded credit commitments | | | 15,276 | | | | 6,419 | |
| | | | | | | | |
Balance at end of period | | $ | 1,899,679 | | | $ | 1,379,498 | |
| | | | | | | | |
Components: | | | | | | | | |
Allowance for loan losses | | $ | 1,826,149 | | | $ | 1,321,244 | |
Reserve for unfunded credit commitments | | | 73,530 | | | | 58,254 | |
| | | | | | | | |
Allowance for credit losses | | $ | 1,899,679 | | | $ | 1,379,498 | |
| | | | | | | | |
| (1) | Certain amounts in prior periods have been reclassified to reflect current period presentation |
FINANCIAL SUPPLEMENT TO
FOURTH QUARTER 2008 EARNINGS RELEASE
PAGE 15
Loan Portfolio - Risk View
Total Loan Portfolio and Net Charge-offs
| | | | | | | | | | | | | | | | | | | | | | | | | | | | | | |
| | | Ending Balance | | % of Total Loans | |
($ in thousands) | | 4Q08 | | 3Q08 | | 2Q08 | | 1Q08 | | 4Q07 | | 4Q08 | | | 3Q08 | | | 2Q08 | | | 1Q08 | | | 4Q07 | |
Commercial | | | | | | | | | | | | | | | | | | | | | | | | | | | | | | |
Commercial and Industrial/Leases | | $ | 19,580,287 | | $ | 19,221,577 | | $ | 18,952,630 | | $ | 17,463,045 | | $ | 16,533,176 | | 20 | % | | 19 | % | | 19 | % | | 18 | % | | 17 | % |
Commercial Real Estate - Owner-Occupied Mortgages | | | 4,780,136 | | | 4,646,456 | | | 4,611,848 | | | 4,690,719 | | | 4,528,875 | | 5 | % | | 5 | % | | 5 | % | | 5 | % | | 5 | % |
| | | | | | | | | | | | | | | | | | | | | | | | | | | | | | |
Total Commercial | | | 24,360,423 | | | 23,868,033 | | | 23,564,478 | | | 22,153,764 | | | 21,062,051 | | 25 | % | | 24 | % | | 24 | % | | 23 | % | | 22 | % |
Commercial Real Estate (1) | | | | | | | | | | | | | | | | | | | | | | | | | | | | | | |
CRE - Non-Owner-Occupied Mortgages | | | 10,732,193 | | | 10,306,214 | | | 9,779,868 | | | 9,607,134 | | | 8,201,155 | | 11 | % | | 11 | % | | 9 | % | | 10 | % | | 8 | % |
Non-Owner Occupied Construction | | | 8,623,809 | | | 9,325,158 | | | 8,886,995 | | | n/a | | | n/a | | 9 | % | | 10 | % | | 10 | % | | n/a | | | n/a | |
Owner Occupied Construction | | | 1,235,391 | | | 1,352,603 | | | 1,971,803 | | | n/a | | | n/a | | 1 | % | | 1 | % | | 2 | % | | n/a | | | n/a | |
| | | | | | | | | | | | | | | | | | | | | | | | | | | | | | |
Construction | | | 9,859,200 | | | 10,677,761 | | | 10,858,798 | | | 10,784,692 | | | 11,985,886 | | 10 | % | | 11 | % | | 11 | % | | 11 | % | | 14 | % |
| | | | | | | | | | | | | | | | | | | | | | | | | | | | | | |
Total Commercial Real Estate | | | 20,591,393 | | | 20,983,975 | | | 20,638,666 | | | 20,391,826 | | | 20,187,041 | | 21 | % | | 22 | % | | 21 | % | | 21 | % | | 22 | % |
Business and Community Banking (1) | | | | | | | | | | | | | | | | | | | | | | | | | | | | | | |
Commercial and Industrial | | | 4,015,130 | | | 4,289,646 | | | 4,289,088 | | | n/a | | | n/a | | 4 | % | | 4 | % | | 4 | % | | n/a | | | n/a | |
Commercial Real Estate - Owner-Occupied Mortgages | | | 6,941,711 | | | 6,922,625 | | | 6,665,011 | | | n/a | | | n/a | | 7 | % | | 7 | % | | 7 | % | | n/a | | | n/a | |
CRE - Non-Owner-Occupied Mortgages | | | 3,754,284 | | | 3,844,764 | | | 3,862,672 | | | n/a | | | n/a | | 4 | % | | 4 | % | | 4 | % | | n/a | | | n/a | |
Non-Owner Occupied Construction | | | 405,016 | | | 485,306 | | | 591,184 | | | n/a | | | n/a | | 0 | % | | 0 | % | | 0 | % | | n/a | | | n/a | |
Owner Occupied Construction | | | 369,830 | | | 457,072 | | | 551,417 | | | n/a | | | n/a | | 0 | % | | 0 | % | | 0 | % | | n/a | | | n/a | |
| | | | | | | | | | | | | | | | | | | | | | | | | | | | | | |
Construction | | | 774,847 | | | 942,378 | | | 1,142,601 | | | n/a | | | n/a | | 1 | % | | 1 | % | | 1 | % | | n/a | | | n/a | |
| | | | | | | | | | | | | | | | | | | | | | | | | | | | | | |
Total Business and Community Banking | | | 15,485,973 | | | 15,999,412 | | | 15,959,372 | | | 16,030,169 | | | 16,211,732 | | 16 | % | | 16 | % | | 16 | % | | 17 | % | | 16 | % |
Residential First Mortgage | | | | | | | | | | | | | | | | | | | | | | | | | | | | | | |
Alt-A | | | 2,549,468 | | | 2,615,498 | | | 2,660,288 | | | 2,743,467 | | | 2,830,062 | | 2 | % | | 2 | % | | 3 | % | | 3 | % | | 3 | % |
Residential First Mortgage | | | 13,289,547 | | | 13,575,213 | | | 13,803,811 | | | 14,019,883 | | | 14,129,484 | | 14 | % | | 14 | % | | 14 | % | | 14 | % | | 15 | % |
| | | | | | | | | | | | | | | | | | | | | | | | | | | | | | |
Total Residential First Mortgage | | | 15,839,015 | | | 16,190,711 | | | 16,464,099 | | | 16,763,350 | | | 16,959,546 | | 16 | % | | 16 | % | | 17 | % | | 17 | % | | 18 | % |
Consumer | | | | | | | | | | | | | | | | | | | | | | | | | | | | | | |
Home Equity Lending | | | 16,130,255 | | | 15,848,995 | | | 15,446,740 | | | 15,034,850 | | | 14,962,007 | | 17 | % | | 16 | % | | 16 | % | | 16 | % | | 16 | % |
Indirect Lending | | | 3,853,770 | | | 4,211,078 | | | 4,145,457 | | | 3,961,782 | | | 3,938,113 | | 4 | % | | 4 | % | | 4 | % | | 4 | % | | 4 | % |
Direct Lending | | | 826,279 | | | 872,924 | | | 927,865 | | | 974,684 | | | 1,066,184 | | 1 | % | | 1 | % | | 1 | % | | 1 | % | | 1 | % |
Other Consumer | | | 331,576 | | | 736,681 | | | 1,119,902 | | | 1,075,006 | | | 992,175 | | 0 | % | | 1 | % | | 1 | % | | 1 | % | | 1 | % |
| | | | | | | | | | | | | | | | | | | | | | | | | | | | | | |
Total Other Consumer | | | 21,141,880 | | | 21,669,678 | | | 21,639,964 | | | 21,046,322 | | | 20,958,479 | | 22 | % | | 22 | % | | 22 | % | | 22 | % | | 22 | % |
| | | | | | | | | | | | | | | | | | | | | | | | | | | | | | |
Total Loans | | $ | 97,418,685 | | $ | 98,711,810 | | $ | 98,266,579 | | $ | 96,385,431 | | $ | 95,378,847 | | 100 | % | | 100 | % | | 100 | % | | 100 | % | | 100 | % |
| | | | | | | | | | | | | | | | | | | | | | | | | | | | | | |
| | |
| | | Net Charge-offs (2) | | % of Loans* (2) | |
($ in thousands) | | 4Q08 | | 3Q08 | | 2Q08 | | 1Q08 | | 4Q07 | | 4Q08 | | | 3Q08 | | | 2Q08 | | | 1Q08 | | | 4Q07 | |
Commercial | | | | | | | | | | | | | | | | | | | | | | | | | | | | | | |
Commercial and Industrial/Leases | | $ | 42,954 | | $ | 28,316 | | $ | 7,374 | | $ | 27,828 | | $ | 24,784 | | 0.86 | % | | 0.61 | % | | 0.16 | % | | 0.67 | % | | 0.49 | % |
Commercial Real Estate - Owner-Occupied Mortgages | | | 25,844 | | | 7,918 | | | 7,866 | | | 4,433 | | | 2,643 | | 2.21 | % | | 0.72 | % | | 0.70 | % | | 0.40 | % | | 0.13 | % |
| | | | | | | | | | | | | | | | | | | | | | | | | | | | | | |
Total Commercial | | | 68,798 | | | 36,234 | | | 15,240 | | | 32,261 | | | 27,427 | | 1.11 | % | | 0.63 | % | | 0.27 | % | | 0.61 | % | | 0.39 | % |
Commercial Real Estate (1) | | | | | | | | | | | | | | | | | | | | | | | | | | | | | | |
CRE - Non-Owner-Occupied Mortgages | | | 241,363 | | | 48,920 | | | 22,320 | | | 5,247 | | | 9,903 | | 9.14 | % | | 2.11 | % | | 0.99 | % | | 0.24 | % | | 0.73 | % |
Non-Owner Occupied Construction | | | 299,827 | | | 188,898 | | | n/a | | | n/a | | | n/a | | 12.77 | % | | 7.52 | % | | n/a | | | n/a | | | n/a | |
Owner Occupied Construction | | | 3,663 | | | 4,990 | | | n/a | | | n/a | | | n/a | | 1.08 | % | | 1.06 | % | | n/a | | | n/a | | | n/a | |
| | | | | | | | | | | | | | | | | | | | | | | | | | | | | | |
Construction | | | 303,490 | | | 193,888 | | | 44,929 | | | 12,666 | | | 16,111 | | 11.30 | % | | 6.50 | % | | 1.55 | % | | 0.44 | % | | 0.48 | % |
| | | | | | | | | | | | | | | | | | | | | | | | | | | | | | |
Total Commercial Real Estate | | | 544,853 | | | 242,807 | | | 67,249 | | | 17,913 | | | 26,014 | | 10.23 | % | | 4.58 | % | | 1.31 | % | | 0.35 | % | | 0.55 | % |
Business and Community Banking (1) | | | | | | | | | | | | | | | | | | | | | | | | | | | | | | |
Commercial and Industrial | | | 29,607 | | | 22,957 | | | 18,977 | | | n/a | | | n/a | | 2.84 | % | | 2.12 | % | | 1.78 | % | | n/a | | | n/a | |
Commercial Real Estate - Owner-Occupied Mortgages | | | 6,182 | | | 1,052 | | | 1,083 | | | n/a | | | n/a | | 0.36 | % | | 0.06 | % | | 0.07 | % | | n/a | | | n/a | |
CRE - Non-Owner-Occupied Mortgages | | | 3,378 | | | 1,389 | | | 580 | | | n/a | | | n/a | | 0.35 | % | | 0.15 | % | | 0.06 | % | | n/a | | | n/a | |
Non-Owner Occupied Construction | | | 773 | | | 4,605 | | | n/a | | | n/a | | | n/a | | 0.67 | % | | 2.76 | % | | n/a | | | n/a | | | n/a | |
Owner Occupied Construction | | | 380 | | | 183 | | | n/a | | | n/a | | | n/a | | 0.34 | % | | 0.10 | % | | n/a | | | n/a | | | n/a | |
| | | | | | | | | | | | | | | | | | | | | | | | | | | | | | |
Construction | | | 1,153 | | | 4,788 | | | 1,108 | | | n/a | | | n/a | | 0.51 | % | | 1.38 | % | | 0.30 | % | | n/a | | | n/a | |
| | | | | | | | | | | | | | | | | | | | | | | | | | | | | | |
Total Business and Community Banking | | | 40,320 | | | 30,186 | | | 21,748 | | | 23,568 | | | 10,313 | | 1.02 | % | | 0.75 | % | | 0.55 | % | | 0.59 | % | | 0.39 | % |
Residential First Mortgage | | | | | | | | | | | | | | | | | | | | | | | | | | | | | | |
Alt-A | | | 6,583 | | | 3,968 | | | 2,978 | | | 2,106 | | | 1,822 | | 1.03 | % | | 0.60 | % | | 0.45 | % | | 0.31 | % | | 0.26 | % |
Residential First Mortgage | | | 35,533 | | | 14,400 | | | 8,523 | | | 7,356 | | | 5,611 | | 1.05 | % | | 0.42 | % | | 0.25 | % | | 0.21 | % | | 0.16 | % |
| | | | | | | | | | | | | | | | | | | | | | | | | | | | | | |
Total Residential First Mortgage | | | 42,116 | | | 18,368 | | | 11,501 | | | 9,462 | | | 7,433 | | 1.05 | % | | 0.45 | % | | 0.28 | % | | 0.23 | % | | 0.18 | % |
Consumer | | | | | | | | | | | | | | | | | | | | | | | | | | | | | | |
Home Equity Lending | | | 69,228 | | | 62,540 | | | 73,406 | | | 21,072 | | | 11,513 | | 1.72 | % | | 1.59 | % | | 1.94 | % | | 0.57 | % | | 0.31 | % |
Indirect Lending | | | 14,563 | | | 10,173 | | | 8,037 | | | 8,381 | | | 7,752 | | 1.43 | % | | 0.96 | % | | 0.80 | % | | 0.85 | % | | 0.77 | % |
Direct Lending | | | 3,411 | | | 2,996 | | | 2,641 | | | 2,361 | | | 2,911 | | 1.61 | % | | 1.33 | % | | 1.11 | % | | 0.94 | % | | 1.09 | % |
Other Consumer | | | 12,703 | | | 13,080 | | | 9,129 | | | 10,740 | | | 14,109 | | 8.24 | % | | 4.76 | % | | 3.41 | % | | 3.74 | % | | 5.21 | % |
| | | | | | | | | | | | | | | | | | | | | | | | | | | | | | |
Total Other Consumer | | | 99,905 | | | 88,789 | | | 93,213 | | | 42,554 | | | 36,285 | | 1.85 | % | | 1.62 | % | | 1.76 | % | | 0.81 | % | | 0.69 | % |
| | | | | | | | | | | | | | | | | | | | | | | | | | | | | | |
Total Loans | | $ | 795,992 | | $ | 416,384 | | $ | 208,951 | | $ | 125,758 | | $ | 107,472 | | 3.19 | % | | 1.68 | % | | 0.86 | % | | 0.53 | % | | 0.45 | % |
| | | | | | | | | | | | | | | | | | | | | | | | | | | | | | |
90+ Days Past Due Loans and Non-accrual Loans
| | | | | | | | | | | | | | | | | | | | | | | | | | | | | | |
| | | 90+ Past Due (2) | | % of Loans* (2) | |
($ in thousands) | | 4Q08 | | 3Q08 | | 2Q08 | | 1Q08 | | 4Q07 | | 4Q08 | | | 3Q08 | | | 2Q08 | | | 1Q08 | | | 4Q07 | |
Commercial | | | | | | | | | | | | | | | | | | | | | | | | | | | | | | |
Commercial and Industrial/Leases | | $ | 2,171 | | $ | 1,907 | | $ | 3,977 | | $ | 28,405 | | $ | 5,984 | | 0.01 | % | | 0.01 | % | | 0.02 | % | | 0.16 | % | | 0.04 | % |
Commercial Real Estate - Owner-Occupied | | | 6,637 | | | 317 | | | 1,635 | | | 2,475 | | | 1,112 | | 0.14 | % | | 0.01 | % | | 0.04 | % | | 0.05 | % | | 0.02 | % |
| | | | | | | | | | | | | | | | | | | | | | | | | | | | | | |
Total Commercial | | | 8,808 | | | 2,224 | | | 5,612 | | | 30,880 | | | 7,096 | | 0.04 | % | | 0.01 | % | | 0.02 | % | | 0.14 | % | | 0.03 | % |
Commercial Real Estate (1) | | | | | | | | | | | | | | | | | | | | | | | | | | | | | | |
CRE - Non-Owner-
Occupied Mortgages | | | 7,237 | | | 7,662 | | | 3,786 | | | 17,732 | | | 7,625 | | 0.07 | % | | 0.07 | % | | 0.04 | % | | 0.18 | % | | 0.09 | % |
Non-Owner
Occupied
Construction | | | 10,889 | | | 357 | | | 14,712 | | | n/a | | | n/a | | 0.13 | % | | 0.00 | % | | 0.17 | % | | n/a | | | n/a | |
Owner
Occupied
Construction | | | 2,371 | | | 4,310 | | | 2,662 | | | n/a | | | n/a | | 0.19 | % | | 0.32 | % | | 0.14 | % | | n/a | | | n/a | |
| | | | | | | | | | | | | | | | | | | | | | | | | | | | | | |
Construction | | | 13,260 | | | 4,667 | | | 17,374 | | | 10,782 | | | 18,535 | | 0.13 | % | | 0.04 | % | | 0.16 | % | | 0.10 | % | | 0.15 | % |
| | | | | | | | | | | | | | | | | | | | | | | | | | | | | | |
Total Commercial Real Estate | | | 20,497 | | | 12,329 | | | 21,160 | | | 28,514 | | | 26,160 | | 0.10 | % | | 0.06 | % | | 0.10 | % | | 0.14 | % | | 0.13 | % |
Business and Community Banking (1) | | | | | | | | | | | | | | | | | | | | | | | | | | | | | | |
Commercial and Industrial | | | 11,895 | | | 8,422 | | | 6,551 | | | n/a | | | n/a | | 0.30 | % | | 0.20 | % | | 0.15 | % | | n/a | | | n/a | |
Commercial Real Estate - Owner-Occupied Mortgages | | | 6,103 | | | 4,969 | | | 5,721 | | | n/a | | | n/a | | 0.09 | % | | 0.07 | % | | 0.09 | % | | n/a | | | n/a | |
CRE - Non-Owner-Occupied Mortgages | | | 4,688 | | | 2,469 | | | 4,698 | | | n/a | | | n/a | | 0.12 | % | | 0.06 | % | | 0.12 | % | | n/a | | | n/a | |
Non-Owner Occupied Construction | | | 860 | | | 674 | | | 58 | | | n/a | | | n/a | | 0.21 | % | | 0.14 | % | | 0.01 | % | | n/a | | | n/a | |
Owner Occupied Construction | | | 296 | | | 3,104 | | | 410 | | | n/a | | | n/a | | 0.08 | % | | 0.68 | % | | 0.07 | % | | n/a | | | n/a | |
| | | | | | | | | | | | | | | | | | | | | | | | | | | | | | |
Construction | | | 1,156 | | | 3,778 | | | 468 | | | n/a | | | n/a | | 0.15 | % | | 0.40 | % | | 0.04 | % | | n/a | | | n/a | |
| | | | | | | | | | | | | | | | | | | | | | | | | | | | | | |
Total Business and Community Banking | | | 23,842 | | | 19,638 | | | 17,438 | | | 19,960 | | | 10,638 | | 0.15 | % | | 0.12 | % | | 0.11 | % | | 0.12 | % | | 0.07 | % |
Residential First Mortgage | | | | | | | | | | | | | | | | | | | | | | | | | | | | | | |
Alt-A | | | 108,785 | | | 95,966 | | | 79,658 | | | 67,275 | | | 41,125 | | 4.27 | % | | 3.67 | % | | 2.99 | % | | 2.45 | % | | 1.45 | % |
Residential First Mortgage | | | 163,191 | | | 144,285 | | | 130,794 | | | 118,654 | | | 113,281 | | 1.23 | % | | 1.06 | % | | 0.95 | % | | 0.85 | % | | 0.80 | % |
| | | | | | | | | | | | | | | | | | | | | | | | | | | | | | |
Total Residential First Mortgage | | | 271,976 | | | 240,251 | | | 210,452 | | | 185,929 | | | 154,406 | | 1.72 | % | | 1.48 | % | | 1.28 | % | | 1.11 | % | | 0.91 | % |
Consumer | | | | | | | | | | | | | | | | | | | | | | | | | | | | | | |
Home Equity Lending | | | 214,437 | | | 172,894 | | | 166,816 | | | 192,836 | | | 146,808 | | 1.33 | % | | 1.09 | % | | 1.08 | % | | 1.28 | % | | 0.98 | % |
Indirect Lending | | | 7,854 | | | 4,228 | | | 4,581 | | | 4,233 | | | 6,002 | | 0.20 | % | | 0.10 | % | | 0.11 | % | | 0.11 | % | | 0.15 | % |
Direct Lending | | | 2,786 | | | 2,672 | | | 2,507 | | | 2,971 | | | 2,997 | | 0.34 | % | | 0.31 | % | | 0.27 | % | | 0.30 | % | | 0.28 | % |
Other Consumer | | | 4,158 | | | 2,854 | | | 3,392 | | | 2,052 | | | 2,578 | | 1.25 | % | | 0.39 | % | | 0.30 | % | | 0.19 | % | | 0.26 | % |
| | | | | | | | | | | | | | | | | | | | | | | | | | | | | | |
Total Other Consumer | | | 229,235 | | | 182,648 | | | 177,296 | | | 202,092 | | | 158,385 | | 1.08 | % | | 0.84 | % | | 0.82 | % | | 0.96 | % | | 0.76 | % |
| | | | | | | | | | | | | | | | | | | | | | | | | | | | | | |
Total Loans | | $ | 554,358 | | $ | 457,090 | | $ | 431,958 | | $ | 467,375 | | $ | 356,685 | | 0.57 | % | | 0.46 | % | | 0.44 | % | | 0.48 | % | | 0.37 | % |
| | | | | | | | | | | | | | | | | | | | | | | | | | | | | | |
| | |
| | | Non-accrual loans (excludes held for sale) (2) | | % of Loans* (2) | |
($ in thousands) | | 4Q08 | | 3Q08 | | 2Q08 | | 1Q08 | | 4Q07 | | 4Q08 | | | 3Q08 | | | 2Q08 | | | 1Q08 | | | 4Q07 | |
Commercial | | | | | | | | | | | | | | | | | | | | | | | | | | | | | | |
Commercial and Industrial/Leases | | $ | 118,120 | | $ | 161,815 | | $ | 132,480 | | $ | 89,412 | | $ | 55,355 | | 0.60 | % | | 0.84 | % | | 0.70 | % | | 0.51 | % | | 0.33 | % |
Commercial Real Estate - Owner-Occupied | | | 131,072 | | | 148,597 | | | 138,044 | | | 110,579 | | | 105,494 | | 2.74 | % | | 3.20 | % | | 2.99 | % | | 2.36 | % | | 2.33 | % |
| | | | | | | | | | | | | | | | | | | | | | | | | | | | | | |
Total Commercial | | | 249,192 | | | 310,412 | | | 270,524 | | | 199,991 | | | 160,849 | | 1.02 | % | | 1.30 | % | | 1.15 | % | | 0.90 | % | | 0.76 | % |
Commercial Real Estate (1) | | | | | | | | | | | | | | | | | | | | | | | | | | | | | | |
CRE - Non-Owner-
Occupied Mortgages | | | 260,601 | | | 352,503 | | | 274,664 | | | 207,907 | | | 148,539 | | 2.43 | % | | 3.42 | % | | 2.81 | % | | 2.16 | % | | 1.81 | % |
Non-Owner
Occupied
Construction | | | 268,833 | | | 518,256 | | | 640,303 | | | n/a | | | n/a | | 3.12 | % | | 5.56 | % | | 7.20 | % | | n/a | | | n/a | |
Owner
Occupied
Construction | | | 23,395 | | | 27,407 | | | 28,626 | | | n/a | | | n/a | | 1.89 | % | | 2.03 | % | | 1.45 | % | | n/a | | | n/a | |
| | | | | | | | | | | | | | | | | | | | | | | | | | | | | | |
Construction | | | 292,228 | | | 545,663 | | | 668,929 | | | 446,861 | | | 304,941 | | 2.96 | % | | 5.11 | % | | 6.16 | % | | 4.14 | % | | 2.54 | % |
| | | | | | | | | | | | | | | | | | | | | | | | | | | | | | |
Total Commercial Real Estate | | | 552,829 | | | 898,166 | | | 943,593 | | | 654,768 | | | 453,480 | | 2.68 | % | | 4.28 | % | | 4.57 | % | | 3.21 | % | | 2.25 | % |
Business and Community Banking (1) | | | | | | | | | | | | | | | | | | | | | | | | | | | | | | |
Commercial and Industrial | | | 57,352 | | | 52,994 | | | 48,908 | | | n/a | | | n/a | | 1.43 | % | | 1.24 | % | | 1.14 | % | | n/a | | | n/a | |
Commercial Real Estate - Owner-Occupied Mortgages | | | 65,741 | | | 47,698 | | | 37,672 | | | n/a | | | n/a | | 0.95 | % | | 0.69 | % | | 0.57 | % | | n/a | | | n/a | |
CRE - Non-Owner-Occupied Mortgages | | | 30,996 | | | 25,478 | | | 18,459 | | | n/a | | | n/a | | 0.83 | % | | 0.66 | % | | 0.48 | % | | n/a | | | n/a | |
Non-Owner Occupied Construction | | | 3,903 | | | 4,237 | | | 2,960 | | | n/a | | | n/a | | 0.96 | % | | 0.87 | % | | 0.50 | % | | n/a | | | n/a | |
Owner Occupied Construction | | | 2,473 | | | 4,877 | | | 4,193 | | | n/a | | | n/a | | 0.67 | % | | 1.07 | % | | 0.76 | % | | n/a | | | n/a | |
| | | | | | | | | | | | | | | | | | | | | | | | | | | | | | |
Construction | | | 6,376 | | | 9,114 | | | 7,153 | | | n/a | | | n/a | | 0.82 | % | | 0.97 | % | | 0.63 | % | | n/a | | | n/a | |
| | | | | | | | | | | | | | | | | | | | | | | | | | | | | | |
Total Business and Community Banking | | | 160,465 | | | 135,284 | | | 112,192 | | | 100,991 | | | 75,930 | | 1.04 | % | | 0.85 | % | | 0.70 | % | | 0.63 | % | | 0.47 | % |
Residential First Mortgage | | | | | | | | | | | | | | | | | | | | | | | | | | | | | | |
Alt-A | | | 30,590 | | | 24,285 | | | 20,259 | | | 14,271 | | | 8,534 | | 1.20 | % | | 0.93 | % | | 0.76 | % | | 0.52 | % | | 0.30 | % |
Residential First Mortgage | | | 55,289 | | | 70,116 | | | 50,285 | | | 41,750 | | | 38,177 | | 0.42 | % | | 0.52 | % | | 0.36 | % | | 0.30 | % | | 0.27 | % |
| | | | | | | | | | | | | | | | | | | | | | | | | | | | | | |
Total Residential First Mortgage | | | 85,880 | | | 94,401 | | | 70,544 | | | 56,021 | | | 46,711 | | 0.54 | % | | 0.58 | % | | 0.43 | % | | 0.33 | % | | 0.28 | % |
Consumer | | | | | | | | | | | | | | | | | | | | | | | | | | | | | | |
Home Equity Lending | | | 3,238 | | | 2,226 | | | 13,335 | | | 12,428 | | | 6,611 | | 0.02 | % | | 0.01 | % | | 0.09 | % | | 0.08 | % | | 0.04 | % |
Indirect Lending | | | 1 | | | 15 | | | — | | | 1 | | | 8 | | 0.00 | % | | 0.00 | % | | 0.00 | % | | 0.00 | % | | 0.00 | % |
Direct Lending | | | 1 | | | 30 | | | 315 | | | 1 | | | — | | 0.00 | % | | 0.00 | % | | 0.03 | % | | 0.00 | % | | 0.00 | % |
Other Consumer | | | 164 | | | 89 | | | 1 | | | — | | | — | | 0.05 | % | | 0.01 | % | | 0.00 | % | | 0.00 | % | | 0.00 | % |
| | | | | | | | | | | | | | | | | | | | | | | | | | | | | | |
Total Other Consumer | | | 3,404 | | | 2,360 | | | 13,651 | | | 12,430 | | | 6,619 | | 0.02 | % | | 0.01 | % | | 0.06 | % | | 0.06 | % | | 0.03 | % |
| | | | | | | | | | | | | | | | | | | | | | | | | | | | | | |
Total Loans | | $ | 1,051,770 | | $ | 1,440,623 | | $ | 1,410,504 | | $ | 1,024,201 | | $ | 743,589 | | 1.08 | % | | 1.46 | % | | 1.44 | % | | 1.06 | % | | 0.78 | % |
| | | | | | | | | | | | | | | | | | | | | | | | | | | | | | |
| * | Percentage of related loan category outstandings |
Note: 1Q08 loan classifications reflect an approximate $722 million reclassification of balances from real estate-construction to real estate-mortgage, effective 1/1/08 (note that past due, non-accrual and net charge-offs also impacted by reclass)
| (1) | Breakout for certain prior periods is not available |
| (2) | Information prior to 4Q08 does not reflect reclassifications between various Commercial Real Estate and Business and Community Banking categories |
FINANCIAL SUPPLEMENT TO
FOURTH QUARTER 2008 EARNINGS RELEASE
PAGE 16
Loan Portfolio Charge-off View(for the quarter ended 12/31/08)
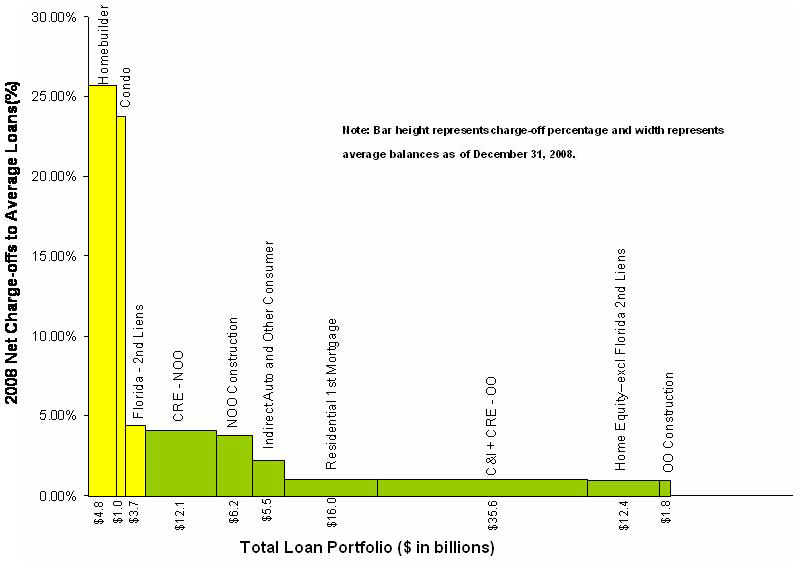
FINANCIAL SUPPLEMENT TO
FOURTH QUARTER 2008 EARNINGS RELEASE
PAGE 17

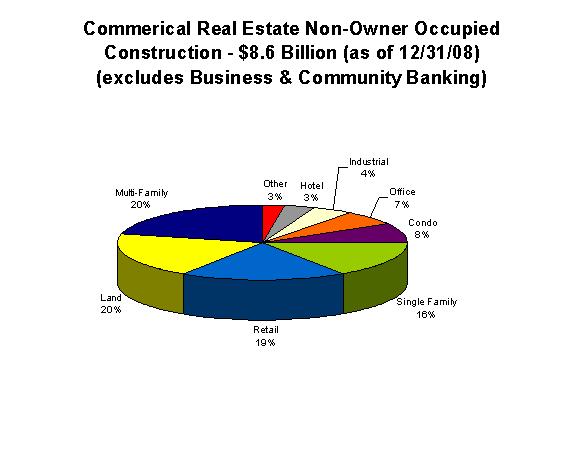
| | • | | Portfolio well-diversified by product type |
| | • | | Includes $4.1 billion in Business and Community Banking Non-Owner Occupied Commercial Real Estate Loans which have different risk characteristics. They are underwritten not on a project basis but on the strength of the individual. |
| | • | | Proactively reducing certain concentrations |
| | • | | Land balances down $2.7 billion (43%) since December 2006 |
| | • | | Condominium balances down $1.3 billion (58%) since December 2006 |
FINANCIAL SUPPLEMENT TO
FOURTH QUARTER 2008 EARNINGS RELEASE
PAGE 18
Residential Homebuilder Portfolio - $4.4 billion(as of 12/31/08) (1)
Portfolio Breakout by Category
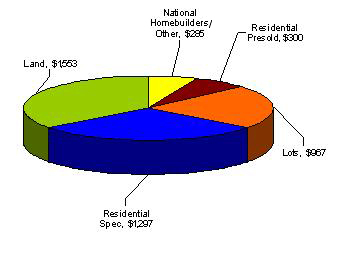
Product Breakout
| | | | | | | | | | | | | | | | | | | | | | | | | | | | | | |
| | | Lots | | | Residential Presold | | | Residential Spec | | | Land | | | National
Homebuilders/Other | | | Total Portfolio | |
($ in thousands) | | $ | | %* | | | $ | | %* | | | $ | | %* | | | $ | | %* | | | $ | | %* | | | $ | | %* | |
Ending Outstandings | | 966,771 | | | | | 300,181 | | | | | 1,296,540 | | | | | 1,553,255 | | | | | 285,521 | | | | | 4,402,268 | | | |
Current Quarter Charge-offs | | 76,921 | | 29.17 | % | | 36,476 | | 38.00 | % | | 72,473 | | 20.42 | % | | 110,766 | | 25.79 | % | | 15,356 | | 21.78 | % | | 311,992 | | 25.69 | % |
90+ Past Due | | 4,077 | | 0.42 | % | | 367 | | 0.12 | % | | 7,446 | | 0.57 | % | | 5,500 | | 0.35 | % | | — | | — | | | 17,390 | | 0.40 | % |
Non-Accruing Loans | | 57,937 | | 5.99 | % | | 11,199 | | 3.73 | % | | 110,365 | | 8.51 | % | | 89,241 | | 5.75 | % | | 27,486 | | 9.63 | % | | 296,228 | | 6.73 | % |
Average Note Size: | | | | | | | | | | | | | | | | | | | | | | | | | | | | | | |
Total Portfolio | | 235 | | — | | | 356 | | — | | | 269 | | — | | | 727 | | — | | | 1,231 | | — | | | 362 | | — | |
Central | | 216 | | — | | | 180 | | — | | | 203 | | — | | | 736 | | — | | | 407 | | — | | | 291 | | — | |
Florida | | 506 | | — | | | 1,197 | | — | | | 623 | | — | | | 1,850 | | — | | | 1,526 | | — | | | 910 | | — | |
| * | Percentage of related product outstandings; charge-offs shown as annualized, and calculated on an average outstandings balance |
| | • | | Average note size of the homebuilder portfolio is $362,000 |
| | • | | Non-accruing loans represent 6.7 percent of the total homebuilder portfolio with the highest concentrations in the Florida and Central (mainly Atlanta) regions |
| | • | | $4.4 billion residential homebuilder portfolio is a subset of the Commercial Real Estate portfolio (p. 17) with the majority of the residential homebuilder portfolio found in land and single family sectors |
| (1) | Excludes loans held for sale |
Geographic Breakout

1 | Central consists of Alabama, Georgia, and South Carolina |
2 | Midsouth consists of North Carolina, Virginia and Tennessee |
3 | Midwest consists of Arkansas, Illinois, Indiana, Iowa, Kentucky, Missouri, and Texas |
4 | Southwest consists of Louisiana and Mississippi |
FINANCIAL SUPPLEMENT TO
FOURTH QUARTER 2008 EARNINGS RELEASE
PAGE 19
Consumer Real Estate - $32 billion (as of 12/31/08)
| | | | | | | | | | | | | | |
| | | Outstandings* | | Wgtd Avg.
LTV | | | Wgtd Avg.
FICO | | Avg. Loan
Size | | % in 1st Lien | |
Home Equity Lending | | $ | 16,130,255 | | 74 | % | | 737 | | $ | 74,296 | | 42 | % |
Residential 1st Mortgage | | | 13,289,548 | | 66 | % | | 726 | | | 176,202 | | 99 | % |
Alt-A | | | 2,549,468 | | 71 | % | | 704 | | | 179,654 | | 100 | % |
| | | | | | | | | | | | | | |
Total Consumer RE Portfolio | | $ | 31,969,271 | | 71 | % | | 729 | | $ | 120,292 | | 71 | % |
| | | | | | | | | | | | | | |
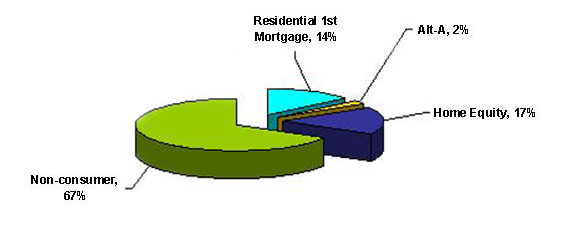
Note: Pie chart represents entire loan portfolio
FINANCIAL SUPPLEMENT TO
FOURTH QUARTER 2008 EARNINGS RELEASE
PAGE 20
Home Equity Lending Net Charge-off Analysis
| | | | | | | | | | | | | | | | | | | | | | | | | | | | | | | | | | | | | | | | | | | | | | | | | | | | | | | | | | | | | | |
| | | | | 4Q08 | | | 3Q08 | | | 2Q08 | | | 1Q08 | | | 4Q07 | |
($ in millions) | | | | 1st Lien | | | 2nd Lien | | | Total | | | 1st Lien | | | 2nd Lien | | | Total | | | 1st Lien | | | 2nd Lien | | | Total | | | 1st Lien | | | 2nd Lien | | | Total | | | 1st Lien | | | 2nd Lien | | | Total | |
| Florida | | Net Charge-off %* | | | 1.71 | % | | | 4.37 | % | | | 3.40 | % | | | 1.48 | % | | | 4.28 | % | | | 3.28 | % | | | 1.37 | % | | | 4.74 | % | | | 3.55 | % | | | 0.67 | % | | | 1.07 | % | | | 0.94 | % | | | 0.40 | % | | | 0.23 | % | | | 0.29 | % |
| | $ Losses | | $ | 8.9 | | | $ | 39.9 | | | $ | 48.8 | | | $ | 7.2 | | | $ | 37.8 | | | $ | 45.0 | | | $ | 6.3 | | | $ | 40.2 | | | $ | 46.5 | | | $ | 2.8 | | | $ | 8.9 | | | $ | 11.7 | | | $ | 1.9 | | | $ | 2.1 | | | $ | 4.0 | |
| | Balance | | $ | 2,121.6 | | | $ | 3,662.9 | | | $ | 5,784.5 | | | $ | 1,994.6 | | | $ | 3,578.8 | | | $ | 5,573.4 | | | $ | 1,922.2 | | | $ | 3,448.0 | | | $ | 5,370.2 | | | $ | 1,713.2 | | | $ | 3,396.2 | | | $ | 5,109.4 | | | $ | 1,674.4 | | | $ | 3,285.3 | | | $ | 4,959.7 | |
| | Original LTV | | | 65.8 | % | | | 76.5 | % | | | 72.6 | % | | | | | | | | | | | | | | | | | | | | | | | | | | | | | | | | | | | | | | | | | | | | | | | | |
| All Other States | | Net Charge-off %* | | | 0.52 | % | | | 1.00 | % | | | 0.79 | % | | | 0.39 | % | | | 0.93 | % | | | 0.69 | % | | | 0.60 | % | | | 1.47 | % | | | 1.08 | % | | | 0.25 | % | | | 0.48 | % | | | 0.38 | % | | | 0.28 | % | | | 0.36 | % | | | 0.33 | % |
| | $ Losses | | $ | 6.0 | | | $ | 14.4 | | | $ | 20.4 | | | $ | 4.4 | | | $ | 13.1 | | | $ | 17.5 | | | $ | 6.7 | | | $ | 20.2 | | | $ | 26.9 | | | $ | 2.7 | | | $ | 6.6 | | | $ | 9.3 | | | $ | 2.9 | | | $ | 4.6 | | | $ | 7.5 | |
| | Balance | | $ | 4,624.0 | | | $ | 5,721.7 | | | $ | 10,345.7 | | | $ | 4,584.2 | | | $ | 5,691.4 | | | $ | 10,275.6 | | | $ | 4,524.2 | | | $ | 5,552.2 | | | $ | 10,076.5 | | | $ | 4,348.5 | | | $ | 5,576.9 | | | $ | 9,925.4 | | | $ | 4,394.3 | | | $ | 5,608.0 | | | $ | 10,002.3 | |
| | Original LTV | | | 68.2 | % | | | 80.1 | % | | | 74.7 | % | | | | | | | | | | | | | | | | | | | | | | | | | | | | | | | | | | | | | | | | | | | | | | | | |
| Totals | | Net Charge-off %* | | | 0.89 | % | | | 2.31 | % | | | 1.72 | % | | | 0.72 | % | | | 2.22 | % | | | 1.59 | % | | | 0.83 | % | | | 2.72 | % | | | 1.94 | % | | | 0.37 | % | | | 0.70 | % | | | 0.57 | % | | | 0.32 | % | | | 0.31 | % | | | 0.31 | % |
| | $ Losses | | $ | 14.9 | | | $ | 54.3 | | | $ | 69.2 | | | $ | 11.6 | | | $ | 50.9 | | | $ | 62.5 | | | $ | 13.0 | | | $ | 60.4 | | | $ | 73.4 | | | $ | 5.6 | | | $ | 15.5 | | | $ | 21.1 | | | $ | 4.8 | | | $ | 6.7 | | | $ | 11.5 | |
| | Balance | | $ | 6,745.6 | | | $ | 9,384.6 | | | $ | 16,130.2 | | | $ | 6,578.8 | | | $ | 9,270.2 | | | $ | 15,849.0 | | | $ | 6,446.4 | | | $ | 9,000.2 | | | $ | 15,446.7 | | | $ | 6,061.8 | | | $ | 8,973.1 | | | $ | 15,034.8 | | | $ | 6,068.7 | | | $ | 8,893.3 | | | $ | 14,962.0 | |
| | Original LTV | | | 67.4 | % | | | 78.7 | % | | | 73.9 | % | | | | | | | | | | | | | | | | | | | | | | | | | | | | | | | | | | | | | | | | | | | | | | | | |
| | • | | 23% Florida second lien concentration driving results |
| | • | | Second lien, Florida net charge-offs represent 58% of 3Q08 net charge-offs but just 23% of outstanding balances |
| | • | | Net charge-offs in Florida approximately 4.3 times non-Florida net charge-off rate |
| | • | | Origination quality solid with an average FICO of 737 and an average LTV of 74%; Property value declines driving losses |
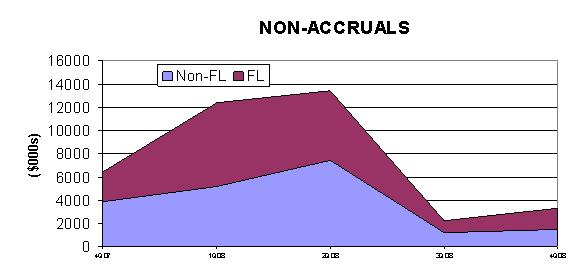
Notes: * Recoveries are pro-rated based on charge-off balances.
* Net Charge-off percentages are calculated on average balances.
* Balances shown on an ending basis. Net loss rates calculated using average balances
* Original LTVs shown for current period only; prior period LTVs not materially different
FINANCIAL SUPPLEMENT TO
FOURTH QUARTER 2008 EARNINGS RELEASE
PAGE 21
Additional Financial and Operational Data
| | | | | | | | | | |
| | | 12/31/08 | | 9/30/08 | | 6/30/08 | | 3/31/08 | | 12/31/07 |
Associate headcount | | 30,784 | | 30,673 | | 31,564 | | 32,143 | | 33,161 |
Authorized shares remaining under buyback program | | 23.1MM | | 23.1MM | | 23.1MM | | 23.1MM | | 23.1MM |
Total branch outlets | | 1,900 | | 1,940 | | 1,936 | | 1,938 | | 1,965 |
ATMs | | 2,336 | | 2,361 | | 2,410 | | 2,464 | | 2,490 |
Morgan Keegan offices | | 332 | | 360 | | 378 | | 397 | | 416 |
Merger-Related Items
(Pre-tax dollars in thousands)
| | | | | | | | | | |
| | | Income Statement
Effect | | Goodwill | | | Total |
Year ended December 31, 2006 | | $ | 88,658 | | $ | 185,378 | | | $ | 274,036 |
First Quarter 2007 | | | 48,993 | | | 3,537 | | | | 52,530 |
Second Quarter 2007 | | | 59,927 | | | 4,090 | | | | 64,017 |
Third Quarter 2007 | | | 91,785 | | | 118 | | | | 91,903 |
Fourth Quarter 2007 | | | 150,162 | | | (10,648 | ) | | | 139,514 |
First Quarter 2008 | | | 75,598 | | | — | | | | 75,598 |
Second Quarter 2008 | | | 100,058 | | | — | | | | 100,058 |
Third Quarter 2008* | | $ | 24,515 | | $ | — | | | $ | 24,515 |
| | | | | | | | | | |
Total | | $ | 639,696 | | $ | 182,475 | | | $ | 822,171 |
| | | | | | | | | | |
| * | 3Q08 marked the final quarter that merger charges were recognized |
FINANCIAL SUPPLEMENT TO
FOURTH QUARTER 2008 EARNINGS RELEASE
PAGE 22
Reconciliation to GAAP Financial Measures
The table below presents computations of earnings and certain other financial measures excluding discontinued operations, merger charges and goodwill impairment (non-GAAP). Merger charges and goodwill impairment are included in financial results presented in accordance with generally accepted accounting principles (GAAP). Regions believes the exclusion of merger charges and goodwill impairment in expressing earnings and certain other financial measures, including “earnings per share from continuing operations, excluding merger charges and goodwill impairment” and “return on average tangible common equity, excluding discontinued operations, merger charges and goodwill impairment”, provides a meaningful base for period-to-period comparisons, which management believes will assist investors in analyzing the operating results of the Company and predicting future performance. These non-GAAP financial measures are also used by management to assess the performance of Regions’ business, because management does not consider merger charges and goodwill impairment to be relevant to ongoing operating results. Management and the Board of Directors utilize these non-GAAP financial measures for the following purposes: preparation of Regions’ operating budgets; calculation of performance-based annual incentive bonuses for certain executives; calculation of performance-based multi-year incentive bonuses for certain executives; monthly financial performance reporting, including segment reporting; monthly close-out “flash” reporting of consolidated results (management only); and presentations to investors of company performance. Regions believes that presenting these non-GAAP financial measures will permit investors to assess the performance of the Company on the same basis as that applied by management and the Board of Directors. Non-GAAP financial measures have inherent limitations, are not required to be uniformly applied and are not audited. To mitigate these limitations, Regions has policies in place to address expenses that qualify as merger charges and goodwill impairment and procedures in place to approve and segregate merger charges from other normal operating expenses to ensure that the Company’s operating results are properly reflected for period-to-period comparisons. Although these non-GAAP financial measures are frequently used by stakeholders in the evaluation of a company, they have limitations as analytical tools, and should not be considered in isolation, or as a substitute for analyses of results as reported under GAAP. In particular, a measure of earnings that excludes merger charges and goodwill impairment does not represent the amount that effectively accrues directly to stockholders (i.e., merger charges and goodwill impairment are a reduction in earnings and stockholders’ equity).
| | | | | | | | | | | | | | | | | | | | | | | | | | | | | | |
| | | | | As of and for Quarter Ended | | | As of and for Year Ended | |
($ amounts in thousands, except per share data) | | | | 12/31/08 | | | 09/30/08 | | | 06/30/08 | | | 03/31/08 | | | 12/31/07 | | | 12/31/2008 | | | 12/31/2007 | |
INCOME | | | | | | | | | | | | | | | | | | | | | | | | | | | | | | |
Income (loss) from continuing operations (GAAP) | | | | $ | (6,218,027 | ) | | $ | 90,358 | | | $ | 206,646 | | | $ | 336,710 | | | $ | 71,115 | | | $ | (5,584,313 | ) | | $ | 1,393,163 | |
| | | | | | | | | | | | | | | | | | | | | | | | | | | | | | |
Preferred stock expense (GAAP) | | | | | (26,236 | ) | | | — | | | | — | | | | — | | | | — | | | | (26,236 | ) | | | — | |
| | | | | | | | | | | | | | | | | | | | | | | | | | | | | | |
Income (loss) from continuing operations available to common shareholders (GAAP) | | | | $ | (6,244,263 | ) | | $ | 90,358 | | | $ | 206,646 | | | $ | 336,710 | | | $ | 71,115 | | | $ | (5,610,549 | ) | | $ | 1,393,163 | |
| | | | | | | | | | | | | | | | | | | | | | | | | | | | | | |
Loss from discontinued operations, net of tax (GAAP) | | | | | (269 | ) | | | (10,897 | ) | | | (253 | ) | | | (42 | ) | | | (474 | ) | | | (11,461 | ) | | | (142,068 | ) |
| | | | | | | | | | | | | | | | | | | | | | | | | | | | | | |
Income (loss) available to common shareholders (GAAP) | | A | | $ | (6,244,532 | ) | | $ | 79,461 | | | $ | 206,393 | | | $ | 336,668 | | | $ | 70,641 | | | $ | (5,622,010 | ) | | $ | 1,251,095 | |
| | | | | | | | | | | | | | | | | | | | | | | | | | | | | | |
Income (loss) from continuing operations available to common shareholders (GAAP) | | | | $ | (6,244,263 | ) | | $ | 90,358 | | | $ | 206,646 | | | $ | 336,710 | | | $ | 71,115 | | | $ | (5,610,549 | ) | | $ | 1,393,163 | |
Merger-related charges, pre-tax | | | | | | | | | | | | | | | | | | | | | | | | | | | | | | |
Salaries and employee benefits | | | | | — | | | | 24,515 | | | | 46,797 | | | | 62,089 | | | | 97,224 | | | | 133,401 | | | | 158,613 | |
Net occupancy expense | | | | | — | | | | — | | | | 1,932 | | | | 1,399 | | | | 3,891 | | | | 3,331 | | | | 33,834 | |
Furniture and equipment expense | | | | | — | | | | — | | | | 5,129 | | | | (144 | ) | | | 1,677 | | | | 4,985 | | | | 4,856 | |
Other | | | | | — | | | | — | | | | 46,200 | | | | 12,254 | | | | 47,370 | | | | 58,454 | | | | 153,564 | |
| | | | | | | | | | | | | | | | | | | | | | | | | | | | | | |
Total merger-related charges, pre-tax | | | | | — | | | | 24,515 | | | | 100,058 | | | | 75,598 | | | | 150,162 | | | | 200,171 | | | | 350,867 | |
Merger-related charges, net of tax | | | | | — | | | | 15,200 | | | | 62,035 | | | | 46,871 | | | | 93,505 | | | | 124,106 | | | | 217,537 | |
Goodwill impairment | | | | | 6,000,000 | | | | — | | | | — | | | | — | | | | — | | | | 6,000,000 | | | | — | |
| | | | | | | | | | | | | | | | | | | | | | | | | | | | | | |
Income (loss) excluding discontinued operations, merger-related charges, and goodwill impairment (non-GAAP) | | B | | $ | (244,263 | ) | | $ | 105,558 | | | $ | 268,681 | | | $ | 383,581 | | | $ | 164,620 | | | $ | 513,557 | | | $ | 1,610,700 | |
| | | | | | | | | | | | | | | | | | | | | | | | | | | | | | |
Weighted average diluted shares | | C | | | 693,000 | | | | 696,205 | | | | 696,346 | | | | 695,548 | | | | 696,895 | | | | 695,003 | | | | 712,743 | |
Earnings (loss) per share available to common - diluted (GAAP) | | A/C | | $ | (9.01 | ) | | $ | 0.11 | | | $ | 0.30 | | | $ | 0.48 | | | $ | 0.10 | | | $ | (8.09 | ) | | $ | 1.76 | |
| | | | | | | | | | | | | | | | | | | | | | | | | | | | | | |
Earnings (loss) per share available to common, excluding discontinued operations, merger-related charges, and goodwill impairment - diluted (non-GAAP) | | B/C | | $ | (0.35 | ) | | $ | 0.15 | | | $ | 0.39 | | | $ | 0.55 | | | $ | 0.24 | | | $ | 0.74 | | | $ | 2.26 | |
| | | | | | | | | | | | | | | | | | | | | | | | | | | | | | |
| | | | | | | | |
RETURN ON AVERAGE TANGIBLE EQUITY | | | | | | | | | | | | | | | | | | | | | | | | | | | | | | |
Average equity (GAAP) | | | | $ | 20,409,894 | | | $ | 19,713,468 | | | $ | 19,782,168 | | | $ | 19,843,914 | | | $ | 19,868,796 | | | $ | 19,939,407 | | | $ | 20,036,459 | |
Average intangible assets (GAAP) | | | | | 11,086,329 | | | | 12,194,962 | | | | 12,221,261 | | | | 12,254,861 | | | | 12,232,366 | | | | 11,949,657 | | | | 12,130,417 | |
Average preferred equity | | | | | 1,690,164 | | | | — | | | | — | | | | — | | | | — | | | | 424,850 | | | | — | |
| | | | | | | | | | | | | | | | | | | | | | | | | | | | | | |
Average tangible common equity | | D | | $ | 7,633,401 | | | $ | 7,518,506 | | | $ | 7,560,907 | | | $ | 7,589,053 | | | $ | 7,636,430 | | | $ | 7,564,900 | | | $ | 7,906,042 | |
Average equity, excluding discontinued operations | | | | $ | 20,409,894 | | | $ | 19,713,468 | | | $ | 19,782,168 | | | $ | 19,843,914 | | | $ | 19,868,796 | | | $ | 19,939,407 | | | $ | 20,013,170 | |
Average intangible assets, excluding discontinued operations | | | | | 11,086,329 | | | | 12,194,962 | | | | 12,221,261 | | | | 12,254,861 | | | | 12,232,365 | | | | 11,949,657 | | | | 12,130,417 | |
Average preferred equity | | | | | 1,690,164 | | | | — | | | | — | | | | — | | | | — | | | | 424,850 | | | | — | |
| | | | | | | | | | | | | | | | | | | | | | | | | | | | | | |
Average tangible common equity, excluding discontinued operations | | E | | $ | 7,633,401 | | | $ | 7,518,506 | | | $ | 7,560,907 | | | $ | 7,589,053 | | | $ | 7,636,431 | | | $ | 7,564,900 | | | $ | 7,882,753 | |
Return on average tangible common equity* | | A/D | | | NM | | | | 4.20 | % | | | 10.98 | % | | | 17.84 | % | | | 3.67 | % | | | -74.32 | % | | | 15.82 | % |
| | | | | | | | | | | | | | | | | | | | | | | | | | | | | | |
Return on average tangible common equity, ex. discontinued operations, merger-related charges, and goodwill impairment (non-GAAP)* | | B/E | | | NM | | | | 5.59 | % | | | 14.29 | % | | | 20.33 | % | | | 8.55 | % | | | 6.79 | % | | | 20.43 | % |
| | | | | | | | | | | | | | | | | | | | | | | | | | | | | | |
| * | Income statement amounts have been annualized in calculation |
FINANCIAL SUPPLEMENT TO
FOURTH QUARTER 2008 EARNINGS RELEASE
PAGE 23
Forward-Looking Statements
This supplement may include forward-looking statements, which reflect Regions current views with respect to future events and financial performance. The Private Securities Litigation Reform Act of 1995 (“the Act”) provides a safe harbor for forward-looking statements which are identified as such and are accompanied by the identification of important factors that could cause actual results to differ materially from the forward-looking statements. For these statements, we, together with our subsidiaries, unless the context implies otherwise, claim the protection afforded by the safe harbor in the Act. Forward-looking statements are not based on historical information, but rather are related to future operations, strategies, financial results or other developments. Forward-looking statements are based on management’s expectations as well as certain assumptions and estimates made by, and information available to, management at the time the statements are made. Those statements are based on general assumptions and are subject to various risks, uncertainties and other factors that may cause actual results to differ materially from the views, beliefs and projections expressed in such statements. These risks, uncertainties and other factors include, but are not limited to, those described below:
| | • | | Regions’ ability to manage fluctuations in the value of assets and liabilities and off-balance sheet exposure so as to maintain sufficient capital and liquidity to support Regions’ business. |
| | • | | Regions’ ability to achieve the earnings expectations related to businesses that have been acquired or that may be acquired in the future. |
| | • | | Regions’ ability to expand into new markets and to maintain profit margins in the face of competitive pressures. |
| | • | | Regions’ ability to keep pace with technological changes. |
| | • | | Regions’ ability to develop competitive new products and services in a timely manner and the acceptance of such products and services by Regions’ customers and potential customers. |
| | • | | Regions’ ability to effectively manage interest rate risk, market risk, credit risk, operational risk, legal risk, liquidity risk, and regulatory and compliance risk. |
| | • | | The current stresses in the financial and real estate markets, including possible continued deterioration in property values. |
| | • | | The cost and other effects of material contingencies, including litigation contingencies. |
| | • | | The effects of increased competition from both banks and non-banks. |
| | • | | Possible changes in interest rates may increase funding costs and reduce earning asset yields, thus reducing margins. |
| | • | | Possible changes in general economic and business conditions in the United States in general and in the communities Regions serves in particular. |
| | • | | Possible changes in the creditworthiness of customers and the possible impairment of collectibility of loans. |
| | • | | The effects of geopolitical instability and risks such as terrorist attacks. |
| | • | | Possible changes in trade, monetary and fiscal policies, laws and regulations, and other activities of governments, agencies, and similar organizations, including changes in accounting standards, may have an adverse effect on business. |
| | • | | Possible changes in consumer and business spending and saving habits could affect Regions’ ability to increase assets and to attract deposits. |
| | • | | The effects of weather and natural disasters such as droughts and hurricanes. |
| | • | | Congress recently enacted the Emergency Economic Stabilization Act of 2008, and the U.S. Treasury and banking regulators are implementing a number of programs to address capital and liquidity issues in the banking system, all of which may have significant effects on Regions and the financial service industry, the exact nature and extent of which cannot be determined at this time. |
The foregoing list of factors is not exhaustive; for discussion of these and other risks that may cause actual results to differ from expectations, please look under the caption “Forward-Looking Statements” in Regions’ Annual Report on Form 10-K for the year ended December 31, 2007 and Forms 10-Q for the quarters ended September 30, 2008, June 30, 2008 and March 31, 2008, as on file with the Securities and Exchange Commission.
The words “believe,” “expect,” “anticipate,” “project,” and similar expressions often signify forward-looking statements. You should not place undue reliance on any forward-looking statements, which speak only as of the date made. Regions assumes no obligation to update or revise any forward-looking statements that are made from time to time.
Regions’ Investor Relations contact is List Underwood at (205) 801-0265; Regions’ Media contact is Tim Deighton at
(205) 264-4551