 Regions Financial 4th Quarter Earnings Conference Call January 26, 2010 EXHIBIT 99.3 |
Forward Looking Statements The information contained in this presentation may include forward-looking statements which reflect Regions' current views with respect to future events and financial performance. The Private Securities Litigation Reform Act of 1995 (the “Act”) provides a “safe harbor” for forward-looking statements which are identified as such and are accompanied by the identification of important factors that could cause actual results to differ materially from the forward-looking statements. For these statements, we, together with our subsidiaries, claim the protection afforded by the safe harbor in the Act. Forward-looking statements are not based on historical information, but rather are related to future operations, strategies, financial results or other developments. Forward-looking statements are based on management’s expectations as well as certain assumptions and estimates made by, and information available to, management at the time the statements are made. Those statements are based on general assumptions and are subject to various risks, uncertainties and other factors that may cause actual results to differ materially from the views, beliefs and projections expressed in such statements. These risks, uncertainties and other factors include, but are not limited to, those described below: › In October 2008 Congress enacted and the President signed into law the Emergency Economic Stabilization Act of 2008, and in February, 2009 the American Recovery and Reinvestment Act of 2009 was signed into law. Additionally, the Department of the U.S. Treasury and federal banking regulators are implementing a number of programs to address capital and liquidity issues in the banking system, and may announce additional programs in the future, all of which may have significant effects on Regions and the financial services industry, the exact nature and extent of which cannot be determined at this time. › The impact of compensation and other restrictions imposed under the Troubled Asset Relief Program (“TARP”) until Regions is able to repay the outstanding preferred stock issued under the TARP. › Possible additional loan losses, impairment of goodwill and other intangibles and valuation allowances on deferred tax assets and the impact on earnings and capital. › Possible changes in interest rates may affect funding costs and reduce earning asset yields, thus reducing margins. › Possible changes in general economic and business conditions in the United States in general and in the communities Regions serves in particular. › Possible changes in the creditworthiness of customers and the possible impairment of the collectability of loans. › Possible changes in trade, monetary and fiscal policies, laws and regulations, and other activities of governments, agencies, and similar organizations, including changes in accounting standards, may have an adverse effect on business. › The current stresses in the financial and real estate markets, including possible continued deterioration in property values. › Regions' ability to manage fluctuations in the value of assets and liabilities and off-balance sheet exposure so as to maintain sufficient capital and liquidity to support Regions' business. › Regions' ability to achieve the earnings expectations related to businesses that have been acquired or that may be acquired in the future. › Regions' ability to expand into new markets and to maintain profit margins in the face of competitive pressures. › Regions' ability to develop competitive new products and services in a timely manner and the acceptance of such products and services by Regions' customers and potential customers. › Regions' ability to keep pace with technological changes. › Regions' ability to effectively manage credit risk, interest rate risk, market risk, operational risk, legal risk, liquidity risk, and regulatory and compliance risk. › The cost and other effects of material contingencies, including litigation contingencies. › The effects of increased competition from both banks and non-banks. › The effects of geopolitical instability and risks such as terrorist attacks. › Possible changes in consumer and business spending and saving habits could affect Regions' ability to increase assets and to attract deposits. › The effects of weather and natural disasters such as droughts and hurricanes. The foregoing list of factors is not exhaustive; for discussion of these and other risks that may cause actual results to differ from expectations, please look under the captions “Forward-Looking Statements” and “Risk Factors” in Regions’ Annual Report on Form 10-K for the year ended December 31, 2008 and Forms 10-Q for the quarters ended March 31, 2009 (as amended) June 30, 2009 and September 30, 2009, as on file with the Securities and Exchange Commission. The words "believe," "expect," "anticipate," "project," and similar expressions often signify forward-looking statements. You should not place undue reliance on any forward- looking statements, which speak only as of the date made. We assume no obligation to update or revise any forward-looking statements that are made from time to time. |
Summary of Fourth Quarter 2009 Results › Loss per diluted share of $0.51 › Average low-cost customer deposit growth again strong, up $2.1 billion, reflective of: › $1,027 million or 5% increase in non-interest bearing deposits; › $701 million or 3% increase in money market deposits › Earning assets increased 1%; securities purchased were partially offset by a decrease in loans due to light demand and decreased, but stabilizing line utilization › Net interest margin steady at 2.72%, benefiting from low cost deposit growth and improving funding mix; net interest income up slightly › Non-interest revenues, as adjusted for losses on securities sales and leveraged lease termination gains, declined 3% due largely to lower mortgage revenues › Non-interest expenses remained relatively flat linked quarter, excluding prior quarter branch consolidation costs › Capital ratios remain strong, with Tier 1 of 11.6% and Tier 1 Common equity of 7.2% › Credit quality › Annualized net charge-offs stabilizing at 2.99% of average loans, driven by higher mortgage and consumer losses › Allowance for credit losses, up approximately $500 million, stands at 3.52% of loans with $1.2 billion loan loss provision › Allowance for loan losses coverage of non-performing loans of 0.89x (1) › Non-performing assets, excluding loans held for sale, increased $376 million to $4.1 billion (1) ; Inflows of non-performing assets slowing Note: Comparisons are to previous quarter (1) Excluding loans held for sale 1 |
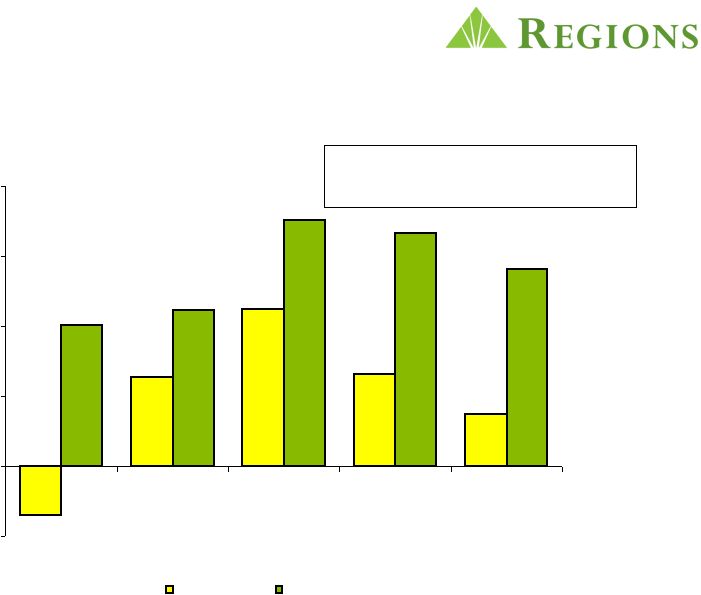
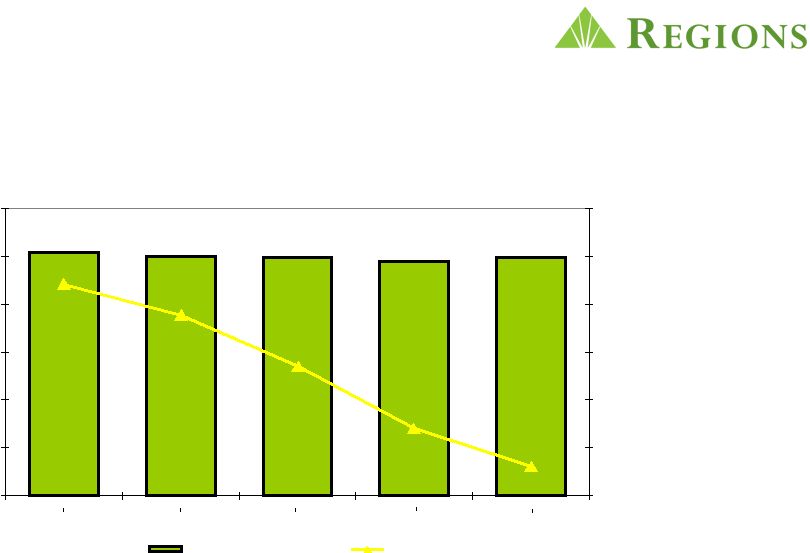 Credit Available, but Demand Remains Soft › Commitment levels remain high › Utilization rates reflect weaker demand but stabilizing ($ in billions) Commercial 2 $25.0 $24.9 $24.5 $25.5 $24.9 48.9% 47.5% 45.4% 42.8% 41.2% $- $5.0 $10.0 $15.0 $20.0 $25.0 $30.0 Dec 08 Mar 09 Jun 09 Sept 09 Dec 09 40% 42% 44% 46% 48% 50% 52% Commitments Utilization Rate |
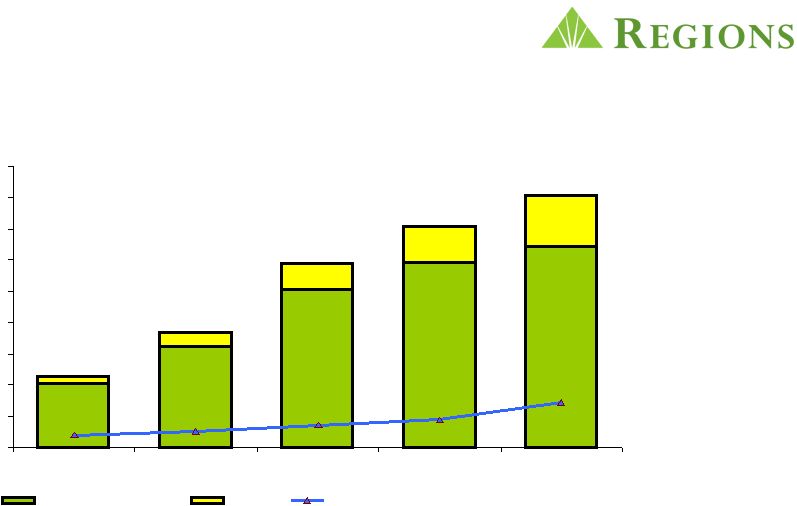
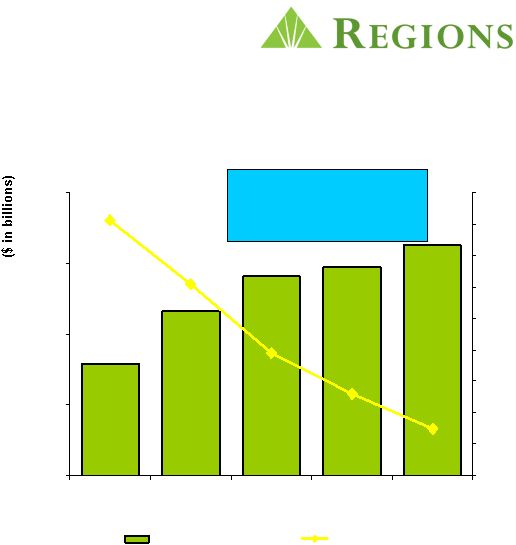 Record Setting Account Growth and High Customer Retention Lead to Rising Customer Deposits › Opened a record 1,000,000+ new retail and business checking accounts in 2009 › Retention remains better than industry norms and at historical highs › Average customer deposits grew $1.6 billion linked quarter; over $8.4 billion year-over-year › Total deposit costs have declined 66 basis points in 2009 $80.0 $85.0 $90.0 $95.0 $100.0 Q408 Q109 Q209 Q309 Q409 1.00% 1.10% 1.20% 1.30% 1.40% 1.50% 1.60% 1.70% 1.80% 1.90% Customer Deposits Total Deposit Costs 10% year over year growth in average customer deposits 3 |
 Result = Strong and Improving Market Share Note: Based on June 30, 2009 FDIC data per SNL. Adjusted for brokered deposits in MS and GA. 4 State Deposits ($B) Rank AL 18.9 20 % 23 % 1 FL 17.4 19 4 4 TN 17.3 18 16 1 LA 7.3 8 9 3 MS 7.0 7 16 1 GA 6.4 7 4 6 AR 4.6 5 9 2 TX 3.7 4 1 16 IL 2.7 3 1 24 MO 2.5 3 2 9 IN 2.4 3 3 9 Other 3.5 4 - - % of Total Mkt. Share |
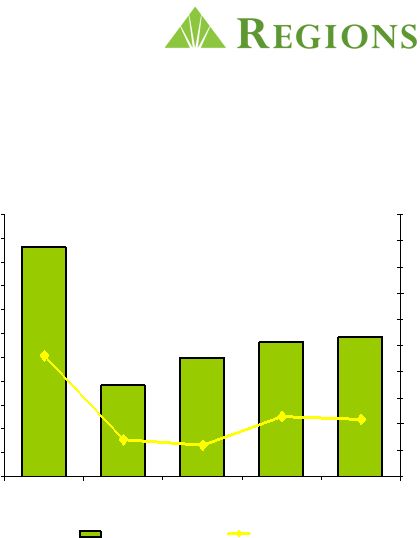 Steady Margin and Net Interest Income; Poised to Increase with Rising Rates › Taxable-equivalent net interest income of $857 million - up $4 million › Net interest margin of 2.72% - steady with prior quarter › Loan and deposit pricing improvements having a positive influence › Pressure from matured hedges, increased non-performing assets and lower loan balances › Asset sensitive balance sheet well positioned for eventual rising rate environment 740 760 780 800 820 840 860 880 900 920 940 960 Q408 Q109 Q209 Q309 Q409 2.50% 2.60% 2.70% 2.80% 2.90% 3.00% 3.10% 3.20% 3.30% 3.40% 3.50% Net Interest Income Net Interest Margin 5 |
 Non-Interest Revenues reflect Securities losses › Service charge income in line with previous quarter › Brokerage income higher, reflecting higher fees from fixed income capital markets › Securities losses driven by balance sheet de-risking › Mortgage income lower Q309 Q409 $ % Non-interest revenue 772 $ 718 $ (54) $ -7% - Leveraged lease termination gains 4 71 - Securities gains / (losses) 4 (96) Non-interest revenue after adjustments 764 $ 743 $ (21) $ -3% 6 |
Non-interest Expenses › Non-interest expense, excluding branch consolidation expenses, relatively flat linked quarter › Salaries and benefits cost lower primarily due to continued headcount reductions; reduced 2,275 in 2009 › Credit-related costs continue to obscure progress 7 |
 Capital Ratios Remain Strong 8 3Q09 4Q09 (1) Total Risk-Based Capital Ratio 16.3% 15.8% Tier 1 Capital Ratio 12.2% 11.6% Tier 1 Common 7.9% 7.2% (1) Current quarter ratios are estimated |
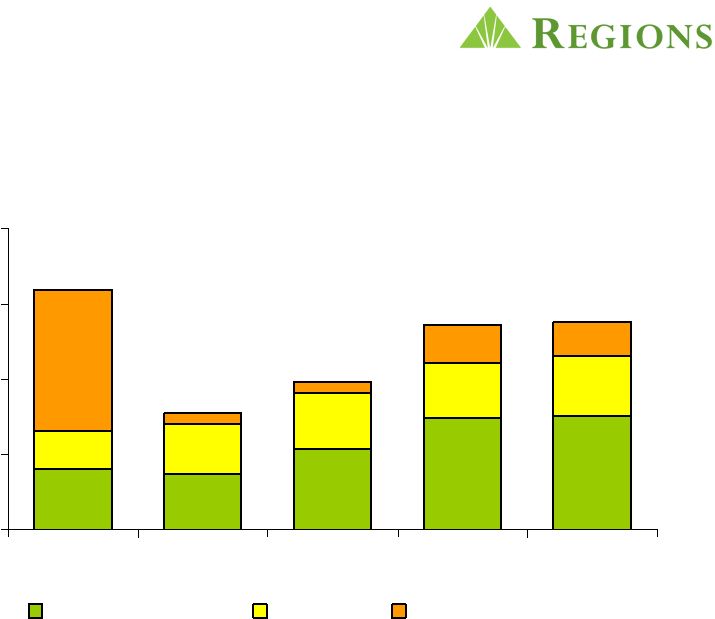 Charge-Offs Stabilizing but Remain Elevated $0 $250 $500 $750 $1,000 4Q08 1Q09 2Q09 3Q09 4Q09 Business Services Consumer Sales/Transfer to HFS $ millions $796 $390 $491 $680 $692 9 |
 Gross and Net NPA Migration Declining $ millions Net NPA* Change down 43% 3Q09 to 4Q09 * Excludes non-performing assets held for sale 10 -$500 $0 $500 $1,000 $1,500 $2,000 4Q08 1Q09 2Q09 3Q09 4Q09 Net NPA Change Gross NPA Additions |
 Gross NPA Migration Declining $0 $500 $1,000 $1,500 $2,000 1Q09 2Q09 3Q09 4Q09 Land/Condo/Single Family Income Producing CRE Business and Community Commercial Consumer $ millions $1.12B $1.76B $1.67B $1.40B › Non-Performing Asset migration continues to moderate from the 2 nd quarter high. Quarter over quarter, the gross migration was down 16% as a result of lower CRE NPA inflow 11 |
 Disposed of $2.7 Billion in Problem Assets Over Past 15 Months $0 $300 $600 $900 $1,200 4Q08 1Q09 2Q09 3Q09 4Q09 Sales Transfer to HFS $ millions $228 $281 $554 $643 $1,039 Note: $2.7B of dispositions include loans sold or moved to held for sale. The 12/31/09 balance in held for sale was $317MM. 12 |
 Troubled Debt Restructurings Driven by Proactive Customer Assistance Program › Recidivism rate much better than government-sponsored programs › Foreclosure rate less than half the national average › Proactive outreach efforts helped over 23,500 families stay in their homes 1) As a percentage of total troubled debt restructurings $ in millions (1) 13 0 200 400 600 800 1,000 1,200 1,400 1,600 1,800 4Q 2008 1Q 2009 2Q 2009 3Q 2009 4Q 2009 Residential first mortgage Other Non-accrual or 90 or more days past due |
 Credit Costs Remain High (in millions) 4Q08 1Q09 2Q09 3Q09 4Q09 Net Charge-offs CRE Valuation Losses $124 $92 $129 $191 $215 Commercial Real Estate 13 24 39 45 55 Other Commercial 67 70 99 136 107 Consumer Real Estate 95 134 164 150 168 Other Consumer 31 29 24 30 32 Net Charge-offs excluding charge- offs from Sales / Transfers to HFS 330 349 455 552 577 Sales/Transfer to HFS 466 41 36 128 115 Total Net Charge-offs 796 390 491 680 692 Provision Over Net Charge-Offs 354 35 421 345 487 Loan Loss Provision $1,150 $425 $912 $1,025 $1,179 14 |
 Regions Residential Mortgage Portfolio Compared to Mortgage Bankers Association National Delinquency Survey 3Q09 % of Loans % of Loans in Foreclosure Past Due 90+ 3Q09 Regions Portfolio 2.42% 1.80% MBA South All Loans 4.29% 4.70% MBA US All Loans 4.38% 4.47% Regions All Florida 3.60% 3.65% MBA All Florida 6.07% 12.74% 15 |
 |