 Regions Financial 1st Quarter Earnings Conference Call April 20, 2010 Exhibit 99.3 * * * * * * * |
Forward Looking Statements This press release may include forward-looking statements which reflect Regions’ current views with respect to future events and financial performance. The Private Securities Litigation Reform Act of 1995 (“the Act”) provides a safe harbor for forward-looking statements which are identified as such and are accompanied by the identification of important factors that could cause actual results to differ materially from the forward-looking statements. For these statements, we, together with our subsidiaries, claim the protection afforded by the safe harbor in the Act. Forward-looking statements are not based on historical information, but rather are related to future operations, strategies, financial results or other developments. Forward-looking statements are based on management’s expectations as well as certain assumptions and estimates made by, and information available to, management at the time the statements are made. Those statements are based on general assumptions and are subject to various risks, uncertainties and other factors that may cause actual results to differ materially from the views, beliefs and projections expressed in such statements. These risks, uncertainties and other factors include, but are not limited to, those described below: › In 2008, the Emergency Economic Stabilization Act of 2008 became law, and in February 2009 the American Recovery and Reinvestment Act of 2009 was signed into law. Additionally, the U.S. Treasury and federal banking regulators are implementing a number of programs to address capital and liquidity issues in the banking system, and there are a number of pending legislative, regulatory and tax proposals, all ofwhich may have significant effects on Regions and the financial services industry, the exact nature ofwhich cannot be determined at this time. › The impact of compensation and other restrictions imposed under the Troubled Asset Relief Program (“TARP”) until Regions repays the outstanding preferred stock issued under TARP. › Possible additional loan losses, and impairment of goodwill, other intangibles and valuation allowances on deferred tax assets and the impact on earnings and capital. › Possible changes in interest rates may increase funding costs and reduce earning asset yields, thus reducing margins. › Possible changes in general economic and business conditions in the United States in general and in the communities Regions serves in particular. › Possible changes in the creditworthiness of customers and the possible impairment of the collectability of loans. › Possible changes in trade, monetary and fiscal policies, laws and regulations, and other activities of governments, agencies, and similar organizations, including changes in accounting standards, may have an adverse effect on business. › The current stresses in the financial and real estate markets, including possible continued deterioration in property values. › Regions' ability to manage fluctuations in the value of assets and liabilities and off-balance sheet exposure so as to maintain sufficient capital and liquidity to support Regions' business. › Regions' ability to achieve the earnings expectations related to businesses that have been acquired or that may be acquired in the future. › Regions' ability to expand into new markets and to maintain profit margins in the face of competitive pressures. › Regions' ability to develop competitive new products and services in a timely manner and the acceptance of such products and services by Regions' customers and potential customers. › Regions' ability to keep pace with technological changes. › Regions' ability to effectively manage credit risk, interest rate risk, market risk, operational risk, legal risk, liquidity risk, and regulatory and compliance risk. › Regions’ ability to ensure adequate capitalization is impacted by inherent uncertainties in forecasting credit losses. › The cost and other effects of material contingencies, including litigation contingencies. › The effects of increased competition from both banks and non-banks. › The effects of geopolitical instability and risks such as terrorist attacks. › Possible changes in consumer and business spending and saving habits could affect Regions' ability to increase assets and to attract deposits. › The effects of weather and natural disasters such as droughts and hurricanes. The foregoing list of factors is not exhaustive; for discussion of these and other risks that may cause actual results to differ from expectations, please look under the captions “Forward- Looking Statements” and “Risk Factors” in Regions’ Annual Report on Form 10-K for the year ended December 31, 2009, as on file with the Securities and Exchange Commission. The words "believe," "expect," "anticipate," "project," and similar expressions often signify forward-looking statements. You should not place undue reliance on any forward- looking statements, which speak only as of the date made. Regions assumes no obligation to update or revise any forward-looking statements that are made from time to time. |
Summary of First Quarter 2010 Results › Loss per diluted share of $0.21 › Net interest margin increased 5 bps to 2.77% › Average earning assets decreased 2%, driven primarily by targeted reduction in investor real estate › Non-interest revenues, as adjusted, declined 1% due largely to lower brokerage revenues › Non-interest expenses, as adjusted, declined 3% primarily due to lower professional fees › Average low-cost customer deposit growth again strong, up $4.2 billion, reflective of: › 10% increase in interest bearing checking deposits; › 8% increase in money market deposits › 3% increase in interest-free deposits › Credit quality › Annualized net charge-offs remain stable at 3.16% of average loans, driven by higher consumer real estate charge-offs and de-risking efforts › Allowance for loan losses, up approximately $70 million, stands at 3.61% of loans with $770 million loan loss provision › Allowance for loan losses coverage of non-performing loans of 0.86x (1) › Non-performing assets, excluding loans held for sale, increased $221 million to $4.3 billion (1) ; Inflows of non-performing assets continue to decline › Capital ratios remain strong, with Tier 1 of 11.7% and Tier 1 Common equity of 7.1% Note: Comparisons are to previous quarter (1) Excluding loans held for sale 1 |
 Investor Real Estate Drives Loan Decline 2 ($ in millions) 12/31/2009 3/31/2010 $ Change % Change Commercial & Industrial 21,547 $ 21,220 $ (327) $ -2% Commercial Real Estate - Owner-Occupied 12,805 12,626 (179) -1% Investor Real Estate 21,700 20,405 (1,295) -6% Residential First Mortgage 15,632 15,592 (40) 0% Home Equity 15,381 15,066 (315) -2% Other consumer 3,609 3,265 (344) -10% Total Loans 90,674 $ 88,174 $ (2,500) $ -3% ($ in millions) 4Q09 1Q10 $ Change % Change Commercial & Industrial 21,570 $ �� 21,429 $ (141) $ -1% Commercial Real Estate - Owner-Occupied 12,946 12,742 (204) -2% Investor Real Estate 22,437 21,291 (1,146) -5% Residential First Mortgage 15,521 15,567 46 0% Home Equity 15,515 15,237 (278) -2% Other consumer 3,777 3,457 (320) -8% Total Loans 91,766 $ 89,723 $ (2,043) $ -2% Ending Balances Average Balances |
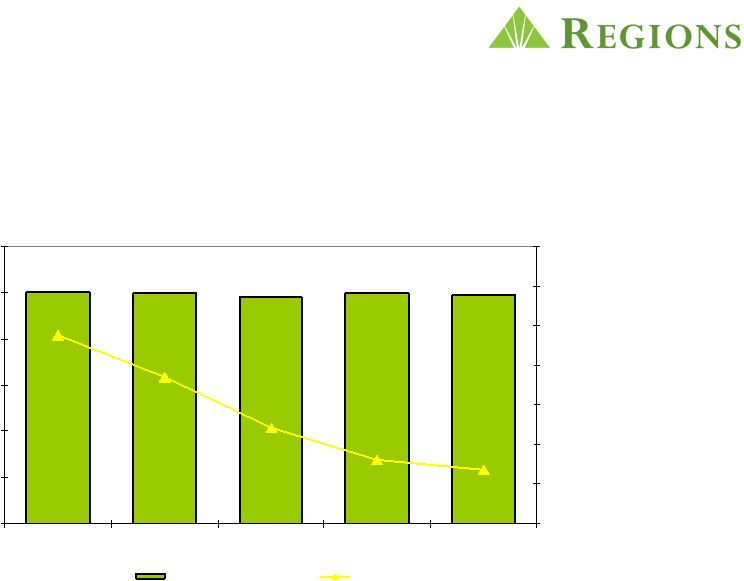 Commercial Line Utilization Stabilizing › Commitment levels remain solid › Utilization rates reflect weaker demand but stabilizing ($ in billions) Commercial 3 $24.9 $24.5 $24.7 $25.0 $24.9 40.7% 41.2% 42.8% 45.4% 47.5% $- $5.0 $10.0 $15.0 $20.0 $25.0 $30.0 Mar'09 Jun'09 Sept'09 Dec'09 Mar'10 38% 40% 42% 44% 46% 48% 50% 52% Commitments Utilization Rate |
 Favorable Mix Shift to Low Cost Deposits 4 ($ in millions) 12/31/2009 Avg Rate 3/31/2010 Avg Rate % Change % Change Low Cost Deposits 64,300 $ 0.31% 68,456 $ 0.31% 4,156 $ 6% Time Deposits 31,961 2.86% 29,707 2.59% (2,254) -7% Customer Deposits 96,261 1.15% 98,163 1.00% 1,902 2% Corporate Treasury Deposits 85 - 72 - (13) -15% Total Deposits 96,346 $ 1.15% 98,235 $ 1.00% 1,889 $ 2% ($ in millions) 12/31/2009 Deposit Mix % 3/31/2010 Deposit Mix % % Change % Change Low Cost Deposits 67,125 $ 68% 70,331 $ 72% 3,206 $ 5% Time Deposits 31,468 32% 27,939 28% (3,529) -11% Customer Deposits 98,593 100% 98,270 100% (323) 0% Corporate Treasury Deposits 87 0% 62 0% (25) -29% Total Deposits 98,680 $ 100% 98,332 $ 100% (348) $ 0% Average Balances and Average Rates Ending Balances |
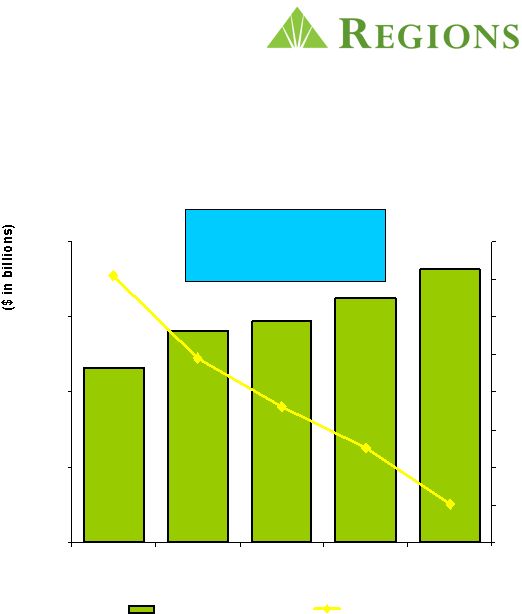 › Exceeding 2009 record pace of new checking account openings; 248,000 in 1 st quarter › Retention remains better than industry norms and at historical highs › Average customer deposits grew $1.9 billion linked quarter; over $6.5 billion year-over-year › Total deposit costs have declined 61 basis points in last 12 months 5 $80.0 $85.0 $90.0 $95.0 $100.0 1Q09 2Q09 3Q09 4Q09 1Q10 0.90% 1.00% 1.10% 1.20% 1.30% 1.40% 1.50% 1.60% 1.70% Customer Deposits Total Deposit Costs 7% year over year growth in average customer deposits Record Setting Account Growth the Driving Force Behind Rising Customer Deposits |
 Recession-Related Expenses Impacting Core Pre- tax Pre-Provision Net Revenue (PPNR) 743 734 831 850 (996) (988) (172) (219) ($1,500) ($1,000) ($500) $0 $500 $1,000 $1,500 $2,000 4Q09 1Q10 $172 $219 Recession-Related Expenses** 15% 18% Recession-Related Expenses as a % of Core Non-Interest Expense $397 $386 Core PPNR 1Q10* 4Q09* ($ in millions) *Excludes securities gains/losses, leveraged lease termination gains, branch consolidation charges, securities impairment and loss on early extinguishment of debt **Recession-related expenses includes FDIC premiums, other real estate owned expenses, loan related legal fees, credit support expenses, etc. Net Interest Income Non-Interest Revenue Other Expenses Recession-Related Expenses 6 $ in millions $386 $397 |
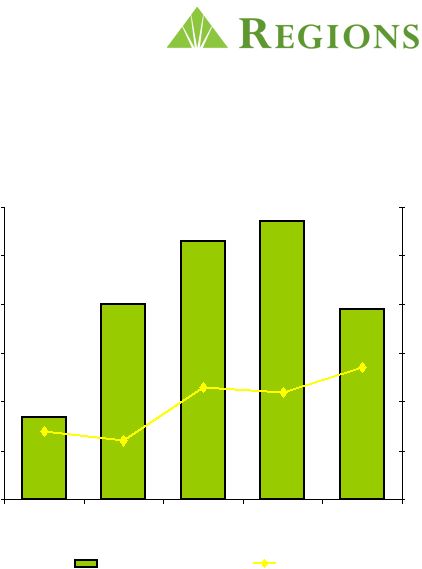 $ in millions Improving Net Interest Margin; Expected to Rise throughout 2010 and Beyond › Net interest margin climbed 5 bps linked quarter; Expected to climb to 3.00% by year-end 2010 › Ongoing improvement in deposit mix and cost with substantial remaining repricing opportunity in maturing, higher cost CDs › Consistent improvements in pricing of new and renewed loans › Balance sheet well positioned for eventual rising rate environment 7 $800 $810 $820 $830 $840 $850 $860 1Q09 2Q09 3Q09 4Q09 1Q10 2.50% 2.60% 2.70% 2.80% 2.90% 3.00% 3.10% Net Interest Income (FTE) Net Interest Margin $817 $840 $853 $857 $839 |
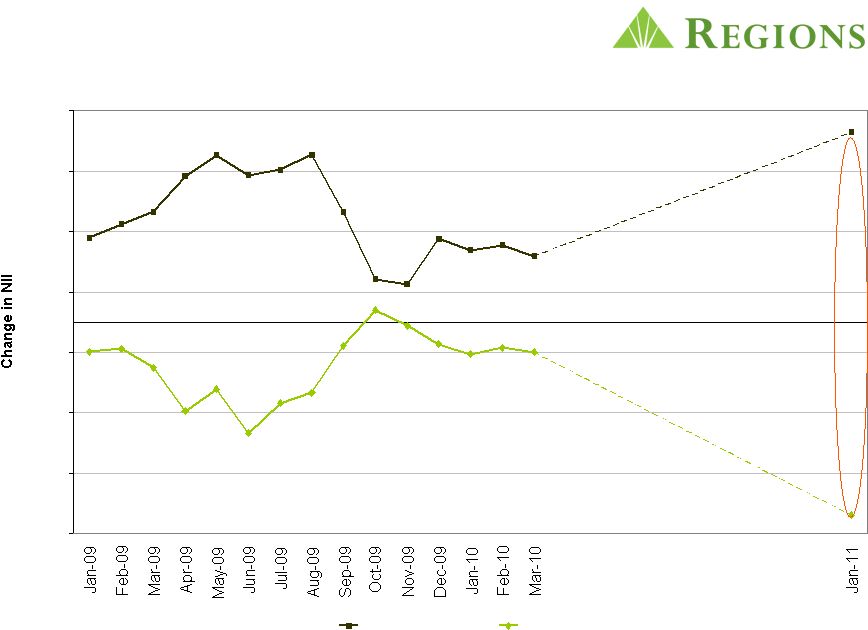 NII Sensitivity Timeline 8 -7.00% -5.00% -3.00% -1.00% 1.00% 3.00% 5.00% 7.00% +100 -100 |
 Non-Interest income impacted by lower Brokerage Income › Brokerage income lower, reflecting a decline in fixed income capital markets revenue › Service charges decline attributable to seasonally lower transaction volume › Mortgage income higher due to favorable MSR hedge 9 ($ in millions) 4Q09 1Q10 $ % Non-interest income, as reported 718 $ 812 $ 94 $ 13% - Leveraged lease termination gains 71 19 - Securities gains / (losses) (96) 59 Core non-interest income 743 $ 734 $ (9) $ -1% Difference |
 Core Non-Interest Expense Improves › Legal and professional fees decline $42 million, driven by lower Morgan Keegan and credit related costs › Other real estate expense declined $22 million linked quarter 10 ($ in millions) 4Q09 1Q10 $ % Non-interest expense 1,219 $ 1,230 $ 11 $ 1% - Branch consolidation charges 12 8 - Securities impairment - 1 - Loss on early extinguishment of debt - 53 Core non-interest expense 1,207 $ 1,168 $ (39) $ -3% Difference |
 Capital Ratios Remain Strong 11 (1) Current Quarter ratios are estimated 4Q09 1Q10 (1) Total Risk-Based Capital 15.8% 15.8% Tier 1 Capital 11.5% 11.7% Tier 1 Common 7.1% 7.1% |
 NPA Migration Declining $0 $500 $1,000 $1,500 $2,000 1Q09 2Q09 3Q09 4Q09 1Q10 Net NPA Change Gross NPA Additions $ millions Net NPA* Change down 41% 4Q09 to 1Q10 * Excludes non-performing assets held for sale 12 |
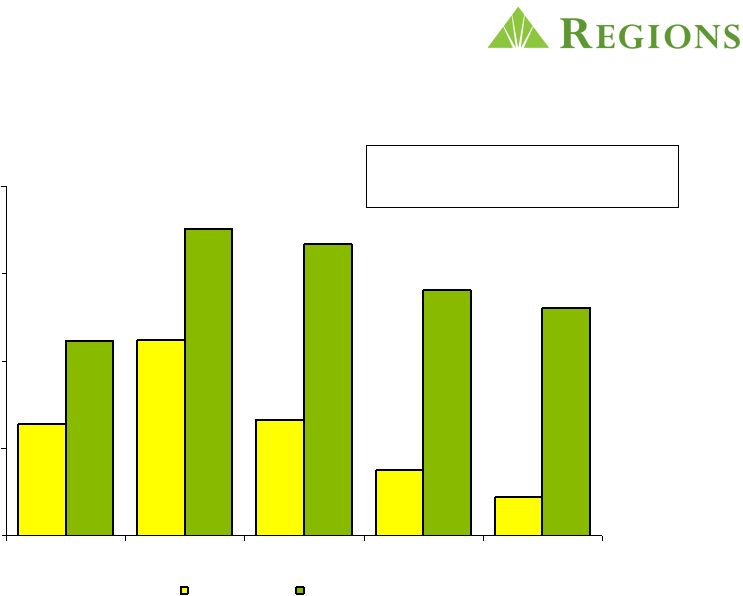
 Disposed of over $3 Billion in Problem Assets Over Past 18 Months $0 $300 $600 $900 $1,200 4Q08 1Q09 2Q09 3Q09 4Q09 1Q10 Sales Transfer to HFS $ millions $228 $281 $554 $643 $1,039 Note: Dispositions include loans sold or moved to held for sale. The 03/31/10 balance in held for sale was $256MM. $689 13 |
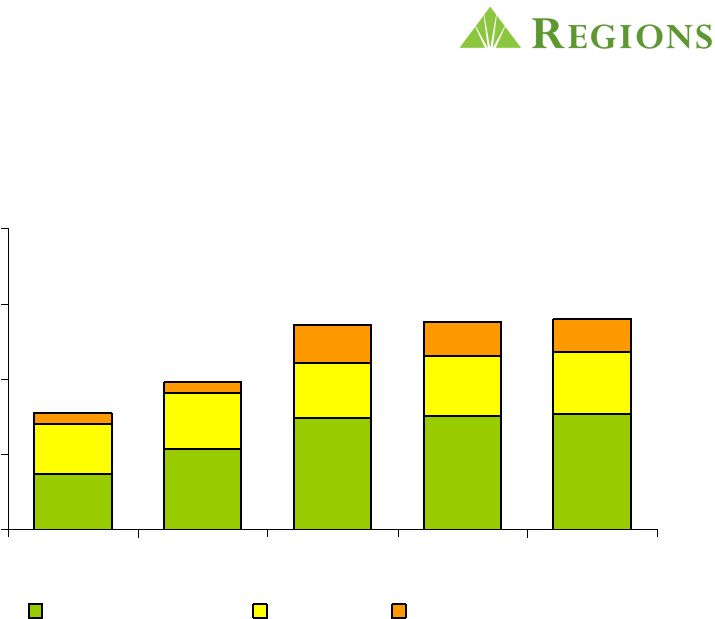 Charge-Offs Stabilized $0 $250 $500 $750 $1,000 1Q09 2Q09 3Q09 4Q09 1Q10 Business Services Consumer Sales/Transfer to HFS $ millions $390 $491 $680 $692 $700 14 |
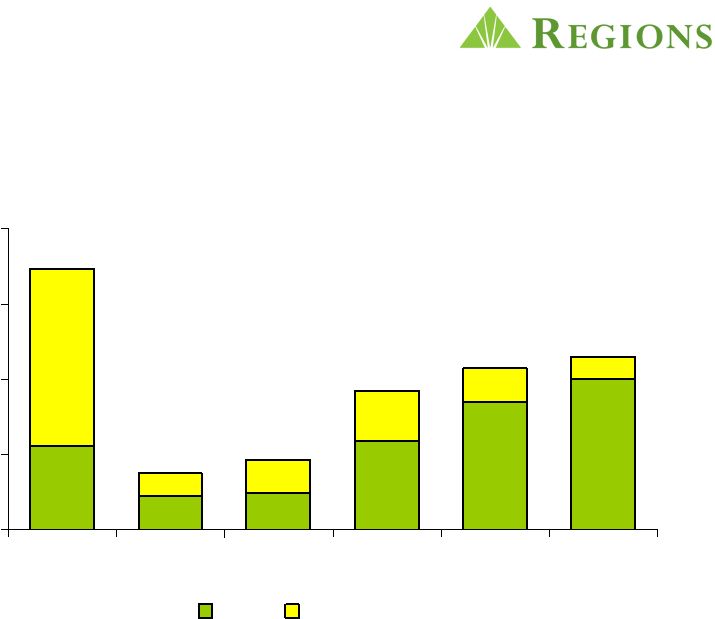
 Troubled Debt Restructurings Decline; Primarily Performing Residential First Mortgages › Recidivism rate much better than government-sponsored programs › Foreclosure rate less than half the national average › Proactive outreach efforts helped over 28,000 families stay in their homes 15 $ in millions 0 200 400 600 800 1,000 1,200 1,400 1,600 1,800 2,000 1Q 2009 2Q 2009 3Q 2009 4Q 2009 1Q 2010 Residential first mortgage Other Non-accrual or 90 or more days past due Accruing |
Credit Trends Stable: Will Improve › NPAs peak by the end of 2Q10 and decline thereafter › Charge-offs peak by the end of 2Q10 and decline thereafter › Charge-off guidance given at the July 2009 Investor Day Conference still holds: somewhere near midpoint of our $3.4 billion to $5.9 billion two year loss range › No reserve build expected in the second half of 2010 16 |
 * * * * |