 Barclays Capital 2010 Financial Services Conference May 19, 2010 Exhibit 99.1 |
This presentation may include forward-looking statements which reflect Regions’ current views with respect to future events and financial performance. The Private Securities Litigation Reform Act of 1995 (“the Act”) provides a safe harbor for forward-looking statements which are identified as such and are accompanied by the identification of important factors that could cause actual results to differ materially from the forward-looking statements. For these statements, we, together with our subsidiaries, claim the protection afforded by the safe harbor in the Act. Forward-looking statements are not based on historical information, but rather are related to future operations, strategies, financial results or other developments. Forward-looking statements are based on management’s expectations as well as certain assumptions and estimates made by, and information available to, management at the time the statements are made. Those statements are based on general assumptions and are subject to various risks, uncertainties and other factors that may cause actual results to differ materially from the views, beliefs and projections expressed in such statements. These risks, uncertainties and other factors include, but are not limited to, those described below: › In 2008, the Emergency Economic Stabilization Act of 2008 became law, and in February 2009 the American Recovery and Reinvestment Act of 2009 was signed into law. Additionally, the U.S. Treasury and federal banking regulators are implementing a number of programs to address capital and liquidity issues in the banking system, and there are a number of pending legislative, regulatory and tax proposals, all of which may have significant effects on Regions and the financial services industry, the exact nature of which cannot be determined at this time. › The impact of compensation and other restrictions imposed under the Troubled Asset Relief Program (“TARP”) until Regions repays the outstanding preferred stock and warrant issued under TARP. › Possible additional loan losses, impairment of goodwill and other intangibles and adjustment of valuation allowances on deferred tax assets and the impact on earnings and capital. › Possible changes in interest rates may affect funding costs and reduce earning asset yields, thus reducing margins. › Possible changes in general economic and business conditions in the United States in general and in the communities Regions serves in particular. › Possible changes in the creditworthiness of customers and the possible impairment of the collectability of loans. › Possible changes in trade, monetary and fiscal policies, laws and regulations, and other activities of governments, agencies, and similar organizations, including changes in accounting standards, may have an adverse effect on business. › The current stresses in the financial and real estate markets, including possible continued deterioration in property values. › Regions' ability to manage fluctuations in the value of assets and liabilities and off-balance sheet exposure so as to maintain sufficient capital and liquidity to support Regions' business. › Regions' ability to achieve the earnings expectations related to businesses that have been acquired or that may be acquired in the future. › Regions' ability to expand into new markets and to maintain profit margins in the face of competitive pressures. › Regions' ability to develop competitive new products and services in a timely manner and the acceptance of such products and services by Regions' customers and potential customers. › Regions' ability to keep pace with technological changes. › Regions' ability to effectively manage credit risk, interest rate risk, market risk, operational risk, legal risk, liquidity risk, and regulatory and compliance risk. › Regions’ ability to ensure adequate capitalization is impacted by inherent uncertainties in forecasting credit losses. › The cost and other effects of material contingencies, including litigation contingencies. › The effects of increased competition from both banks and non-banks. › The effects of geopolitical instability and risks such as terrorist attacks. › Possible changes in consumer and business spending and saving habits could affect Regions' ability to increase assets and to attract deposits. › The effects of weather and natural disasters such as droughts and hurricanes and the effects of the Gulf of Mexico oil spill. The foregoing list of factors is not exhaustive; for discussion of these and other risks that may cause actual results to differ from expectations, please look under the captions “Forward-Looking Statements” and “Risk Factors” in Regions’ Annual Report on Form 10-K for the year ended December 31, 2009 and Form 10-Q for the quarter ended March 31, 2010, as on file with the Securities and Exchange Commission. The words "believe," "expect," "anticipate," "project," and similar expressions often signify forward-looking statements. You should not place undue reliance on any forward- looking statements, which speak only as of the date made. Regions assumes no obligation to update or revise any forward-looking statements that are made from time to time. Forward Looking Statements 1 |
Agenda › Company Overview › Geographically Diversified Footprint › Three Major Lines of Business › Solid Capital › Economic Environment › Well Positioned for Return to Profitability › Credit Trends Improving › Rigorous Expense Management › Focused Loan and Deposit Pricing › Strategic Priorities 2 |
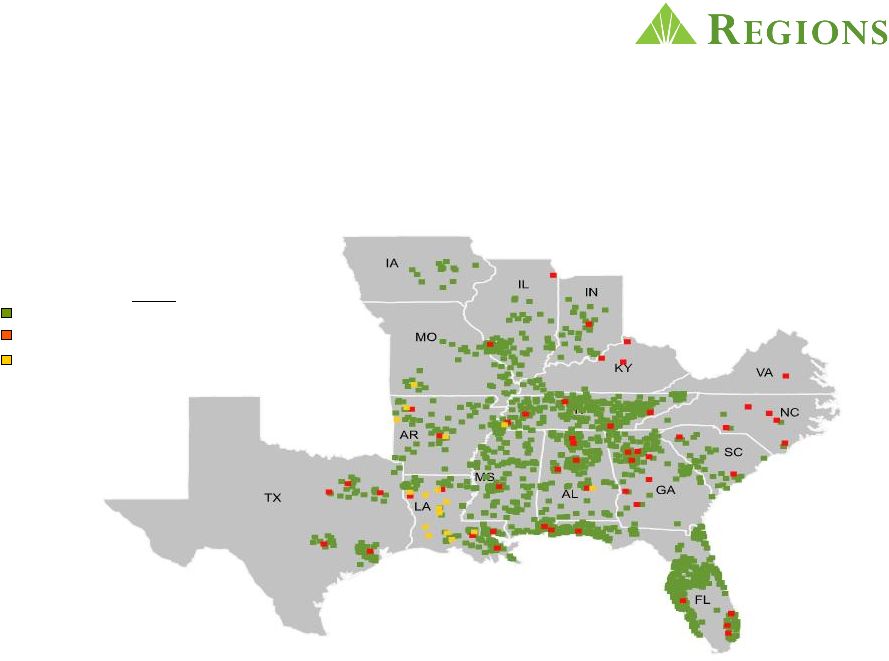 Diversified Southeastern U.S. Franchise › Strategically important position across a number of Southeastern markets Regions Morgan Keegan Insurance Offices 1,774 321 31 As of March 31, 2010 3 |
Consumer Services – Core Franchise is Strong › Every Business Day, Regions Processes: › 650,000 Branch Transactions › 293,000 ATM Transactions › 2.6 Million Debit Card Transactions › During 2009, Regions: › Opened Over 1 Million New Checking Accounts › Grew Interest Free Deposits by Over 25% › Increased Online Banking Customers by 25% › Achieved Top 10% for Customer Loyalty › Top 20% for Branch Customer Service › Loans Outstanding = $33.9 billion 4 |
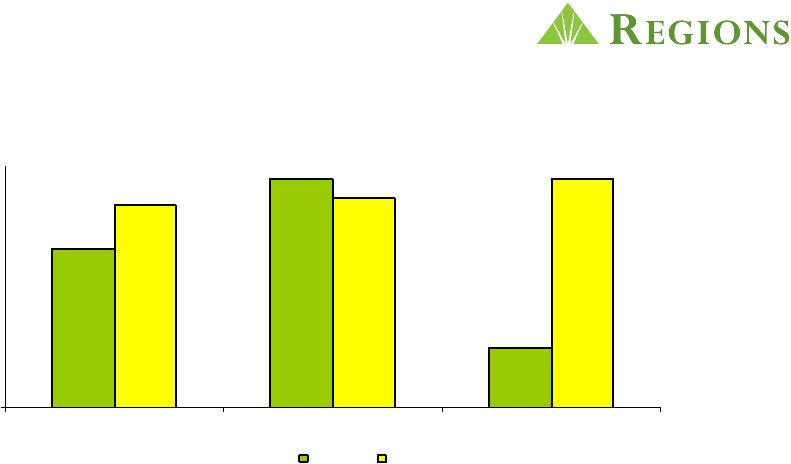 Superior Customer Satisfaction Drives Growth 1.6% 11.4% 794,236 1,008,106 6.1% 10.4% 0.000 New Checking Sales Attrition Household Growth 2008 2009 › 90th percentile among competitors for customer loyalty according to Gallup › Customer retention rate at a historic high and well above industry norm 5 |
 Strong and Improving Market Share Note: Based on June 30, 2009 FDIC data per SNL. Adjusted for brokered deposits in MS and GA. 6 State Deposits ($B) Rank AL 18.9 20 % 23 % 1 FL 17.4 19 4 4 TN 17.3 18 16 1 LA 7.3 8 9 3 MS 7.0 7 16 1 GA 6.4 7 4 6 AR 4.6 5 9 2 TX 3.7 4 1 16 IL 2.7 3 1 24 MO 2.5 3 2 9 IN 2.4 3 3 9 Other 3.5 4 - - % of Total Mkt. Share |
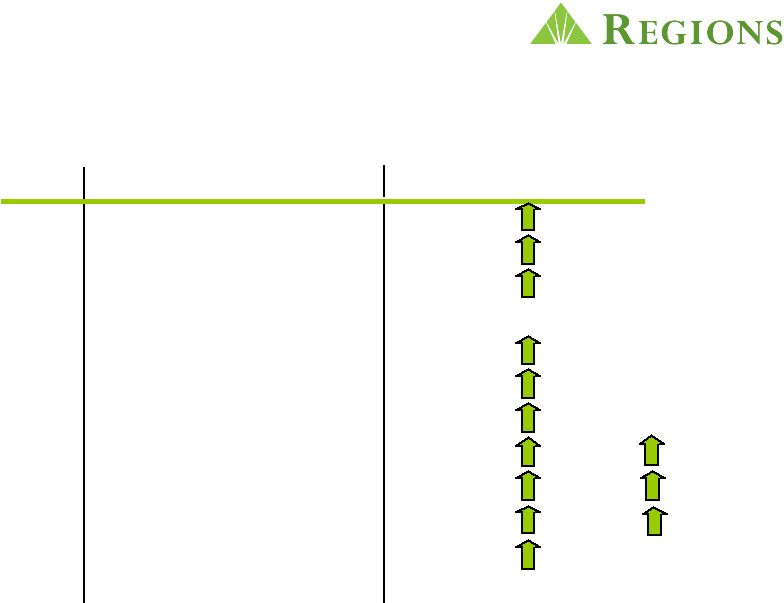
 Business Services Revenue is Well-Diversified and Positioned for Growth Commercial & Industrial Commercial Real Estate Business Banking Community Banking Private Banking Specialized Groups › Business Capital (ABL) › Healthcare › Transportation › Public, Institutional, Non-profit › Restaurant & Beverage 7 Loans Outstanding = $54.3 billion |
Morgan Keegan › Outstanding Diversified Franchise Operating in an Attractive Region › 321 Offices in 16 States › 4,201 Associates, including 1,249 Financial Advisors › $149 Billion in Assets Under Management › During 2009, Morgan Keegan achieved: › Ninth Consecutive Year of Increased Operating Revenues › Top 10 Underwriter of Municipal Securities Nationally › Number 1 Ranked Focus List Performance 8 |
 7.1 11.7 RF Tier 1 T1C Regions’ Capital Levels Strong and Comparable to Peers 9 Peers include: BAC, BBT, CMA, FITB, KEY, MI, PNC, STI, USB, WFC; MTB Capital ratios as of March 31, 2010 Source: SNL and Company Reports |
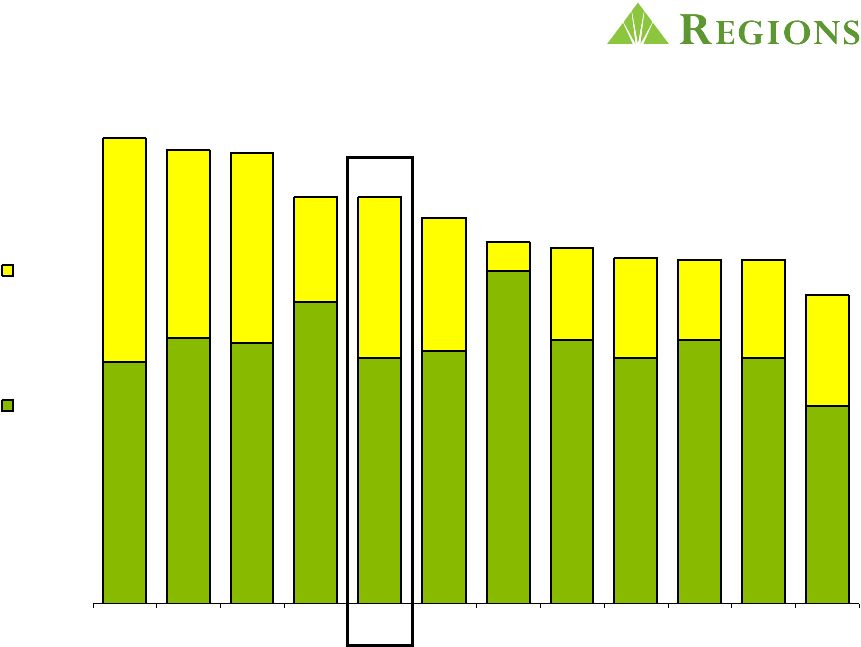
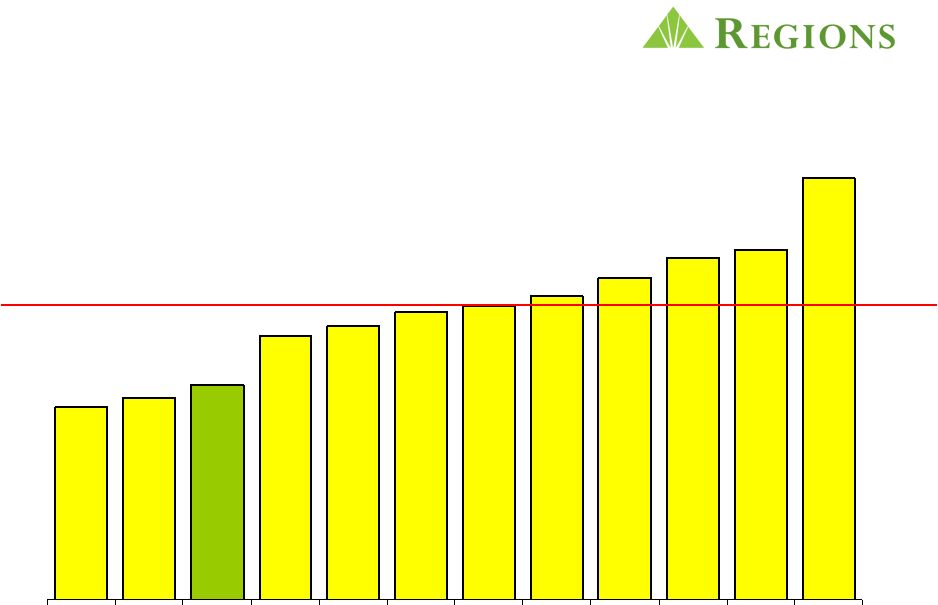 Q4 2009 Risk Weighted Assets/Total Assets Holding Company 69% 71% 73% 80% 82% 84% 85% 86% 89% 92% 93% 104% RF Peer Median 85% Source – FR Y-9 – 12/31/09 Peers include: BAC, BBT, CMA, FITB, KEY, MI, PNC, STI, USB, WFC; MTB 10 |
 Improving Economic Backdrop GDP 0.1% 2.8% 3.2% Unemployment 9.3% 9.7% 9.1% Home Price Index (4.7%) (1.3%) 0.7% Fed Funds 0.2% 0.3% 1.1% 10yr Treasury 3.2% 4.0% 4.5% 2009 2010 (1) 2011 (1) (1) Blue Chip forecast 11 |
 NPA Migration Declining $0 $500 $1,000 $1,500 $2,000 1Q09 2Q09 3Q09 4Q09 1Q10 Net NPA Change Gross NPA Additions $ millions Net NPA* Change down 41% 4Q09 to 1Q10 * Excludes non-performing assets held for sale 12 |
 Disposed of over $3 Billion in Problem Assets Over Past 18 Months $0 $300 $600 $900 $1,200 4Q08 1Q09 2Q09 3Q09 4Q09 1Q10 Sales Transfer to HFS $ millions $228 $281 $554 $643 $1,039 Note: Dispositions include loans sold or moved to held for sale. The 03/31/10 balance in held for sale was $256MM. $689 13 |
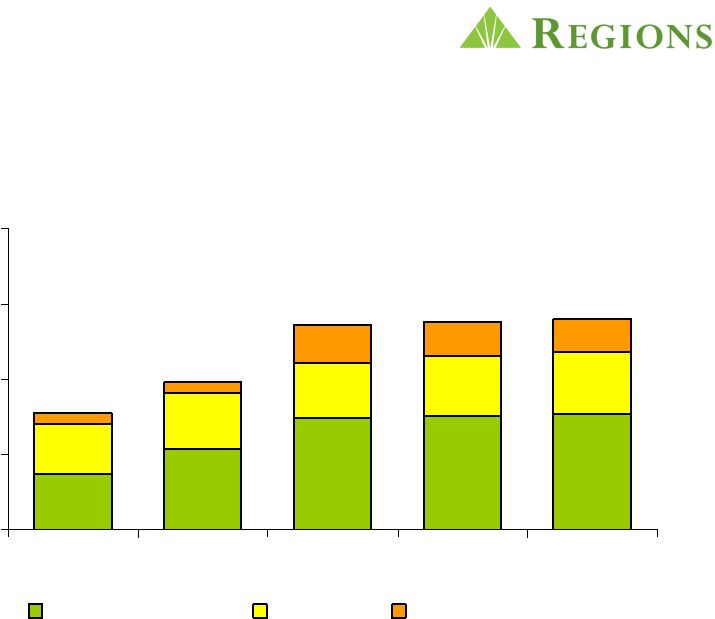 Charge-Offs Stabilized $0 $250 $500 $750 $1,000 1Q09 2Q09 3Q09 4Q09 1Q10 Business Services Consumer Sales/Transfer to HFS $ millions $390 $491 $680 $692 $700 14 |
Credit Trends Stable › NPAs peak by the end of 2Q10 and decline thereafter › Charge-offs peak by the end of 2Q10 and decline thereafter › Charge-off guidance remains unchanged: near the midpoint range of $3.4 billion to $5.9 billion two year loss range › No reserve build expected in the second half of 2010 15 |
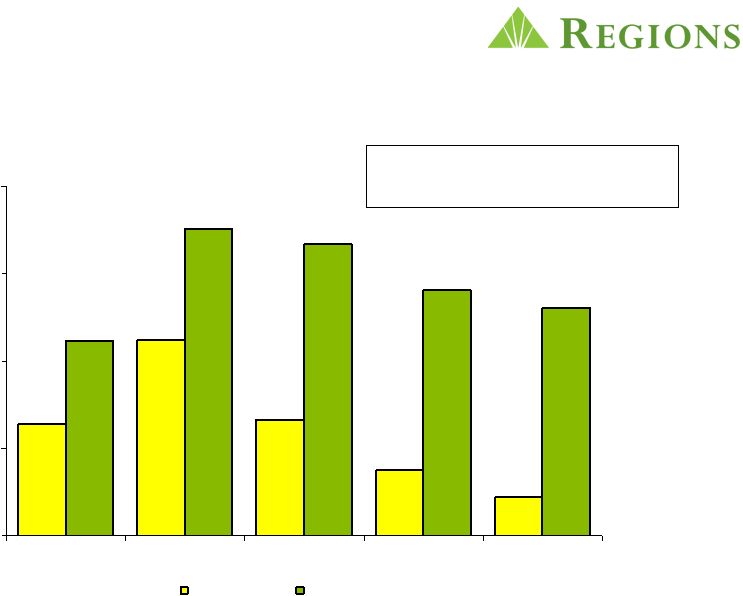
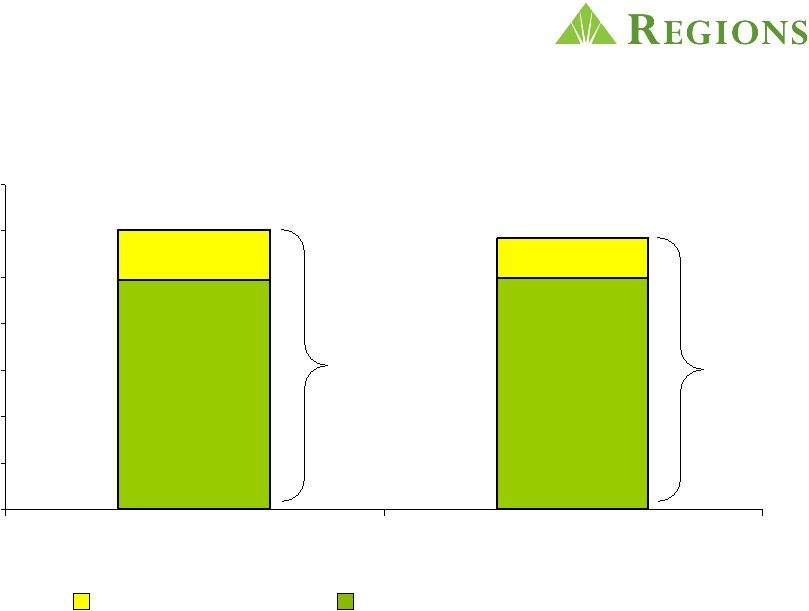 Rigorous Expense Management Muted by High Recession-Related Expenses $996 $988 $172 $219 $0 $200 $400 $600 $800 $1,000 $1,200 $1,400 4Q09 1Q10 Other Expenses Recession-Related Expenses** $ in millions $1,207 $1,168 16 **Recession-related expenses includes FDIC premiums, other real estate owned expenses, loan related legal fees, credit support expenses, etc. |
 Strong Focus on Performance Management and Productivity Improvements Regions Headcount Trends 37,709 May 2006 Dec 2007 Dec 2008 Dec 2009 33,161 30,784 28,213 25% Reduction 28,509 › Reduced Total Positions over 25% since May 2006 › Focused on Performance Management/Top Grading › Remain focused on Headcount Management March 2010 17 |
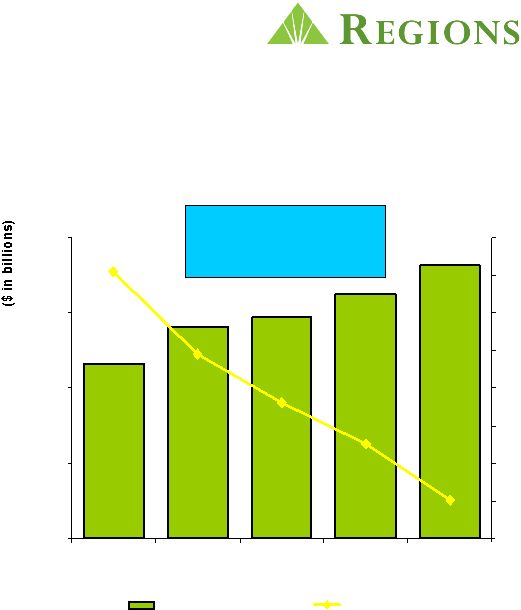 › Exceeding 2009 record pace of new checking account openings; 248,000 in 1 quarter › Average customer deposits grew $1.9 billion linked quarter; over $6.5 billion year-over-year › Total deposit costs have declined 61 basis points in last 12 months $80.0 $85.0 $90.0 $95.0 $100.0 1Q09 2Q09 3Q09 4Q09 1Q10 0.90% 1.00% 1.10% 1.20% 1.30% 1.40% 1.50% 1.60% 1.70% Customer Deposits Total Deposit Costs 7% year over year growth in average customer deposits Increased Customer Deposits and Lower Cost 18 st |
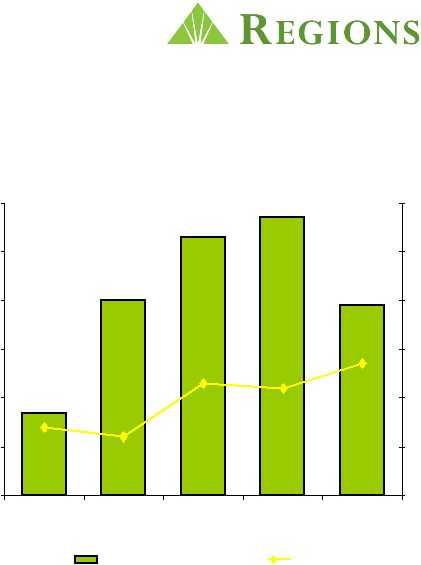 Improving Net Interest Margin; Expected to Rise throughout 2010 and Beyond › Net interest margin climbed 5 bps linked quarter; Expected to climb to 3.00% by year-end 2010 › Ongoing improvement in deposit mix and cost with substantial remaining repricing opportunity in maturing, higher cost CDs › Consistent improvements in pricing of new and renewed loans › Balance sheet well positioned for eventual rising rate environment $ in millions 19 $817 $840 $853 $857 $839 $800 $810 $820 $830 $840 $850 $860 1Q09 2Q09 3Q09 4Q09 1Q10 2.50% 2.60% 2.70% 2.80% 2.90% 3.00% 3.10% Net Interest Income (FTE) Net Interest Margin |
Strategic Priorities Guiding Focus and Results › Keep Focused on the Customer › Protect our Future › Restore Financial Performance › Execute with Excellence 20 |
 |
Appendix |
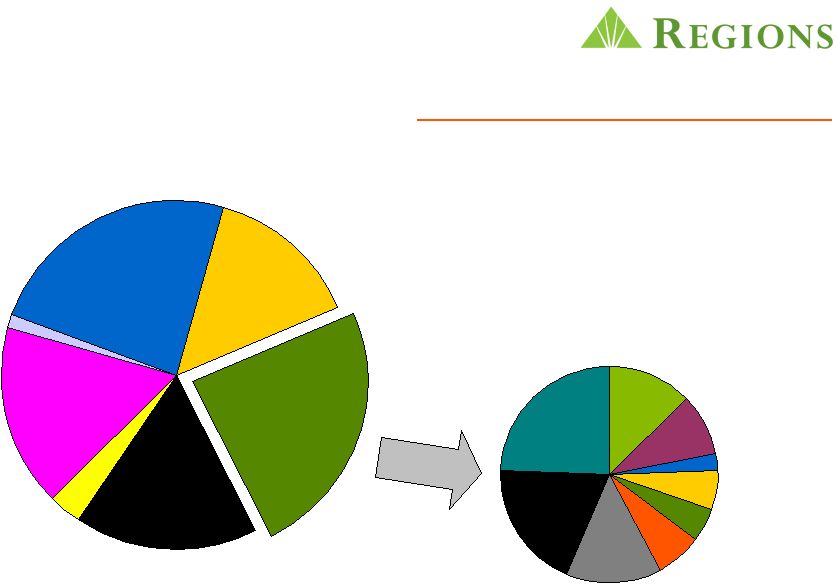 Total Loan Portfolio $88.2bn Commercial and Industrial $21.2bn / 24% Owner Occupied Real Estate $12.6bn / 15% 1Q10 losses 1.48% Investor Real Estate $20.4bn 23% Residential First Mortgage $15.6bn / 18% Indirect $2.2bn / 2% Direct and Other $1.1bn 1% Home Equity $15.1bn 17% Reduced by $5.4 billion, or 21%, since 2006 Land/Single Family/Condo down $7.3bn Well diversified by Property Type Our goal is to further reduce this segment to no more than 15% of total portfolio Land $2.6bn / 13% Single Family $1.9bn / 9% Condo - $0.5bn / 3 Hotel - $1.0bn / 5% Industrial - $1.4bn / 7% Office $2.9bn / 14% Retail $3.9bn / 19% Multi Family $5.0bn / 24% Other - $1.2bn / 6% Investor Real Estate $20.4bn › › › › |
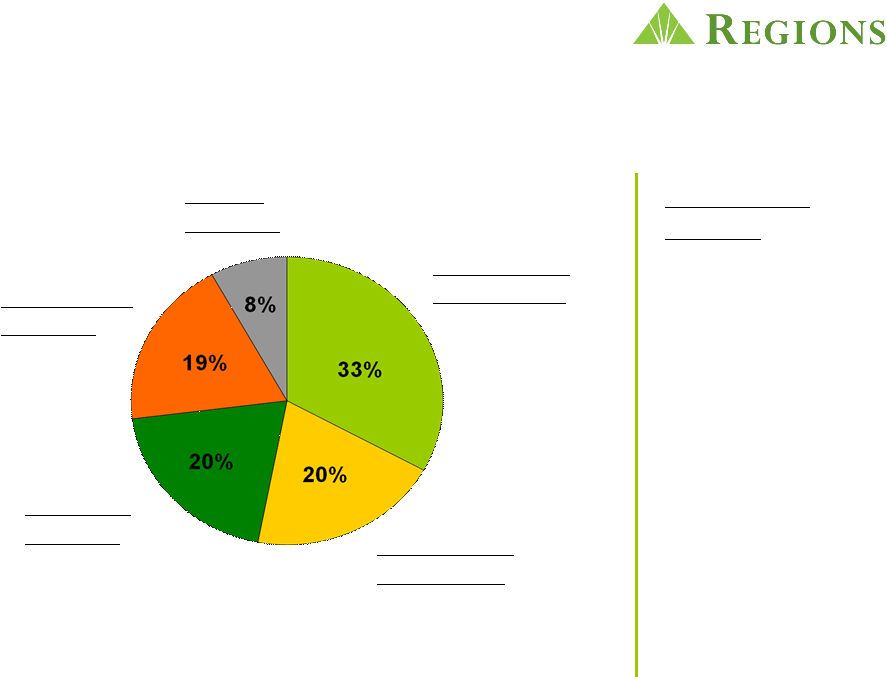
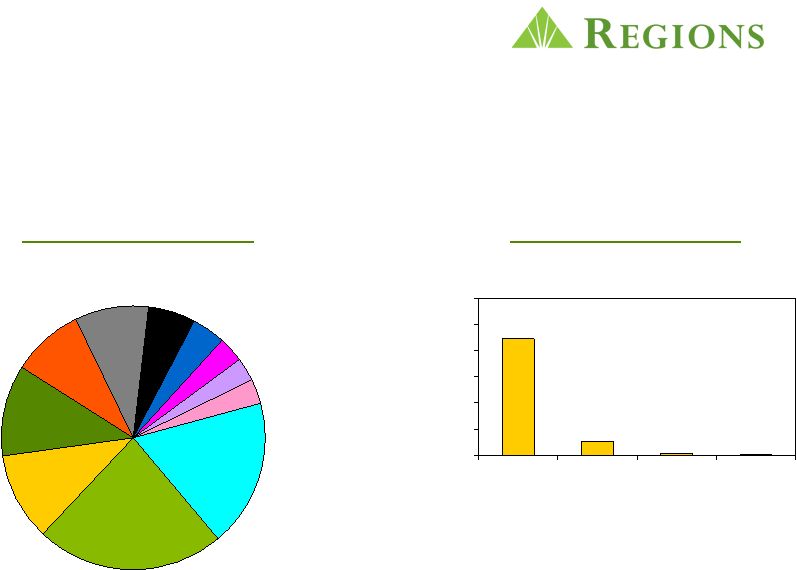 Investor Real Estate Portfolio is Well Diversified 23% of Total Portfolio Other** $3.7bn / 18% FL $4.7bn / 23% TX $2.2bn / 11% GA $2.2bn / 11% AL $1.8bn / 9% TN $1.8bn / 9% NC $1.2bn / 6% LA - $0.9bn / 4% MO - $0.7bn / 3% SC - $0.7bn / 3% AR - $0.5bn / 3% Loan Size Geography 0 5,000 10,000 15,000 20,000 25,000 30,000 <$1MM $1MM- 10MM $10MM- 25MM $25MM+ $802 Thousand Average Loan Balance 22,242 2,743 371 78 # of Loans |