Exhibit 99.2
| | |
 | | FINANCIAL SUPPLEMENT TO SECOND QUARTER 2010 EARNINGS RELEASE |
Summary
Quarterly loss of $0.28 per diluted share reflects core revenue growth, lower adjusted non-interest expenses, continued improvement in key credit metrics offset by a regulatory charge
| | • | | Significant second quarter drivers include: $200 million regulatory charge; $651 million loan loss provision, down $119 million linked quarter; non-performing assets declined for the first time since 4Q08 |
| | • | | Adjusted pre-tax pre-provision net revenue (“PPNR”) increased 22% linked quarter, reflecting improved operating leverage from higher net interest income, higher adjusted non-interest income and lower adjusted non-interest expense |
Non-performing assets declined; Risk profile continues to improve
| | • | | Non-performing assets, excluding loans held for sale, decreased $297 million or 7% linked quarter; Gross inflow of non-performing assets declined $419 million to $887 million during the second quarter |
| | • | | Net charge-offs declined $49 million to $651 million, or an annualized 2.99% of loans as compared to first quarter’s 3.16%. |
Reflecting lower net charge offs and declining non-performing assets, the provision for loan losses declined $119 million to $651 million.
| | • | | Allowance for loan losses increased 10 bps to 3.71%; loan loss provision essentially equaled net charge-offs |
| | • | | Allowance coverage ratio (ALL/NPL, excluding loans held for sale) rose to 0.92x as of June 30, 2010, as compared to 0.86x at March 31, 2010 |
Maintaining strong account growth and service excellence through focusing on our customers
| | • | | Opened 488,000 new checking accounts year-to-date; expecting to match or exceed 2009’s record level of 1,000,000 new accounts |
| | • | | Customer retention remains well above the industry norm and is at a historical high |
| | • | | According to Gallup, Regions ranked in the top decile in customer loyalty among retail banks |
| | • | | Average low-cost deposits increased $2.7 billion linked-quarter or 4%, up $10.3 billion or 17% year-over-year |
Low-cost deposits grow and net interest margin expands
| | • | | Net interest income increased $25 million linked quarter despite a 2% decline in average earning assets |
| | • | | Net interest margin continues to improve, increasing 10 basis points linked quarter to 2.87% |
| | • | | Improving deposit mix and pricing aid the improvement in the margin; time deposits as a percentage of total deposits equal to 27.4% as compared to 34.7% a year ago |
| | • | | Total deposit costs declined 21 bps linked quarter to 0.79% |
| | • | | Loans outstanding declined $2.2 billion or 3% linked quarter, impacted by generally reduced demand and actions to reduce the company’s investor real estate portfolio |
Non-interest revenues expand while non-interest expenses declined and reflect higher performance and efficiency
| | • | | Excluding prior quarter’s gains on sale of securities and leveraged lease terminations, non-interest revenue increased $22 million or 3% versus the prior quarter |
| | • | | Service charges income increased 5% linked quarter, driven by higher interchange transaction activity; Policy changes associated with Regulation E began in the second quarter and will be fully implemented during the third quarter. |
| | • | | Brokerage income increased $18 million to $254 million, driven by higher fixed income capital markets, private client revenue and investment banking activity |
| | • | | Mortgage income declined $4 million linked quarter, primarily reflecting the impact of a reduced benefit from mortgage servicing rights hedging activities |
| | • | | Non-interest expenses, as adjusted for prior quarter’s branch consolidation charges, loss on early extinguishment of debt and current quarter’s regulatory charge, improved 4% linked quarter |
| | • | | Recorded a $200 million regulatory charge (see Earnings Press Release for further details) |
| | • | | Salaries and benefits expense declined $15 million linked quarter, aided by lower headcount and a seasonal payroll tax decline |
Gulf Oil Spill
| | • | | Customer Assistance Program continues to assist customers in need of financial support, including those impacted by the Gulf oil spill |
| | • | | Company has coordinated efforts to quickly, clearly and confidently communicate to local consumers and businesses about Regions’ ability to help, as well as availability of Small Business Association direct programs, state programs and BP assistance efforts. |
| | • | | Strong history in dealing with environmental disasters (e.g. Katrina) and how they impact customers and communities |
| | • | | Thoroughly reviewed impacted geographies and lending relationships; estimated total potential future losses for Regions to be a maximum of $100 million in its adverse case. |
Solid capital position
| | • | | Tier 1 capital ratio of 12.0%(1); |
| | • | | Tier 1 common ratio of 7.7%(1) |
| | • | | Tier 1 capital ratio, excluding trust preferred securities, of 11.2%(1) |
| | • | | Tangible common stockholders’ equity to tangible assets of 6.26% |
FINANCIAL SUPPLEMENT TO
SECOND QUARTER 2010 EARNINGS RELEASE
PAGE 2
Regions Financial Corporation and Subsidiaries
Consolidated Balance Sheets
(Unaudited)
| | | | | | | | | | | | | | | | | | | | |
($ amounts in millions) | | 6/30/10 | | | 3/31/10 | | | 12/31/09 | | | 9/30/09 | | | 6/30/09 | |
Assets: | | | | | | | | | | | | | | | | | | | | |
Cash and due from banks | | $ | 2,097 | | | $ | 2,252 | | | $ | 2,052 | | | $ | 2,101 | | | $ | 2,363 | |
Interest-bearing deposits in other banks | | | 4,562 | | | | 4,295 | | | | 5,580 | | | | 5,902 | | | | 2,846 | |
Federal funds sold and securities purchased under agreements to resell | | | 752 | | | | 324 | | | | 379 | | | | 366 | | | | 3,221 | |
Trading account assets | | | 1,261 | | | | 1,238 | | | | 3,039 | | | | 1,388 | | | | 1,109 | |
Securities available for sale | | | 24,166 | | | | 24,219 | | | | 24,069 | | | | 21,030 | | | | 19,681 | |
Securities held to maturity | | | 28 | | | | 30 | | | | 31 | | | | 39 | | | | 43 | |
Loans held for sale | | | 1,162 | | | | 1,048 | | | | 1,511 | | | | 1,470 | | | | 1,932 | |
Loans, net of unearned income | | | 85,945 | | | | 88,174 | | | | 90,674 | | | | 92,754 | | | | 96,149 | |
Allowance for loan losses | | | (3,185 | ) | | | (3,184 | ) | | | (3,114 | ) | | | (2,627 | ) | | | (2,282 | ) |
| | | | | | | | | | | | | | | | | | | | |
Net loans | | | 82,760 | | | | 84,990 | | | | 87,560 | | | | 90,127 | | | | 93,867 | |
Other interest-earning assets | | | 1,082 | | | | 819 | | | | 734 | | | | 839 | | | | 829 | |
Premises and equipment, net | | | 2,588 | | | | 2,637 | | | | 2,668 | | | | 2,694 | | | | 2,789 | |
Interest receivable | | | 466 | | | | 503 | | | | 468 | | | | 499 | | | | 501 | |
Goodwill | | | 5,561 | | | | 5,559 | | | | 5,557 | | | | 5,557 | | | | 5,556 | |
Mortgage servicing rights (MSRs) | | | 220 | | | | 270 | | | | 247 | | | | 216 | | | | 202 | |
Other identifiable intangible assets | | | 443 | | | | 472 | | | | 503 | | | | 535 | | | | 568 | |
Other assets | | | 8,192 | | | | 8,574 | | | | 7,920 | | | | 7,223 | | | | 7,304 | |
| | | | | | | | | | | | | | | | | | | | |
Total Assets | | $ | 135,340 | | | $ | 137,230 | | | $ | 142,318 | | | $ | 139,986 | | | $ | 142,811 | |
| | | | | | | | | | | | | | | | | | | | |
Liabilities and Stockholders’ Equity: | | | | | | | | | | | | | | | | | | | | |
Deposits: | | | | | | | | | | | | | | | | | | | | |
Non-interest-bearing | | $ | 22,993 | | | $ | 23,391 | | | $ | 23,204 | | | $ | 21,226 | | | $ | 20,995 | |
Interest-bearing | | | 73,257 | | | | 74,941 | | | | 75,476 | | | | 73,654 | | | | 73,731 | |
| | | | | | | | | | | | | | | | | | | | |
Total deposits | | | 96,250 | | | | 98,332 | | | | 98,680 | | | | 94,880 | | | | 94,726 | |
Borrowed funds: | | | | | | | | | | | | | | | | | | | | |
Short-term borrowings: | | | | | | | | | | | | | | | | | | | | |
Federal funds purchased and securities sold under agreements to repurchase | | | 1,929 | | | | 1,687 | | | | 1,893 | | | | 2,633 | | | | 2,265 | |
Other short-term borrowings | | | 1,035 | | | | 997 | | | | 1,775 | | | | 2,653 | | | | 4,927 | |
| | | | | | | | | | | | | | | | | | | | |
Total short-term borrowings | | | 2,964 | | | | 2,684 | | | | 3,668 | | | | 5,286 | | | | 7,192 | |
Long-term borrowings | | | 15,415 | | | | 15,683 | | | | 18,464 | | | | 18,093 | | | | 18,238 | |
| | | | | | | | | | | | | | | | | | | | |
Total borrowed funds | | | 18,379 | | | | 18,367 | | | | 22,132 | | | | 23,379 | | | | 25,430 | |
Other liabilities | | | 3,248 | | | | 2,893 | | | | 3,625 | | | | 3,235 | | | | 3,918 | |
| | | | | | | | | | | | | | | | | | | | |
Total Liabilities | | | 117,877 | | | | 119,592 | | | | 124,437 | | | | 121,494 | | | | 124,074 | |
Stockholders’ equity: | | | | | | | | | | | | | | | | | | | | |
Preferred stock, Series A | | | 3,360 | | | | 3,351 | | | | 3,343 | | | | 3,334 | | | | 3,325 | |
Preferred stock, Series B | | | — | | | | 259 | | | | 259 | | | | 278 | | | | 278 | |
Common stock | | | 13 | | | | 12 | | | | 12 | | | | 12 | | | | 12 | |
Additional paid-in capital | | | 19,038 | | | | 18,781 | | | | 18,781 | | | | 18,754 | | | | 18,740 | |
Retained earnings (deficit) | | | (3,849 | ) | | | (3,502 | ) | | | (3,235 | ) | | | (2,618 | ) | | | (2,169 | ) |
Treasury stock, at cost | | | (1,405 | ) | | | (1,407 | ) | | | (1,409 | ) | | | (1,411 | ) | | | (1,413 | ) |
Accumulated other comprehensive income (loss), net | | | 306 | | | | 144 | | | | 130 | | | | 143 | | | | (36 | ) |
| | | | | | | | | | | | | | | | | | | | |
Total Stockholders’ Equity | | | 17,463 | | | | 17,638 | | | | 17,881 | | | | 18,492 | | | | 18,737 | |
| | | | | | | | | | | | | | | | | | | | |
Total Liabilities and Stockholders’ Equity | | $ | 135,340 | | | $ | 137,230 | | | $ | 142,318 | | | $ | 139,986 | | | $ | 142,811 | |
| | | | | | | | | | | | | | | | | | | | |
FINANCIAL SUPPLEMENT TO
SECOND QUARTER 2010 EARNINGS RELEASE
PAGE 3
Regions Financial Corporation and Subsidiaries
Consolidated Statements of Operations
(Unaudited)
| | | | | | | | | | | | | | | | | | | | |
| | | Quarter Ended | |
($ amounts in millions, except per share data) | | 6/30/10 | | | 3/31/10 | | | 12/31/09 | | | 9/30/09 | | | 6/30/09 | |
Interest income on: | | | | | | | | | | | | | | | | | | | | |
Loans, including fees | | $ | 930 | | | $ | 945 | | | $ | 981 | | | $ | 1,047 | | | $ | 1,073 | |
Securities: | | | | | | | | | | | | | | | | | | | | |
Taxable | | | 224 | | | | 242 | | | | 256 | | | | 232 | | | | 239 | |
Tax-exempt | | | — | | | | 1 | | | | 1 | | | | 6 | | | | 5 | |
| | | | | | | | | | | | | | | | | | | | |
Total securities | | | 224 | | | | 243 | | | | 257 | | | | 238 | | | | 244 | |
Loans held for sale | | | 9 | | | | 8 | | | | 12 | | | | 12 | | | | 15 | |
Federal funds sold and securities purchased under agreements to resell | | | 1 | | | | — | | | | 1 | | | | — | | | | 1 | |
Trading account assets | | | 9 | | | | 12 | | | | 30 | | | | 10 | | | | 10 | |
Other interest-earning assets | | | 7 | | | | 7 | | | | 7 | | | | 7 | | | | 8 | |
| | | | | | | | | | | | | | | | | | | | |
Total interest income | | | 1,180 | | | | 1,215 | | | | 1,288 | | | | 1,314 | | | | 1,351 | |
Interest expense on: | | | | | | | | | | | | | | | | | | | | |
Deposits | | | 194 | | | | 242 | | | | 280 | | | | 301 | | | | 330 | |
Short-term borrowings | | | 2 | | | | 3 | | | | 9 | | | | 9 | | | | 16 | |
Long-term borrowings | | | 128 | | | | 139 | | | | 149 | | | | 159 | | | | 174 | |
| | | | | | | | | | | | | | | | | | | | |
Total interest expense | | | 324 | | | | 384 | | | | 438 | | | | 469 | | | | 520 | |
| | | | | | | | | | | | | | | | | | | | |
Net interest income | | | 856 | | | | 831 | | | | 850 | | | | 845 | | | | 831 | |
Provision for loan losses | | | 651 | | | | 770 | | | | 1,179 | | | | 1,025 | | | | 912 | |
| | | | | | | | | | | | | | | | | | | | |
Net interest income (loss) after provision for loan losses | | | 205 | | | | 61 | | | | (329 | ) | | | (180 | ) | | | (81 | ) |
Non-interest income: | | | | | | | | | | | | | | | | | | | | |
Service charges on deposit accounts | | | 302 | | | | 288 | | | | 299 | | | | 300 | | | | 288 | |
Brokerage, investment banking and capital markets | | | 254 | | | | 236 | | | | 257 | | | | 252 | | | | 263 | |
Mortgage income | | | 63 | | | | 67 | | | | 46 | | | | 76 | | | | 64 | |
Trust department income | | | 49 | | | | 48 | | | | 48 | | | | 49 | | | | 48 | |
Securities gains (losses), net | | | — | | | | 59 | | | | (96 | ) | | | 4 | | | | 108 | |
Other | | | 88 | | | | 114 | | | | 164 | | | | 91 | | | | 428 | |
| | | | | | | | | | | | | | | | | | | | |
Total non-interest income | | | 756 | | | | 812 | | | | 718 | | | | 772 | | | | 1,199 | |
Non-interest expense: | | | | | | | | | | | | | | | | | | | | |
Salaries and employee benefits | | | 560 | | | | 575 | | | | 566 | | | | 578 | | | | 586 | |
Net occupancy expense | | | 110 | | | | 120 | | | | 114 | | | | 121 | | | | 112 | |
Furniture and equipment expense | | | 79 | | | | 74 | | | | 74 | | | | 83 | | | | 78 | |
Other-than-temporary impairments (1) | | | — | | | | 1 | | | | — | | | | 3 | | | | 69 | |
Regulatory charge | | | 200 | | | | — | | | | — | | | | — | | | | — | |
Other | | | 377 | | | | 460 | | | | 465 | | | | 458 | | | | 386 | |
| | | | | | | | | | | | | | | | | | | | |
Total non-interest expense | | | 1,326 | | | | 1,230 | | | | 1,219 | | | | 1,243 | | | | 1,231 | |
| | | | | | | | | | | | | | | | | | | | |
Income (loss) before income taxes | | | (365 | ) | | | (357 | ) | | | (830 | ) | | | (651 | ) | | | (113 | ) |
Income taxes | | | (88 | ) | | | (161 | ) | | | (287 | ) | | | (274 | ) | | | 75 | |
| | | | | | | | | | | | | | | | | | | | |
Net income (loss) | | $ | (277 | ) | | $ | (196 | ) | | $ | (543 | ) | | $ | (377 | ) | | $ | (188 | ) |
| | | | | | | | | | | | | | | | | | | | |
Net income (loss) available to common shareholders | | $ | (335 | ) | | $ | (255 | ) | | $ | (606 | ) | | $ | (437 | ) | | $ | (244 | ) |
| | | | | | | | | | | | | | | | | | | | |
Weighted-average shares outstanding—during quarter: | | | | | | | | | | | | | | | | | | | | |
Basic | | | 1,200 | | | | 1,194 | | | | 1,191 | | | | 1,189 | | | | 876 | |
Diluted | | | 1,200 | | | | 1,194 | | | | 1,191 | | | | 1,189 | | | | 876 | |
Actual shares outstanding—end of quarter | | | 1,256 | | | | 1,192 | | | | 1,193 | | | | 1,188 | | | | 1,188 | |
Earnings (loss) per common share (2): | | | | | | | | | | | | | | | | | | | | |
Basic | | $ | (0.28 | ) | | $ | (0.21 | ) | | $ | (0.51 | ) | | $ | (0.37 | ) | | $ | (0.28 | ) |
Diluted | | $ | (0.28 | ) | | $ | (0.21 | ) | | $ | (0.51 | ) | | $ | (0.37 | ) | | $ | (0.28 | ) |
Cash dividends declared per common share | | $ | 0.01 | | | $ | 0.01 | | | $ | 0.01 | | | $ | 0.01 | | | $ | 0.01 | |
Taxable-equivalent net interest income from continuing operations | | $ | 863 | | | $ | 839 | | | $ | 857 | | | $ | 853 | | | $ | 840 | |
| (1) | Includes $3 million and $260 million of gross charges, net of $0 and $191 million noncredit related portion recognized in other comprehensive income, in 3Q09 and 2Q09, respectively. |
The corresponding amounts for other quarters hereon are immaterial.
| (2) | Includes preferred stock dividends. |
FINANCIAL SUPPLEMENT TO
SECOND QUARTER 2010 EARNINGS RELEASE
PAGE 4
Regions Financial Corporation and Subsidiaries
Consolidated Statements of Operations
(Unaudited)
| | | | | | | | |
| | | Six Months Ended
June 30 | |
($ amounts in millions, except per share data) | | 2010 | | | 2009 | |
Interest income on: | | | | | | | | |
Loans, including fees | | $ | 1,875 | | | $ | 2,171 | |
Securities: | | | | | | | | |
Taxable | | | 466 | | | | 478 | |
Tax-exempt | | | 1 | | | | 12 | |
| | | | | | | | |
Total securities | | | 467 | | | | 490 | |
Loans held for sale | | | 17 | | | | 31 | |
Federal funds sold and securities purchased under agreements to resell | | | 1 | | | | 2 | |
Trading account assets | | | 21 | | | | 22 | |
Other interest-earning assets | | | 14 | | | | 14 | |
| | | | | | | | |
Total interest income | | | 2,395 | | | | 2,730 | |
Interest expense on: | | | | | | | | |
Deposits | | | 436 | | | | 696 | |
Short-term borrowings | | | 5 | | | | 36 | |
Long-term borrowings | | | 267 | | | | 358 | |
| | | | | | | | |
Total interest expense | | | 708 | | | | 1,090 | |
| | | | | | | | |
Net interest income | | | 1,687 | | | | 1,640 | |
Provision for loan losses | | | 1,421 | | | | 1,337 | |
| | | | | | | | |
Net interest income after provision for loan losses | | | 266 | | | | 303 | |
Non-interest income: | | | | | | | | |
Service charges on deposit accounts | | | 590 | | | | 557 | |
Brokerage, investment banking and capital markets | | | 490 | | | | 480 | |
Mortgage income | | | 130 | | | | 137 | |
Trust department income | | | 97 | | | | 94 | |
Securities gains, net | | | 59 | | | | 161 | |
Other | | | 202 | | | | 836 | |
| | | | | | | | |
Total non-interest income | | | 1,568 | | | | 2,265 | |
Non-interest expense: | | | | | | | | |
Salaries and employee benefits | | | 1,135 | | | | 1,125 | |
Net occupancy expense | | | 230 | | | | 219 | |
Furniture and equipment expense | | | 153 | | | | 154 | |
Other-than-temporary impairments (1) | | | 1 | | | | 72 | |
Regulatory charge | | | 200 | | | | — | |
Other | | | 837 | | | | 719 | |
| | | | | | | | |
Total non-interest expense (2) | | | 2,556 | | | | 2,289 | |
| | | | | | | | |
Income (loss) before income taxes | | | (722 | ) | | | 279 | |
Income taxes | | | (249 | ) | | | 390 | |
| | | | | | | | |
Net income (loss) | | | (473 | ) | | | (111 | ) |
| | | | | | | | |
Net income (loss) available to common shareholders | | | ($590 | ) | | | ($218 | ) |
| | | | | | | | |
Weighted-average shares outstanding—year-to-date | | | | | | | | |
Basic | | | 1,197 | | | | 785 | |
Diluted | | | 1,197 | | | | 785 | |
Actual shares outstanding—end of period | | | 1,256 | | | | 1,188 | |
Earnings (loss) per common share (3): | | | | | | | | |
Basic | | $ | (0.49 | ) | | $ | (0.28 | ) |
Diluted | | $ | (0.49 | ) | | $ | (0.28 | ) |
Cash dividends declared per common share | | $ | 0.02 | | | $ | 0.11 | |
Taxable equivalent net interest income from continuing operations | | $ | 1,702 | | | $ | 1,657 | |
| (1) | Includes $263 million of gross charges, net of $191 million noncredit related portion recognized in other comprehensive income (loss), in 2009. |
| | The corresponding 2010 amounts are immaterial. |
| (2) | The securities for which noncredit other-than-temporary impairments were taken in 2Q09 were sold in 4Q09. Realized losses on the sales are reported with securities gains (losses), net. |
| (3) | Includes preferred stock dividends. |
FINANCIAL SUPPLEMENT TO
SECOND QUARTER 2010 EARNINGS RELEASE
PAGE 5
Regions Financial Corporation and Subsidiaries
Consolidated Average Daily Balances and Yield/Rate Analysis
| | | | | | | | | | | | | | | | | | | | | | | | | | | | | | | | | | | | | | | | | | | | | | | | | | |
($ amounts in
millions; yields on
taxable-equivalent
basis) | | Quarter Ended | |
| | 6/30/10 | | | 3/31/10 | | | 12/31/09 | | | 9/30/09 | | | 6/30/09 | |
| | Average
Balance | | | Income/
Expense | | Yield/
Rate | | | Average
Balance | | | Income/
Expense | | Yield/
Rate | | | Average
Balance | | | Income/
Expense | | Yield/
Rate | | | Average
Balance | | | Income/
Expense | | Yield/
Rate | | | Average
Balance | | | Income/
Expense | | Yield/
Rate | |
Assets | | | | | | | | | | | | | | | | | | | | | | | | | | | | | | | | | | | | | | | | | | | | | | | | | | |
Interest-earning assets: | | | | | | | | | | | | | | | | | | | | | | | | | | | | | | | | | | | | | | | | | | | | | | | | | | |
Federal funds sold and securities purchased under agreements to resell | | $ | 345 | | | $ | 1 | | 0.42 | % | | $ | 373 | | | $ | — | | 0.39 | % | | $ | 364 | | | $ | 1 | | 0.35 | % | | $ | 597 | | | $ | — | | 0.42 | % | | $ | 508 | | | $ | 1 | | 0.49 | % |
Trading account assets | | | 1,186 | | | | 9 | | 3.24 | | | | 1,288 | | | | 13 | | 3.99 | | | | 2,827 | | | | 31 | | 4.33 | | | | 1,101 | | | | 10 | | 3.59 | | | | 1,221 | | | | 11 | | 3.58 | |
Securities: | | | | | | | | | | | | | | | | | | | | | | | | | | | | | | | | | | | | | | | | | | | | | | | | | | |
Taxable | | | 23,862 | | | | 224 | | 3.77 | | | | 23,811 | | | | 242 | | 4.11 | | | | 23,061 | | | | 256 | | 4.41 | | | | 19,177 | | | | 232 | | 4.79 | | | | 19,453 | | | | 239 | | 4.92 | |
Tax-exempt | | | 41 | | | | — | | — | | | | 51 | | | | 1 | | 9.35 | | | | 135 | | | | 2 | | 7.42 | | | | 463 | | | | 8 | | 6.52 | | | | 562 | | | | 8 | | 6.30 | |
Loans held for sale | | | 1,031 | | | | 9 | | 3.29 | | | | 1,392 | | | | 8 | | 2.46 | | | | 1,494 | | | | 12 | | 2.99 | | | | 1,522 | | | | 12 | | 3.25 | | | | 1,790 | | | | 16 | | 3.41 | |
Loans, net of unearned income | | | 87,266 | | | | 936 | | 4.30 | | | | 89,723 | | | | 952 | | 4.30 | | | | 91,766 | | | | 986 | | 4.27 | | | | 94,354 | | | | 1,053 | | 4.43 | | | | 95,382 | | | | 1,077 | | 4.53 | |
Other interest-earning assets | | | 6,745 | | | | 8 | | 0.46 | | | | 5,973 | | | | 7 | | 0.46 | | | | 5,566 | | | | 7 | | 0.48 | | | | 6,841 | | | | 7 | | 0.40 | | | | 9,700 | | | | 8 | | 0.36 | |
| | | | | | | | | | | | | | | | | | | | | | | | | | | | | | | | | | | | | | | | | | | | | | | | | | |
Total interest-earning assets | | | 120,476 | | | | 1,187 | | 3.95 | | | | 122,611 | | | | 1,223 | | 4.04 | | | | 125,213 | | | | 1,295 | | 4.10 | | | | 124,055 | | | | 1,322 | | 4.23 | | | | 128,616 | | | | 1,360 | | 4.24 | |
Allowance for loan losses | | | (3,215 | ) | | | | | | | | | (3,144 | ) | | | | | | | | | (2,772 | ) | | | | | | | | | (2,393 | ) | | | | | | | | | (1,917 | ) | | | | | | |
Cash and due from banks | | | 2,112 | | | | | | | | | | 2,181 | | | | | | | | | | 2,206 | | | | | | | | | | 2,113 | | | | | | | | | | 2,269 | | | | | | | |
Other non-earning assets | | | 17,912 | | | | | | | | | | 17,917 | | | | | | | | | | 16,486 | | | | | | | | | | 16,530 | | | | | | | | | | 17,119 | | | | | | | |
| | | | | | | | | | | | | | | | | | | | | | | | | | | | | | | | | | | | | | | | | | | | | | | | | | |
| | $ | 137,285 | | | | | | | | | $ | 139,565 | | | | | | | | | $ | 141,133 | | | | | | | | | $ | 140,305 | | | | | | | | | $ | 146,087 | | | | | | | |
| | | | | | | | | | | | | | | | | | | | | | | | | | | | | | | | | | | | | | | | | | | | | | | | | | |
Liabilities and Stockholders’ Equity | | | | | | | | | | | | | | | | | | | | | | | | | | | | | | | | | | | | | | | | | | | | | | | | | | |
Interest-bearing liabilities: | | | | | | | | | | | | | | | | | | | | | | | | | | | | | | | | | | | | | | | | | | | | | | | | | | |
Savings accounts | | $ | 4,478 | | | | 1 | | 0.08 | | | $ | 4,215 | | | | 1 | | 0.13 | | | $ | 4,064 | | | | 1 | | 0.14 | | | $ | 4,038 | | | | 1 | | 0.13 | | | $ | 4,029 | | | | 1 | | 0.11 | |
Interest-bearing transaction accounts | | | 15,651 | | | | 8 | | 0.21 | | | | 15,709 | | | | 11 | | 0.27 | | | | 14,279 | | | | 11 | | 0.29 | | | | 13,934 | | | | 10 | | 0.27 | | | | 14,277 | | | | 11 | | 0.30 | |
Money market accounts | | | 27,302 | | | | 32 | | 0.46 | | | | 25,715 | | | | 40 | | 0.64 | | | | 23,808 | | | | 38 | | 0.63 | | | | 23,107 | | | | 35 | | 0.61 | | | | 22,138 | | | | 43 | | 0.78 | |
Time deposits | | | 26,933 | | | | 153 | | 2.29 | | | | 29,779 | | | | 190 | | 2.58 | | | | 32,046 | | | | 230 | | 2.84 | | | | 32,584 | | | | 255 | | 3.10 | | | | 33,442 | | | | 275 | | 3.30 | |
Other | | | — | | | | — | | — | | | | — | | | | — | | — | | | | — | | | | — | | — | | | | — | | | | — | | — | | | | 728 | | | | — | | 0.14 | |
| | | | | | | | | | | | | | | | | | | | | | | | | | | | | | | | | | | | | | | | | | | | | | | | | | |
Total interest-bearing deposits (1) | | | 74,364 | | | | 194 | | 1.05 | | | | 75,418 | | | | 242 | | 1.30 | | | | 74,197 | | | | 280 | | 1.49 | | | | 73,663 | | | | 301 | | 1.62 | | | | 74,614 | | | | 330 | | 1.78 | |
Federal funds purchased and securities sold under agreements to repurchase | | | 1,798 | | | | 1 | | 0.17 | | | | 1,989 | | | | 1 | | 0.19 | | | | 3,089 | | | | 5 | | 0.60 | | | | 2,649 | | | | 1 | | 0.11 | | | | 3,734 | | | | 3 | | 0.33 | |
Other short-term borrowings | | | 847 | | | | 1 | | 0.65 | | | | 1,086 | | | | 2 | | 0.81 | | | | 1,849 | | | | 4 | | 0.91 | | | | 2,721 | | | | 8 | | 1.26 | | | | 7,427 | | | | 13 | | 0.71 | |
Long-term borrowings | | | 15,933 | | | | 128 | | 3.21 | | | | 17,417 | | | | 139 | | 3.24 | | | | 18,326 | | | | 149 | | 3.24 | | | | 18,250 | | | | 159 | | 3.45 | | | | 18,829 | | | | 174 | | 3.70 | |
| | | | | | | | | | | | | | | | | | | | | | | | | | | | | | | | | | | | | | | | | | | | | | | | | | |
Total interest-bearing liabilities | | | 92,942 | | | | 324 | | 1.40 | | | | 95,910 | | | | 384 | | 1.62 | | | | 97,461 | | | | 438 | | 1.78 | | | | 97,283 | | | | 469 | | 1.91 | | | | 104,604 | | | | 520 | | 2.00 | |
| | | | | | | | | | | | | | | | | | | | | | | | | | | | | | | | | | | | | | | | | | | | | | | | | | |
Net interest spread | | | | | | | | | 2.55 | | | | | | | | | | 2.42 | | | | | | | | | | 2.32 | | | | | | | | | | 2.32 | | | | | | | | | | 2.24 | |
| | | | | | | | | | | | | | | | | | | | | | | | | | | | | | | | | | | | | | | | | | | | | | | | | | |
Non-interest-bearing deposits (1) | | | 23,688 | | | | | | | | | | 22,817 | | | | | | | | | | 22,149 | | | | | | | | | | 21,122 | | | | | | | | | | 20,421 | | | | | | | |
Other liabilities | | | 3,063 | | | | | | | | | | 3,040 | | | | | | | | | | 3,275 | | | | | | | | | | 3,288 | | | | | | | | | | 3,567 | | | | | | | |
Stockholders’ equity | | | 17,592 | | | | | | | | | | 17,798 | | | | | | | | | | 18,248 | | | | | | | | | | 18,612 | | | | | | | | | | 17,495 | | | | | | | |
| | | | | | | | | | | | | | | | | | | | | | | | | | | | | | | | | | | | | | | | | | | | | | | | | | |
| | $ | 137,285 | | | | | | | | | $ | 139,565 | | | | | | | | | $ | 141,133 | | | | | | | | | $ | 140,305 | | | | | | | | | $ | 146,087 | | | | | | | |
| | | | | | | | | | | | | | | | | | | | | | | | | | | | | | | | | | | | | | | | | | | | | | | | | | |
Net interest income/margin FTE basis | | | | | | $ | 863 | | 2.87 | % | | | | | | $ | 839 | | 2.77 | % | | | | | | $ | 857 | | 2.72 | % | | | | | | $ | 853 | | 2.73 | % | | | | | | $ | 840 | | 2.62 | % |
| | | | | | | | | | | | | | | | | | | | | | | | | | | | | | | | | | | | | | | | | | | | | | | | | | |
| (1) | Total deposit costs may be calculated by dividing total interest expense on deposits by the sum of interest-bearing deposits and non-interest bearing deposits. The rates for total deposit costs equal 0.79%, 1.00%, 1.15%, 1.26% and 1.39% for the quarters ended June 30, 2010, March 31, 2010, December 31, 2009, September 30, 2009 and June 30, 2009, respectively. |
FINANCIAL SUPPLEMENT TO
SECOND QUARTER 2010 EARNINGS RELEASE
PAGE 6
Regions Financial Corporation and Subsidiaries
Consolidated Average Daily Balances and Yield/Rate Analysis (1)
| | | | | | | | | | | | | | | | | | | | |
| | | Six Months Ended June 30 | |
| | | 2010 | | | 2009 | |
($ amounts in millions; yields on taxable equivalent basis) | | Average
Balance | | | Revenue/
Expense | | Yield/
Rate | | | Average
Balance | | | Revenue/
Expense | | Yield/
Rate | |
Assets | | | | | | | | | | | | | | | | | | | | |
Interest-earning assets: | | | | | | | | | | | | | | | | | | | | |
Federal funds sold and securities purchased under agreements to resell | | $ | 359 | | | $ | 1 | | 0.40 | % | | $ | 526 | | | $ | 2 | | 0.65 | % |
Trading account assets | | | 1,236 | | | | 22 | | 3.63 | | | | 1,227 | | | | 24 | | 3.89 | |
Securities: | | | | | | | | | | | | | | | | | | | | |
Taxable | | | 23,836 | | | | 466 | | 3.94 | | | | 19,307 | | | | 478 | | 4.99 | |
Tax-exempt | | | 46 | | | | 1 | | 4.68 | | | | 624 | | | | 19 | | 6.32 | |
Loans held for sale | | | 1,211 | | | | 17 | | 2.82 | | | | 1,805 | | | | 31 | | 3.43 | |
Loans, net of unearned income | | | 88,488 | | | | 1,888 | | 4.30 | | | | 96,012 | | | | 2,179 | | 4.58 | |
Other earning assets | | | 6,361 | | | | 15 | | 0.46 | | | | 7,661 | | | | 14 | | 0.38 | |
| | | | | | | | | | | | | | | | | | | | |
Total interest-earning assets | | | 121,537 | | | | 2,410 | | 4.00 | | | | 127,162 | | | | 2,747 | | 4.36 | |
Allowance for loan losses | | | (3,179 | ) | | | | | | | | | (1,893 | ) | | | | | | |
Cash and due from banks | | | 2,146 | | | | | | | | | | 2,333 | | | | | | | |
Other non-earning assets | | | 17,915 | | | | | | | | | | 17,230 | | | | | | | |
| | | | | | | | | | | | | | | | | | | | |
| | $ | 138,419 | | | | | | | | | $ | 144,832 | | | | | | | |
| | | | | | | | | | | | | | | | | | | | |
Liabilities and Stockholders’ Equity | | | | | | | | | | | | | | | | | | | | |
Interest-bearing liabilities: | | | | | | | | | | | | | | | | | | | | |
Savings accounts | | $ | 4,347 | | | | 2 | | 0.10 | | | $ | 3,917 | | | | 2 | | 0.12 | |
Interest-bearing transaction accounts | | | 15,680 | | | | 19 | | 0.24 | | | | 14,591 | | | | 21 | | 0.28 | |
Money market accounts | | | 26,513 | | | | 72 | | 0.54 | | | | 21,674 | | | | 110 | | 1.03 | |
Time deposits | | | 28,348 | | | | 343 | | 2.44 | | | | 33,169 | | | | 563 | | 3.42 | |
Other | | | — | | | | — | | — | | | | 630 | | | | — | | 0.11 | |
| | | | | | | | | | | | | | | | | | | | |
Total interest-bearing deposits (1) | | | 74,888 | | | | 436 | | 1.17 | | | | 73,981 | | | | 696 | | 1.90 | |
Federal funds purchased and securities sold under agreements to repurchase | | | 1,893 | | | | 2 | | 0.18 | | | | 3,468 | | | | 6 | | 0.37 | |
Other short-term borrowings | | | 966 | | | | 3 | | 0.74 | | | | 8,221 | | | | 30 | | 0.72 | |
Long-term borrowings | | | 16,671 | | | | 267 | | 3.23 | | | | 18,893 | | | | 358 | | 3.82 | |
| | | | | | | | | | | | | | | | | | | | |
Total interest-bearing liabilities | | | 94,418 | | | | 708 | | 1.51 | | | | 104,563 | | | | 1,090 | | 2.10 | |
| | | | | | | | | | | | | | | | | | | | |
Net interest spread | | | | | | | | | 2.49 | | | | | | | | | | 2.26 | |
| | | | | | | | | | | | | | | | | | | | |
Non-interest bearing deposits (1) | | | 23,255 | | | | | | | | | | 19,663 | | | | | | | |
Other liabilities | | | 3,051 | | | | | | | | | | 3,502 | | | | | | | |
Stockholders’ equity | | | 17,695 | | | | | | | | | | 17,104 | | | | | | | |
| | | | | | | | | | | | | | | | | | | | |
| | $ | 138,419 | | | | | | | | | $ | 144,832 | | | | | | | |
| | | | | | | | | | | | | | | | | | | | |
Net interest income/margin FTE basis | | | | | | $ | 1,702 | | 2.82 | % | | | | | | $ | 1,657 | | 2.63 | % |
| | | | | | | | | | | | | | | | | | | | |
| (1) | Total deposit costs may be calculated by dividing total interest expense on deposits by the sum of interest-bearing deposits and non-interest bearing deposits. |
| | The rates for total deposit costs equal 0.90% and 1.50% for the six months ended June 30, 2010 and 2009, respectively. |
FINANCIAL SUPPLEMENT TO
SECOND QUARTER 2010 EARNINGS RELEASE
PAGE 7
Regions Financial Corporation and Subsidiaries
Selected Ratios
| | | | | | | | | | | | | | | | | | | | |
| | | As of and for Quarter Ended | |
| | | 6/30/10 | | | 3/31/10 | | | 12/31/09 | | | 9/30/09 | | | 6/30/09 | |
Return on average assets (non-GAAP)* | | | (0.98 | %) | | | (0.74 | %) | | | (1.70 | %) | | | (1.24 | %) | | | (0.67 | %) |
Return on average assets, excluding regulatory charge (non-GAAP)* | | | (0.40 | %) | | | (0.74 | %) | | | (1.70 | %) | | | (1.24 | %) | | | (0.67 | %) |
Return on average common equity* | | | (9.59 | %) | | | (7.28 | %) | | | (16.40 | %) | | | (11.55 | %) | | | (6.96 | %) |
Return on average tangible common equity (non-GAAP)* | | | (16.80 | %) | | | (12.69 | %) | | | (28.03 | %) | | | (19.48 | %) | | | (12.34 | %) |
Return on average tangible common equity, excluding regulatory charge (non-GAAP)* | | | (6.79 | %) | | | (12.69 | %) | | | (28.03 | %) | | | (19.48 | %) | | | (12.34 | %) |
Common equity per share | | $ | 11.23 | | | $ | 11.77 | | | $ | 11.97 | | | $ | 12.53 | | | $ | 12.74 | |
Tangible common book value per share (non-GAAP) | | $ | 6.45 | | | $ | 6.71 | | | $ | 6.89 | | | $ | 7.40 | | | $ | 7.58 | |
Stockholders’ equity to total assets | | | 12.90 | % | | | 12.85 | % | | | 12.56 | % | | | 13.21 | % | | | 13.12 | % |
Tangible common stockholders’ equity to tangible assets (non-GAAP) | | | 6.26 | % | | | 6.09 | % | | | 6.03 | % | | | 6.56 | % | | | 6.59 | % |
Tier 1 Common risk-based ratio (non-GAAP) (1) | | | 7.7 | % | | | 7.1 | % | | | 7.1 | % | | | 7.9 | % | | | 8.1 | % |
Tier 1 Capital (1) | | | 12.0 | % | | | 11.7 | % | | | 11.5 | % | | | 12.2 | % | | | 12.2 | % |
Total Risk-Based Capital (1) | | | 15.9 | % | | | 15.8 | % | | | 15.8 | % | | | 16.3 | % | | | 16.2 | % |
Allowance for credit losses as a percentage of loans, net of unearned income (2) | | | 3.79 | % | | | 3.69 | % | | | 3.52 | % | | | 2.90 | % | | | 2.43 | % |
Allowance for loan losses as a percentage of loans, net of unearned income | | | 3.71 | % | | | 3.61 | % | | | 3.43 | % | | | 2.83 | % | | | 2.37 | % |
Allowance for loan losses to non-performing loans (3) | | | 0.92x | | | | 0.86x | | | | 0.89x | | | | 0.82x | | | | 0.87x | |
Net interest margin (FTE) | | | 2.87 | % | | | 2.77 | % | | | 2.72 | % | | | 2.73 | % | | | 2.62 | % |
Loans, net of unearned income, to total deposits | | | 89.3 | % | | | 89.7 | % | | | 91.9 | % | | | 97.8 | % | | | 101.5 | % |
Net charge-offs as a percentage of average loans* | | | 2.99 | % | | | 3.16 | % | | | 2.99 | % | | | 2.86 | % | | | 2.06 | % |
Non-performing assets (excluding loans 90 days past due) as a percentage of loans and other real estate | | | 4.94 | % | | | 5.15 | % | | | 4.83 | % | | | 4.40 | % | | | 3.55 | % |
Non-performing assets (excluding loans 90 days past due) as a percentage of loans and other real estate (3) | | | 4.65 | % | | | 4.86 | % | | | 4.49 | % | | | 3.99 | % | | | 3.17 | % |
Non-performing assets (including loans 90 days past due) as a percentage of loans and other real estate | | | 5.65 | % | | | 5.94 | % | | | 5.59 | % | | | 5.08 | % | | | 4.18 | % |
Non-performing assets (including loans 90 days past due) as a percentage of loans and other real estate (3) | | | 5.35 | % | | | 5.65 | % | | | 5.24 | % | | | 4.68 | % | | | 3.80 | % |
| (1) | Current quarter Tier 1 Common, Tier 1 and Total Risk-Based Capital ratios are estimated |
| (2) | The allowance for credit losses reflects the allowance related to both loans on the balance sheet and exposure related to unfunded commitments and standby letters of credit |
| (3) | Excludes loans held for sale |
FINANCIAL SUPPLEMENT TO
SECOND QUARTER 2010 EARNINGS RELEASE
PAGE 8
Loans
Loan Portfolio - Period End Data
| | | | | | | | | | | | | | | | | | | | | | | | | | | | | |
($ amounts in millions) | | 6/30/10 | | 3/31/10 | | 12/31/09 | | 9/30/09 | | 6/30/09 | | 6/30/10
vs. 3/31/10 | | | 6/30/10
vs. 6/30/09 | |
Commercial and industrial | | $ | 21,096 | | $ | 21,220 | | $ | 21,547 | | $ | 21,925 | | $ | 23,619 | | $ | (124 | ) | | -0.6 | % | | $ | (2,523 | ) | | -10.7 | % |
Commercial real estate mortgage - owner-occupied | | | 11,967 | | | 12,028 | | | 12,054 | | | 12,103 | | | 12,282 | | | (61 | ) | | -0.5 | % | | | (315 | ) | | -2.6 | % |
Commercial real estate construction - owner-occupied | | | 547 | | | 598 | | | 751 | | | 875 | | | 1,060 | | | (51 | ) | | -8.5 | % | | | (513 | ) | | -48.4 | % |
| | | | | | | | | | | | | | | | | | | | | | | | | | | | | |
Total commercial | | | 33,610 | | | 33,846 | | | 34,352 | | | 34,903 | | | 36,961 | | | (236 | ) | | -0.7 | % | | | (3,351 | ) | | -9.1 | % |
Commercial investor real estate mortgage | | | 15,152 | | | 15,702 | | | 16,109 | | | 16,190 | | | 16,419 | | | (550 | ) | | -3.5 | % | | | (1,267 | ) | | -7.7 | % |
Commercial investor real estate construction | | | 3,778 | | | 4,703 | | | 5,591 | | | 6,616 | | | 7,163 | | | (925 | ) | | -19.7 | % | | | (3,385 | ) | | -47.3 | % |
| | | | | | | | | | | | | | | | | | | | | | | | | | | | | |
Total investor real estate | | | 18,930 | | | 20,405 | | | 21,700 | | | 22,806 | | | 23,582 | | | (1,475 | ) | | -7.2 | % | | | (4,652 | ) | | -19.7 | % |
Residential first mortgage | | | 15,567 | | | 15,592 | | | 15,632 | | | 15,513 | | | 15,564 | | | (25 | ) | | -0.2 | % | | | 3 | | | NM | |
Home equity | | | 14,802 | | | 15,066 | | | 15,381 | | | 15,630 | | | 15,796 | | | (264 | ) | | -1.8 | % | | | (994 | ) | | -6.3 | % |
Indirect | | | 1,900 | | | 2,162 | | | 2,452 | | | 2,755 | | | 3,099 | | | (262 | ) | | -12.1 | % | | | (1,199 | ) | | -38.7 | % |
Other consumer | | | 1,136 | | | 1,103 | | | 1,157 | | | 1,147 | | | 1,147 | | | 33 | | | 3.0 | % | | | (11 | ) | | -1.0 | % |
| | | | | | | | | | | | | | | | | | | | | | | | | | | | | |
| | $ | 85,945 | | $ | 88,174 | | $ | 90,674 | | $ | 92,754 | | $ | 96,149 | | $ | (2,229 | ) | | -2.5 | % | | $ | (10,204 | ) | | -10.6 | % |
| | | | | | | | | | | | | | | | | | | | | | | | | | | | | |
|
| Loan Portfolio - Average Balances | |
| | | | | | | |
($ amounts in millions) | | 2Q10 | | 1Q10 | | 4Q09 | | 3Q09 | | 2Q09 | | 2Q10
vs. 1Q10 | | | 2Q10
vs. 2Q09 | |
Commercial and industrial | | $ | 21,109 | | $ | 21,429 | | $ | 21,570 | | $ | 22,443 | | $ | 22,707 | | $ | (320 | ) | | -1.5 | % | | $ | (1,598 | ) | | -7.0 | % |
Commercial real estate mortgage - owner-occupied | | | 12,005 | | | 12,056 | | | 12,127 | | | 12,188 | | | 11,983 | | | (51 | ) | | -0.4 | % | | | 22 | | | 0.2 | % |
Commercial real estate construction - owner-occupied | | | 563 | | | 686 | | | 819 | | | 944 | | | 1,198 | | | (123 | ) | | -17.9 | % | | | (635 | ) | | -53.0 | % |
| | | | | | | | | | | | | | | | | | | | | | | | | | | | | |
Total commercial | | | 33,677 | | | 34,171 | | | 34,516 | | | 35,575 | | | 35,888 | | | (494 | ) | | -1.4 | % | | | (2,211 | ) | | -6.2 | % |
Commercial investor real estate mortgage | | | 15,586 | | | 16,220 | | | 16,292 | | | 16,470 | | | 16,081 | | | (634 | ) | | -3.9 | % | | | (495 | ) | | -3.1 | % |
Commercial investor real estate construction | | | 4,340 | | | 5,071 | | | 6,145 | | | 7,010 | | | 7,474 | | | (731 | ) | | -14.4 | % | | | (3,134 | ) | | -41.9 | % |
| | | | | | | | | | | | | | | | | | | | | | | | | | | | | |
Total investor real estate | | | 19,926 | | | 21,291 | | | 22,437 | | | 23,480 | | | 23,555 | | | (1,365 | ) | | -6.4 | % | | | (3,629 | ) | | -15.4 | % |
Residential first mortgage | | | 15,537 | | | 15,567 | | | 15,521 | | | 15,508 | | | 15,593 | | | (30 | ) | | -0.2 | % | | | (56 | ) | | -0.4 | % |
Home equity | | | 14,947 | | | 15,237 | | | 15,515 | | | 15,714 | | | 15,940 | | | (290 | ) | | -1.9 | % | | | (993 | ) | | -6.2 | % |
Indirect | | | 2,028 | | | 2,310 | | | 2,601 | | | 2,923 | | | 3,276 | | | (282 | ) | | -12.2 | % | | | (1,248 | ) | | -38.1 | % |
Other consumer | | | 1,151 | | | 1,147 | | | 1,176 | | | 1,154 | | | 1,130 | | | 4 | | | 0.3 | % | | | 21 | | | 1.9 | % |
| | | | | | | | | | | | | | | | | | | | | | | | | | | | | |
| | $ | 87,266 | | $ | 89,723 | | $ | 91,766 | | $ | 94,354 | | $ | 95,382 | | $ | (2,457 | ) | | -2.7 | % | | $ | (8,116 | ) | | -8.5 | % |
| | | | | | | | | | | | | | | | | | | | | | | | | | | | | |
FINANCIAL SUPPLEMENT TO
SECOND QUARTER 2010 EARNINGS RELEASE
PAGE 9
Deposits
Deposit Portfolio - Period End Data
| | | | | | | | | | | | | | | | | | | | | | | | | | | | | |
($ amounts in millions) | | 6/30/10 | | 3/31/10 | | 12/31/09 | | 9/30/09 | | 6/30/09 | | 6/30/10
vs. 3/31/10 | | | 6/30/10
vs. 6/30/09 | |
Customer Deposits | | | | | | | | | | | | | | | | | | | | | | | | | | | | | |
Interest-free deposits | | $ | 22,993 | | $ | 23,391 | | $ | 23,204 | | $ | 21,226 | | $ | 20,995 | | $ | (398 | ) | | -1.7 | % | | $ | 1,998 | | | 9.5 | % |
Interest-bearing checking | | | 15,148 | | | 15,715 | | | 15,791 | | | 13,688 | | | 14,140 | | | (567 | ) | | -3.6 | % | | | 1,008 | | | 7.1 | % |
Savings | | | 4,475 | | | 4,394 | | | 4,073 | | | 4,025 | | | 4,033 | | | 81 | | | 1.8 | % | | | 442 | | | 11.0 | % |
Money market - domestic | | | 26,773 | | | 26,196 | | | 23,291 | | | 22,327 | | | 21,571 | | | 577 | | | 2.2 | % | | | 5,202 | | | 24.1 | % |
Money market - foreign | | | 502 | | | 635 | | | 766 | | | 941 | | | 1,075 | | | (133 | ) | | -20.9 | % | | | (573 | ) | | -53.3 | % |
| | | | | | | | | | | | | | | | | | | | | | | | | | | | | |
Low-cost deposits | | | 69,891 | | | 70,331 | | | 67,125 | | | 62,207 | | | 61,814 | | | (440 | ) | | -0.6 | % | | | 8,077 | | | 13.1 | % |
Time deposits | | | 26,298 | | | 27,939 | | | 31,468 | | | 32,582 | | | 32,724 | | | (1,641 | ) | | -5.9 | % | | | (6,426 | ) | | -19.6 | % |
| | | | | | | | | | | | | | | | | | | | | | | | | | | | | |
Total customer deposits | | | 96,189 | | | 98,270 | | | 98,593 | | | 94,789 | | | 94,538 | | | (2,081 | ) | | -2.1 | % | | | 1,651 | | | 1.7 | % |
| | | | | | | | | | | | | | | | | | | | | | | | | | | | | |
Corporate Treasury Deposits | | | | | | | | | | | | | | | | | | | | | | | | | | | | | |
Time deposits | | | 61 | | | 62 | | | 87 | | | 91 | | | 188 | | | (1 | ) | | -1.6 | % | | | (127 | ) | | -67.6 | % |
| | | | | | | | | | | | | | | | | | | | | | | | | | | | | |
Total Deposits | | $ | 96,250 | | $ | 98,332 | | $ | 98,680 | | $ | 94,880 | | $ | 94,726 | | $ | (2,082 | ) | | -2.1 | % | | $ | 1,524 | | | 1.6 | % |
| | | | | | | | | | | | | | | | | | | | | | | | | | | | | |
|
| Deposit Portfolio - Average Balances | |
| | | | | | | |
($ amounts in millions) | | 2Q10 | | 1Q10 | | 4Q09 | | 3Q09 | | 2Q09 | | 2Q10
vs. 1Q10 | | | 2Q10
vs. 2Q09 | |
Customer Deposits | | | | | | | | | | | | | | | | | | | | | | | | | | | | | |
Interest-free deposits | | $ | 23,688 | | $ | 22,817 | | $ | 22,149 | | $ | 21,122 | | $ | 20,421 | | $ | 871 | | | 3.8 | % | | $ | 3,267 | | | 16.0 | % |
Interest-bearing checking | | | 15,651 | | | 15,709 | | | 14,279 | | | 13,934 | | | 14,277 | | | (58 | ) | | -0.4 | % | | | 1,374 | | | 9.6 | % |
Savings | | | 4,478 | | | 4,215 | | | 4,064 | | | 4,038 | | | 4,029 | | | 263 | | | 6.2 | % | | | 449 | | | 11.1 | % |
Money market - domestic | | | 26,670 | | | 24,961 | | | 22,956 | | | 22,103 | | | 20,962 | | | 1,709 | | | 6.8 | % | | | 5,708 | | | 27.2 | % |
Money market - foreign | | | 632 | | | 754 | | | 852 | | | 1,004 | | | 1,176 | | | (122 | ) | | -16.2 | % | | | (544 | ) | | -46.3 | % |
| | | | | | | | | | | | | | | | | | | | | | | | | | | | | |
Low-cost deposits | | | 71,119 | | | 68,456 | | | 64,300 | | | 62,201 | | | 60,865 | | | 2,663 | | | 3.9 | % | | | 10,254 | | | 16.8 | % |
Time deposits | | | 26,872 | | | 29,707 | | | 31,961 | | | 32,481 | | | 33,221 | | | (2,835 | ) | | -9.5 | % | | | (6,349 | ) | | -19.1 | % |
| | | | | | | | | | | | | | | | | | | | | | | | | | | | | |
Total customer deposits | | | 97,991 | | | 98,163 | | | 96,261 | | | 94,682 | | | 94,086 | | | (172 | ) | | -0.2 | % | | | 3,905 | | | 4.2 | % |
| | | | | | | | | | | | | | | | | | | | | | | | | | | | | |
Corporate Treasury Deposits | | | | | | | | | | | | | | | | | | | | | | | | | | | | | |
Time deposits | | | 61 | | | 72 | | | 85 | | | 103 | | | 221 | | | (11 | ) | | -15.3 | % | | | (160 | ) | | -72.4 | % |
Other | | | — | | | — | | | — | | | — | | | 728 | | | — | | | NM | | | | (728 | ) | | -100.0 | % |
| | | | | | | | | | | | | | | | | | | | | | | | | | | | | |
Total corporate treasury deposits | | | 61 | | | 72 | | | 85 | | | 103 | | | 949 | | | (11 | ) | | -15.3 | % | | | (888 | ) | | -93.6 | % |
| | | | | | | | | | | | | | | | | | | | | | | | | | | | | |
Total Deposits | | $ | 98,052 | | $ | 98,235 | | $ | 96,346 | | $ | 94,785 | | $ | 95,035 | | $ | (183 | ) | | -0.2 | % | | $ | 3,017 | | | 3.2 | % |
| | | | | | | | | | | | | | | | | | | | | | | | | | | | | |
FINANCIAL SUPPLEMENT TO
SECOND QUARTER 2010 EARNINGS RELEASE
PAGE 10
Pre-Tax Pre-Provision Net Revenue (“PPNR”)
| | | | | | | | | | | | | | | | | | | | | | | | | | | | | | | | | |
($ amounts in millions) | | 2Q10 | | 1Q10 | | | 4Q09 | | | 3Q09 | | | 2Q09 | | | 2Q10
vs. 1Q10 | | | 2Q10
vs. 2Q09 | |
Net Interest Income | | $ | 856 | | $ | 831 | | | $ | 850 | | | $ | 845 | | | $ | 831 | | | $ | 25 | | | 3.0 | % | | $ | 25 | | | 3.0 | % |
Non-Interest Income | | | 756 | | | 812 | | | | 718 | | | | 772 | | | | 1,199 | | | | (56 | ) | | -6.9 | % | | | (443 | ) | | -36.9 | % |
| | | | | | | | | | | | | | | | | | | | | | | | | | | | | | | | | |
Total Revenue | | | 1,612 | | | 1,643 | | | | 1,568 | | | | 1,617 | | | | 2,030 | | | | (31 | ) | | -1.9 | % | | | (418 | ) | | -20.6 | % |
Non-Interest Expense | | | 1,326 | | | 1,230 | | | | 1,219 | | | | 1,243 | | | | 1,231 | | | | 96 | | | 7.8 | % | | | 95 | | | 7.7 | % |
| | | | | | | | | | | | | | | | | | | | | | | | | | | | | | | | | |
Pre-tax Pre-provision Net Revenue | | $ | 286 | | $ | 413 | | | $ | 349 | | | $ | 374 | | | $ | 799 | | | | (127 | ) | | -30.8 | % | | | (513 | ) | | -64.2 | % |
Adjustments: | | | | | | | | | | | | | | | | | | | | | | | | | | | | | | | | | |
Regulatory charge | | | 200 | | | | | | | — | | | | — | | | | — | | | | 200 | | | NM | | | | 200 | | | NM | |
Securities (gains) losses, net | | | — | | | (59 | ) | | | 96 | | | | (4 | ) | | | (108 | ) | | | 59 | | | NM | | | | 108 | | | NM | |
Gain on sale of Visa shares | | | — | | | — | | | | — | | | | — | | | | (80 | ) | | | — | | | NM | | | | 80 | | | NM | |
Leveraged lease termination gains | | | — | | | (19 | ) | | | (71 | ) | | | (4 | ) | | | (189 | ) | | | 19 | | | NM | | | | 189 | | | NM | |
Loss (gain) on extinguishment of debt | | | — | | | 53 | | | | — | | | | — | | | | (61 | ) | | | (53 | ) | | NM | | | | 61 | | | NM | |
FDIC special assessment | | | — | | | — | | | | — | | | | — | | | | 64 | | | | — | | | NM | | | | (64 | ) | | NM | |
Securities impairment, net | | | — | | | 1 | | | | — | | | | 3 | | | | 69 | | | | (1 | ) | | NM | | | | (69 | ) | | NM | |
Branch consolidation costs (1) | | | — | | | 8 | | | | 12 | | | | 41 | | | | — | | | | (8 | ) | | NM | | | | — | | | NM | |
| | | | | | | | | | | | | | | | | | | | | | | | | | | | | | | | | |
Total adjustments | | | 200 | | | (16 | ) | | | 37 | | | | 36 | | | | (305 | ) | | | 216 | | | NM | | | | 505 | | | NM | |
| | | | | | | | | | | | | | | | | | | | | | | | | | | | | | | | | |
Adjusted PPNR | | $ | 486 | | $ | 397 | | | $ | 386 | | | $ | 410 | | | $ | 494 | | | $ | 89 | | | 22.4 | % | | $ | (8 | ) | | -1.6 | % |
| | | | | | | | | | | | | | | | | | | | | | | | | | | | | | | | | |
| (1) | Includes $7 million of net occupancy expense and $1 million in valuation charges in 1Q10; $3 million of net occupancy expense, $6 million of salary expense and $3 million in valuation charges in 4Q09; and $9 million of net occupancy expense, $7 million of furniture and equipment expense and $25 million in valuation charges in 3Q09. |
Categorization of Income related to
Mortgage Servicing Rights (MSRs) (2)
| | | | | | | | | | | | | | | | | | | | | | | | | | | |
($ amounts in millions) | | 2Q10 | | 1Q10 | | 4Q09 | | | 3Q09 | | 2Q09 | | | 2Q10
vs. 1Q10 | | | 2Q10
vs. 2Q09 |
Net interest income (3) | | $ | — | | $ | 3 | | $ | 20 | | | $ | — | | $ | — | | | (3 | ) | | NM | | | — | | NM |
Brokerage, investment banking and capital markets (4) | | | — | | | 4 | | | 5 | | | | — | | | — | | | (4 | ) | | NM | | | — | | NM |
Mortgage income (5) | | | 12 | | | 16 | | | (4 | ) | | | 19 | | | (2 | ) | | (4 | ) | | -25.0 | % | | 14 | | NM |
| | | | | | | | | | | | | | | | | | | | | | | | | | | |
| | $ | 12 | | $ | 23 | | $ | 21 | | | $ | 19 | | $ | (2 | ) | | (11 | ) | | -47.8 | % | | 14 | | NM |
| | | | | | | | | | | | | | | | | | | | | | | | | | | |
| (2) | This table details the impact of changes in valuation of mortgage servicing rights and related hedging instruments on various categories in the consolidated statements of operations. |
| (3) | Interest earned on trading securities used to hedge MSRs. |
| (4) | Mark-to-market impact of trading securities used to hedge MSRs. |
| (5) | Net effect of mark-to-market impact of MSRs and derivatives used to hedge MSRs. |
FINANCIAL SUPPLEMENT TO
SECOND QUARTER 2010 EARNINGS RELEASE
PAGE 11
Non-Interest Income and Expense from Continuing Operations
Non-Interest Income and Expense
Non-Interest Income
| | | | | | | | | | | | | | | | | | | | | | | | | | | | | | |
($ amounts in millions) | | 2Q10 | | 1Q10 | | 4Q09 | | | 3Q09 | | 2Q09 | | 2Q10
vs. 1Q10 | | | 2Q10
vs. 2Q09 | |
Service charges on deposit accounts | | $ | 302 | | $ | 288 | | $ | 299 | | | $ | 300 | | $ | 288 | | $ | 14 | | | 4.9 | % | | $ | 14 | | | 4.9 | % |
Brokerage, investment banking and capital markets | | | 254 | | | 236 | | | 257 | | | | 252 | | | 263 | | | 18 | | | 7.6 | % | | | (9 | ) | | -3.4 | % |
Mortgage income | | | 63 | | | 67 | | | 46 | | | | 76 | | | 64 | | | (4 | ) | | -6.0 | % | | | (1 | ) | | -1.6 | % |
Trust department income | | | 49 | | | 48 | | | 48 | | | | 49 | | | 48 | | | 1 | | | 2.1 | % | | | 1 | | | 2.1 | % |
Securities gains (losses), net | | | — | | | 59 | | | (96 | ) | | | 4 | | | 108 | | | (59 | ) | | NM | | | | (108 | ) | | NM | |
Insurance income | | | 26 | | | 27 | | | 25 | | | | 25 | | | 27 | | | (1 | ) | | -3.7 | % | | | (1 | ) | | -3.7 | % |
Leveraged lease termination gains | | | — | | | 19 | | | 71 | | | | 4 | | | 189 | | | (19 | ) | | NM | | | | (189 | ) | | NM | |
Visa shares sale gain | | | — | | | — | | | — | | | | — | | | 80 | | | — | | | NM | | | | (80 | ) | | NM | |
Gain on early extinguishment of debt | | | — | | | — | | | — | | | | — | | | 61 | | | — | | | NM | | | | (61 | ) | | NM | |
Other | | | 62 | | | 68 | | | 68 | | | | 62 | | | 71 | | | (6 | ) | | -8.8 | % | | | (9 | ) | | -12.7 | % |
| | | | | | | | | | | | | | | | | | | | | | | | | | | | | | |
Total non-interest income | | $ | 756 | | $ | 812 | | $ | 718 | | | $ | 772 | | $ | 1,199 | | $ | (56 | ) | | -6.9 | % | | $ | (443 | ) | | -36.9 | % |
| | | | | | | | | | | | | | | | | | | | | | | | | | | | | | |
| | | | | | | | | |
| Non-Interest Expense | | | | | | | | | | | | | | | | | | | | | | | | | | | | | | |
| | | | | | | |
($ amounts in millions) | | 2Q10 | | 1Q10 | | 4Q09 | | | 3Q09 | | 2Q09 | | 2Q10
vs. 1Q10 | | | 2Q10
vs. 2Q09 | |
Salaries and employee benefits | | $ | 560 | | $ | 575 | | $ | 566 | | | $ | 578 | | $ | 586 | | $ | (15 | ) | | -2.6 | % | | $ | (26 | ) | | -4.4 | % |
Net occupancy expense | | | 110 | | | 120 | | | 114 | | | | 121 | | | 112 | | | (10 | ) | | -8.3 | % | | | (2 | ) | | -1.8 | % |
Furniture and equipment expense | | | 79 | | | 74 | | | 74 | | | | 83 | | | 78 | | | 5 | | | 6.8 | % | | | 1 | | | 1.3 | % |
Professional and legal fees | | | 75 | | | 66 | | | 108 | | | | 98 | | | 50 | | | 9 | | | 13.6 | % | | | 25 | | | 50.0 | % |
Marketing expense | | | 18 | | | 15 | | | 18 | | | | 20 | | | 20 | | | 3 | | | 20.0 | % | | | (2 | ) | | -10.0 | % |
Amortization of core deposit intangible | | | 27 | | | 28 | | | 29 | | | | 30 | | | 30 | | | (1 | ) | | -3.6 | % | | | (3 | ) | | -10.0 | % |
Other real estate owned expense | | | 41 | | | 42 | | | 64 | | | | 61 | | | 24 | | | (1 | ) | | -2.4 | % | | | 17 | | | 70.8 | % |
Other-than-temporary impairments, net | | | — | | | 1 | | | — | | | | 3 | | | 69 | | | (1 | ) | | NM | | | | (69 | ) | | NM | |
FDIC premiums - special assessment | | | — | | | — | | | — | | | | — | | | 64 | | | — | | | NM | | | | (64 | ) | | NM | |
FDIC premiums | | | 58 | | | 59 | | | 54 | | | | 56 | | | 43 | | | (1 | ) | | -1.7 | % | | | 15 | | | 34.9 | % |
Valuation charges associated with branch consolidations | | | — | | | 1 | | | 3 | | | | 25 | | | — | | | (1 | ) | | NM | | | | — | | | — | |
Loss on early extinguishment of debt | | | — | | | 53 | | | — | | | | — | | | — | | | (53 | ) | | NM | | | | — | | | — | |
Regulatory charge | | | 200 | | | — | | | — | | | | — | | | — | | | 200 | | | NM | | | | 200 | | | NM | |
Other | | | 158 | | | 196 | | | 189 | | | | 168 | | | 155 | | | (38 | ) | | -19.4 | % | | | 3 | | | 1.9 | % |
| | | | | | | | | | | | | | | | | | | | | | | | | | | | | | |
Total non-interest expense | | $ | 1,326 | | $ | 1,230 | | $ | 1,219 | | | $ | 1,243 | | $ | 1,231 | | $ | 96 | | | 7.8 | % | | $ | 95 | | | 7.7 | % |
| | | | | | | | | | | | | | | | | | | | | | | | | | | | | | |
| | • | | Excluding prior quarter’s gains on sale of securities and leveraged lease terminations, non-interest revenue increased $22 million or 3% versus the prior quarter |
| | • | | Service charges income increased 5% linked quarter, driven by higher interchange transaction activity. Policy changes associated with Regulation E began in the second quarter and will be fully implemented during the third quarter. |
| | • | | Brokerage income increased $18 million to $254 million, driven by higher private client revenue, fixed income capital markets, as well as improved investment banking activity |
| | • | | Mortgage income declined $4 million linked quarter, primarily reflecting the impact of a reduced benefit from mortgage servicing rights hedging activities. Origination volumes increased $400 million to $1.8 billion, with over half of originations reflecting new purchase activity. |
| | • | | Non-interest expenses, as adjusted for prior quarter’s branch consolidation charges, loss on early extinguishment of debt, and current quarter’s regulatory charge, declined 4% linked quarter |
| | • | | Salaries and benefits expense declined $15 million linked quarter, driven by lower headcount and a seasonal payroll tax decline |
| | • | | Professional and legal fees increased $9 million linked quarter, reflecting higher Morgan Keegan and credit-related costs |
| | • | | Other real estate owned expense and gains/losses on loans held for sale (included in other non-interest expense) improved by $22 million linked quarter, driven by improved sales pricing and a decline in foreclosed properties |
FINANCIAL SUPPLEMENT TO
SECOND QUARTER 2010 EARNINGS RELEASE
PAGE 12
Morgan Keegan
Morgan Keegan
Summary Income Statement (1)
| | | | | | | | | | | | | | | | | | | | | | | | | | | | | | |
($ amounts in millions) | | 2Q10 | | | 1Q10 | | 4Q09 | | 3Q09 | | 2Q09 | | 2Q10
vs. 1Q10 | | | 2Q10
vs. 2Q09 | |
Revenues: | | | | | | | | | | | | | | | | | | | | | | | | | | | | | | |
Commissions | | $ | 55 | | | $ | 54 | | $ | 52 | | $ | 53 | | $ | 48 | | $ | 1 | | | 1.9 | % | | $ | 7 | | | 14.6 | % |
Principal transactions | | | 85 | | | | 98 | | | 100 | | | 116 | | | 122 | | | (13 | ) | | -13.3 | % | | | (37 | ) | | -30.3 | % |
Investment banking | | | 61 | | | | 51 | | | 67 | | | 50 | | | 56 | | | 10 | | | 19.6 | % | | | 5 | | | 8.9 | % |
Interest | | | 18 | | | | 17 | | | 17 | | | 17 | | | 19 | | | 1 | | | 5.9 | % | | | (1 | ) | | -5.3 | % |
Trust fees and services | | | 47 | | | | 45 | | | 45 | | | 47 | | | 44 | | | 2 | | | 4.4 | % | | | 3 | | | 6.8 | % |
Investment advisory | | | 36 | | | | 28 | | | 38 | | | 44 | | | 32 | | | 8 | | | 28.6 | % | | | 4 | | | 12.5 | % |
Other | | | 8 | | | | 21 | | | 18 | | | 6 | | | 16 | | | (13 | ) | | -61.9 | % | | | (8 | ) | | -50.0 | % |
| | | | | | | | | | | | | | | | | | | | | | | | | | | | | | |
Total revenues | | | 310 | | | | 314 | | | 337 | | | 333 | | | 337 | | | (4 | ) | | -1.3 | % | | | (27 | ) | | -8.0 | % |
Expenses: | | | | | | | | | | | | | | | | | | | | | | | | | | | | | | |
Interest expense | | | 3 | | | | 3 | | | 3 | | | 3 | | | 5 | | | — | | | 0.0 | % | | | (2 | ) | | -40.0 | % |
Regulatory charge | | | 200 | | | | — | | | — | | | — | | | — | | | 200 | | | NM | | | | 200 | | | NM | |
Other non-interest expense | | | 275 | | | | 272 | | | 305 | | | 284 | | | 285 | | | 3 | | | 1.1 | % | | | (10 | ) | | -3.5 | % |
| | | | | | | | | | | | | | | | | | | | | | | | | | | | | | |
Total expenses | | | 478 | | | | 275 | | | 308 | | | 287 | | | 290 | | | 203 | | | 73.8 | % | | | 188 | | | 64.8 | % |
| | | | | | | | | | | | | | | | | | | | | | | | | | | | | | |
Income (loss) before income taxes | | | (168 | ) | | | 39 | | | 29 | | | 46 | | | 47 | | | (207 | ) | | NM | | | | (215 | ) | | NM | |
Income taxes | | | 12 | | | | 14 | | | 11 | | | 17 | | | 17 | | | (2 | ) | | -14.3 | % | | | (5 | ) | | -29.4 | % |
| | | | | | | | | | | | | | | | | | | | | | | | | | | | | | |
Net income (loss) | | $ | (180 | ) | | $ | 25 | | $ | 18 | | $ | 29 | | $ | 30 | | $ | (205 | ) | | NM | | | $ | (210 | ) | | NM | |
| | | | | | | | | | | | | | | | | | | | | | | | | | | | | | |
Breakout of Revenue by Division (2)
| | | | | | | | | | | | | | | | | | | | | | | | | | | | |
($ amounts in millions) | | Private
Client | | | Fixed-
Income
Capital
Markets | | | Equity
Capital
Markets | | | Investment
Banking | | | Regions
MK
Trust | | | Asset
Management | | | Interest
&
Other | |
Three months ended June 30, 2010 | | | | | | | | | | | | | | | | | | | | | | | | | | | | |
$ amount of revenue | | $ | 119 | | | $ | 79 | | | $ | 15 | | | $ | 35 | | | $ | 52 | | | $ | 5 | | | $ | 5 | |
% of gross revenue | | | 38.4 | % | | | 25.5 | % | | | 4.8 | % | | | 11.3 | % | | | 16.8 | % | | | 1.6 | % | | | 1.6 | % |
Three months ended March 31, 2010 | | | | | | | | | | | | | | | | | | | | | | | | | | | | |
$ amount of revenue | | $ | 114 | | | $ | 72 | | | $ | 13 | | | $ | 27 | | | $ | 49 | | | $ | 4 | | | $ | 35 | |
% of gross revenue | | | 36.3 | % | | | 22.9 | % | | | 4.1 | % | | | 8.6 | % | | | 15.6 | % | | | 1.3 | % | | | 11.2 | % |
Six months ended June 30, 2010 | | | | | | | | | | | | | | | | | | | | | | | | | | | | |
$ amount of revenue | | $ | 233 | | | $ | 151 | | | $ | 28 | | | $ | 62 | | | $ | 101 | | | $ | 9 | | | $ | 40 | |
% of gross revenue | | | 37.3 | % | | | 24.2 | % | | | 4.5 | % | | | 9.9 | % | | | 16.2 | % | | | 1.4 | % | | | 6.5 | % |
Six months ended June 30, 2009 | | | | | | | | | | | | | | | | | | | | | | | | | | | | |
$ amount of revenue | | $ | 199 | | | $ | 182 | | | $ | 28 | | | $ | 44 | | | $ | 97 | | | $ | 18 | | | $ | 43 | |
% of gross revenue | | | 32.6 | % | | | 29.8 | % | | | 4.6 | % | | | 7.2 | % | | | 15.9 | % | | | 2.9 | % | | | 7.0 | % |
| (1) | Certain amounts in the prior periods have been reclassified to reflect current period presentation |
| (2) | “Breakout of Revenue by Division” has been adjusted to reflect changes in the company’s reporting structure |
| | • | | Fixed Income Capital Markets revenue remained strong, benefiting from higher municipal issuances as well as institutional customers’ continued demand for Treasury products. |
| | • | | Investment Banking revenues for the quarter were strong due to several large municipal financing engagements, including those related to underwriting Build America Bonds. Shattuck Hammond, an independent division specializing in healthcare M&A, also had a solid quarter leading a number of transactions. |
| | • | | Morgan Keegan ended the first half of 2010 as the 8th leading underwriter of municipal bonds and the leading underwriter of Build America Bonds, according to Thomson Reuters |
FINANCIAL SUPPLEMENT TO
SECOND QUARTER 2010 EARNINGS RELEASE
PAGE 13
Credit Quality
Credit Quality
| | | | | | | | | | | | | | | | | | | | |
| | | As of and for Quarter Ended | |
($ amounts in millions) | | 6/30/10 | | | 3/31/10 | | | 12/31/09 | | | 9/30/09 | | | 6/30/09 | |
Allowance for credit losses (ACL) | | $ | 3,256 | | | $ | 3,250 | | | $ | 3,188 | | | $ | 2,690 | | | $ | 2,335 | |
Provision for loan losses | | | 651 | | | | 770 | | | | 1,179 | | | | 1,025 | | | | 912 | |
Provision for unfunded credit losses | | | 5 | | | | (8 | ) | | | 10 | | | | 10 | | | | (21 | ) |
Net loans charged-off:* | | | | | | | | | | | | | | | | | | | | |
Commercial and industrial | | | 87 | | | | 92 | | | | 76 | | | | 137 | | | | 84 | |
Commercial real estate mortgage - owner-occupied | | | 39 | | | | 32 | | | | 38 | | | | 17 | | | | 15 | |
Commercial real estate construction - owner-occupied | | | 3 | | | | 14 | | | | 9 | | | | 2 | | | | 3 | |
| | | | | | | | | | | | | | | | | | | | |
Total commercial | | | 129 | | | | 138 | | | | 123 | | | | 156 | | | | 102 | |
Commercial investor real estate mortgage | | | 203 | | | | 207 | | | | 210 | | | | 196 | | | | 90 | |
Commercial investor real estate construction | | | 133 | | | | 150 | | | | 159 | | | | 148 | | | | 111 | |
| | | | | | | | | | | | | | | | | | | | |
Total investor real estate | | | 336 | | | | 357 | | | | 369 | | | | 344 | | | | 201 | |
Residential first mortgage | | | 61 | | | | 62 | | | | 55 | | | | 57 | | | | 51 | |
Home equity | | | 106 | | | | 116 | | | | 113 | | | | 94 | | | | 113 | |
Indirect | | | 4 | | | | 8 | | | | 10 | | | | 10 | | | | 11 | |
Other consumer | | | 15 | | | | 19 | | | | 22 | | | | 19 | | | | 13 | |
| | | | | | | | | | | | | | | | | | | | |
Total | | $ | 651 | | | $ | 700 | | | $ | 692 | | | $ | 680 | | | $ | 491 | |
| | | | | | | | | | | | | | | | | | | | |
Net loan charge-offs as a % of average loans, annualized * | | | | | | | | | | | | | | | | | | | | |
Commercial and industrial | | | 1.65 | % | | | 1.74 | % | | | 1.39 | % | | | 2.43 | % | | | 1.49 | % |
Commercial real estate mortgage - owner-occupied | | | 1.28 | % | | | 1.09 | % | | | 1.26 | % | | | 0.55 | % | | | 0.51 | % |
Commercial real estate construction - owner-occupied | | | 2.17 | % | | | 8.41 | % | | | 4.45 | % | | | 0.88 | % | | | 1.00 | % |
| | | | | | | | | | | | | | | | | | | | |
Total commercial | | | 1.53 | % | | | 1.64 | % | | | 1.41 | % | | | 1.73 | % | | | 1.15 | % |
Commercial investor real estate mortgage | | | 5.22 | % | | | 5.17 | % | | | 5.11 | % | | | 4.74 | % | | | 2.23 | % |
Commercial investor real estate construction | | | 12.33 | % | | | 12.00 | % | | | 10.26 | % | | | 8.40 | % | | | 5.94 | % |
| | | | | | | | | | | | | | | | | | | | |
Total investor real estate | | | 6.77 | % | | | 6.80 | % | | | 6.52 | % | | | 5.83 | % | | | 3.40 | % |
Residential first mortgage | | | 1.58 | % | | | 1.63 | % | | | 1.40 | % | | | 1.45 | % | | | 1.31 | % |
Home equity | | | 2.84 | % | | | 3.07 | % | | | 2.89 | % | | | 2.37 | % | | | 2.85 | % |
Indirect | | | 0.72 | % | | | 1.38 | % | | | 1.58 | % | | | 1.46 | % | | | 1.31 | % |
Other consumer | | | 5.23 | % | | | 6.68 | % | | | 7.37 | % | | | 6.21 | % | | | 4.78 | % |
| | | | | | | | | | | | | | | | | | | | |
Total | | | 2.99 | % | | | 3.16 | % | | | 2.99 | % | | | 2.86 | % | | | 2.06 | % |
| | | | | | | | | | | | | | | | | | | | |
Non-accrual loans | | $ | 3,473 | | | $ | 3,706 | | | $ | 3,488 | | | $ | 3,216 | | | $ | 2,618 | |
Foreclosed properties | | | 546 | | | | 610 | | | | 607 | | | | 503 | | | | 439 | |
| | | | | | | | | | | | | | | | | | | | |
Non-performing assets, excluding loans held for sale | | $ | 4,019 | | | $ | 4,316 | | | $ | 4,095 | | | $ | 3,719 | | | $ | 3,057 | |
Non-performing loans held for sale | | | 256 | | | | 256 | | | | 317 | | | | 380 | | | | 371 | |
| | | | | | | | | | | | | | | | | | | | |
Non-performing assets (NPAs) | | $ | 4,275 | | | $ | 4,572 | | | $ | 4,412 | | | $ | 4,099 | | | $ | 3,428 | |
| | | | | | | | | | | | | | | | | | | | |
Loans past due > 90 days* | | $ | 612 | | | $ | 700 | | | $ | 688 | | | $ | 643 | | | $ | 613 | |
Commercial loans restructured not included in categories above | | $ | 47 | | | $ | 48 | | | $ | 25 | | | $ | 16 | | | $ | 11 | |
Consumer loans restructured not included in categories above** | | $ | 1,192 | | | $ | 1,258 | | | $ | 1,583 | | | $ | 1,400 | | | $ | 1,167 | |
| | | | | | | | | | | | | | | | | | | | |
Total restructured loans not included in categories above | | $ | 1,239 | | | $ | 1,306 | | | $ | 1,608 | | | $ | 1,416 | | | $ | 1,178 | |
| | | | | | | | | | | | | | | | | | | | |
Credit Ratios: | | | | | | | | | | | | | | | | | | | | |
ACL/Loans, net | | | 3.79 | % | | | 3.69 | % | | | 3.52 | % | | | 2.90 | % | | | 2.43 | % |
ALL/Loans, net | | | 3.71 | % | | | 3.61 | % | | | 3.43 | % | | | 2.83 | % | | | 2.37 | % |
Allowance for loan losses to non-performing loans - excludes loans held for sale | | | 0.92x | | | | 0.86x | | | | 0.89x | | | | 0.82x | | | | 0.87x | |
NPAs (ex. 90+ past due)/Loans and foreclosed properties | | | 4.94 | % | | | 5.15 | % | | | 4.83 | % | | | 4.40 | % | | | 3.55 | % |
NPAs (ex. 90+ past due)/Loans and foreclosed properties - excludes loans held for sale | | | 4.65 | % | | | 4.86 | % | | | 4.49 | % | | | 3.99 | % | | | 3.17 | % |
NPAs (inc. 90+ past due)/Loans and foreclosed properties | | | 5.65 | % | | | 5.94 | % | | | 5.59 | % | | | 5.08 | % | | | 4.18 | % |
NPAs (inc. 90+ past due)/Loans and foreclosed properties - excludes loans held for sale | | | 5.35 | % | | | 5.65 | % | | | 5.24 | % | | | 4.68 | % | | | 3.80 | % |
| * | See pages 14-17 for loan portfolio (risk view) breakout |
| ** | At 6/30/10, 70 percent of consumer loans restructured not included in categories above consist of residential first mortgages. |
Allowance for Credit Losses
| | | | | | | | |
| | | Six Months Ended June 30 | |
($ amounts in millions) | | 2010 | | | 2009 | |
Balance at beginning of year | | $ | 3,188 | | | $ | 1,900 | |
Net loans charged-off | | | (1,350 | ) | | | (881 | ) |
Provision for loan losses | | | 1,421 | | | | 1,337 | |
Provision for unfunded credit commitments | | | (3 | ) | | | (21 | ) |
| | | | | | | | |
Balance at end of period | | $ | 3,256 | | | $ | 2,335 | |
| | | | | | | | |
Components: | | | | | | | | |
Allowance for loan losses | | $ | 3,185 | | | $ | 2,282 | |
Reserve for unfunded credit commitments | | | 71 | | | | 53 | |
| | | | | | | | |
Allowance for credit losses | | $ | 3,256 | | | $ | 2,335 | |
| | | | | | | | |
FINANCIAL SUPPLEMENT TO
SECOND QUARTER 2010 EARNINGS RELEASE
PAGE 14
Total Loan Portfolio
Risk View
| | | | | | | | | | | | | | | | | | | | | | | | | |
| | | 2Q2010 | | | 1Q2010 | | | 4Q2009 | | | 3Q2009 | | | 2Q2009 | |
($ millions) | | $ | | % Total | | | $ | | % Total | | | $ | | % Total | | | $ | | % Total | | | $ | | % Total | |
Commercial and Industrial | | 21,096 | | 24.6 | % | | 21,220 | | 24.1 | % | | 21,547 | | 23.8 | % | | 21,925 | | 23.6 | % | | 23,619 | | 24.6 | % |
Commercial Real Estate Mortgage - OO | | 11,967 | | 13.9 | % | | 12,028 | | 13.6 | % | | 12,054 | | 13.3 | % | | 12,103 | | 13.0 | % | | 12,282 | | 12.8 | % |
Commercial Real Estate Construction - OO | | 547 | | 0.6 | % | | 598 | | 0.7 | % | | 751 | | 0.8 | % | | 875 | | 0.9 | % | | 1,060 | | 1.1 | % |
| | | | | | | | | | | | | | | | | | | | | | | | | |
Total Commercial | | 33,610 | | 39.1 | % | | 33,846 | | 38.4 | % | | 34,352 | | 37.9 | % | | 34,903 | | 37.6 | % | | 36,961 | | 38.4 | % |
| | | | | | | | | | | | | | | | | | | | | | | | | |
Commercial Investor Real Estate Mortgage | | 15,152 | | 17.6 | % | | 15,702 | | 17.8 | % | | 16,109 | | 17.8 | % | | 16,190 | | 17.5 | % | | 16,419 | | 17.1 | % |
Commercial Investor Real Estate Construction | | 3,778 | | 4.4 | % | | 4,703 | | 5.3 | % | | 5,591 | | 6.2 | % | | 6,616 | | 7.1 | % | | 7,163 | | 7.4 | % |
| | | | | | | | | | | | | | | | | | | | | | | | | |
Total Investor Real Estate | | 18,930 | | 22.0 | % | | 20,405 | | 23.1 | % | | 21,700 | | 23.9 | % | | 22,806 | | 24.6 | % | | 23,582 | | 24.5 | % |
| | | | | | | | | | | | | | | | | | | | | | | | | |
Residential First Mortgage | | 15,567 | | 18.1 | % | | 15,592 | | 17.7 | % | | 15,632 | | 17.2 | % | | 15,513 | | 16.7 | % | | 15,564 | | 16.2 | % |
Home Equity | | 14,802 | | 17.2 | % | | 15,066 | | 17.1 | % | | 15,381 | | 17.0 | % | | 15,630 | | 16.9 | % | | 15,796 | | 16.4 | % |
Direct | | 799 | | 0.9 | % | | 774 | | 0.9 | % | | 783 | | 0.9 | % | | 797 | | 0.9 | % | | 786 | | 0.8 | % |
Indirect | | 1,900 | | 2.2 | % | | 2,162 | | 2.5 | % | | 2,452 | | 2.7 | % | | 2,755 | | 3.0 | % | | 3,099 | | 3.2 | % |
Other Consumer | | 337 | | 0.4 | % | | 329 | | 0.4 | % | | 374 | | 0.4 | % | | 350 | | 0.4 | % | | 361 | | 0.4 | % |
| | | | | | | | | | | | | | | | | | | | | | | | | |
Total Consumer | | 33,405 | | 38.9 | % | | 33,923 | | 38.5 | % | | 34,622 | | 38.2 | % | | 35,045 | | 37.8 | % | | 35,606 | | 37.0 | % |
| | | | | | | | | | | | | | | | | | | | | | | | | |
Total Loans | | 85,945 | | 100.0 | % | | 88,174 | | 100.0 | % | | 90,674 | | 100.0 | % | | 92,754 | | 100.0 | % | | 96,149 | | 100.0 | % |
| | | | | | | | | | | | | | | | | | | | | | | | | |
OO = Owner Occupied
FINANCIAL SUPPLEMENT TO
SECOND QUARTER 2010 EARNINGS RELEASE
PAGE 15
Net Charge-Offs
Risk View
| | | | | | | | | | | | | | | | | | | | | | | | | |
| | | 2Q2010 | | | 1Q2010 | | | 4Q2009 | | | 3Q2009 | | | 2Q2009 | |
($ millions) | | $ | | % | | | $ | | % | | | $ | | % | | | $ | | % | | | $ | | % | |
Commercial and Industrial | | 87 | | 1.65 | % | | 92 | | 1.74 | % | | 76 | | 1.39 | % | | 137 | | 2.43 | % | | 84 | | 1.49 | % |
Commercial Real Estate Mortgage - OO | | 39 | | 1.28 | % | | 32 | | 1.09 | % | | 38 | | 1.26 | % | | 17 | | 0.55 | % | | 15 | | 0.51 | % |
Commercial Real Estate Construction - OO | | 3 | | 2.17 | % | | 14 | | 8.41 | % | | 9 | | 4.45 | % | | 2 | | 0.88 | % | | 3 | | 1.00 | % |
| | | | | | | | | | | | | | | | | | | | | | | | | |
Total Commercial | | 129 | | 1.53 | % | | 138 | | 1.64 | % | | 123 | | 1.41 | % | | 156 | | 1.73 | % | | 102 | | 1.15 | % |
| | | | | | | | | | | | | | | | | | | | | | | | | |
Commercial Investor Real Estate Mortgage | | 203 | | 5.22 | % | | 207 | | 5.17 | % | | 210 | | 5.11 | % | | 196 | | 4.74 | % | | 90 | | 2.23 | % |
Commercial Investor Real Estate Construction | | 133 | | 12.33 | % | | 150 | | 12.00 | % | | 159 | | 10.26 | % | | 148 | | 8.40 | % | | 111 | | 5.94 | % |
| | | | | | | | | | | | | | | | | | | | | | | | | |
Total Investor Real Estate | | 336 | | 6.77 | % | | 357 | | 6.80 | % | | 369 | | 6.52 | % | | 344 | | 5.83 | % | | 201 | | 3.40 | % |
| | | | | | | | | | | | | | | | | | | | | | | | | |
Residential First Mortgage | | 61 | | 1.58 | % | | 62 | | 1.63 | % | | 55 | | 1.40 | % | | 57 | | 1.45 | % | | 51 | | 1.31 | % |
Home Equity | | 106 | | 2.84 | % | | 116 | | 3.07 | % | | 113 | | 2.89 | % | | 94 | | 2.37 | % | | 113 | | 2.85 | % |
Direct | | 3 | | 1.51 | % | | 4 | | 1.85 | % | | 4 | | 2.07 | % | | 5 | | 2.47 | % | | 3 | | 1.59 | % |
Indirect | | 4 | | 0.72 | % | | 8 | | 1.38 | % | | 10 | | 1.58 | % | | 10 | | 1.46 | % | | 11 | | 1.31 | % |
Other Consumer | | 12 | | 13.47 | % | | 15 | | 16.90 | % | | 18 | | 18.46 | % | | 14 | | 15.61 | % | | 10 | | 12.00 | % |
| | | | | | | | | | | | | | | | | | | | | | | | | |
Total Consumer | | 186 | | 2.22 | % | | 205 | | 2.42 | % | | 200 | | 2.28 | % | | 180 | | 2.03 | % | | 188 | | 2.10 | % |
| | | | | | | | | | | | | | | | | | | | | | | | | |
Total Net Charge-Offs | | 651 | | 2.99 | % | | 700 | | 3.16 | % | | 692 | | 2.99 | % | | 680 | | 2.86 | % | | 491 | | 2.06 | % |
| | | | | | | | | | | | | | | | | | | | | | | | | |
OO = Owner Occupied
FINANCIAL SUPPLEMENT TO
SECOND QUARTER 2010 EARNINGS RELEASE
PAGE 16
90+ Days Past Due Loans
Risk View
| | | | | | | | | | | | | | | | | | | | | | | | | |
| | | 2Q2010 | | | 1Q2010 | | | 4Q2009 | | | 3Q2009 | | | 2Q2009 | |
($ millions) | | $ | | % | | | $ | | % | | | $ | | % | | | $ | | % | | | $ | | % | |
Commercial and Industrial | | 7 | | 0.03 | % | | 24 | | 0.11 | % | | 24 | | 0.11 | % | | 13 | | 0.06 | % | | 14 | | 0.06 | % |
Commercial Real Estate Mortgage - OO | | 4 | | 0.04 | % | | 6 | | 0.05 | % | | 16 | | 0.13 | % | | 12 | | 0.10 | % | | 17 | | 0.14 | % |
Commercial Real Estate Construction - OO | | — | | 0.00 | % | | — | | 0.00 | % | | 2 | | 0.24 | % | | 1 | | 0.10 | % | | 3 | | 0.29 | % |
| | | | | | | | | | | | | | | | | | | | | | | | | |
Total Commercial | | 11 | | 0.03 | % | | 30 | | 0.09 | % | | 42 | | 0.12 | % | | 26 | | 0.07 | % | | 34 | | 0.09 | % |
| | | | | | | | | | | | | | | | | | | | | | | | | |
Commercial Investor Real Estate Mortgage | | 26 | | 0.17 | % | | 42 | | 0.27 | % | | 22 | | 0.14 | % | | 29 | | 0.18 | % | | 46 | | 0.28 | % |
Commercial Investor Real Estate Construction | | 4 | | 0.10 | % | | 6 | | 0.14 | % | | 8 | | 0.14 | % | | 11 | | 0.16 | % | | 13 | | 0.18 | % |
| | | | | | | | | | | | | | | | | | | | | | | | | |
Total Investor Real Estate | | 30 | | 0.16 | % | | 48 | | 0.24 | % | | 30 | | 0.14 | % | | 40 | | 0.18 | % | | 59 | | 0.25 | % |
| | | | | | | | | | | | | | | | | | | | | | | | | |
Residential First Mortgage | | 349 | | 2.24 | % | | 365 | | 2.34 | % | | 361 | | 2.31 | % | | 345 | | 2.23 | % | | 360 | | 2.32 | % |
Home Equity | | 215 | | 1.45 | % | | 249 | | 1.65 | % | | 241 | | 1.57 | % | | 222 | | 1.42 | % | | 148 | | 0.94 | % |
Direct | | 1 | | 0.14 | % | | 1 | | 0.17 | % | | 2 | | 0.30 | % | | 2 | | 0.22 | % | | 2 | | 0.21 | % |
Indirect | | 3 | | 0.12 | % | | 3 | | 0.16 | % | | 6 | | 0.24 | % | | 4 | | 0.16 | % | | 5 | | 0.15 | % |
Other Consumer | | 3 | | 0.90 | % | | 4 | | 1.20 | % | | 6 | | 1.34 | % | | 4 | | 1.07 | % | | 5 | | 1.33 | % |
| | | | | | | | | | | | | | | | | | | | | | | | | |
Total Consumer | | 571 | | 1.71 | % | | 622 | | 1.83 | % | | 616 | | 1.78 | % | | 577 | | 1.65 | % | | 520 | | 1.46 | % |
| | | | | | | | | | | | | | | | | | | | | | | | | |
Total 90+ Days Past Due Loans | | 612 | | 0.71 | % | | 700 | | 0.79 | % | | 688 | | 0.76 | % | | 643 | | 0.69 | % | | 613 | | 0.64 | % |
| | | | | | | | | | | | | | | | | | | | | | | | | |
OO = Owner Occupied
FINANCIAL SUPPLEMENT TO
SECOND QUARTER 2010 EARNINGS RELEASE
PAGE 17
Non-Accrual Loans (excludes loans held for sale)
Risk View
| | | | | | | | | | | | | | | | | | | | | | | | | |
| | | 2Q2010 | | | 1Q2010 | | | 4Q2009 | | | 3Q2009 | | | 2Q2009 | |
($ millions) | | $ | | % | | | $ | | % | | | $ | | % | | | $ | | % | | | $ | | % | |
Total Commercial & Industrial | | 479 | | 2.27 | % | | 517 | | 2.43 | % | | 427 | | 1.98 | % | | 381 | | 1.73 | % | | 383 | | 1.62 | % |
Total Commercial Real Estate Mortgage - OO | | 680 | | 5.68 | % | | 623 | | 5.18 | % | | 560 | | 4.65 | % | | 450 | | 3.72 | % | | 372 | | 3.03 | % |
Total Commercial Real Estate Construction - OO | | 37 | | 6.77 | % | | 38 | | 6.47 | % | | 50 | | 6.69 | % | | 47 | | 5.33 | % | | 45 | | 4.29 | % |
| | | | | | | | | | | | | | | | | | | | | | | | | |
Total Commercial | | 1,196 | | 3.56 | % | | 1,178 | | 3.48 | % | | 1,037 | | 3.02 | % | | 878 | | 2.52 | % | | 800 | | 2.16 | % |
| | | | | | | | | | | | | | | | | | | | | | | | | |
Total Commercial Investor Real Estate Mortgage | | 1,286 | | 8.49 | % | | 1,343 | | 8.55 | % | | 1,203 | | 7.47 | % | | 1,184 | | 7.31 | % | | 811 | | 4.94 | % |
Total Commercial Investor Real Estate Construction | | 754 | | 19.94 | % | | 986 | | 20.97 | % | | 1,067 | | 19.07 | % | | 992 | | 14.99 | % | | 869 | | 12.13 | % |
| | | | | | | | | | | | | | | | | | | | | | | | | |
Total Investor Real Estate | | 2,040 | | 10.77 | % | | 2,329 | | 11.41 | % | | 2,270 | | 10.46 | % | | 2,176 | | 9.54 | % | | 1,680 | | 7.12 | % |
| | | | | | | | | | | | | | | | | | | | | | | | | |
Residential First Mortgage | | 212 | | 1.36 | % | | 199 | | 1.28 | % | | 180 | | 1.15 | % | | 162 | | 1.05 | % | | 136 | | 0.87 | % |
Home Equity | | 25 | | 0.17 | % | | — | | 0.00 | % | | 1 | | 0.00 | % | | — | | 0.00 | % | | 2 | | 0.01 | % |
Direct | | — | | 0.00 | % | | — | | 0.00 | % | | — | | 0.00 | % | | — | | 0.00 | % | | — | | 0.00 | % |
Indirect | | — | | 0.00 | % | | — | | 0.00 | % | | — | | 0.00 | % | | — | | 0.00 | % | | — | | 0.00 | % |
Other Consumer | | — | | 0.00 | % | | — | | 0.00 | % | | — | | 0.00 | % | | — | | 0.00 | % | | — | | 0.00 | % |
| | | | | | | | | | | | | | | | | | | | | | | | | |
Total Consumer | | 237 | | 0.71 | % | | 199 | | 0.59 | % | | 181 | | 0.52 | % | | 162 | | 0.46 | % | | 138 | | 0.39 | % |
| | | | | | | | | | | | | | | | | | | | | | | | | |
Total Non-Accrual Loans | | 3,473 | | 4.04 | % | | 3,706 | | 4.20 | % | | 3,488 | | 3.85 | % | | 3,216 | | 3.47 | % | | 2,618 | | 2.72 | % |
| | | | | | | | | | | | | | | | | | | | | | | | | |
OO = Owner Occupied
FINANCIAL SUPPLEMENT TO
SECOND QUARTER 2010 EARNINGS RELEASE
PAGE 18

FINANCIAL SUPPLEMENT TO
SECOND QUARTER 2010 EARNINGS RELEASE
PAGE 19
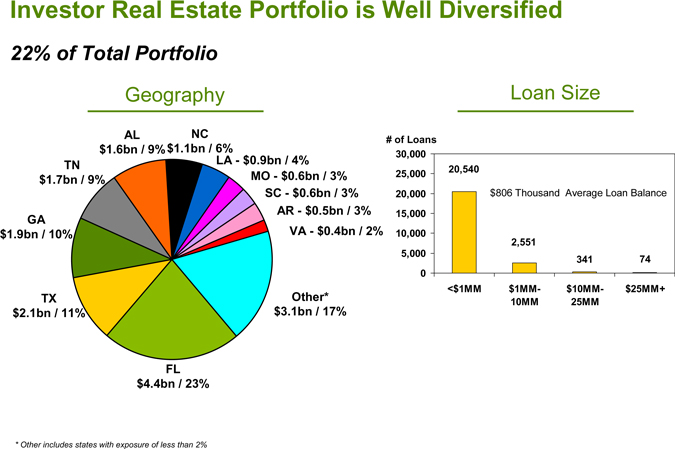
FINANCIAL SUPPLEMENT TO
SECOND QUARTER 2010 EARNINGS RELEASE
PAGE 20
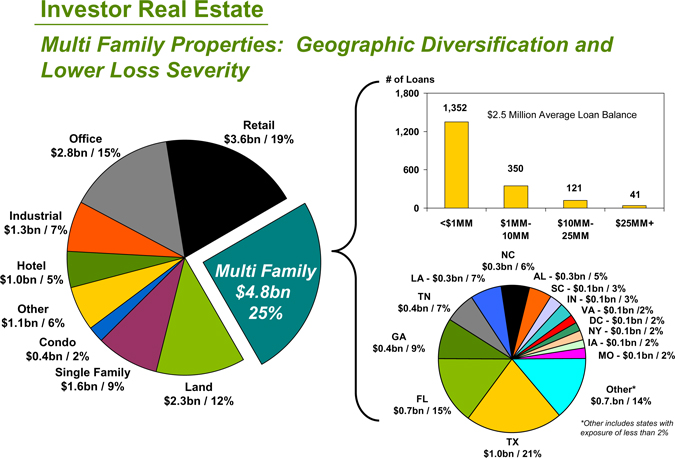
FINANCIAL SUPPLEMENT TO
SECOND QUARTER 2010 EARNINGS RELEASE
PAGE 21
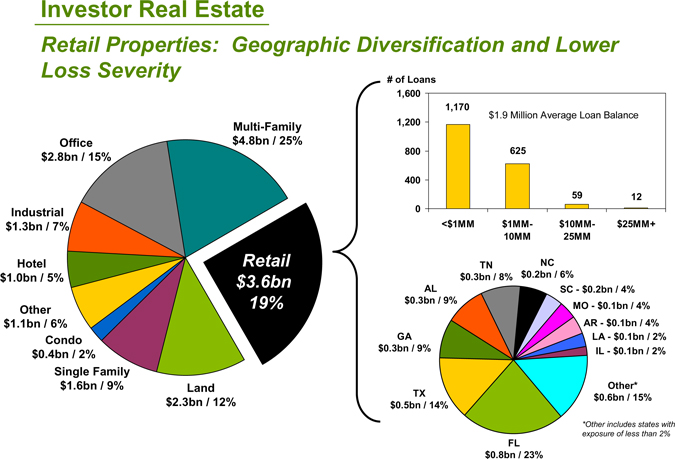
FINANCIAL SUPPLEMENT TO
SECOND QUARTER 2010 EARNINGS RELEASE
PAGE 22
Home Equity Lending Net Charge-off Analysis
| | | | | | | | | | | | | | | | | | | | | | | | | | | | | | | | | | | | | | | | | | | | | | | | | | | | | | | | | | | | | | |
| | | | | 2Q10 | | | 1Q10 | | | 4Q09 | | | 3Q09 | | | 2Q09 | |
($ in millions) | | | | 1st Lien | | | 2nd Lien | | | Total | | | 1st Lien | | | 2nd Lien | | | Total | | | 1st Lien | | | 2nd Lien | | | Total | | | 1st Lien | | | 2nd Lien | | | Total | | | 1st Lien | | | 2nd Lien | | | Total | |
Florida | | Net Charge-off %* | | | 3.12 | % | | | 7.10 | % | | | 5.57 | % | | | 2.92 | % | | | 7.96 | % | | | 6.04 | % | | | 3.17 | % | | | 7.47 | % | | | 5.83 | % | | | 2.19 | % | | | 6.33 | % | | | 4.77 | % | | | 2.44 | % | | | 7.89 | % | | | 5.85 | % |
| | $ Losses | | $ | 16.5 | | | $ | 59.7 | | | $ | 76.2 | | | $ | 15.4 | | | $ | 68.2 | | | $ | 83.6 | | | $ | 17.4 | | | $ | 66.4 | | | $ | 83.8 | | | $ | 12.1 | | | $ | 57.4 | | | $ | 69.5 | | | $ | 13.2 | | | $ | 72.0 | | | $ | 85.2 | |
| | Balance | | $ | 2,098.0 | | | $ | 3,333.3 | | | $ | 5,431.3 | | | $ | 2,126.5 | | | $ | 3,424.9 | | | $ | 5,551.4 | | | $ | 2,169.7 | | | $ | 3,485.5 | | | $ | 5,655.2 | | | $ | 2,181.0 | | | $ | 3,570.4 | | | $ | 5,751.4 | | | $ | 2,171.3 | | | $ | 3,624.8 | | | $ | 5,796.1 | |
| | Original LTV | | | 65.7 | % | | | 76.1 | % | | | 72.1 | % | | | | | | | | | | | | | | | | | | | | | | | | | | | | | | | | | | | | | | | | | | | | | | | | |
All Other States | | Net Charge-off %* | | | 0.75 | % | | | 1.67 | % | | | 1.26 | % | | | 0.74 | % | | | 1.85 | % | | | 1.35 | % | | | 0.93 | % | | | 1.39 | % | | | 1.18 | % | | | 0.56 | % | | | 1.33 | % | | | 0.98 | % | | | 0.63 | % | | | 1.50 | % | | | 1.11 | % |
| | $ Losses | | $ | 8.0 | | | $ | 21.6 | | | $ | 29.6 | | | $ | 7.9 | | | $ | 24.0 | | | $ | 31.9 | | | $ | 10.4 | | | $ | 18.8 | | | $ | 29.2 | | | $ | 6.2 | | | $ | 18.3 | | | $ | 24.5 | | | $ | 7.2 | | | $ | 20.7 | | | $ | 27.9 | |
| | Balance | | $ | 4,250.3 | | | $ | 5,120.4 | | | $ | 9,370.7 | | | $ | 4,306.0 | | | $ | 5,208.4 | | | $ | 9,514.4 | | | $ | 4,394.8 | | | $ | 5,330.6 | | | $ | 9,725.4 | | | $ | 4,451.0 | | | $ | 5,428.0 | | | $ | 9,879.0 | | | $ | 4,508.6 | | | $ | 5,491.6 | | | $ | 10,000.2 | |
| | Original LTV | | | 67.7 | % | | | 79.8 | % | | | 74.2 | % | | | | | | | | | | | | | | | | | | | | | | | | | | | | | | | | | | | | | | | | | | | | | | | | |
Totals | | Net Charge-off %* | | | 1.53 | % | | | 3.81 | % | | | 2.84 | % | | | 1.46 | % | | | 4.27 | % | | | 3.07 | % | | | 1.67 | % | | | 3.79 | % | | | 2.89 | % | | | 1.09 | % | | | 3.32 | % | | | 2.37 | % | | | 1.22 | % | | | 4.04 | % | | | 2.85 | % |
| | $ Losses | | $ | 24.5 | | | $ | 81.3 | | | $ | 105.8 | | | $ | 23.3 | | | $ | 92.2 | | | $ | 115.5 | | | $ | 27.8 | | | $ | 85.2 | | | $ | 113.0 | | | $ | 18.3 | | | $ | 75.7 | | | $ | 94.0 | | | $ | 20.4 $ | | | | 92.7 | | | $ | 113.1 | |
| | Balance | | $ | 6,348.3 | | | $ | 8,453.7 | | | $ | 14,802.0 | | | $ | 6,432.5 | | | $ | 8,633.3 | | | $ | 15,065.8 | | | $ | 6,564.5 | | | $ | 8,816.1 | | | $ | 15,380.6 | | | $ | 6,632.0 | | | $ | 8,998.4 | | | $ | 15,630.4 | | | $ | 6,679.9 | | | $ | 9,116.4 | | | $ | 15,796.3 | |
| | Original LTV | | | 67.0 | % | | | 78.3 | % | | | 73.4 | % | | | | | | | | | | | | | | | | | | | | | | | | | | | | | | | | | | | | | | | | | | | | | | | | |
| * | 23% Florida second lien concentration driving results |
| * | Second lien, Florida net charge-offs represent 56% of 2Q10 net charge-offs but just 23% of outstanding balances. |
| * | Net charge-offs in Florida approximately 4.4 times non-Florida net charge-off rate |
| * | Origination quality solid with an average FICO of 774 and an average LTV of 63%; Property value declines driving losses |
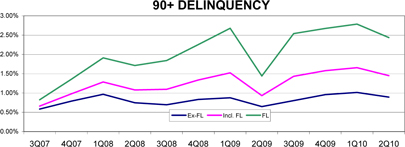
Notes: * Recoveries are pro-rated based on charge-off balances.
| | * | Balances shown on an ending basis. Net loss rates calculated using average balances |
| | * | Original LTVs shown for current period only; prior period LTVs not materially different |
FINANCIAL SUPPLEMENT TO
SECOND QUARTER 2010 EARNINGS RELEASE
PAGE 23
Credit Costs Moderating
| | | | | | | | | | | | | | | | | |
(in millions) | | 2Q09 | | | 3Q09 | | 4Q09 | | 1Q10 | | 2Q10 | |
Net Charge-offs | | | | | | | | | | | | | | | | | |
IRE Valuation Losses | | $ | 129 | | | $ | 191 | | $ | 215 | | $ | 198 | | $ | 142 | |
Investor Real Estate (IRE) | | | 39 | | | | 45 | | | 55 | | | 59 | | | 74 | |
Commercial | | | 99 | | | | 136 | | | 107 | | | 128 | | | 117 | |
Consumer Real Estate | | | 164 | | | | 150 | | | 168 | | | 177 | | | 167 | |
| | | | | | | | | | | | | | | | | |
Other Consumer | | | 24 | | | | 30 | | | 32 | | | 28 | | | 19 | |
| | | | | | | | | | | | | | | | | |
Net Charge-offs excluding charge-offs from Sales / Transfers to HFS | | | 455 | | | | 552 | | | 577 | | | 590 | | | 519 | |
Sales/Transfer to HFS | | | 36 | | | | 128 | | | 115 | | | 110 | | | 132 | |
| | | | | | | | | | | | | | | | | |
Total Net Charge-offs | | $ | 491 | | | $ | 680 | | $ | 692 | | $ | 700 | | $ | 651 | |
| | | | | | | | | | | | | | | | | |
Net Loss / (Gain) - HFS Sales | | | (2 | ) | | | 1 | | | 2 | | | 6 | | | (9 | ) |
HFS Write-downs(1) | | | 5 | | | | 9 | | | 9 | | | 10 | | | 5 | |
OREO expense | | | 24 | | | | 61 | | | 65 | | | 42 | | | 40 | |
| | | | | | | | | | | | | | | | | |
Total Credit Costs | | $ | 518 | | | $ | 751 | | $ | 768 | | $ | 758 | | $ | 687 | |
| | | | | | | | | | | | | | | | | |
| (1) | Reflects write-downs subsequent to initial move to held for sale and write-downs upon transfer to OREO |
FINANCIAL SUPPLEMENT TO
SECOND QUARTER 2010 EARNINGS RELEASE
PAGE 24
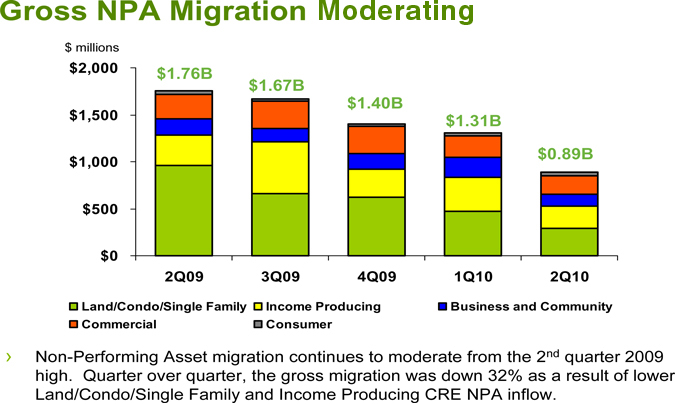
FINANCIAL SUPPLEMENT TO
SECOND QUARTER 2010 EARNINGS RELEASE
PAGE 25
Gross and Net NPA Migration Moderating
| | | | | | | | | | | | | | | | | | | | |
($ in millions) | | 2Q 2009 | | | 3Q 2009 | | | 4Q 2009 | | | 1Q 2010 | | | 2Q 2010 | |
Beginning Non-Performing Assets¹ | | $ | 1,935 | | | $ | 3,057 | | | $ | 3,719 | | | $ | 4,095 | | | $ | 4,316 | |
Additions | | $ | 1,758 | | | $ | 1,667 | | | $ | 1,404 | | | $ | 1,306 | | | $ | 887 | |
Payments | | | (116 | ) | | | (90 | ) | | | (88 | ) | | | (124 | ) | | | (135 | ) |
Returned to Accruing Status | | | (10 | ) | | | (42 | ) | | | (44 | ) | | | (55 | ) | | | (58 | ) |
Charge-Offs / OREO Write-Downs | | | (296 | ) | | | (440 | ) | | | (451 | ) | | | (443 | ) | | | (402 | ) |
| | | | | | | | | | | | | | | | | | | | |
Net Additions | | $ | 1,336 | | | $ | 1,095 | | | $ | 821 | | | $ | 684 | | | $ | 292 | |
| | | | | | | | | | | | | | | | | | | | |
Dispositions | | | (80 | ) | | | (232 | ) | | | (312 | ) | | | (376 | ) | | | (430 | ) |
Moved to Held for Sale | | | (134 | ) | | | (201 | ) | | | (133 | ) | | | (87 | ) | | | (159 | ) |
| | | | | | | | | | | | | | | | | | | | |
Ending Non-Performing Assets¹ | | $ | 3,057 | | | $ | 3,719 | | | $ | 4,095 | | | $ | 4,316 | | | $ | 4,019 | |
| | | | | | | | | | | | | | | | | | | | |
Change Versus Previous Quarter | | $ | 1,122 | | | $ | 662 | | | $ | 376 | | | $ | 221 | | | ($ | 297 | ) |
| 1 | Excludes Loans Held for Sale |
FINANCIAL SUPPLEMENT TO
SECOND QUARTER 2010 EARNINGS RELEASE
PAGE 26
Additional Financial and Operational Data
| | | | | | | | | | |
| | | 6/30/10 | | 3/31/10 | | 12/31/09 | | 9/30/09 | | 6/30/09 |
Associate headcount | | 27,895 | | 28,213 | | 28,509 | | 28,995 | | 29,838 |
Total branch outlets | | 1,774 | | 1,774 | | 1,895 | | 1,895 | | 1,899 |
ATMs | | 2,162 | | 2,198 | | 2,304 | | 2,313 | | 2,321 |
Morgan Keegan offices | | 325 | | 321 | | 324 | | 339 | | 324 |
FINANCIAL SUPPLEMENT TO
SECOND QUARTER 2010 EARNINGS RELEASE
PAGE 27
Reconciliation to GAAP Financial Measures
The table below presents computations of earnings and certain other financial measures excluding regulatory charge (non-GAAP). The regulatory charge is included in financial results presented in accordance with generally accepted accounting principles (GAAP). Regions believes that the exclusion of the regulatory charge in expressing earnings and certain other financial measures, including “earnings (loss) per common share, excluding regulatory charge”, “return on average assets, excluding regulatory charge” and “return on average tangible common equity, excluding regulatory charge” (explained on next page) provides a meaningful base for period-to-period comparisons, which management believes will assist investors in analyzing the operating results of the Company and predicting future performance. These non-GAAP financial measures are also used by management to assess the performance of Regions’ business, because management does not consider the regulatory charge to be relevant to ongoing operating results. Management and the Board of Directors utilize these non-GAAP financial measures for the following purposes: preparation of Regions’ operating budgets; calculation of performance-based annual incentive bonuses for certain executives; calculation of performance-based multi-year incentive bonuses for certain executives; monthly financial performance reporting; monthly close-out “flash” reporting of consolidated results (management only); and presentations to investors of company performance. Regions believes that presenting these non-GAAP financial measures will permit investors to assess the performance of the Company on the same basis as that applied by management and the Board of Directors. Non-GAAP financial measures have inherent limitations, are not required to be uniformly applied and are not audited. To mitigate these limitations, Regions has policies and procedures in place to identify and address expenses that qualify for non-GAAP presentation, including authorization and system controls to ensure accurate period to period comparisons. Although these non-GAAP financial measures are frequently used by stakeholders in the evaluation of a company, they have limitations as analytical tools, and should not be considered in isolation, or as a substitute for analyses of results as reported under GAAP. In particular, a measure of earnings that excludes the regulatory charge does not represent the amount that effectively accrues directly to stockholders (i.e. the regulatory charge is a reduction in earnings and stockholders’ equity).
| | | | | | | | | | | | | | | | | | | | | | |
| | | | | As of and for Quarter Ended | |
($ amounts in millions, except per share data) | | | | 06/30/10 | | | 03/31/10 | | | 12/31/09 | | | 09/30/09 | | | 06/30/09 | |
INCOME (LOSS) | | | | | | | | | | | | | | | | | | | | | | |
Net income (loss) (GAAP) | | | | $ | (277 | ) | | $ | (196 | ) | | $ | (543 | ) | | $ | (377 | ) | | $ | (188 | ) |
Preferred dividends and accretion (GAAP) | | | | | (58 | ) | | | (59 | ) | | | (63 | ) | | | (60 | ) | | | (56 | ) |
| | | | | | | | | | | | | | | | | | | | | | |
Net income (loss) available to common shareholders (GAAP) | | A | | $ | (335 | ) | | $ | (255 | ) | | $ | (606 | ) | | $ | (437 | ) | | $ | (244 | ) |
| | | | | | | | | | | | | | | | | | | | | | |
Net income (loss) available to common shareholders (GAAP) | | | | $ | (335 | ) | | $ | (255 | ) | | $ | (606 | ) | | $ | (437 | ) | | $ | (244 | ) |
Regulatory charge, net of tax | | | | | 200 | | | | — | | | | — | | | | — | | | | — | |
| | | | | | | | | | | | | | | | | | | | | | |
Net income (loss) available to common shareholders, excluding regulatory charge (non-GAAP) | | B | | | (135 | ) | | | (255 | ) | | | (606 | ) | | | (437 | ) | | | (244 | ) |
| | | | | | | | | | | | | | | | | | | | | | |
Weighted-average diluted shares | | C | | | 1,200 | | | | 1,194 | | | | 1,191 | | | | 1,189 | | | | 876 | |
Earnings (loss) per common share - diluted (GAAP) | | A/C | | | (0.28 | ) | | | (0.21 | ) | | | (0.51 | ) | | | (0.37 | ) | | | (0.28 | ) |
Earnings (loss) per common share, excluding regulatory charge - diluted (non-GAAP) | | B/C | | | (0.11 | ) | | | (0.21 | ) | | | (0.51 | ) | | | (0.37 | ) | | | (0.28 | ) |
FINANCIAL SUPPLEMENT TO
SECOND QUARTER 2010 EARNINGS RELEASE
PAGE 28
Reconciliation to GAAP Financial Measures
The following tables also provide calculations of “return on average tangible common stockholders’ equity”, end of period “tangible common stockholders’ equity” ratios and a reconciliation of stockholders’ equity (GAAP) to Tier 1 capital (regulatory) and to “Tier 1 common equity” (non-GAAP). Tangible common stockholders’ equity ratios have become a focus of some investors and management believes they may assist investors in analyzing the capital position of the Company absent the effects of intangible assets and preferred stock. Traditionally, the Federal Reserve and other banking regulatory bodies have assessed a bank’s capital adequacy based on Tier 1 capital, the calculation of which is codified in federal banking regulations. In connection with the Supervisory Capital Assessment Program (“SCAP”), these regulators began supplementing their assessment of the capital adequacy of a bank based on a variation of Tier 1 capital, known as Tier 1 common equity. While not codified, analysts and banking regulators have assessed Regions’ capital adequacy using the tangible common stockholders’ equity and/or the Tier 1 common equity measure. Because tangible common stockholders’ and Tier 1 common equity are not formally defined by GAAP or codified in the federal banking regulations, these measures are considered to be non-GAAP financial measures and other entities may calculate them differently than Regions’ disclosed calculations. Since analysts and banking regulators may assess Regions’ capital adequacy using tangible common stockholders’ equity and Tier 1 common equity, we believe that it is useful to provide investors the ability to assess Regions’ capital adequacy on these same bases.
Tier 1 common equity is often expressed as a percentage of risk-weighted assets. Under the risk-based capital framework, a company’s balance sheet assets and credit equivalent amounts of off-balance sheet items are assigned to one of four broad risk categories. The aggregated dollar amount in each category is then multiplied by the risk-weighted category. The resulting weighted values from each of the four categories are added together and this sum is the risk-weighted assets total that, as adjusted, comprises the denominator of certain risk-based capital ratios. Tier 1 capital is then divided by this denominator (risk-weighted assets) to determine the Tier 1 capital ratio. Adjustments are made to Tier 1 capital to arrive at Tier 1 common equity. Tier 1 common equity is also divided by the risk-weighted assets to determine the Tier 1 common equity ratio. The amounts disclosed as risk-weighted assets are calculated consistent with banking regulatory requirements.
| | | | | | | | | | | | | | | | | | | | | | |
| | | | | | | | As of and for Quarter Ended | | | | |
($ amounts in millions, except per share data) | | | | 06/30/10 | | | 03/31/10 | | | 12/31/09 | | | 09/30/09 | | | 06/30/09 | |
RETURN ON AVERAGE ASSETS | | | | | | | | | | | | | | | | | | | | | | |
Average assets (GAAP) | | D | | $ | 137,285 | | | $ | 139,565 | | | $ | 141,133 | | | $ | 140,305 | | | $ | 146,087 | |
Return on average assets (GAAP) (1) | | A/D | | | -0.98 | % | | | -0.74 | % | | | -1.70 | % | | | -1.24 | % | | | -0.67 | % |
| | | | | | | | | | | | | | | | | | | | | | |
Return on average assets, excluding regulatory charge (non-GAAP) (1) | | B/D | | | -0.40 | % | | | -0.74 | % | | | -1.70 | % | | | -1.24 | % | | | -0.67 | % |
| | | | | | | | | | | | | | | | | | | | | | |
RETURN ON AVERAGE TANGIBLE COMMON STOCKHOLDERS’ EQUITY | | | | | | | | | | | | | | | | | | | | | | |
Average stockholders’ equity (GAAP) | | | | $ | 17,592 | | | $ | 17,798 | | | $ | 18,248 | | | $ | 18,612 | | | $ | 17,495 | |
Less: Average intangible assets (GAAP) | | | | | 6,019 | | | | 6,046 | | | | 6,077 | | | | 6,108 | | | | 6,138 | |
Average preferred equity (GAAP) | | | | | 3,576 | | | | 3,605 | | | | 3,606 | | | | 3,606 | | | | 3,421 | |
Average tangible common stockholders’ equity (non-GAAP) | | E | | $ | 7,997 | | | $ | 8,147 | | | $ | 8,565 | | | $ | 8,898 | | | $ | 7,936 | |
Return on average tangible common stockholders’ equity (GAAP) (1) | | A/E | | | -16.80 | % | | | -12.69 | % | | | -28.03 | % | | | -19.48 | % | | | -12.34 | % |
| | | | | | | | | | | | | | | | | | | | | | |
Return on average tangible common stockholders’ equity, excluding regulatory charge (non-GAAP) (1) | | B/E | | | -6.79 | % | | | -12.69 | % | | | -28.03 | % | | | -19.48 | % | | | -12.34 | % |
| | | | | | | | | | | | | | | | | | | | | | |
TANGIBLE COMMON RATIOS | | | | | | | | | | | | | | | | | | | | | | |
Stockholders’ equity (GAAP) | | | | $ | 17,463 | | | $ | 17,638 | | | $ | 17,881 | | | $ | 18,492 | | | $ | 18,737 | |
Less: Intangible assets (GAAP) | | | | | 6,003 | | | | 6,031 | | | | 6,060 | | | | 6,093 | | | | 6,124 | |
Preferred equity (GAAP) | | | | | 3,360 | | | | 3,610 | | | | 3,602 | | | | 3,612 | | | | 3,603 | |
| | | | | | | | | | | | | | | | | | | | | | |
Tangible common stockholders’ equity (non-GAAP) | | F | | $ | 8,100 | | | $ | 7,997 | | | $ | 8,219 | | | $ | 8,787 | | | $ | 9,010 | |
Total assets (GAAP) | | | | $ | 135,340 | | | $ | 137,230 | | | $ | 142,318 | | | $ | 139,986 | | | $ | 142,811 | |
Less: Intangible assets (GAAP) | | | | | 6,003 | | | | 6,031 | | | | 6,060 | | | | 6,093 | | | | 6,124 | |
| | | | | | | | | | | | | | | | | | | | | | |
Tangible assets (non-GAAP) | | G | | $ | 129,337 | | | $ | 131,199 | | | $ | 136,258 | | | $ | 133,893 | | | $ | 136,687 | |
Shares outstanding—end of quarter | | H | | | 1,256 | | | | 1,192 | | | | 1,193 | | | | 1,188 | | | | 1,188 | |
Tangible common stockholders’ equity to tangible assets (non-GAAP) | | F/G | | | 6.26 | % | | | 6.09 | % | | | 6.03 | % | | | 6.56 | % | | | 6.59 | % |
Tangible common book value per share (non-GAAP) | | F/H | | $ | 6.45 | | | $ | 6.71 | | | $ | 6.89 | | | $ | 7.40 | | | $ | 7.58 | |
TIER 1 COMMON RISK-BASED RATIO (2) | | | | | | | | | | | | | | | | | | | | | | |
Stockholders’ equity (GAAP) | | | | $ | 17,463 | | | $ | 17,638 | | | $ | 17,881 | | | $ | 18,492 | | | $ | 18,737 | |
Accumulated other comprehensive (income) loss | | | | | (306 | ) | | | (144 | ) | | | (130 | ) | | | (143 | ) | | | 36 | |
Non-qualifying goodwill and intangibles | | | | | (5,752 | ) | | | (5,771 | ) | | | (5,792 | ) | | | (5,821 | ) | | | (5,845 | ) |
Disallowed deferred tax assets | | | | | (443 | ) | | | (932 | ) | | | (947 | ) | | | (485 | ) | | | (403 | ) |
Disallowed servicing assets | | | | | (22 | ) | | | (27 | ) | | | (25 | ) | | | (21 | ) | | | (20 | ) |
Qualifying non-controlling interests | | | | | 92 | | | | 91 | | | | 91 | | | | 91 | | | | 91 | |
Qualifying trust preferred securities | | | | | 846 | | | | 846 | | | | 846 | | | | 846 | | | | 846 | |
| | | | | | | | | | | | | | | | | | | | | | |
Tier 1 capital (regulatory) | | | | $ | 11,878 | | | $ | 11,701 | | | $ | 11,924 | | | $ | 12,959 | | | $ | 13,442 | |
Qualifying non-controlling interests | | | | | (92 | ) | | | (91 | ) | | | (91 | ) | | | (91 | ) | | | (91 | ) |
Qualifying trust preferred securities | | | | | (846 | ) | | | (846 | ) | | | (846 | ) | | | (846 | ) | | | (846 | ) |
Preferred stock | | | | | (3,360 | ) | | | (3,610 | ) | | | (3,602 | ) | | | (3,612 | ) | | | (3,603 | ) |
| | | | | | | | | | | | | | | | | | | | | | |
Tier 1 common equity (non-GAAP) | | J | | $ | 7,580 | | | $ | 7,154 | | | $ | 7,385 | | | $ | 8,410 | | | $ | 8,902 | |
Risk-weighted assets (regulatory) | | K | | | 98,653 | | | | 100,323 | | | | 103,330 | | | | 106,673 | | | | 110,558 | |
Tier 1 common risk-based ratio (non-GAAP) | | J/K | | | 7.7 | % | | | 7.1 | % | | | 7.1 | % | | | 7.9 | % | | | 8.1 | % |
| | | | | | | | | | | | | | | | | | | | | | |
| (1) | Income statement amounts have been annualized in calculation |
| (2) | Current quarter amounts and the resulting ratios are estimated |
FINANCIAL SUPPLEMENT TO
SECOND QUARTER 2010 EARNINGS RELEASE
PAGE 29
Forward-Looking Statements
This presentation may include forward-looking statements which reflect Regions’ current views with respect to future events and financial performance. The Private Securities Litigation Reform Act of 1995 (“the Act”) provides a safe harbor for forward-looking statements which are identified as such and are accompanied by the identification of important factors that could cause actual results to differ materially from the forward-looking statements. For these statements, we, together with our subsidiaries, claim the protection afforded by the safe harbor in the Act. Forward-looking statements are not based on historical information, but rather are related to future operations, strategies, financial results or other developments. Forward-looking statements are based on management’s expectations as well as certain assumptions and estimates made by, and information available to, management at the time the statements are made. Those statements are based on general assumptions and are subject to various risks, uncertainties and other factors that may cause actual results to differ materially from the views, beliefs and projections expressed in such statements. These risks, uncertainties and other factors include, but are not limited to, those described below:
| | • | | The Dodd-Frank Wall Street Reform and Consumer Protection Act became law on July 21, 2010 and a number of legislative, regulatory and tax proposals remain pending. Additionally, the U.S. Treasury and federal banking regulators continue to implement, and is beginning to wind down, a number of programs to address capital and liquidity issues in the banking system. All of the foregoing may have significant effects on Regions and the financial services industry, the exact nature of which cannot be determined at this time. |
| | • | | The impact of compensation and other restrictions imposed under the Troubled Asset Relief Program (“TARP”) until Regions repays the outstanding preferred stock issued under TARP including restrictions on Regions’ ability to attract and retain talented executives and employees. |
| | • | | The impact of compensation and other restrictions imposed under the Troubled Asset Relief Program (“TARP”) until Regions repays the outstanding preferred stock and warrant issued under TARP. |
| | • | | Possible additional loan losses, impairment of goodwill and other intangibles and adjustment of valuation allowances on deferred tax assets and the impact on earnings and capital. |
| | • | | Possible changes in interest rates may increase funding costs and reduce earning asset yields, thus reducing margins. |
| | • | | Possible changes in general economic and business conditions in the United States in general and in the communities Regions serves in particular, including any prolonging or worsening of the current unfavorable economic conditions, including unemployment levels. |
| | • | | Possible changes in the creditworthiness of customers and the possible impairment of the collectability of loans. |
| | • | | Possible changes in trade, monetary and fiscal policies, laws and regulations, and other activities of governments, agencies, and similar organizations, including changes in accounting standards, may have an adverse effect on business. |
| | • | | The current stresses in the financial and real estate markets, including possible continued deterioration in property values. |
| | • | | Regions’ ability to manage fluctuations in the value of assets and liabilities and off-balance sheet exposure so as to maintain sufficient capital and liquidity to support Regions’ business. |
| | • | | Regions’ ability to achieve the earnings expectations related to businesses that have been acquired or that may be acquired in the future. |
| | • | | Regions’ ability to expand into new markets and to maintain profit margins in the face of competitive pressures. |
| | • | | Regions’ ability to develop competitive new products and services in a timely manner and the acceptance of such products and services by Regions’ customers and potential customers. |
| | • | | Regions’ ability to keep pace with technological changes. |
| | • | | Regions’ ability to effectively manage credit risk, interest rate risk, market risk, operational risk, legal risk, liquidity risk, and regulatory and compliance risk. |
| | • | | Regions’ ability to ensure adequate capitalization which is impacted by inherent uncertainties in forecasting credit losses. |
| | • | | The cost and other effects of material contingencies, including litigation contingencies and any adverse judicial, administrative or arbitral rulings or proceedings. |
| | • | | The effects of increased competition from both banks and non-banks. |
| | • | | The effects of geopolitical instability and risks such as terrorist attacks. |
| | • | | Possible changes in consumer and business spending and saving habits could affect Regions’ ability to increase assets and to attract deposits. |
| | • | | The effects of weather and natural disasters such as floods, droughts and hurricanes and the effects of the Gulf of Mexico oil spill. |
| | • | | Regions’ ability to maintain favorable ratings from ratings agencies. |
| | • | | Potential dilution of holders of shares of Regions’ common stock resulting from the U.S. Treasury’s investment under TARP. |
| | • | | Possible changes in the speed of loan prepayments by Regions’ customers and loan origination or sales volumes. |
| | • | | The effects of problems encountered by larger or similar financial institutions that adversely affect Regions or the banking industry generally. |
| | • | | Regions’ ability to receive dividends from its subsidiaries. |
| | • | | The effects of the failure of any component of Regions’ business infrastructure which is provided by a third party. |
| | • | | The effects of any damage to Regions’ reputation resulting from developments related to any of the items identified above. |
The foregoing list of factors is not exhaustive; for discussion of these and other risks that may cause actual results to differ from expectations, please look under the caption “Risk Factors” in Regions’ Annual Report on Form 10-K for the year ended December 31, 2009 and Form 10-Q for the quarter ended March 31, 2010, as on file with the Securities and Exchange Commission.
The words “believe,” “expect,” “anticipate,” “project,” and similar expressions often signify forward-looking statements. You should not place undue reliance on any forward-looking statements, which speak only as of the date made. Regions assumes no obligation to update or revise any forward-looking statements that are made from time to time.
Regions’ Investor Relations contact is List Underwood at (205) 801-0265; Regions’ Media contact is Tim Deighton at (205) 264-4551