 Exhibit 99.1 * * * |
 Forward-Looking Statements 1 This presentation may include forward-looking statements which reflect Regions’ current views with respect to future events and financial performance. The Private Securities Litigation Reform Act of 1995 (“the Act”) provides a “safe harbor” for forward-looking statements which are identified as such and are accompanied by the identification of important factors that could cause actual results to differ materially from the forward-looking statements. For these statements, we, together with our subsidiaries, claim the protection afforded by the safe harbor in the Act. Forward-looking statements are not based on historical information, but rather are related to future operations, strategies, financial results or other developments. Forward-looking statements are based on management’s expectations as well as certain assumptions and estimates made by, and information available to, management at the time the statements are made. Those statements are based on general assumptions and are subject to various risks, uncertainties and other factors that may cause actual results to differ materially from the views, beliefs and projections expressed in such statements. These risks, uncertainties and other factors include, but are not limited to, those described below: › The Dodd-Frank Wall Street Reform and Consumer Protection Act became law on July 21, 2010, and a number of legislative, regulatory and tax proposals remain pending. Additionally, the U.S. Treasury and federal banking regulators continue to implement, but are also beginning to wind down, a number of programs to address capital and liquidity in the banking system. All of the foregoing may have significant effects on Regions and the financial services industry, the exact nature and extent of which cannot be determined at this time. › The impact of compensation and other restrictions imposed under the Troubled Asset Relief Program (“TARP”) until Regions repays the outstanding preferred stock and warrant issued under the TARP, including restrictions on Regions’ ability to attract and retain talented executives and associates. › Possible additional loan losses, impairment of goodwill and other intangibles, and adjustment of valuation allowances on deferred tax assets and the impact on earnings and capital. › Possible changes in interest rates may increase funding costs and reduce earning asset yields, thus reducing margins. › Possible changes in general economic and business conditions in the United States in general and in the communities Regions serves in particular, including any prolonging or worsening of the current unfavorable economic conditions including unemployment levels. › Possible changes in the creditworthiness of customers and the possible impairment of the collectability of loans. › Possible changes in trade, monetary and fiscal policies, laws and regulations and other activities of governments, agencies, and similar organizations, including changes in accounting standards, may have an adverse effect on business. › The current stresses in the financial and real estate markets, including possible continued deterioration in property values. › Regions' ability to manage fluctuations in the value of assets and liabilities and off-balance sheet exposure so as to maintain sufficient capital and liquidity to support Regions' business. › Regions' ability to achieve the earnings expectations related to businesses that have been acquired or that may be acquired in the future. › Regions' ability to expand into new markets and to maintain profit margins in the face of competitive pressures. › Regions' ability to develop competitive new products and services in a timely manner and the acceptance of such products and services by Regions' customers and potential customers. › Regions' ability to keep pace with technological changes. › Regions' ability to effectively manage credit risk, interest rate risk, market risk, operational risk, legal risk, liquidity risk, and regulatory and compliance risk. › Regions’ ability to ensure adequate capitalization which is impacted by inherent uncertainties in forecasting credit losses. › The cost and other effects of material contingencies, including litigation contingencies, and any adverse judicial, administrative or arbitral rulings or proceedings. › The effects of increased competition from both banks and non-banks. › The effects of geopolitical instability and risks such as terrorist attacks. › Possible changes in consumer and business spending and saving habits could affect Regions' ability to increase assets and to attract deposits. › The effects of weather and natural disasters such as floods, droughts and hurricanes, and the effects of the Gulf of Mexico oil spill. › Regions’ ability to maintain favorable ratings from rating agencies. › Potential dilution of holders of shares of Regions’ common stock resulting from the U.S. Treasury’s investment in TARP. › Possible changes in the speed of loan prepayments by Regions’ customers and loan origination or sales volumes. › The effects of problems encountered by larger or similar financial institutions that adversely affect Regions or the banking industry generally. › Regions’ ability to receive dividends from its subsidiaries. › The effects of the failure of any component of Regions’ business infrastructure which is provided by a third party. › The effects of any damage to Regions’ reputation resulting from developments related to any of the items identified above. The foregoing list of factors is not exhaustive; for discussion of these and other risks that may cause actual results to differ from expectations, please look under the caption “Risk Factors” in Regions’ Annual Report on Form 10-K for the year ended December 31, 2009 and Forms 10-Q for the quarters ended June 30, 2010 and March 31, 2010, as on file with the Securities and Exchange Commission. The words "believe," "expect," "anticipate," "project," and similar expressions often signify forward-looking statements. You should not place undue reliance on any forward-looking statements, which speak only as of the date made. Regions assumes no obligation to update or revise any forward-looking statements that are made from time to time. |
 Business Overview Grayson Hall * * * * |
 Agenda and Introductions Grayson Hall Business Overview David Turner Financial Review Bill Wells Credit Quality BREAK John Owen Consumer Services John Asbury Business Services John Carson Morgan Keegan Regional Presidents Panel Regional Updates LUNCH Grayson Hall/David Turner Break Out Session John Owen/John Carson/John Asbury Break Out Session Regional Presidents/Bill Wells Break Out Session 2 |
 Overview › Environmental factors impacting industry › Key issues impacting Regions › Strategic priorities driving results 3 |
 Environmental Factors Impacting Industry › Economy › Low consumer and business confidence › High unemployment forecasted to continue › Home price stabilization is mixed › Financial Reform › Impacts consumers, industry and economy › Implementation process just beginning › Gulf Oil Spill › Monitoring crisis closely › Following a proven disaster recovery plan 4 |
 Key Issues Impacting Regions › Morgan Keegan Regulatory Matters › Capital Purchase Program Repayment 5 |
 Strategic Priorities Achieving Results › Keep Business Focused on the Customer › Strong deposit base and more active customers › Customer loyalty well above industry norms › Protect Our Future › Smarter risk management › Strong capital and liquidity positions › Restore Financial Performance › Improving net interest margin › Rigorous expense control › Execute with Excellence › Clear goals and accountability › Right plans, right people and laser sharp focus 6 |
 Financial Update David Turner * * * * |
 Earnings: Improving trends in PPNR and LLP Q2 Q3 Q4 Q1 Q2 ($ in millions) 2009 2009 2009 2010 2010 Stable and Improving PPNR Net Interest Income $ 831 $ 845 $ 850 $ 831 $ 856 Core Non-Interest Income* 761 764 744 734 756 Core Revenue* 1,592 1,609 1,593 1,565 1,612 Net Interest Margin 2.62% 2.73% 2.72% 2.77% 2.87% Core Non-Interest Expense* 1,099 1,199 1,207 1,168 1,126 Core Pre-Tax Pre-Provision Net Revenue* 493 409 386 397 486 Improving Credit / LLP Trends Loan Loss Provision 912 1,025 1,179 770 651 Net Charge Offs / Avg Loans 2.06% 2.86% 2.99% 3.16% 2.99% Improving Results Core EPS* $ (0.35) $ (0.35) $ (0.46) $ (0.21) $ (0.11) *Non-GAAP, refer to Appendix for non-GAAP reconciliation 2 |
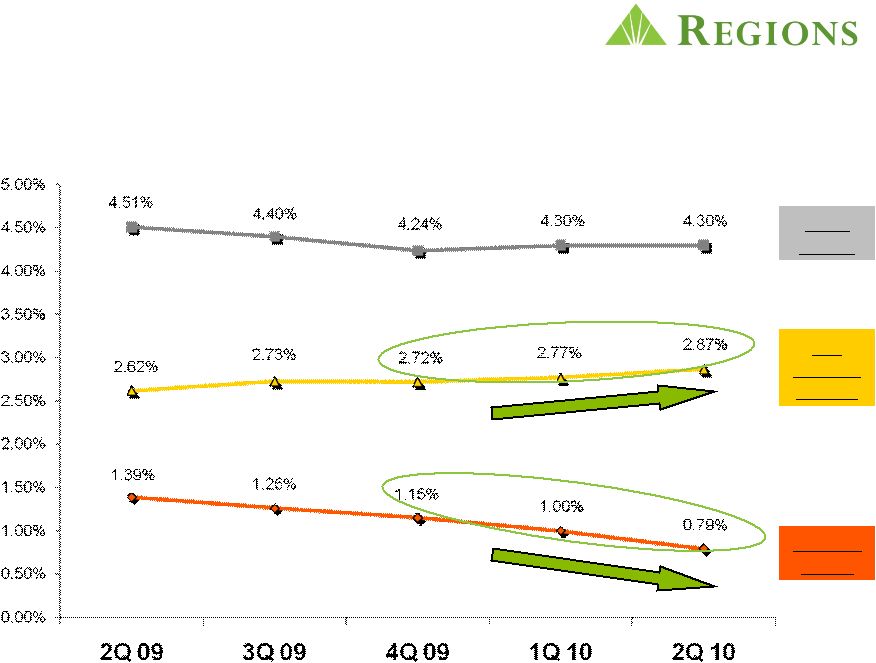 Margin: Declining deposit costs drive net interest margin improvement Loan Yields Net Interest Margin Deposit Costs 3 |
 Credit: Net charge offs stabilized and NPLs declined ALLL / NPLs 0.87x 0.82x 0.89x 0.86x 0.92x 4 |
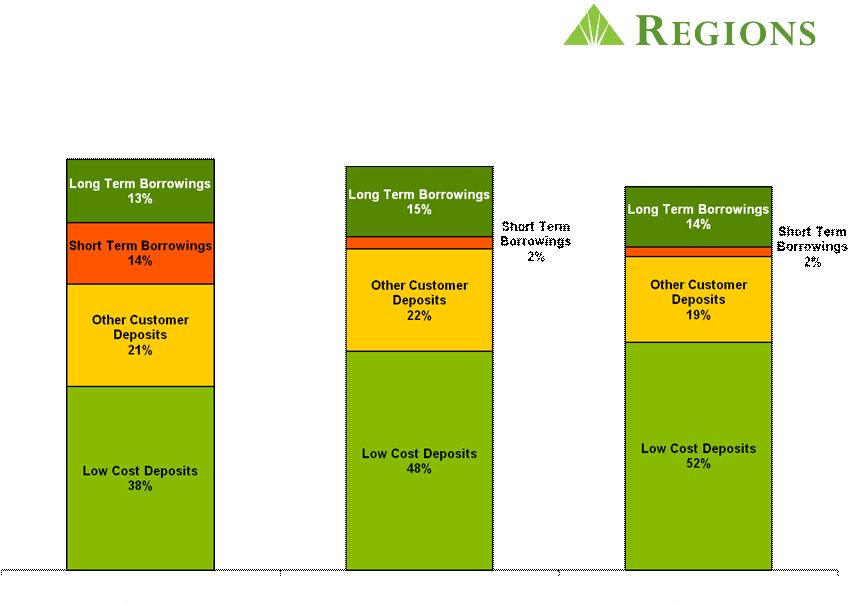 Total Wholesale funding $33.6B $22.8B $17.9B % of Total Funding 27% 18% 15% December 31, 2008 December 31, 2009 June 30, 2010 Improved Funding Mix 5 |
 Capital Update 2Q 2009 3Q 2009 4Q 2009 1Q 2010 2Q 2010* Tier 1 Common Ratio 8.1% 7.9% 7.1% 7.1% 7.7% Tangible Common Equity Ratio 6.6% 6.6% 6.0% 6.1% 6.3% Tier 1 Capital Ratio 12.2% 12.2% 11.5% 11.7% 12.0% Total Capital Ratio 16.2% 16.3% 15.8% 15.8% 15.9% Tangible Book Value per Share $7.58 $7.40 $6.89 $6.71 $6.45 * Estimate 6 |
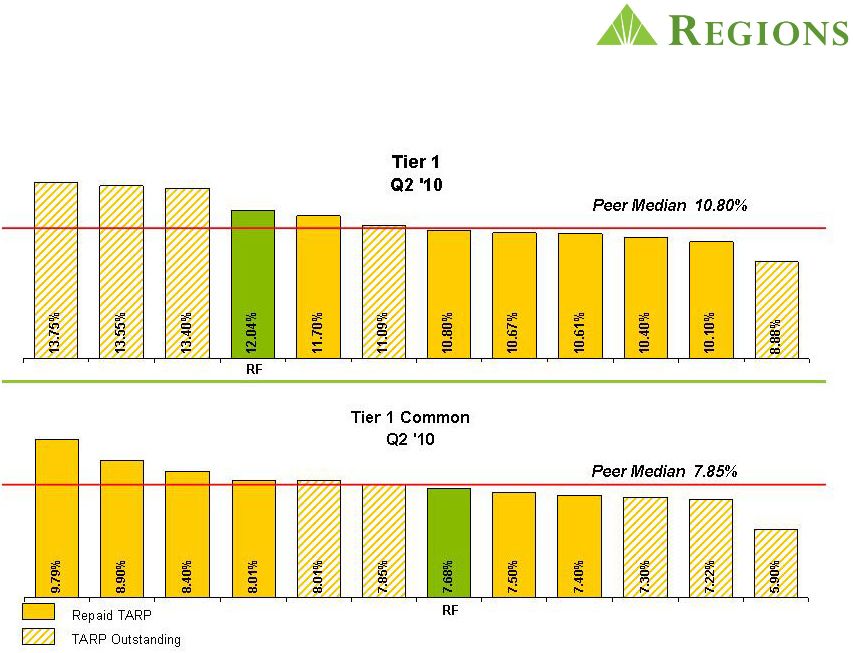 Capital Update: Capital vs. Peers Peers include BAC, BBT, CMA, FITB, KEY, MI, MTB, PNC, STI, USB, WFC 7 |
 We Are Lending and Remain Focused on Meeting Our Customers’ Needs › $92 billion in new / renewed loan commitments to more than over 244k customers in the last 18 months › Regions Customer Assistance Program › Assisted more than 30,000 homeowners and restructured $2.3 billion in mortgages › US Treasury’s Home Affordable Modification Program › Investing in new products and services for our customers 8 |
 We Have Strengthened Our Core Franchise Through Productivity and Efficiency Initiatives ($ in millions) 2007 2008 2009 Branches 1,965 1,900 1,895 › Further reduced branch count by 120 in 1Q10 Employees 33,161 30,784 28,509 › Headcount declined 4,652 or 14% Core Expenses* $3,991 $3,936 $3,704 › Total core expenses declined $287MM or 7% * Excludes FDIC expense, other real estate expense, legal and professional fees, credit investigations, credit support expense, unfunded commitments, MSR impairment, loss on early extinguishment of debt, branch consolidation costs, VISA settlement and securities impairment 9 |
 › Core profitability focus › Leaner, more efficient franchise › Single platform › Reduced headcount › Consolidated branch network › Invest where profitability hurdles are achieved › Effective expense management › Solid position in diversified footprint › Great branch coverage › Broad product offerings › Strong brand and customer loyalty › Solid capital and liquidity Focused on Profitability and Well Positioned For the Long Run 10 |
 Credit Quality William C. Wells II * * * * |
 Credit Process Improvements Through the Cycle › Complete cover-to-cover review of credit policy › Strengthened credit authorities › Refined portfolio concentration limits › Enforced consistent and sound underwriting standards › Lowered the risk profile of the loan portfolio › Focused on resolution of problem assets › Actively work with customers in need of financial support 2 |
 Total Loan Portfolio $85.9B Investor Real Estate $18.9B Commercial and Industrial $21.1B / 25% Owner Occupied Real Estate $12.5B / 15% Investor Real Estate $18.9B 22% Residential First Mortgage $15.6B / 18% Indirect $1.9B / 2% Direct and Other $1.1B 1% Home Equity $14.8B 17% Land $2.3B / 12% Single Family $1.6B / 9% Condo - $0.4B / 2% Hotel - $1.0B / 5% Industrial - $1.3B / 7% Office $2.8B / 15% Retail $3.6B / 19% Multi Family $4.8B / 25% Other - $1.1B / 6% 3 |
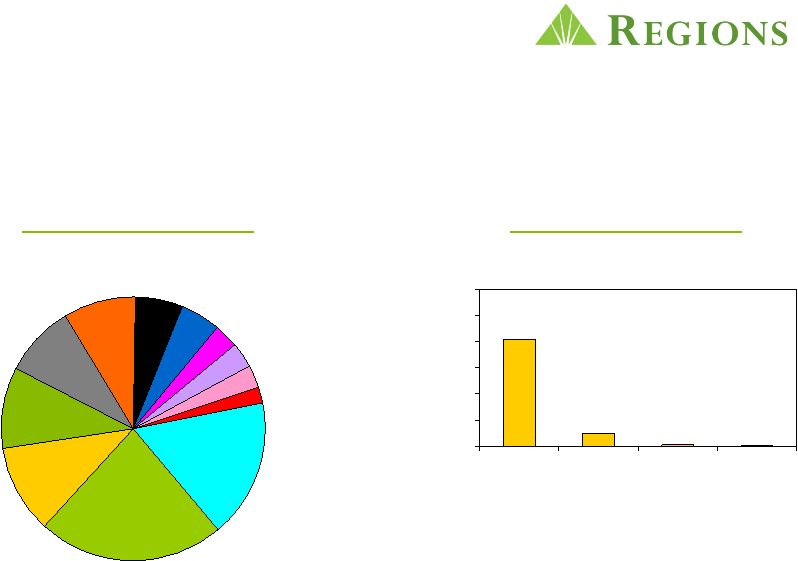 Investor Real Estate Portfolio is Diversified 22% of Total Portfolio Other* $3.1B / 17% FL $4.4B / 23% TX $2.1B / 11% GA $1.9B / 10% TN $1.7B / 9% AL $1.6B / 9% NC $1.1B / 6% LA - $0.9B / 4% MO - $0.6B / 3% SC - $0.6B / 3% AR - $0.5B / 3% Loan Size Geography * Other includes states with exposure of less than 2% 0 5,000 10,000 15,000 20,000 25,000 30,000 <$1MM $1MM- 10MM $10MM- 25MM $25MM+ $806 Thousand Average Loan Balance 20,540 2,551 341 74 # of Loans VA - $0.4B / 2% 4 |
 Credit Metrics are Stabilizing but the Portfolio Remains Stressed › Non-performing asset migration has continued to moderate › Charge-offs have moderated › Another solid quarter in disposing of problem assets › Allowance for Loan and Lease Losses remained level 5 |
 Net Charge-offs Moderating (in millions) 2Q09 3Q09 4Q09 1Q10 2Q10 Net Charge-offs IRE Valuation Losses $129 $191 $215 $198 $142 Investor Real Estate (IRE) 39 45 55 59 74 Commercial 99 136 107 128 117 Consumer Real Estate 164 150 168 177 167 Other Consumer 24 30 32 28 19 Net Charge-offs excluding charge-offs from Sales / Transfers to HFS 455 552 577 590 519 Sales/Transfer to HFS 36 128 115 110 132 Total Net Charge-offs $491 $680 $692 $700 $651 6 |
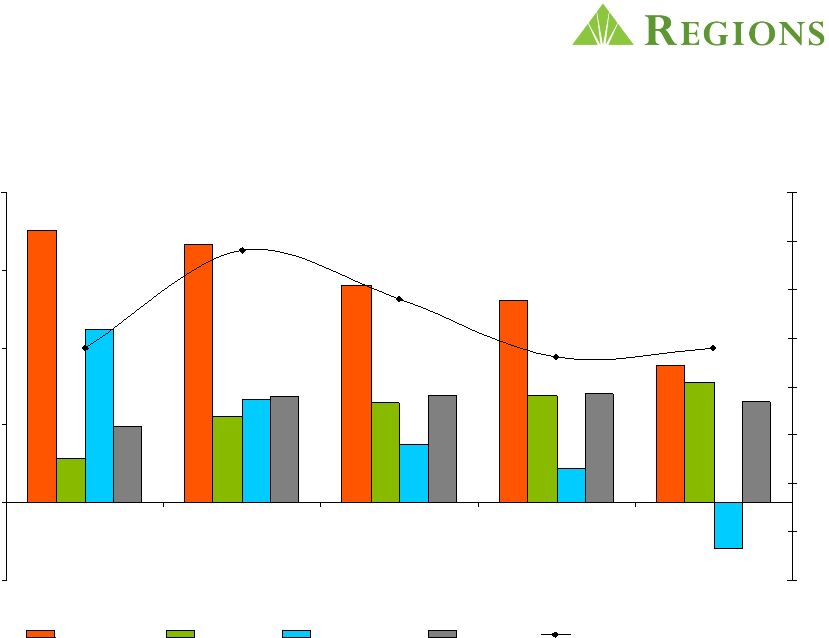 ($500) $0 $500 $1,000 $1,500 $2,000 2Q09 3Q09 4Q09 1Q10 2Q10 0% 5% 10% 15% 20% 25% 30% 35% 40% Gross Additions Dispositions Net NPA Change Charge-Offs Discount on Disposition Activity NPA Migration Moderates 1,758 1,667 1,404 1,306 281 554 643 689 1,122 662 376 221 (297) 887 779 491 680 692 700 651 Dispositions includes OREO Sales, Problem Loan and HFS Sales and Transfers to HFS 7 |
 Provision Stabilized and Matched Charge Offs 491 680 692 700 651 345 487 70 421 $0 $200 $400 $600 $800 $1,000 $1,200 2Q09 3Q09 4Q09 1Q10 2Q10 Net Charge Offs Provision over Net Charge Offs $912 $1,025 $1,179 $770 $651 Loan Loss Provision 8 |
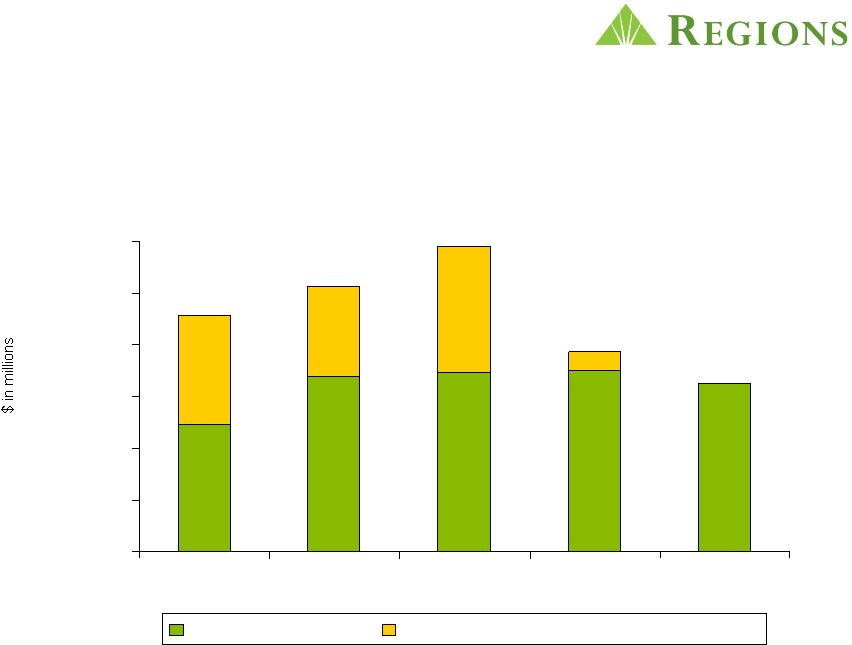
 Total TDRs - $1.6B* $0 $400 $800 $1,200 $1,600 $2,000 2Q09 3Q09 4Q09 1Q10 2Q10 Accruing Non-Accruing $ millions › Modifications are a result of our proactive outreach efforts › Any concession to a customer experiencing financial difficulty creates a TDR Residential Mortgage - 65% Home Equity - 20% Other Consumer - 4% Commercial -11% Consumer TDRs - $1.4B* 95% are accruing interest *Includes accruing loans, non-accruing loans and loans 90+ days past due 9 |
 Customer Assistance Program › To ensure that customers who encounter financial difficulty know there is help available and we want to work with them Achievements › Helped over 30,000 people stay in their homes › Proactively made over 400,000 outreach calls › Recidivism rate is 20% › Foreclosure rate is less than half the national average 10 |
 Gulf Oil Spill Update › Closely monitoring loans across the Gulf and reaching out to customers › The number of customers affected remains a small subset of the overall portfolio › Customer Assistance Program (CAP) continues to assist customers in need of financial support 11 |
 Second Quarter Summary › Non-performing Asset Migration has continued to moderate › Charge-offs moderated › Provision expense moderated › Allowance for Loan and Lease Losses remained level › Investor Real Estate reduced from $26.1B at 12/31/07 to $18.9B at 6/30/2010 › Construction loans down $3.8B from $11.8B at 12/31/07 12 |
 Consumer Services John Owen * * * * |
 Consumer Services Overview Diversified Offerings Multi Channel Delivery Deposits Mortgage Consumer Lending Insurance Credit/Debit Cards Focused on the Customer 2 |
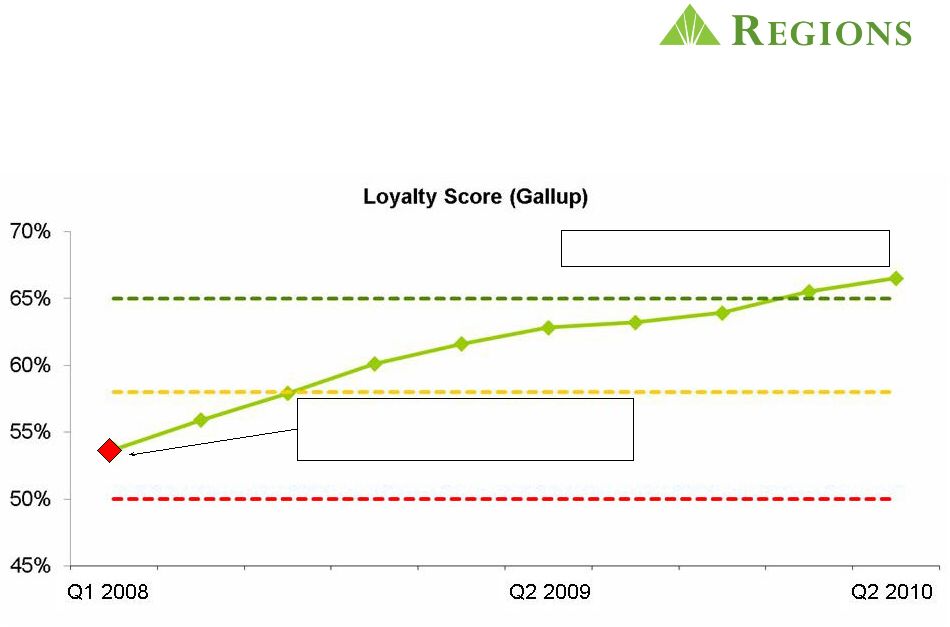 Customer Loyalty is the Foundation for Growth Regions – Q1 2008 Ranked in Middle of the Pack Regions Ranked in Top 10% Excellent - Gallup 90th percentile Average - Gallup 50th percentile Good - Gallup 75th percentile 3 |
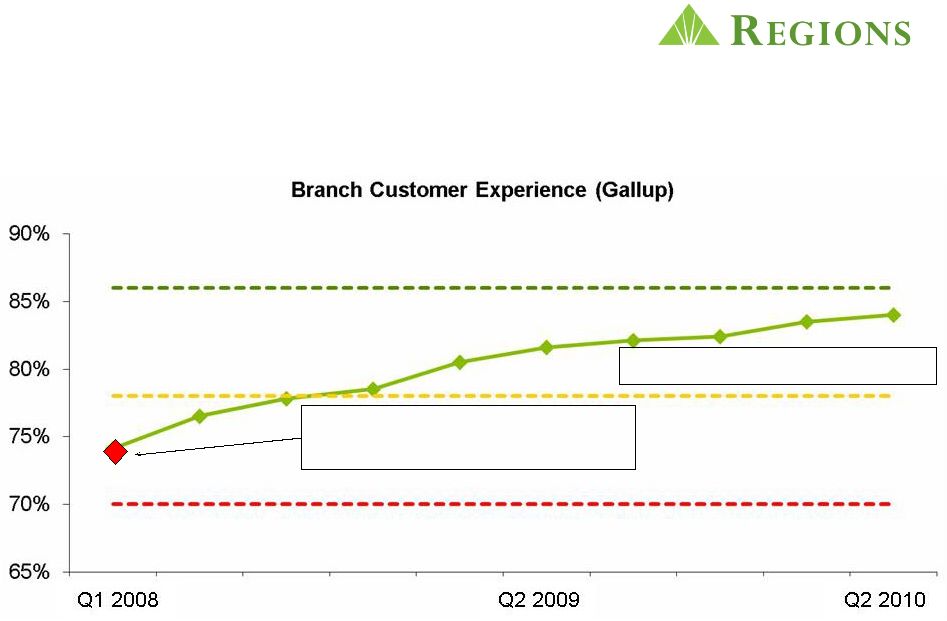 Branch Customer Experience At An All-Time High Excellent - Gallup 90th percentile Average - Gallup 50th percentile Regions Reached Top 20% Regions – Q1 2008 Ranked in Middle of the Pack Good - Gallup 75th percentile 4 |
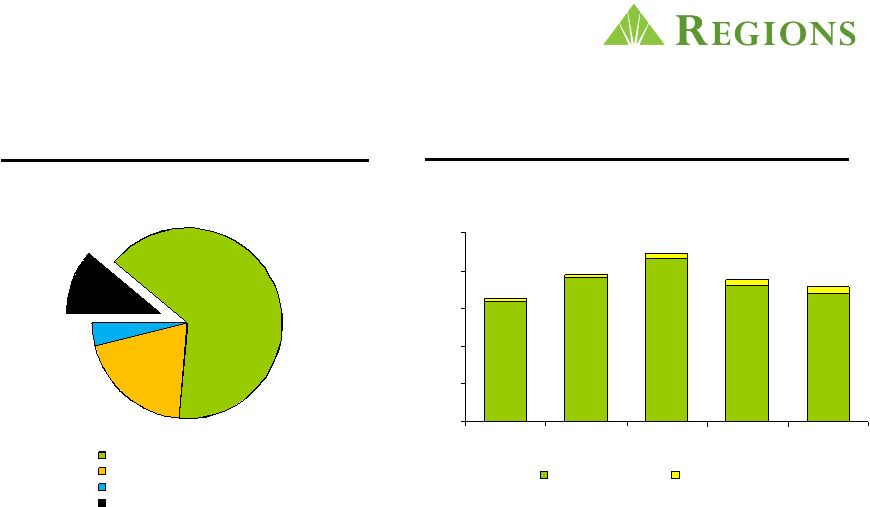
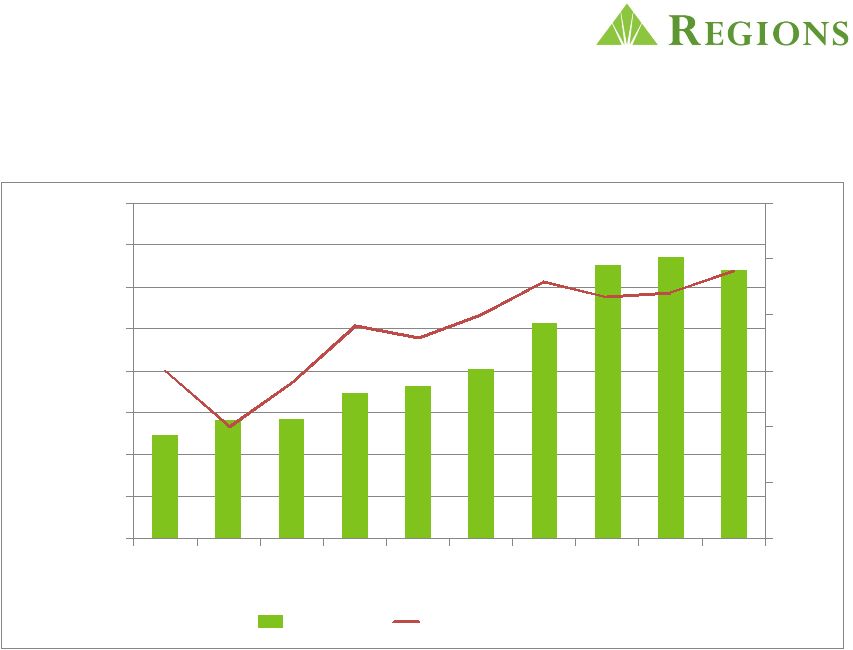
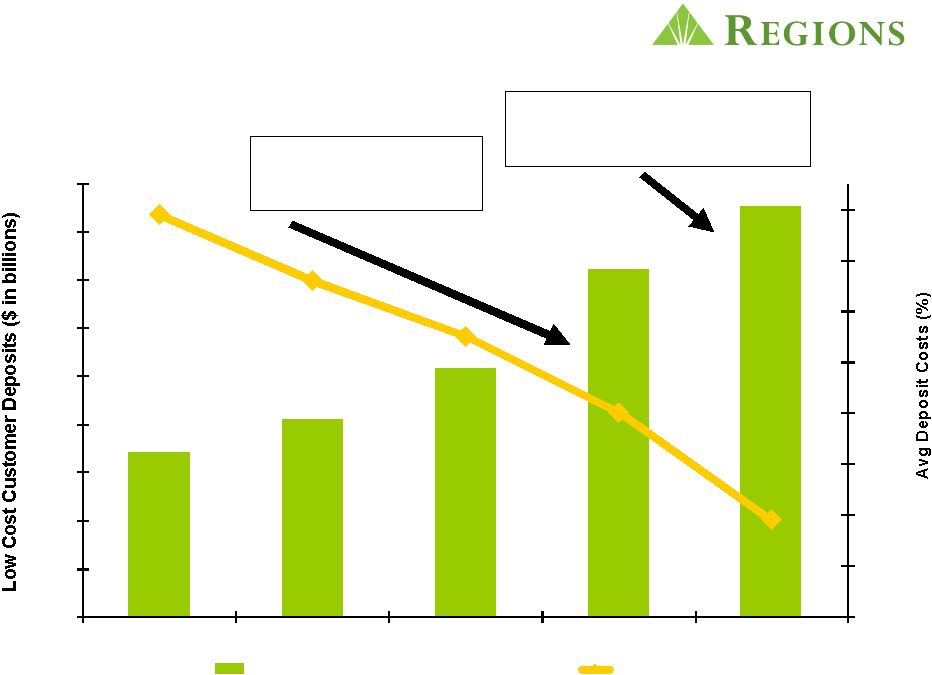 $60.9 $62.2 $64.3 $68.5 $71.1 0.6% 0.7% 0.8% 0.9% 1.0% 1.1% 1.2% 1.3% 1.4% 54.0 56.0 58.0 60.0 62.0 64.0 66.0 68.0 70.0 72.0 Q2 2009 Q3 2009 Q4 2009 Q1 2010 Q2 2010 Low Cost Customer Deposits Deposit Costs Strong Low Cost Deposit Growth While Driving Lower Deposit Costs June balances are 17% higher than prior year 60 bps reduction since 2Q09 139 bps 79 bps 5 |
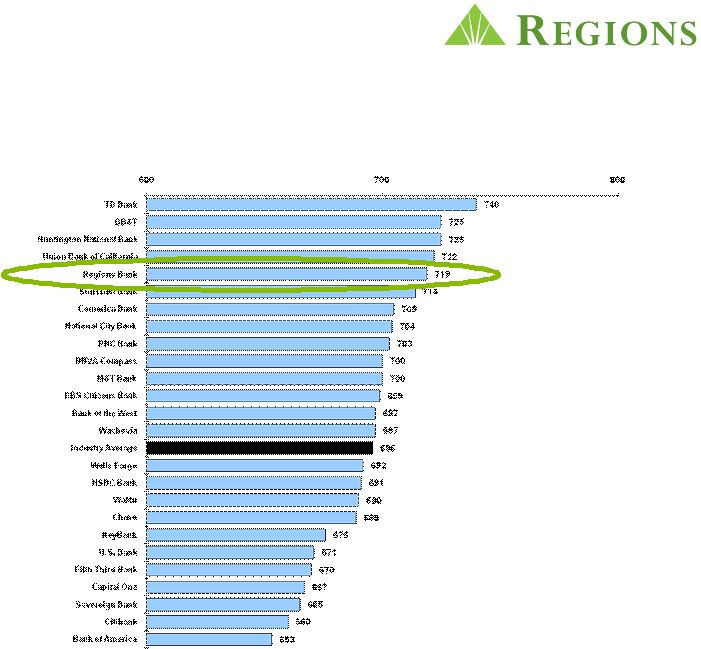
 Peer Bank Deposit Rate Analysis 1Q 2010 vs 2Q 2010 0.35% 0.50% 0.40% 0.76% 0.79% 1.17% 0.78% 0.90% 1.04% 0.54% 0.39% 0.29% 0.00% 0.20% 0.40% 0.60% 0.80% 1.00% 1.20% 1.40% Wells BofA US PNC Comerica M&T SunTrust 5/3 Regions BBT M&I Key 1Q 2Q -0.02% -0.07% -0.08% -0.08% -0.03% -0.05% -0.21% -0.05% -0.05% -0.15% -0.04% -0.02% -0.30% -0.20% -0.10% 0.00% Rate change from 1Q to 2Q Regions Continues Improving Deposit Costs Regions 6 |
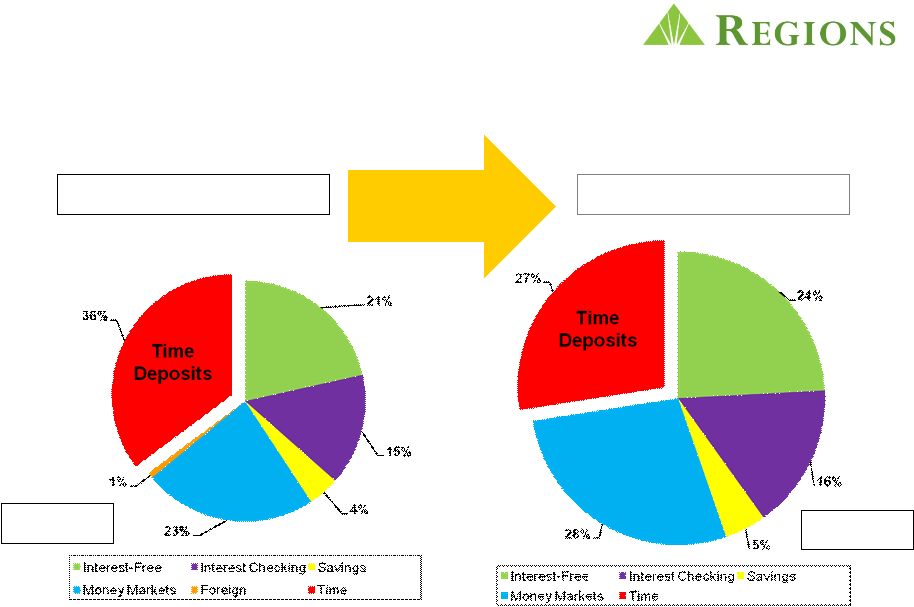 Improving Deposit Mix Driving Lower Deposit Costs 36% Time Deposits 27% Time Deposits Q2 2009 Q2 2010 Reduced Time Deposit Concentration by 25% $95.0B $98.1B 7 |
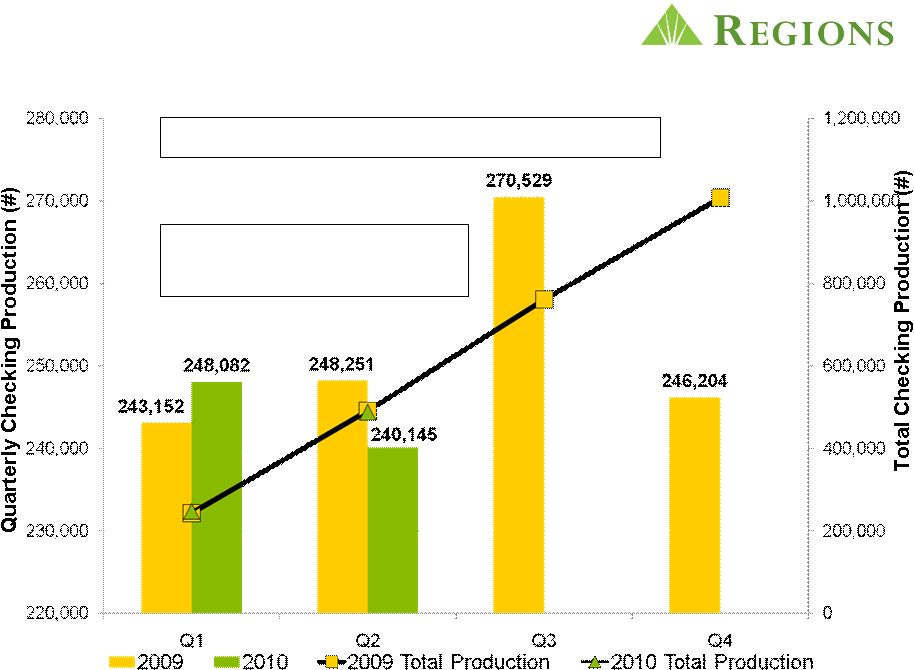 Strong Year Over Year Checking Account Growth Exceeded Road to 1 Million Goal in 2009 On Target to Do It Again 488,200 Opened YTD 8 |
 Continue Rebalancing Profit Pools › Early Adopter – moving away from Free Checking › Increased existing hurdle levels for LifeGreen Accounts to be Free in 2Q 2010 › Moving over 1.1 Million Free Accounts to LifeGreen in 3Q 2010 › Product changes will not impact LifeGreen for Seniors or Students › Completed launch of Relationship Rewards – improving customer loyalty and deepening wallet share › Launching Regions Cashback Rewards in August 9 |
 Regions Mortgage – Expertise, Speed, Simplicity and Exemplary Service Our Customers Count On PORTFOLIO SERVICING PRODUCTION CROSS-SELL • $15.6 Billion June 2010 Portfolio Yield 4.9% • $15.6 Billion June 2009 Portfolio Yield 5.5% • Forecasting $6.8 Billion in 2010 • Second Best Retail Production year • Record year in 2009, $9.6 Billion of Production • Deposit Cross-sell penetration >50% for Mortgage Only Customers • Strong Title Insurance penetration for Refi’s • $40 Billion in Servicing Balances • 316,000 Loans • Foreclosure rates are less than half the Industry Average* * Mortgage Bankers Association of America Foreclosure Rate – Q1, 2010 10 |
 Regions Mortgage vs. Peer Group Average Revenue per Loan Cost per Loan Income per Loan Regions $5,586 $3,331 $2,255 Peer Group Average $5,248 $3,662 $1,586 $5,586 $3,331 $2,255 $5,248 $3,662 $1,586 $0 $1,000 $2,000 $3,000 $4,000 $5,000 $6,000 Highly Profitable Mortgage Production Unit Market Share* – Opportunity to Grow In-Footprint Regions 18 16 14 Profitability Q3 2009 Q4 2009 *Q4 2009 National Market News Survey Q3 2008 11 |
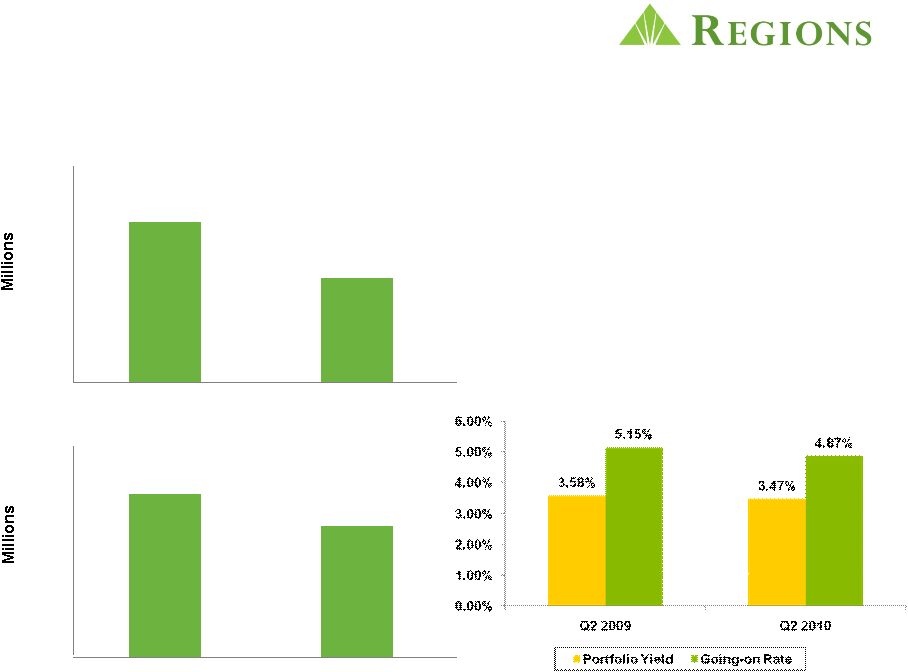 Demand Remains Soft for Home Equity Lending › Demand will improve as unemployment and consumer confidence improve › Current Book of Business is 80% Variable Rate Portfolio Yield vs. Going-on Rate Production Q2 2009 Home Equity Balances Q2 2010 14,802 15,796 16000 14000 Q2 2009 Q2 2010 350 330 346.6 339.2 12 |
 Targeting Growth in Consumer Lending BRANCH SMALL BUSINESS DIRECT TO CONSUMER LOANS INDIRECT AUTO UNDERSERVED CONSUMER • Targeting small businesses between $250,000 and $2 Million • Targeted industries • Targeted geographies • Re-entering Indirect Auto in September • Cost efficient – Low Risk Business Model • Demand improving • Growing segment that is not served well by Banks today • Developing Short Term Loan products – Targeting rollout April 2011 • Demand improving • Pre-approval at New Account Opening to launch in 3Q2010 Growth Growth Growth Growth 13 |
 In Summary › Strong Core Deposit Growth Year Over Year › Improved Deposit Cost 60 Basis Points since 2Q2009 – more to come › Focused on Rebalancing Profit Pools – Deposit Mix Changes, Free Checking, Relationship Rewards, Cash Rewards › Focused on Prudent Loan Growth – Mortgage, Direct, Indirect Auto and Branch Small Business › Achieved Top 10% in Term of Customer Loyalty (Gallup) 14 |
 Business Services John Asbury * * * * |
 We Are Executing the Plan and Positioned for Growth › Managing risk › Diversification of revenue stream › Acquiring and expanding client relationships › Loan growth with pricing discipline › Low cost deposit gathering › Client satisfaction and loyalty 2 |
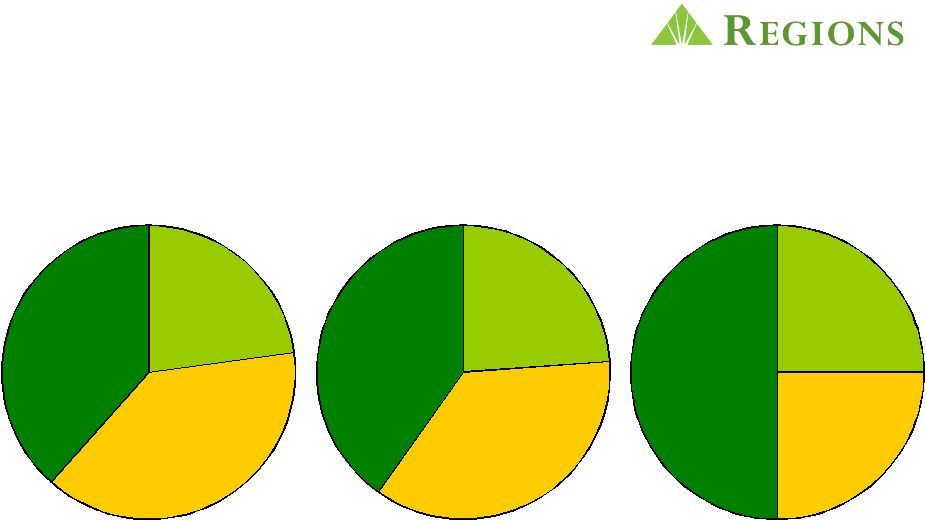 We Are Remixing our Loans Dec – 2013 Commercial 50% Owner Occupied Real Estate 25% Investor Real Estate 25% Commercial 40% Owner Occupied Real Estate 24% Investor Real Estate 36% Commercial 38% Owner Occupied Real Estate 23% Investor Real Estate 39% Jun – 2010 Dec – 2009 3 |
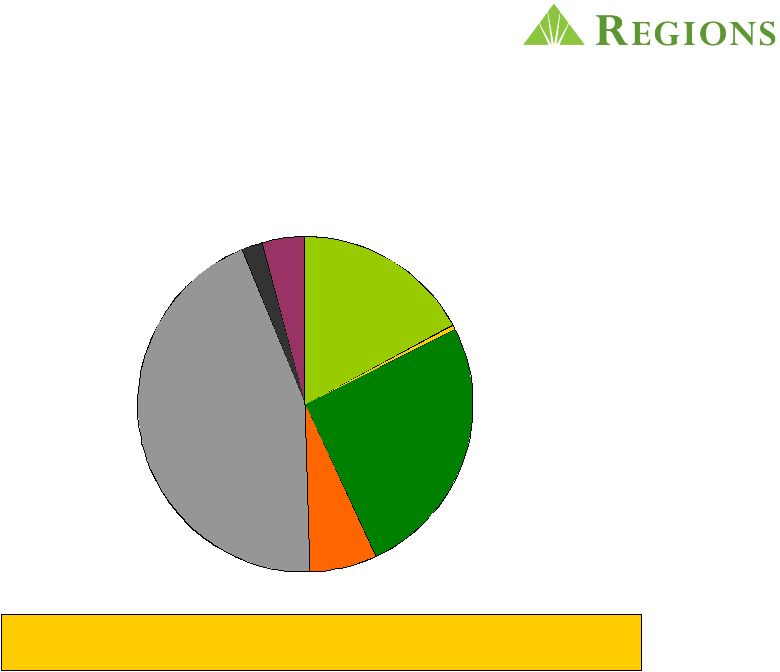
 Revenue Is Well-Diversified by Line of Business Product Groups › Treasury Management › Capital Markets / Syndications (Morgan Keegan) › Equipment Finance Specialized Groups › Business Capital (ABL) › Healthcare › Transportation › Public, Institutional, Non-profit › Franchise Restaurant Middle Market › C&I › Specialized Groups Commercial Real Estate › Professional income property developers, owners and operators › Public real estate companies › Homebuilders › Affordable housing tax credits Small Business › Business Banking › Community Banking › Branch Small Business 40% 20% 40% 4 |
 We Have a Game Plan for Growing Loans › New client acquisition › Growing C&I Syndications with a lead and relationship focus › Leverage specialty lending groups › Business Capital › Equipment Finance › Healthcare › Lending to targeted industries › Branch Small Business focus › Transportation › Franchise Restaurant 5 |
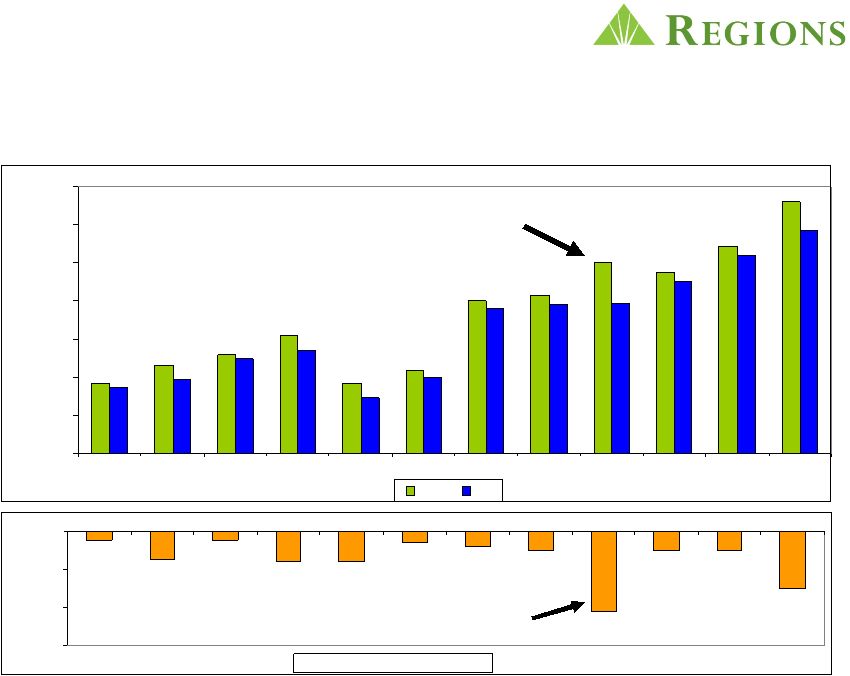
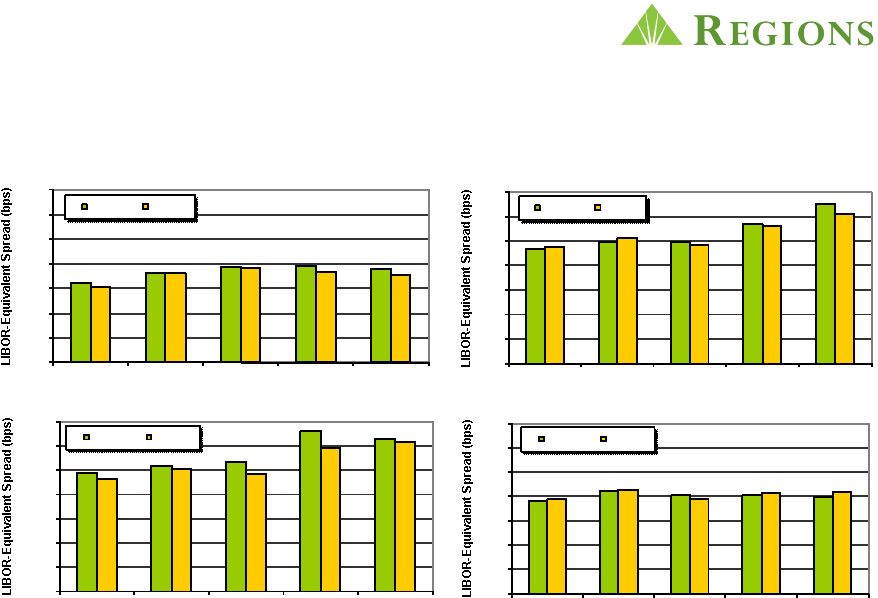 Loan Pricing Compares Favorably to Market Data Source: Standard & Poor’s Risk Adjusted New and Renewed Credit Spread Trends (excluding fees) 6 100 150 200 250 300 350 400 450 Q2 2009 Q3 2009 Q4 2009 Q1 2010 Q2 2010 LIBOR - C&I Regions Market 100 150 200 250 300 350 400 450 Q2 2009 Q3 2009 Q4 2009 Q1 2010 Q2 2010 LIBOR - Community Banking Regions Market 100 150 200 250 300 350 400 450 Q2 2009 Q3 2009 Q4 2009 Q1 2010 Q2 2010 LIBOR - Business Banking Regions Market 100 150 200 250 300 350 400 450 Q2 2009 Q3 2009 Q4 2009 Q1 2010 Q2 2010 LIBOR - CRE Regions Market |
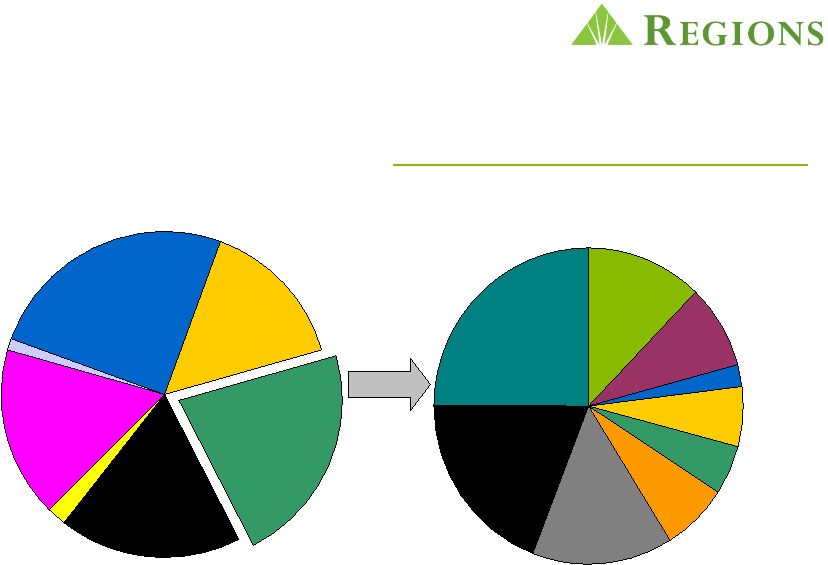
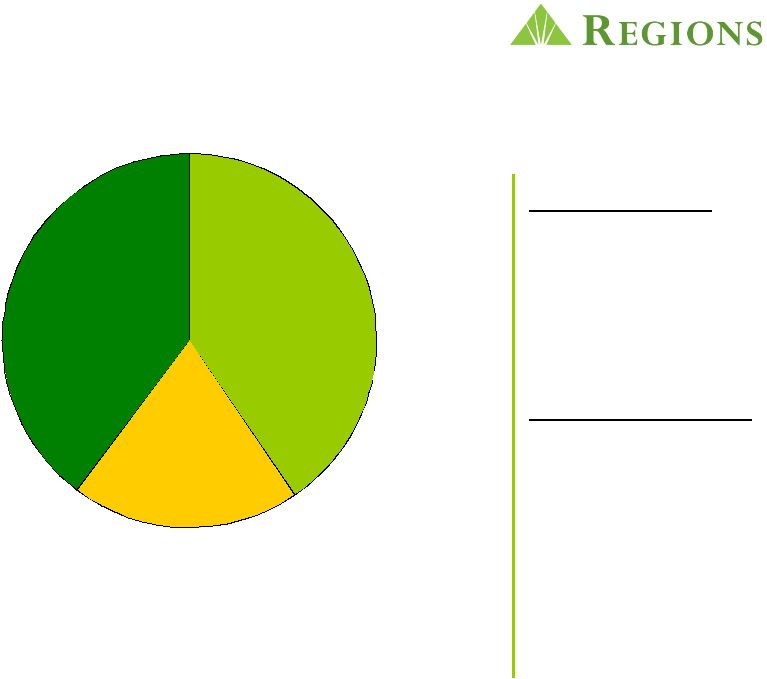
 An Intense Focus on Relationship Banking Results in Stable, Low-Cost Deposits June 2010 61% of all deposits are checking Interest Checking 17% Savings 1% Money Market excl Euro 26% CDs 6% Interest-Free Checking 44% Eurodollar Sweeps 2% Repo Sweeps 4% 7 |
 We Have Continued to Reduce Interest Bearing Deposit Costs 2.55% 0.89% 0.60% 0.00% 0.50% 1.00% 1.50% 2.00% 2.50% 3.00% 1Q '08 2Q '09 2Q '10 8 |
 J.D. Power Ranks Regions Small Business Customer Satisfaction Among Industry Best Source: J.D. Power and Associates 2009 Small Business Banking Satisfaction Study SM 9 |
 Regions Middle Market and Small Business Stand Alone Among Major Banks in Our Footprint by Growing Marketshare in 2009 “Regions is the only major provider in its segment to capitalize on the opportunity and grow marketshare during this challenging time.” ~ Greenwich & Associates 10 |
 Morgan Keegan & Company, Inc. John Carson * * |
 Morgan Keegan Business Model › Relationships, Expertise, Execution › “Glass-Steagall” Model › Low Leverage › No Credit-Related Losses › No Proprietary Trading › Diversified Portfolio of Businesses › Key Activities › Investment Banking › Institutional Sales, Trading, and Research › Retail Brokerage › Personal and Corporate Trust 2 |
 Historical Performance 0% 5% 10% 15% 20% 25% 30% 0 200,000 400,000 600,000 800,000 1,000,000 1,200,000 1,400,000 1,600,000 2000 2001 2002 2003 2004 2005 2006 2007 2008 2009 Revenue Operating Margin 3 |
 Business Units › Private Client Group › Fixed Income Capital Markets › Equity Capital Markets › Investment Banking › Regions Morgan Keegan Trust › Regions Capital Markets* › Regions Private Banking* *New Divisions 4 |
 Legal and Regulatory Environment › Fin Reg as currently defined: Minimal impact › No prop trading › Fiduciary standard? › RMK and a “Tale of Two Cities” › Regulatory actions 5 |
 Strategies and Opportunities › Business Model Works! › Low Cost › Low Risk › Steady Growth 1.Maximize profitability from Fixed Income and Trust 2.Capitalize on Retail Wealth Management opportunities 3.Leverage Industry Expertise to build a Universal Bank to the Middle Markets › Healthcare › Energy › Public Finance › Real Estate › Transportation 6 |
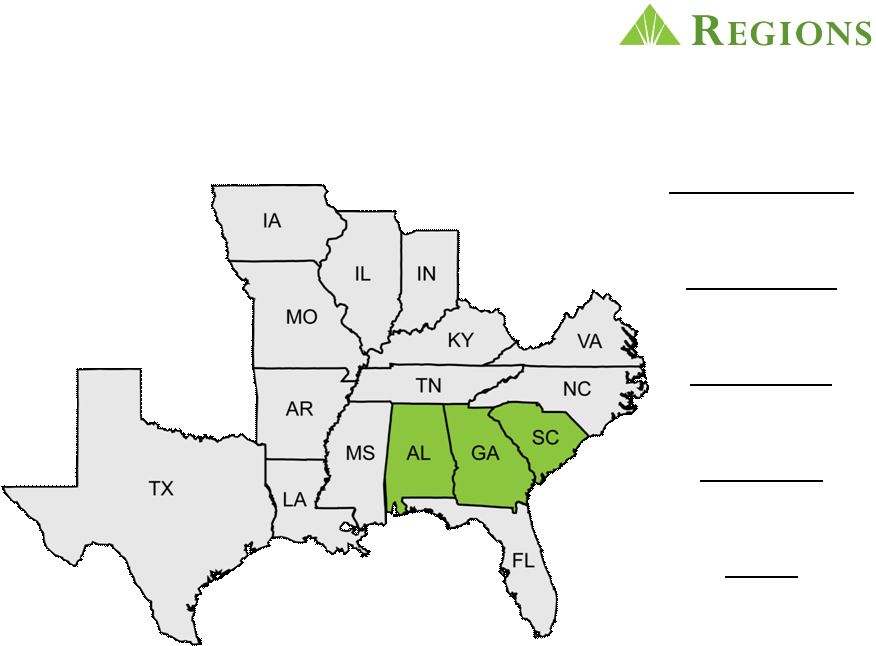 Geography Review: Bill Ritter Total Deposits $24.0B Total Loans $17.6B Associates 4,017 Branches 422 ATMs 519 1 |
 Market Composition Industry Drivers › Manufacturing › Healthcare – Specialty and Research › Aerospace/Defense Economic Stats › High Population Growth – Young, educated workers in Atlanta and military/civilian in Huntsville › Low costs of living and of doing business 2 Dominant Market Share in Alabama Growth Opportunity in Atlanta |
 Opportunities Accelerate growth in our Atlanta Market › Upgraded talent in all Lines of Business › Increase Market Penetration – Branches and ATMs Capitalize on Market Disruption › Bank Mergers: Wells/Wachovia and BB&T/Colonial › Bank Failures: 44 in 2009 and 2010 Develop Government Contracting Business › Full banking relationship with privately held defense contractor Continue to Leverage Partnerships › Regions Morgan Keegan Trust › Regions Business Capital 3 |
 Geography Review: Brett Couch Total Deposits $18.8B Total Loans $16.2B Associates 3,121 Branches 397 ATMs 440 1 |
 Market Composition Industry Drivers › Professional / Business Services › Education › Healthcare › Retail Trade › Leisure/Hospitality Economic Stats › 11.7% unemployment rate is 5th highest in the country, down last two months › Home values down 46% from the 2006 peak, flat four consecutive months › 20th largest economy in the world › 21 commercial airports, 14 deep water sea ports, proposed high speed rail 2 Migration of consumers and businesses to Florida (climate, low taxes) RF 4.4% market share and 7.4% outlet share…growth opportunity |
 Opportunities Accelerate Small Business Growth › 1.6 million in Florida… 4th in country › Stability, expertise, and personal service › Emphasis in branches Increase Consumer Market Share › Population of 18 million… 4th in country › Market deposits… $400 billion › Market share opportunity Leverage Morgan Keegan Partnership › 592,000 HHs with $500M+ investable assets 3 |
 Geography Review: Keith Herron Total Deposits $26.9B Total Loans $17.1B Associates 4,239 Branches 514 ATMs 684 1 |
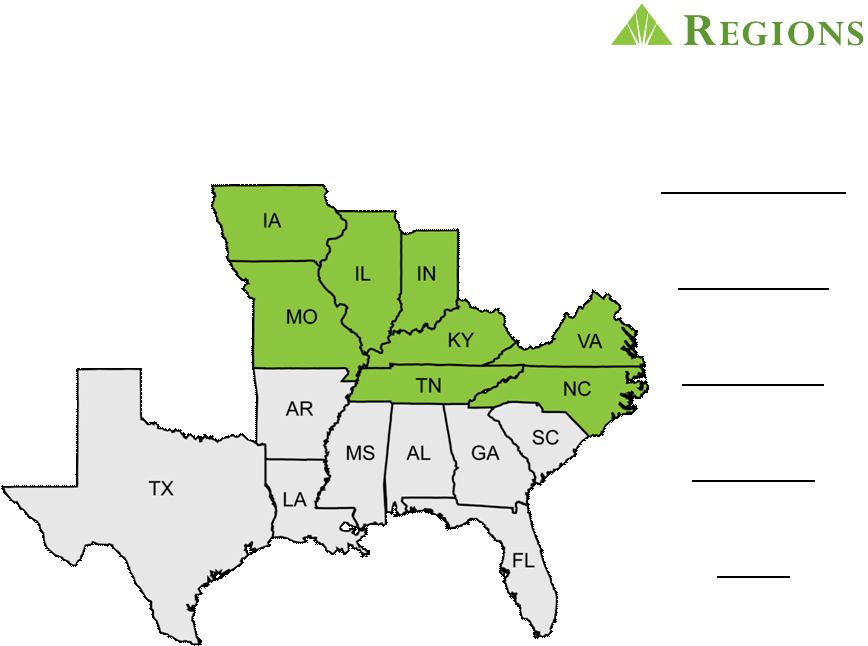
 Market Composition Industry Drivers › Healthcare › Agriculture › Transportation › Manufacturing Economic Stats › Home to 78 Fortune 500 Companies › Relocations and Expansions remain steady 2 #1 Market Share in Tennessee Dominant Nashville Bank – “City on the Move” Midsouth footprint brings economic diversity to Regions |
 Opportunities Accelerate Growth in Midwest Markets › St. Louis (Gateway Initiative) and Indianapolis (Indy Initiative) › Expand agricultural banking into markets with Regions presence Healthcare › Nashville is home to over 20 publically traded healthcare companies › Capture Nashville healthcare market share › Build out healthcare throughout the Midsouth Deepen Existing Relationships › Morgan Keegan partnership › Tennessee cross-sell 3 |
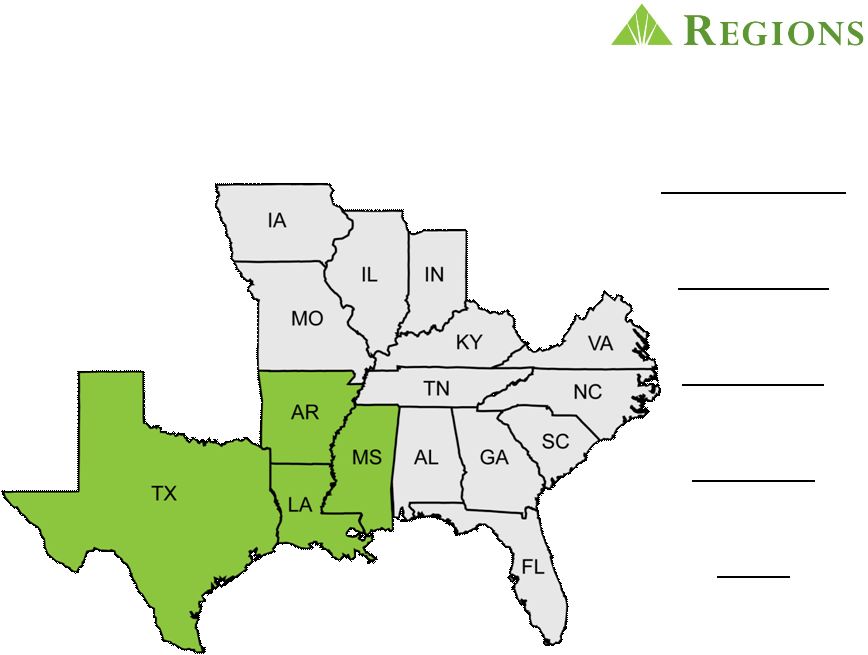 Geography Review: Ronnie Smith Total Deposits $21.4B Total Loans $12.4B Associates 3,565 Branches 441 ATMs 518 1 |
 Market Composition Industry Drivers › Water Ports / Waterways › Petro Chemical › Energy / Oil and Gas Economic Stats › Ten Metro Markets across Footprint › Home to 70 Fortune 500 Companies › Unemployment below National Average › Agriculture › Healthcare 2 Natural Resource Focus |
 Opportunities Leverage Top 3 Market Share in Mississippi, Arkansas and Louisiana › 75% of revenue growth in these markets comes from existing client base › Stronger focus on Business to Business selling through established branch network Growth Market in Texas › Attacking market through strategic acquisition of Business Services teams focused in Dallas, Houston and Austin Natural Resource Focus › Waterways, Agriculture and Oil and Gas › Leverage proven industry expertise throughout the region Leverage Strategic Partnerships Throughout Region › Morgan Keegan › Regions Mortgage › Regions Insurance › Specialty Lending 3 |
 Appendix * * * * |
 Appendix – Non-GAAP Financial Measures Note: The following tables in the next two slides illustrate the method of calculating the non-GAAP financial measures used in this slide presentation: 2 Q2 Q3 Q4 Q1 Q2 ($ in millions) 2009 2009 2009 2010 2010 Net Interest Income (GAAP) $ 831 $ 845 $ 850 $ 831 $ 856 Non-Interest Income (GAAP) 1,199 772 718 812 756 Less Adjustments: Securities gains (losses), net 108 4 (96) 59 Gain on sale of Visa shares 80 - - - - Leveraged lease termination gains 189 4 71 19 - Gain on early extinguishment of debt 61 - - - - Core Non-Interest Income (non-GAAP) 761 764 743 734 756 Core Revenue (non-GAAP) 1,592 1,609 1,593 1,565 1,612 Non-Interest Expense (GAAP) 1,231 1,243 1,219 1,230 1,326 Less Adjustments: Loss on early extinguishment of debt - - - 53 - FDIC special assessment 64 - - - - Securities impairment, net 69 3 - 1 - Branch consolidation costs - 41 12 8 - Regulatory charge - - - - 200 Core Non-Interest Expense (non-GAAP) 1,098 1,199 1,207 1,168 1,126 Core Pre-Tax Pre-Provision Net Revenue (non-GAAP) 494 410 386 397 486 |
 Appendix – Non-GAAP Financial Measures 3 Q2 Q3 Q4 Q1 Q2 ($ amounts in millions, except per share data) 2009 2009 2009 2010 2010 Net income (loss) available to common shareholders (GAAP) (244) (437) (606) (255) (335) Adjusted Items, Net of Tax (65) 25 (55) 2 200 Net income (loss) available to common shareholders, excluding adjusted items (non-GAAP) (309) (412) (551) (253) (135) Weighted-average diluted shares 876 1,189 1,191 1,194 1,200 Earnings (loss) per common share - diluted (GAAP) $ (0.28) $ (0.37) $ (0.51) $ (0.21) $ (0.28) Earnings (loss) per common share, excluding adjustments - diluted (non-GAAP) $ (0.35) $ (0.35) $ (0.46) $ (0.21) $ (0.11) |