 Keefe, Bruyette & Woods 2011 Boston Bank Conference March 1, 2011 David Turner, Chief Financial Officer Exhibit 99.1 |
 Forward-Looking Statements 2 › This presentation may include forward-looking statements which reflect Regions’ current views with respect to future events and financial performance. The Private Securities Litigation Reform Act of 1995 (“the Act” provides a “safe harbor” for forward-looking statements which are identified as such and are accompanied by the identification of important factors that could cause actual results to differ materially from the forward looking statements. For these statements, we, together with our subsidiaries, claim the protection afforded by the safe harbor in the Act. Forward-looking statements are not based on historical information, but rathe are related to future operations, strategies, financial results or other developments. Forward-looking statements are based on management’s expectations as well as certain assumptions and estimates made by, an information available to, management at the time the statements are made. Those statements are based on general assumptions and are subject to various risks, uncertainties and other factors that may caus actual results to differ materially from the views, beliefs and projections expressed in such statements. These risks, uncertainties and other factors include, but are not limited to, those described below: › The Dodd-Frank Wall Street Reform and Consumer Protection Act became law on July 21, 2010, and a number of legislative, regulatory and tax proposals remain pending. Additionally, the U.S. Treasury and federal banking regulators continue to implement, but are also beginning to wind down, a number of programs to address capital and liquidity in the banking system. Proposed rules, including those that are part of the Basel III process, could require banking institutions to increase levels of capital. All of the foregoing may have significant effects on Regions and the financial services industry, the exact nature of which cannot be determined at this time. › The impact of compensation and other restrictions imposed under the Troubled Asset Relief Program (“TARP”) until Regions repays the outstanding preferred stock and warrant issued under the TARP, including restrictions on Regions’ ability to attract and retain talented executives and associates. › Possible additional loan losses, impairment of goodwill and other intangibles, and adjustment of valuation allowances on deferred tax assets and the impact on earnings and capital. › Possible changes in interest rates may increase funding costs and reduce earning asset yields, thus reducing margins. Increases in benchmark interest rates would also increase debt service requirements for customers whose terms include a variable interest rate, which may negatively impact the ability of borrowers to pay as contractually obligated. › Possible changes in general economic and business conditions in the United States in general and in the communities Regions serves in particular, including any prolonging or worsening of the current unfavorable economic conditions, including unemployment levels. › Possible changes in the creditworthiness of customers and the possible impairment of the collectability of loans. › Possible changes in trade, monetary and fiscal policies, laws and regulations and other activities of governments, agencies, and similar organizations, may have an adverse effect on business. › The current stresses in the financial and real estate markets, including possible continued deterioration in property values. › Regions' ability to manage fluctuations in the value of assets and liabilities and off-balance sheet exposure so as to maintain sufficient capital and liquidity to support Regions' business. › Regions' ability to expand into new markets and to maintain profit margins in the face of competitive pressures. › Regions' ability to develop competitive new products and services in a timely manner and the acceptance of such products and services by Regions' customers and potential customers. › Regions' ability to keep pace with technological changes. › Regions' ability to effectively manage credit risk, interest rate risk, market risk, operational risk, legal risk, liquidity risk, and regulatory and compliance risk. › Regions’ ability to ensure adequate capitalization which is impacted by inherent uncertainties in forecasting credit losses. › The cost and other effects of material contingencies, including litigation contingencies, and any adverse judicial, administrative or arbitral rulings or proceedings. › The effects of increased competition from both banks and non-banks. › The effects of geopolitical instability and risks such as terrorist attacks. › Possible changes in consumer and business spending and saving habits could affect Regions' ability to increase assets and to attract deposits. › The effects of weather and natural disasters such as floods, droughts and hurricanes, and the effects of man-made disasters such as the Gulf of Mexico oil spill. › Possible downgrades in ratings issued by rating agencies. › Potential dilution of holders of shares of Regions’ common stock resulting from the U.S. Treasury’s investment in TARP. › Possible changes in the speed of loan prepayments by Regions’ customers and loan origination or sales volumes. › Possible acceleration of prepayments on mortgage-backed securities due to low interest rates and the related acceleration of premium amortization on those securities. › The effects of problems encountered by larger or similar financial institutions that adversely affect Regions or the banking industry generally. › Regions’ ability to receive dividends from its subsidiaries. › The effects of the failure of any component of Regions’ business infrastructure which is provided by a third party. › Changes in accounting policies or procedures as may be required by the Financial Accounting Standards Board or other regulatory agencies. › The effects of any damage to Regions’ reputation resulting from developments related to any of the items identified above. › The foregoing list of factors is not exhaustive. For discussion of these and other factors that may cause actual results to differ from expectations, look under the captions “Forward-Looking Statements” and “Risk Factors” in Regions’ Annual Report on Form 10-K for the year ended December 31, 2010. › The words "believe," "expect," "anticipate," "project," and similar expressions often signify forward-looking statements. You should not place undue reliance on any forward-looking statements, which speak only as of the date made. We assume no obligation to update or revise any forward-looking statements that are made from time to time. |
  Our primary focus is returning to sustainable profitability through disciplined execution of our strategic priorities Our primary focus is returning to sustainable profitability through disciplined execution of our strategic priorities 3 |
 Why Regions? • Strong Southeastern franchise with comprehensive line of business offerings • Leading brand favorability and exceptional service quality • Solid core business performance • Aggressively identifying and disposing of problem assets • Capital and liquidity remain solid 4 |
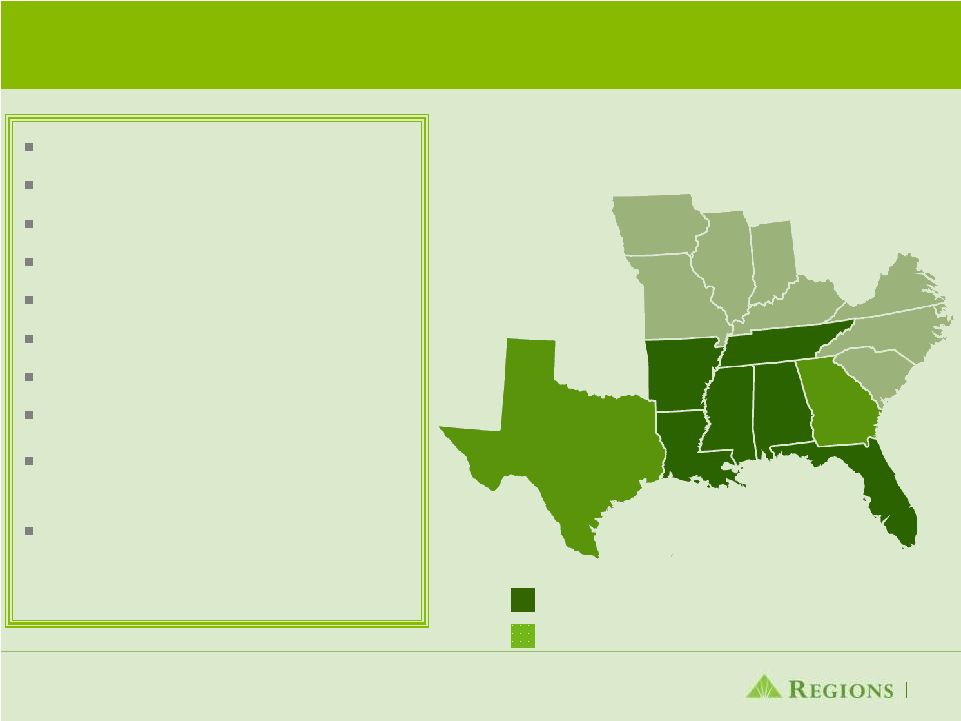 Ranked 5 th or Better in Market Share Targeted Growth Areas Headquarters Birmingham, AL Associates 27,829 Branches 1,772 Morgan Keegan Offices 321 Regions Insurance Offices 30 ATMs 2,148 Deposits* $95 Billion Loans* $83 Billion Projected population growth for Regions footprint is above US average growth Operate on one fully integrated technology platform # 1 Market Share in Alabama, Tennessee and Mississippi Strong Southeastern Franchise 5 * As of 12/31/2010 |
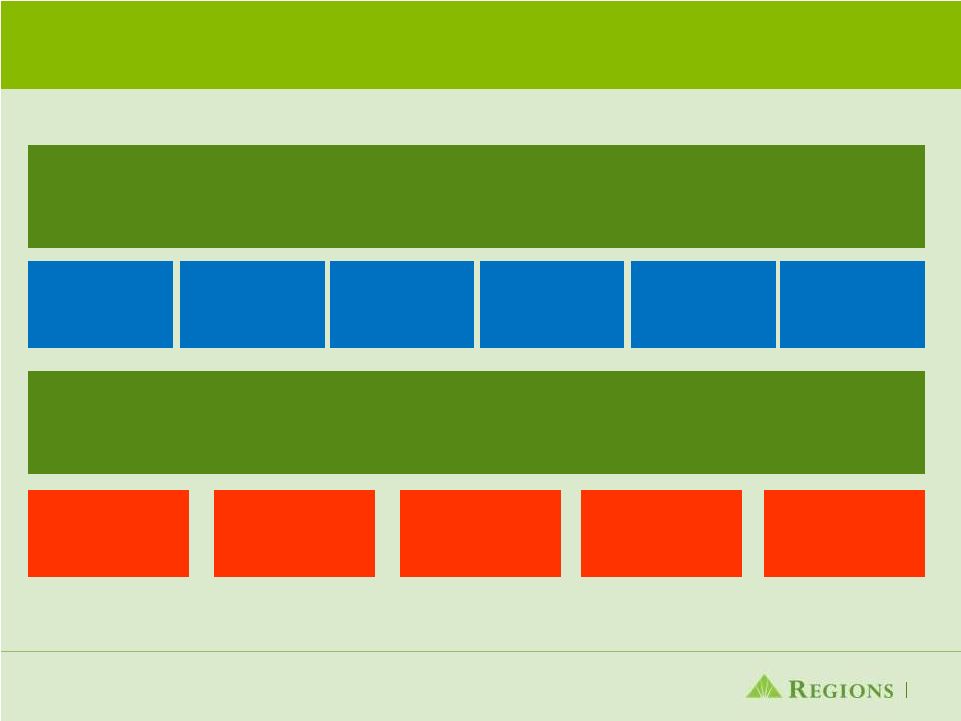 Consumer Services 6 Deposits Mortgage Consumer Lending Insurance Credit/Debit Cards Branches Online Banking Mobile Banking Telebanking ATMs Diversified Offerings Multi-Channel Delivery Private Banking |
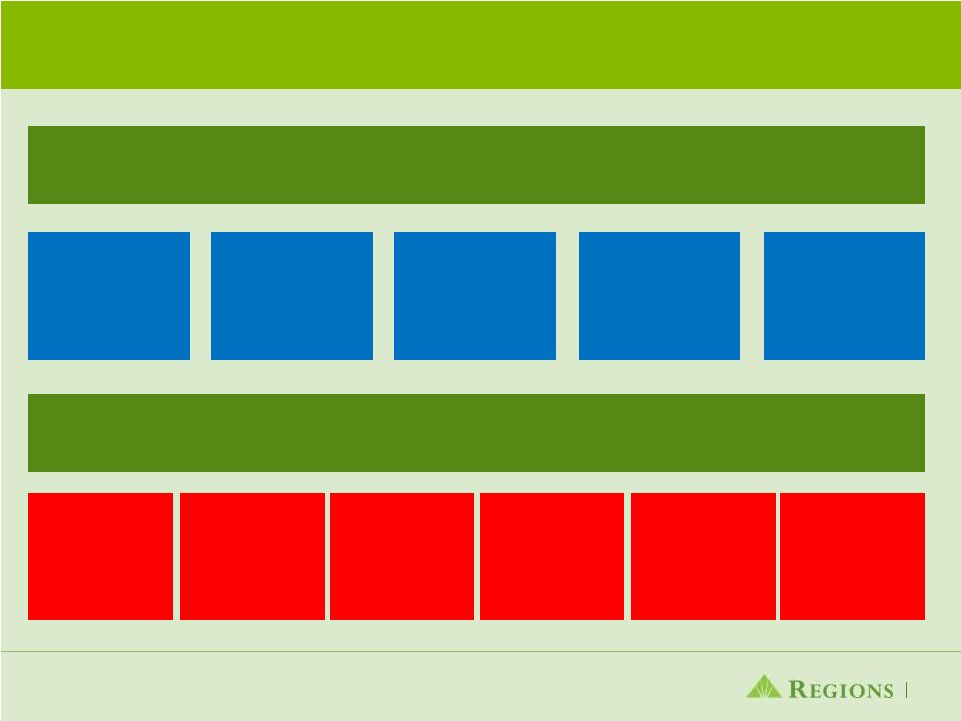
 Business Services 7 Business Segments Small Business Middle Market Real Estate Core Middle Market Sales > $20MM Specialized Groups Public, Institutional, Not for Profit, Healthcare, Transportation, Franchise Restaurant, Energy, Regions Business Capital Commercial Real Estate Affordable Housing Homebuilders Real Estate Corporate Banking Product Groups Treasury Management Capital Markets / Syndications Equipment Finance Relationship Managed ›Business Banking (Metro Markets) Sales $2-20MM ›Community Banking Sales > $2MM Branches Sales < $2MM |
 Morgan Keegan 8 Business Units Fixed Income Capital Markets Equity Capital Markets Investment Banking Private Client Group Regions Morgan Keegan Trust Services Institutional Sales & Trading, Fixed Income Research Equity Research, Institutional Sales & Trading Municipal Finance, M&A Public Offerings, Corporate Debt Retail Brokerage Personal & Institutional Trust, Timber Management |
 Competitive Advantage Driven by Regions continues to perform in the top 10% in customer loyalty and top 20% for branch service quality (2) (1) Based on TNS survey 3Q10 Consumer Banking Market Effectiveness Study (2) Based on Gallup survey (3) Based on Bain survey (4) Based on Prime Performance study (5) 2010 Greenwich Excellence Award Regions has the highest brand favorability (1) Regions named “Friendliest Bank” (4) Regions received Excellence Award for Small Business and Middle Market Banking (5) Regions ranked top in customer loyalty (3) Outstanding customer growth and retention Approximately 1 million new checking accounts in 2009 and 2010 Continue to be recognized for our Excellent Service Quality and Brand Strength Effectively meeting customers’ needs allows Regions to gain market share What Makes Us Different? 9 Customer Loyalty |
 Strong Low-Cost Deposit Growth While Driving Lower Deposit Costs 10 (1) Full Year Average Low Cost Deposits (1) Low Cost Deposits (1) Deposit Costs (1) Deposit Costs (1) |
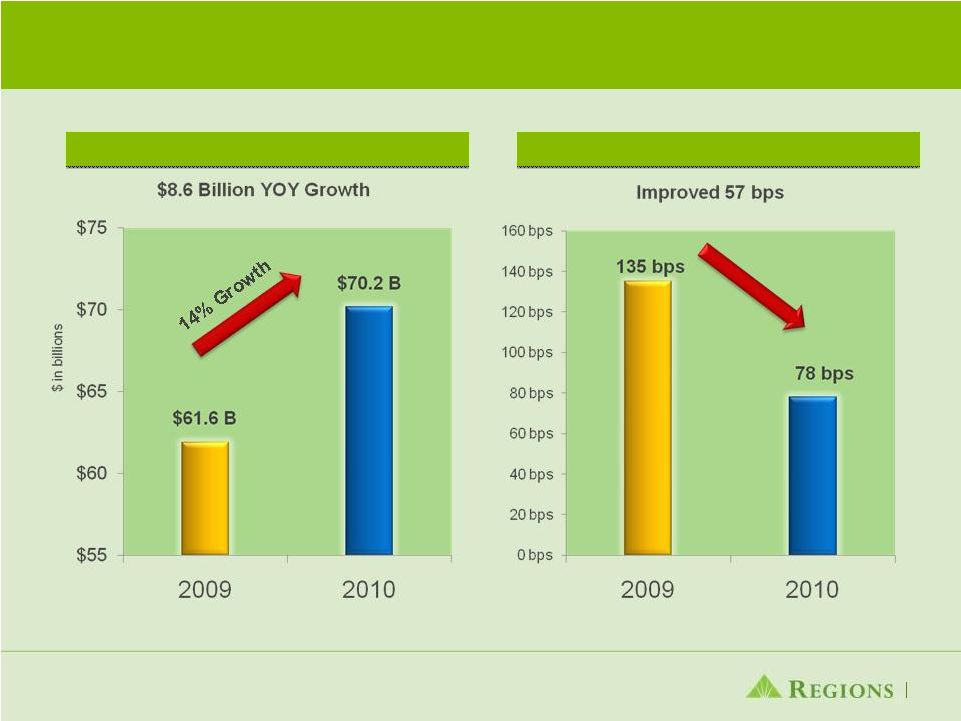
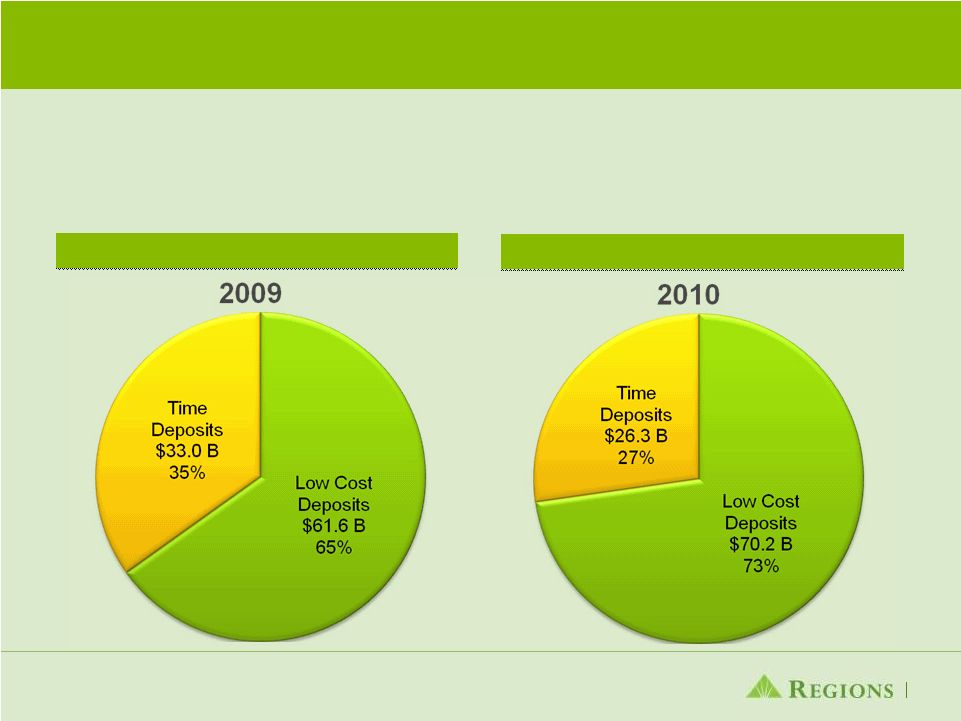 Improved Deposit Mix • Reduced Average Time Deposit mix from 35% in 2009 to 27% in 2010 • Grew Low-Cost Deposits 14% year-over-year 11 Average Deposits $94.6B Average Deposits $94.6B Average Deposits $96.5B Average Deposits $96.5B |
 Disciplined Focus on New Checking Account Growth • Approximately 1 million new checking accounts in 2009 and 2010 • Grew quality checking accounts (1) by 3% over 2009 • Increased sales productivity with new account sales per branch improving 3.4% from 2009 • Continued efforts to improve checking portfolio profitability through fee generating accounts that provide customer value and fairly compensate Regions • Fee based accounts grew 262% over 2009 • Realize full potential of new accounts by selling deeper to new relationships through new account conversations and onboarding 12 (1) Quality checking accounts are those accounts that have a average balance of $500 and / or have at least 10 customer transactions |
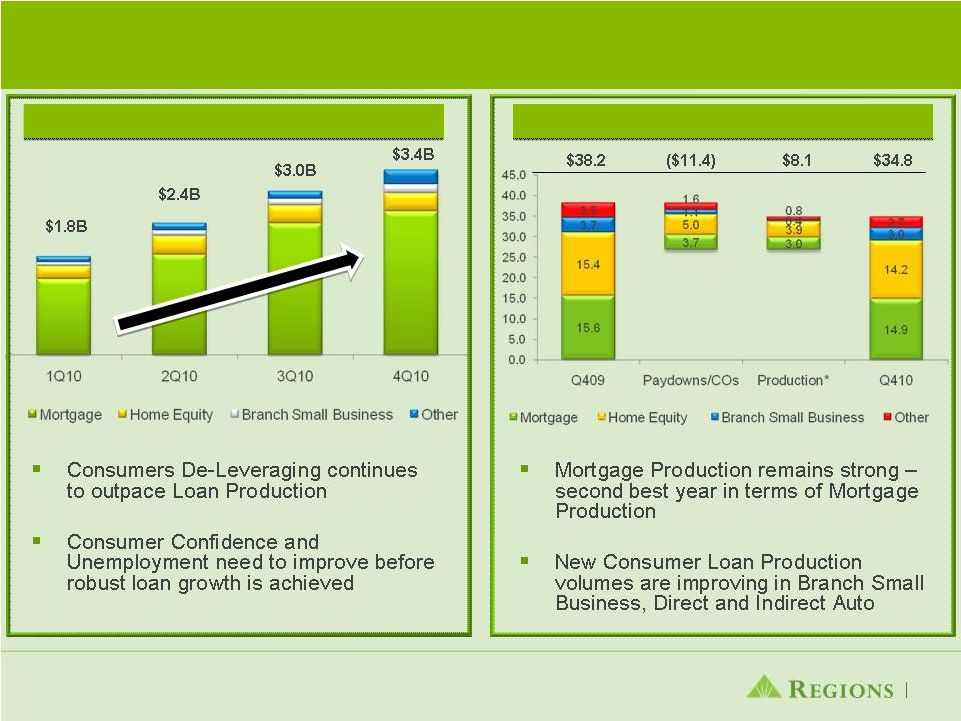 Consumer Loan Production Improving; However Consumers Continue to De-Leverage 13 *$5.2B in Mortgage production sold to Agencies Consumer Loan Production Consumer Loan Production Consumer Loans Consumer Loans |
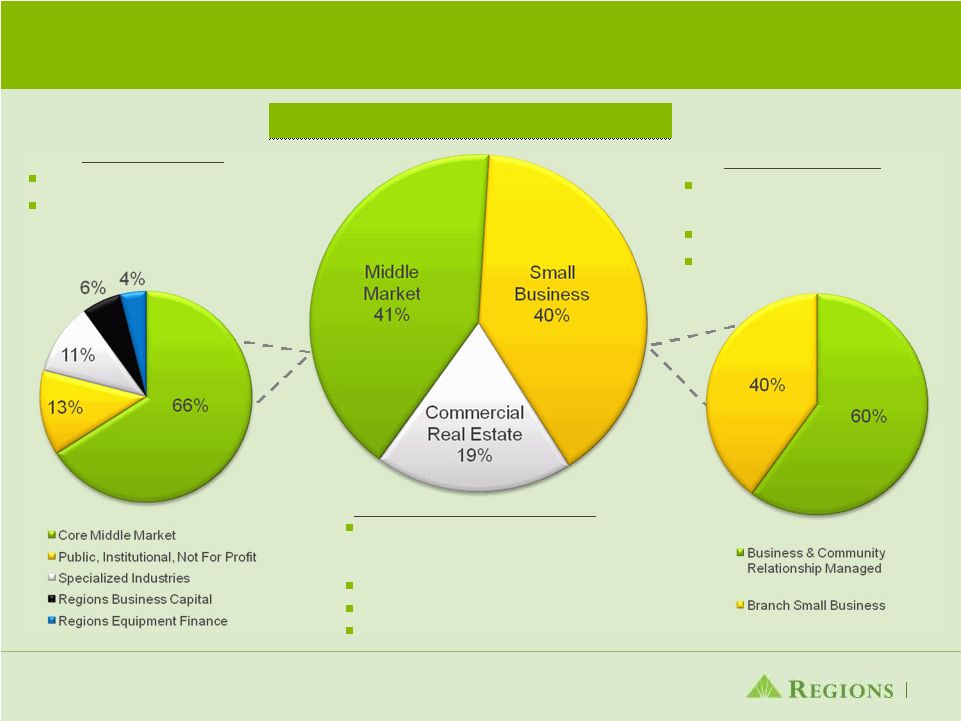 Middle Market and Small Business Comprise 81% of Business Service Revenue 14 Average Loans (1) Average Loans (1) (1) Average balances 4Q10 Small Business Business Banking (Metro Markets) Community Banking Branch Small Business Middle Market Commercial and Industrial Specialized Groups Commercial Real Estate Professional income property developers, owners and operators Public real estate companies Homebuilders Affordable housing tax credits |
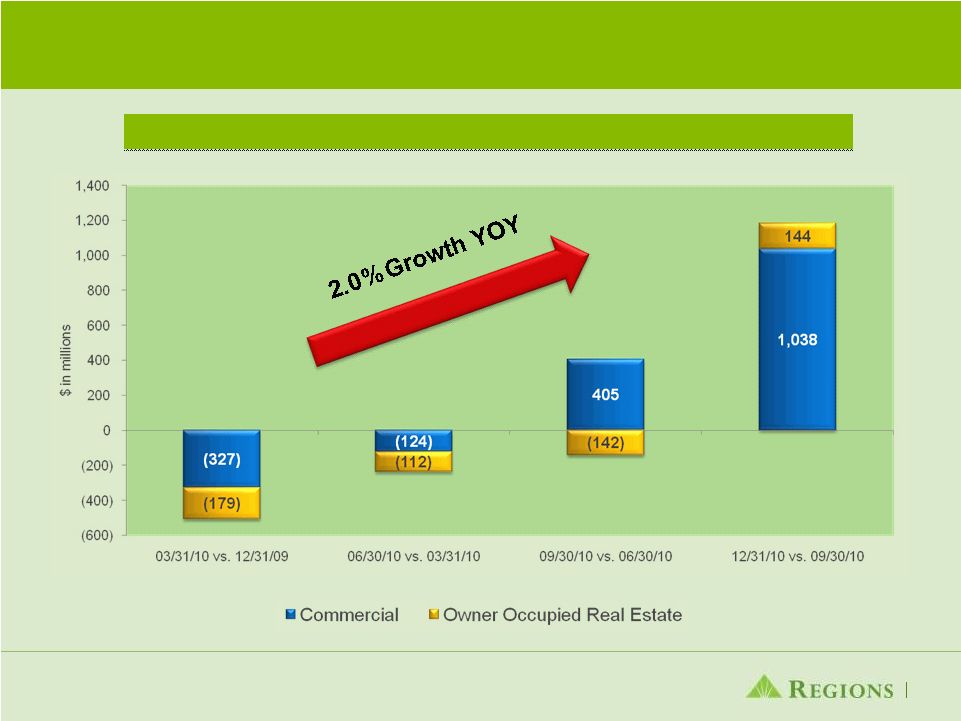 We are Growing Commercial Loans Commercial & Owner Occupied Real Estate Loan Growth Commercial & Owner Occupied Real Estate Loan Growth 15 |
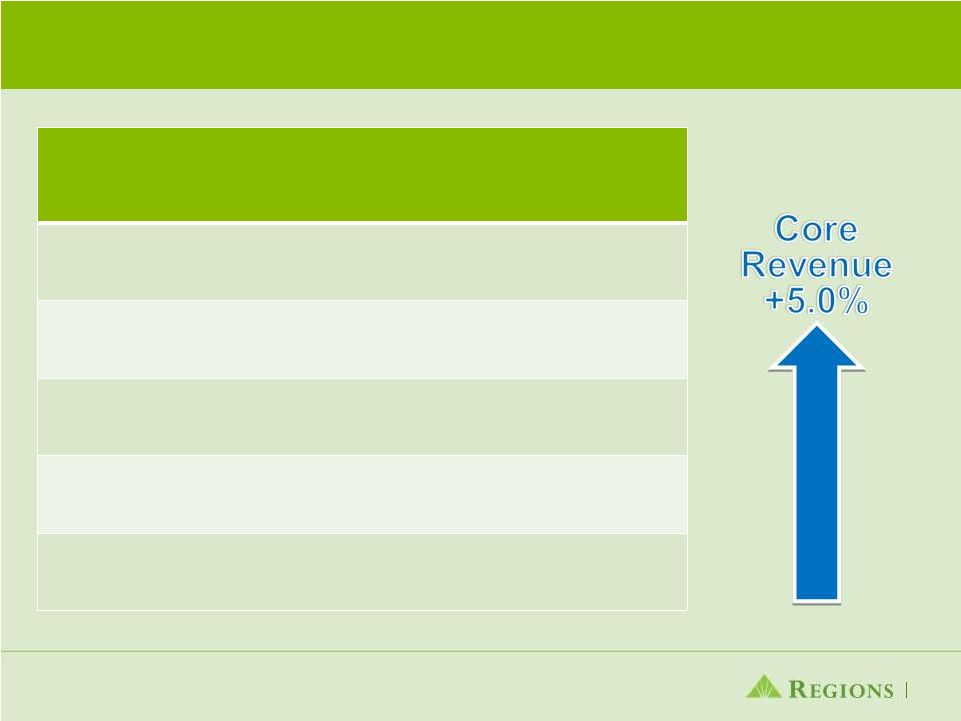 Core revenue continues to grow 16 * Non-GAAP; refer to Appendix for Non-GAAP reconciliation ($ in millions) Net Interest Income Core Non- Interest Revenue* Total Core Revenue 4Q10 $877 + $794 = $1,671 3Q10 $868 + $748 = $1,616 2Q10 $856 + $756 = $1,612 1Q10 $831 + $734 = $1,565 4Q09 $850 + $743 = $1,593 |
 Net Interest Margin Impacted by Excess Liquidity and Non-Accruals 17 Net Income & Net Interest Margin Net Income & Net Interest Margin Impact of Excess Liquidity & Non-Accruals on NIM Impact of Excess Liquidity & Non-Accruals on NIM 3.00% 3.27% 3.20% 3.19% 3.06% |
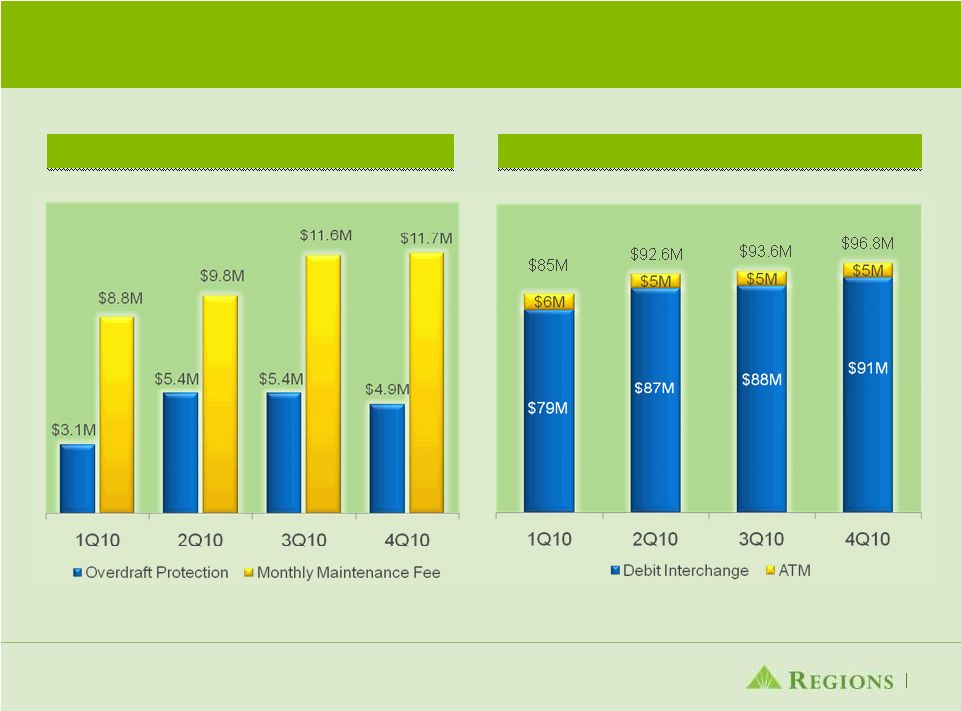 Growth of Fee Income and Debit Card Interchange Migration to Fee Based Accounts Migration to Fee Based Accounts Growth in Debit / ATM Fees Growth in Debit / ATM Fees 18 |
 Strengthened Our Core Franchise Through Productivity & Efficiency Initiatives (1) Excludes $6 billion goodwill impairment (2) Non-GAAP; refer to Appendix for Non-GAAP reconciliation 19 ($ in millions) 2007 2008 2009 2010 Branches 1,965 1,900 1,895 1,772 Reduced branch count by 10% since 2007 Headcount 33,161 30,784 28,509 27,829 Headcount declined 5,332 or 16% Total Expenses $4,660 $4,792 (1) $4,751 $4,985 Adjusted Expenses (2) $4,246 $4,448 $4,559 $4,667 Expenses continue to be impacted by credit-related expenses, elevated FDIC expenses and professional and legal fees Credit-related expenses $153 $282 $424 $439 Credit-related costs should subside as the economy recovers |
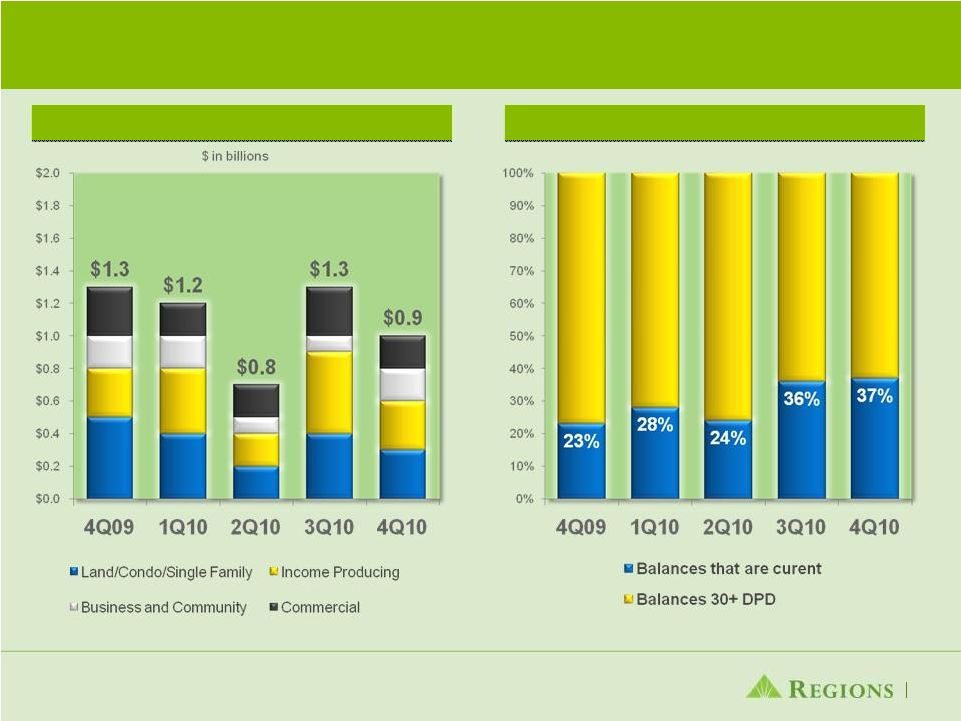 Non-Performing Loan Inflows Decline Ending Balances NPL Inflow by Type NPL Inflow by Type Business Services Gross NPLs Business Services Gross NPLs 20 |
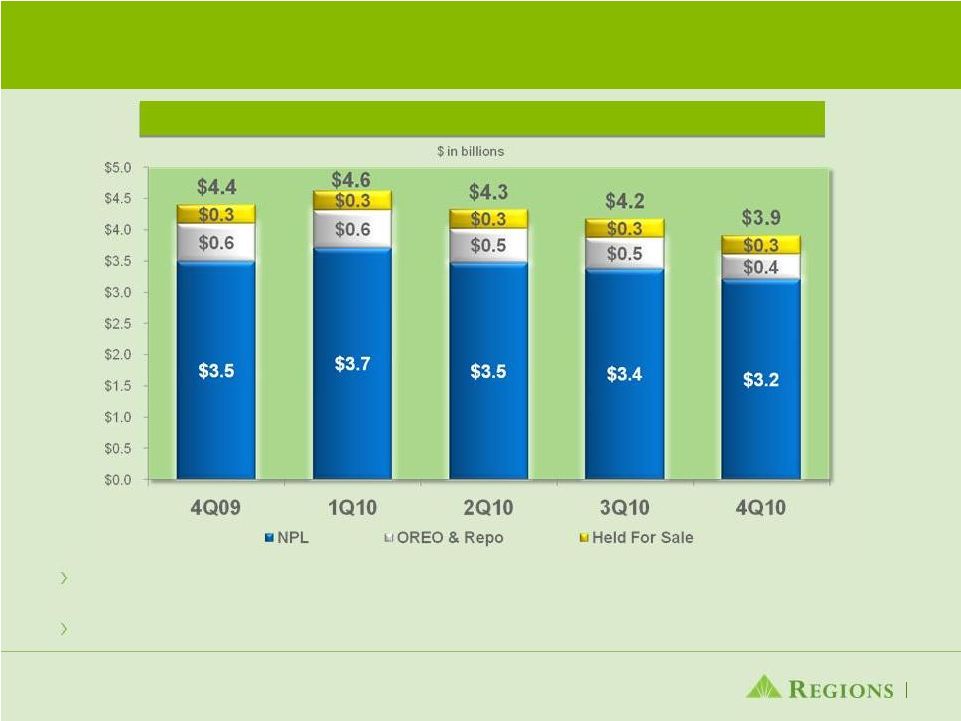 Non-performing Asset Levels Decline Non-performing assets declined $308 million from third quarter For the full year declined $494 million Non-Performing Assets Non-Performing Assets 21 |
 Conservative Marks and Reserves Already Taken on Impaired Loans Note1: Impaired loans include non-accrual commercial and investor real estate loans, excluding leasing, and all TDRs (including accruing commercial, investor real estate, and consumer TDRs) Note 3: Legal balance represents the contractual obligation due from the customer and includes net book value plus cumulative partial charge-offs and interest payments received on principal. Impaired Loans as of December 31, 2010 ($ in millions) Legal Balance Charge-offs & Payments Received Book Value Related Allowance Charge-offs, Payments and Allowance as % of Legal Balance Commercial and industrial $ 545 $ 124 $ 421 $ 102 41% Commercial real estate mortgage - owner occupied 746 96 650 167 35% Commercial real estate construction - owner occupied 47 16 31 10 55% Total commercial 1,338 236 1,102 279 38% Commercial investor real estate mortgage 1,693 273 1,420 319 35% Commercial investor real estate construction 638 150 488 154 48% Total investor real estate 2,331 423 1,908 473 38% Residential first mortgage 1,113 60 1,053 126 17% Home equity 378 13 365 46 16% Indirect and other consumer 67 - 67 1 1% Total consumer 1,558 73 1,485 173 16% Total impaired loans $ 5,227 $ 732 $ 4,495 $ 925 32% 22 Note 2: Book Value represents the total unpaid principal balance of the impaired loans, which is reduced for interest payments received on non-accrual loans. Book Value is shown before any allowance for loan losses. |
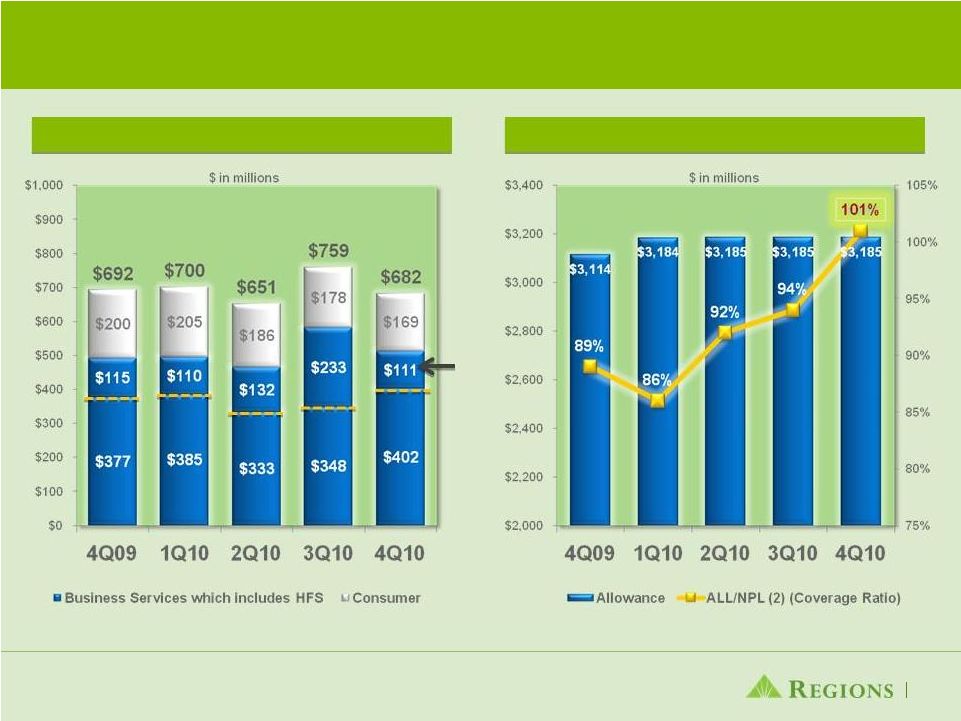 Loan Charge-Offs and Allowance (1) Loan charge-offs related Sales / Transfer to Held for Sale (2) Excludes loans held for sale Loan Charge-Offs Loan Charge-Offs Allowance & Coverage Allowance & Coverage 23 HFS (1) |
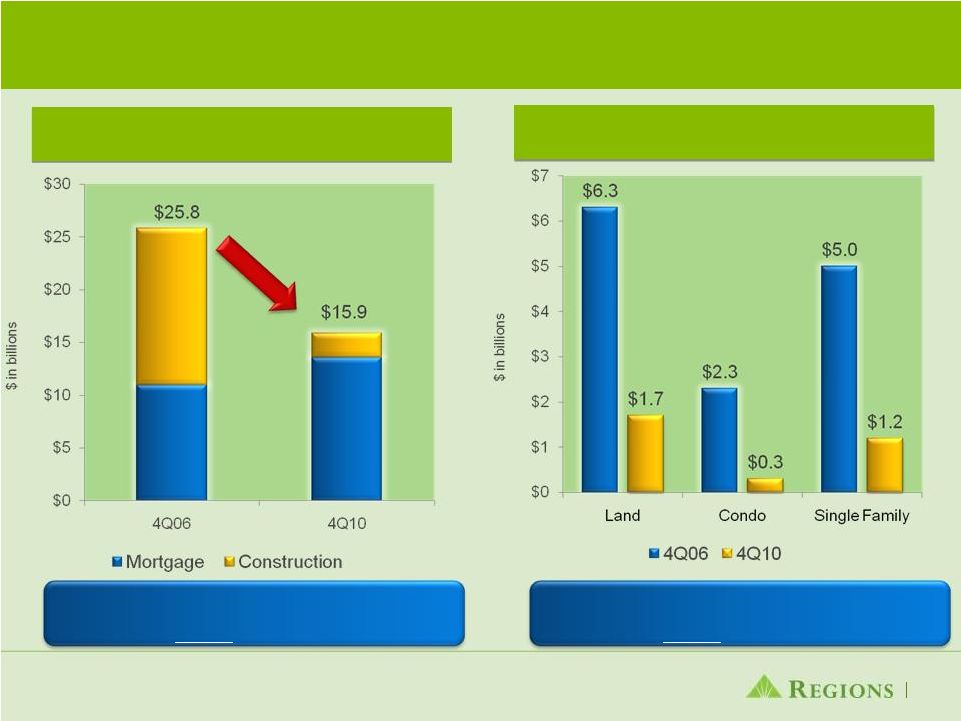 Higher Risk Portfolio Segments Significantly Reduced 24 Total Investor Real Estate Higher Risk Investor Real Estate Segments Reduced Investor Real Estate $9.9 B or 38% over 4 years Reduced High Risk Segments $10.4 B or 76% over 4 years |
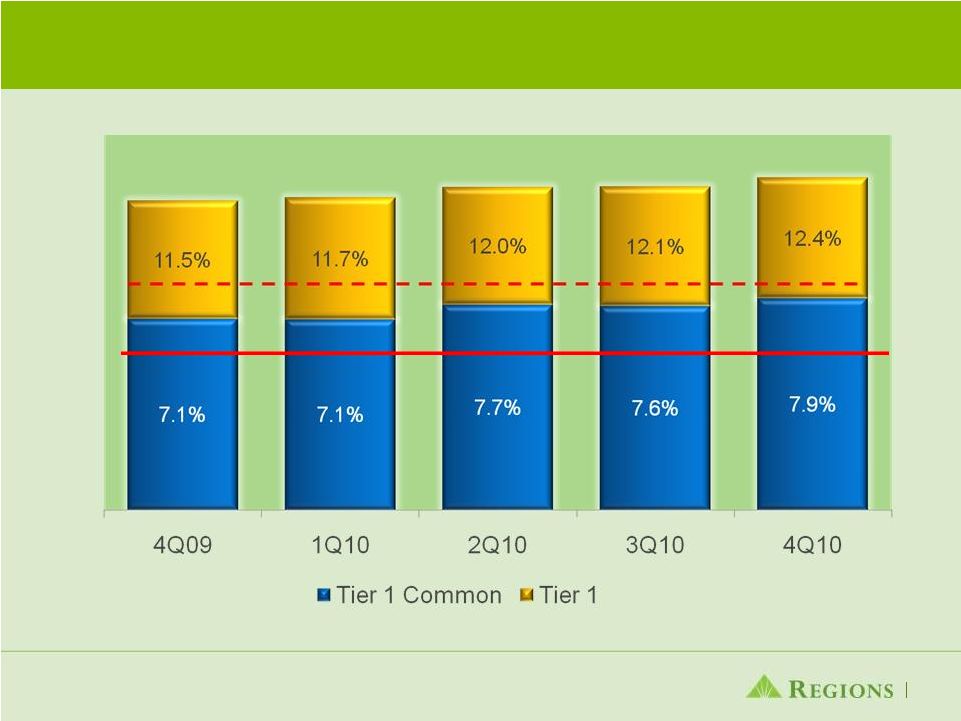 Solid Capital; Above proposed Basel minimum ratios Basel Tier 1 Basel T1C 25 |
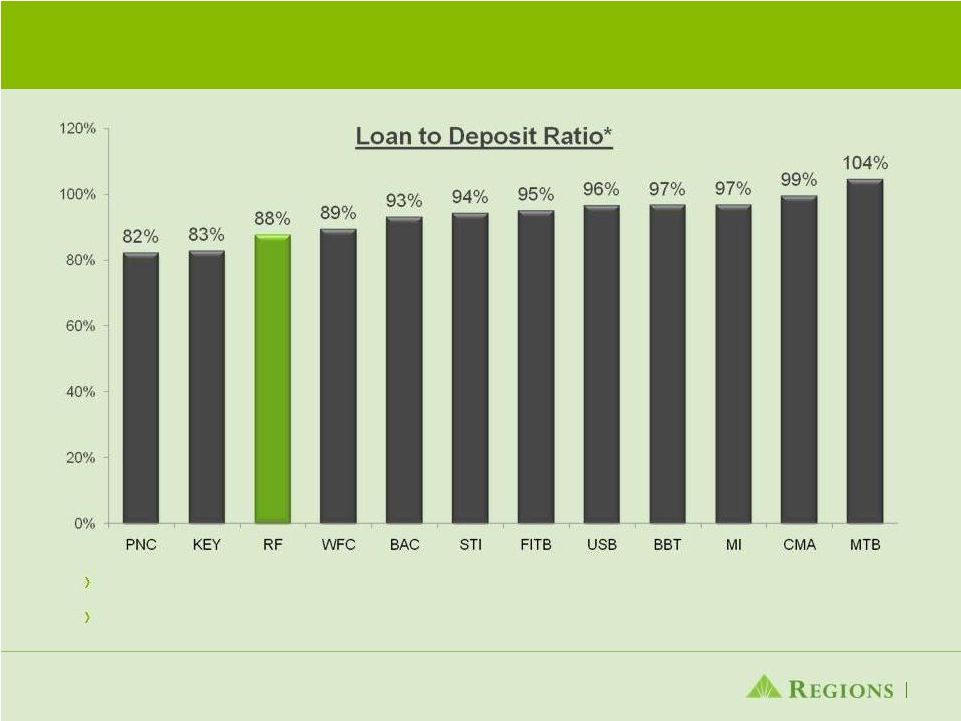 Favorable liquidity position 26 Regions low loan to deposit ratio favorable among peers Favorable funding mix driven by low cost deposits * Based on 4Q10 ending balances |
 Why Regions? • Strong Southeastern franchise with comprehensive line of business offerings • Leading brand favorability and exceptional service quality • Solid core business performance • Aggressively identifying and disposing of problem assets • Capital and liquidity remain solid 27 |
 |
 Non-GAAP reconciliation - Revenue Note: The following table illustrates the method of calculating the Non-GAAP financial measures used in this slide presentation: 29 ($ amounts in millions) 4Q09 1Q10 2Q10 3Q10 4Q10 Net Interest Income (GAAP) 850 $ 831 $ 856 $ 868 $ 877 $ Non-Interest Revenue (GAAP) 718 812 756 750 1,213 Total Revenue (GAAP) 1,568 1,643 1,612 1,618 2,090 Adjustments: Securities (gains) losses, net 96 (59) - (2) (333) Gain on sale of mortgage loans - - - - (26) Leveraged lease termination gains (71) (19) - - (59) Total adjustments 25 (78) - (2) (418) Adjusted Total Revenue (non-GAAP) 1,593 $ 1,565 $ 1,612 $ 1,616 $ 1,672 $ |
 Non-GAAP reconciliation - Expenses Note: The following table illustrates the method of calculating the Non-GAAP financial measures used in this slide presentation: 30 ($ in millions) 2007 2008 2009 2010 Total Non-Interest Expenses (GAAP) $ 4,660 $ 10,792 $ 4,751 $ 4,985 Adjustments: Goodwill impairment charge 6,000 Regulatory settlement charge 200 Merger-related charges 351 201 FDIC Special Assessment 64 Other-than-temporary impairment expense 6 22 75 2 MSR impairment 6 85 Loss on early extinguishment of debt 65 108 Branch consolidation charges 53 8 VISA settlement 51 (29) - - Adjusted Non-Interest Expenses (non-GAAP) 4,246 $ 4,448 $ 4,559 $ $ 4,667 |