EXHIBIT 99.1

Exhibit 99.1
2011 Barclays Capital Americas Select Conference
London May 23, 2011
Grayson Hall
President and Chief Executive Officer

Why Regions?
• Strong Southeastern United States footprint
• Experienced management
• Comprehensive line of product offerings
• Exceptional service quality
• Leading brand favorability
• Strong capital, reserves and liquidity
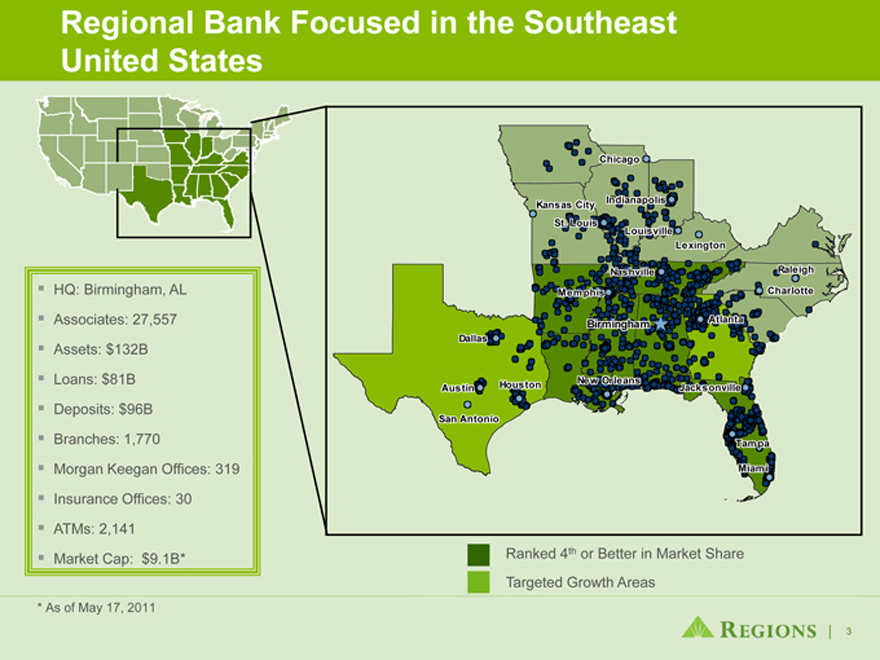
Regional Bank Focused in the Southeast United States
HQ: Birmingham, AL Associates: 27,557 Assets: $132B Loans: $81B Deposits: $96B Branches: 1,770 Morgan Keegan Offices: 319 Insurance Offices: 30 ATMs: 2,141 Market Cap: $9.1B*
Dallas
Chicago
Houston Austin
San Antonio
Indianapolis
Kansas City
St. Louis
Louisville Lexington
Nashville Memphis
Birmingham Raleigh Charlotte
Atlanta
New Orleans Jacksonville Tampa
Miami
Ranked 4th or Better in Market Share Targeted Growth Areas
* As of May 17, 2011
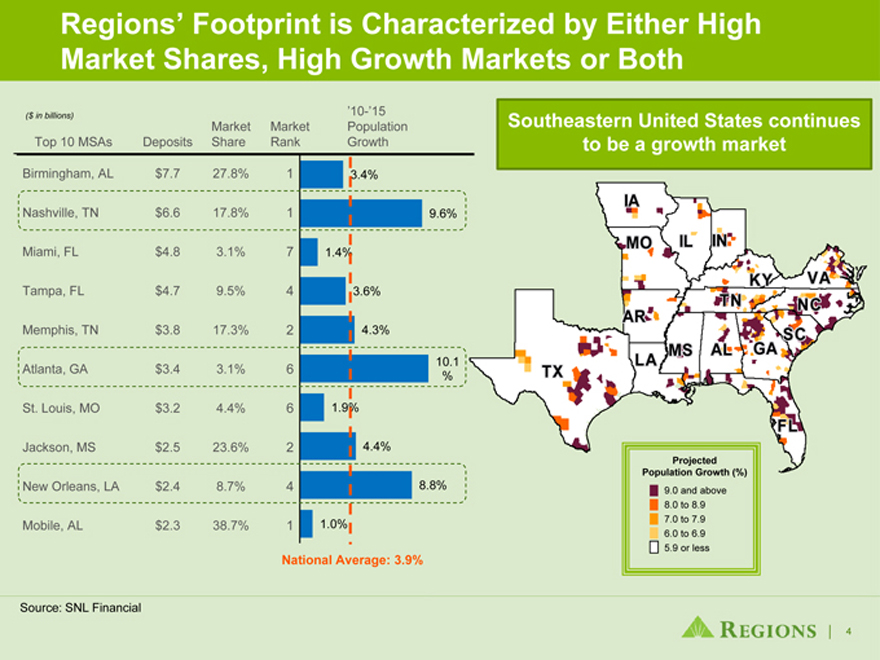
Regions’ Footprint is Characterized by Either High Market Shares, High Growth Markets or Both
($ in billions)
Market Market ‘10-’15 Population Top 10 MSAs Deposits Share Rank Growth
Birmingham, AL $7.7 27.8% 1
3.4%
Nashville, TN $6.6 17.8% 1
9.6% Miami, FL $4.8 3.1% 7 1.4% Tampa, FL $4.7 9.5% 4 3.6% Memphis, TN $3.8 17.3
% 2 4.3%
Atlanta, GA $3.4 3.1% 6 10.1 %
St. Louis, MO $3.2 4.4% 6 1.9%
Jackson, MS $2.5 23.6% 2 4.4%
New Orleans, LA $2.4 8.7% 4 8.8%
Mobile, AL $2.3 38.7% 1 1.0%
National Average: 3.9%
Southeastern United States continues to be a growth market
Projected
IA IL IN AR TN NC SC MS AL GA LA TX MO FL KY VA
Population Growth (%)
9.0 and above
8.0 to 8.9
7.0 to 7.9
6.0 to 6.9
5.9 or less
Source: SNL Financial
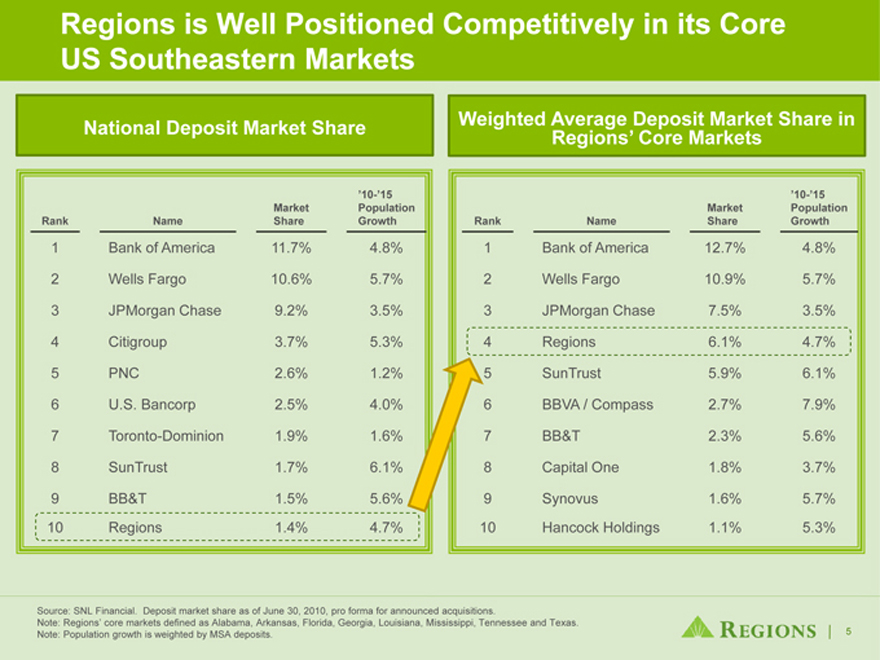
Regions is Well Positioned Competitively in its Core US Southeastern Markets
Weighted Average Deposit Market Share National Deposit Market Share in Regions’ Core Markets
10-’15 Market Population Rank Name Share Growth
1 Bank of America 11.7% 4.8%
2 Wells Fargo 10.6% 5.7%
3 JPMorgan Chase 9.2% 3.5%
4 Citigroup 3.7% 5.3%
5 PNC 2.6% 1.2%
6 U.S. Bancorp 2.5% 4.0%
7 Toronto-Dominion 1.9% 1.6%
8 SunTrust 1.7% 6.1%
9 BB&T 1.5% 5.6%
10 Regions 1.4% 4.7%
10-’15 Market Population Rank Name Share Growth
1 Bank of America 12.7% 4.8%
2 Wells Fargo 10.9% 5.7%
3 JPMorgan Chase 7.5% 3.5%
4 Regions 6.1% 4.7%
5 SunTrust 5.9% 6.1%
6 BBVA / Compass 2.7% 7.9%
7 BB&T 2.3% 5.6%
8 Capital One 1.8% 3.7%
9 Synovus 1.6% 5.7%
10 Hancock Holdings 1.1% 5.3%
Source: SNL Financial. Deposit market share as of June 30, 2010, pro forma for announced acquisitions.
Note: Regions’ core markets defined as Alabama, Arkansas, Florida, Georgia, Louisiana, Mississippi, Tennessee and Texas. Note: Population growth is weighted by MSA deposits.

Experienced Management Team
O.B. Grayson Hall, Jr.*
Chief Executive Officer
Industry Experience: 30 years Current Role: 1 year
David B. Edmonds
Chief Administrative Officer
Industry Experience: 31 years Current Role: 1 year
Fournier Gale
General Counsel
Industry Experience: 40
years Current Role: <1 year
Matthew Lusco
Chief Risk Officer
Industry Experience: 30 years Current Role: <1 year
John B. Owen
Head of Consumer Services
Industry Experience: 28 years Current Role: 2 years
David Turner, Jr.*
Chief Financial Officer
Industry Experience: 25 years Current Role: 1 year
* Indicates attendance at conference.
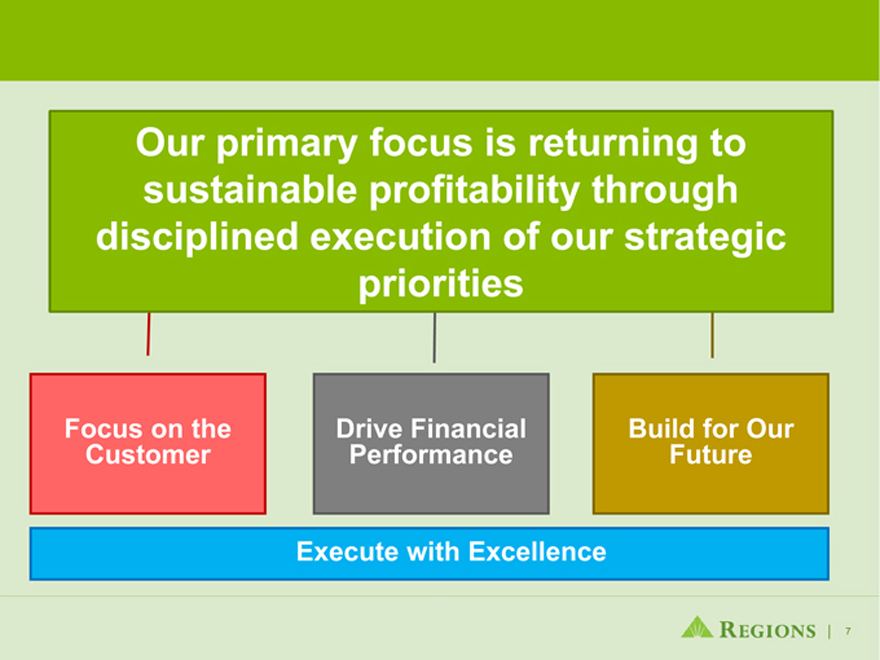
Our primary focus is returning to sustainable profitability through disciplined execution of our strategic priorities
Focus on the Customer
Drive Financial Performance
Build for Our Future
Execute with Excellence
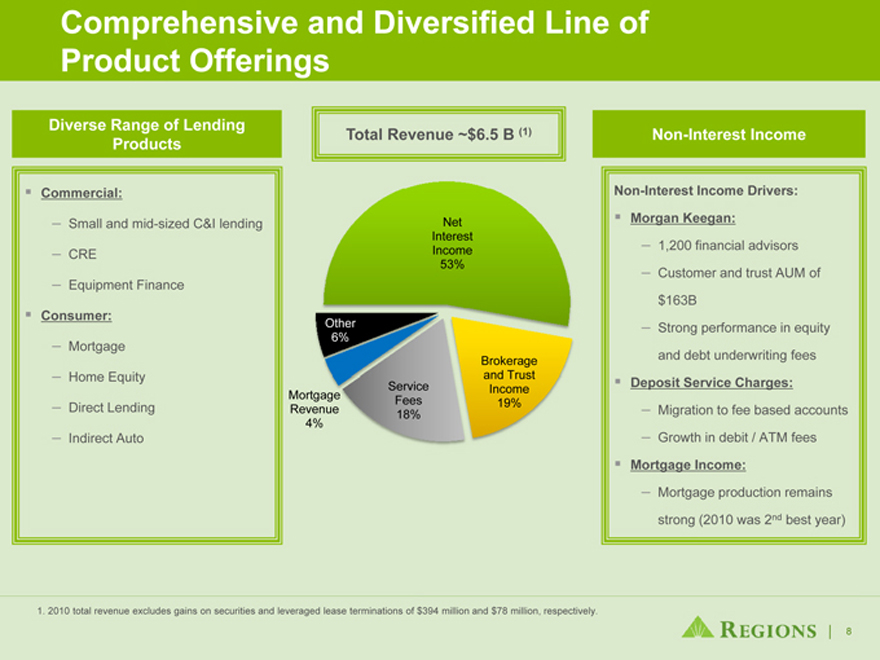
Comprehensive and Diversified Line of Product Offerings
Diverse Range of Lending Products (1)
Total Revenue ~$6.5 B Non-Interest Income
Commercial:
– Small and mid-sized C&I lending
– CRE
– Equipment Finance
Consumer:
– Mortgage
– Home Equity
– Direct Lending
– Indirect Auto
Non-Interest Income Drivers: Morgan Keegan:
– 1,200 financial advisors
– Customer and trust AUM of $163B
– Strong performance in equity and debt underwriting fees
Deposit Service Charges:
– Migration to fee based accounts
– Growth in debit / ATM fees
Mortgage Income:
– Mortgage production remains strong (2010 was 2nd best year)
1. 2010 total revenue excludes gains on securities and leveraged lease terminations of $394 million and $78 million, respectively.
Net Interest Income 53%
Other 6%
Service Mortgage Fees Revenue 18% 4%
Brokerage and Trust Income 19%
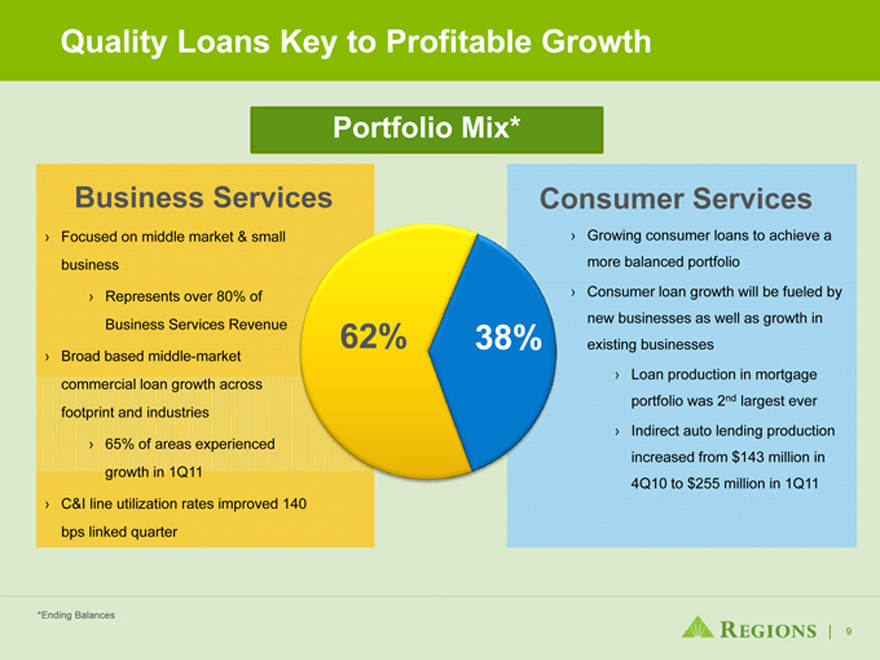
Quality Loans Key to Profitable Growth
Portfolio Mix*
Business Services
› Focused on middle market & small business
› Represents over 80% of Business Services Revenue
› Broad based middle-market commercial loan growth across footprint and industries
› 65% of areas experienced growth in 1Q11
› C&I line utilization rates improved 140 bps linked quarter
62% 38%
Consumer Services
› Growing consumer loans to achieve a more balanced portfolio
› Consumer loan growth will be fueled by new businesses as well as growth in existing businesses
› Loan production in mortgage portfolio was 2nd largest ever
› Indirect auto lending production increased from $143 million in 4Q10 to $255 million in 1Q11
*Ending Balances
9
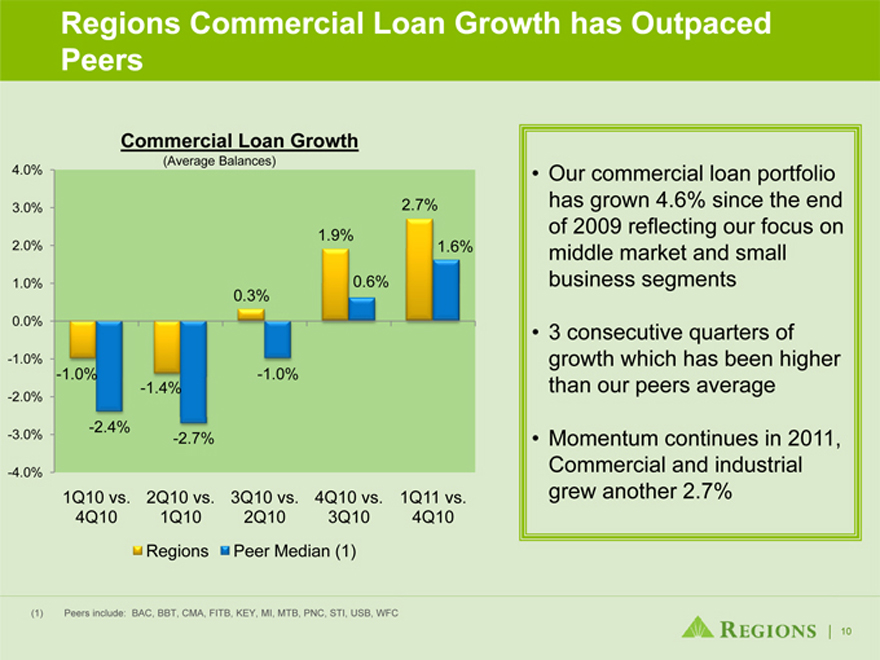
Regions Commercial Loan Growth has Outpaced Peers
Commercial Loan Growth
4.0%
3.0%
2.0%
1.0%
0.0%
-1.0%
-2.0%
-3.0%
-4.0%
-1.0%
-2.4%
-1.4%
-2.7%
-1.0%
0.3%
1.9%
0.6%
2.7%
1.6%
1Q10 vs. 2Q10 vs. 3Q10 vs. 4Q10 vs. 1Q11 vs. 4Q10 1Q10 2Q10 3Q10 4Q10 Regions Peer Median (1)
(1) Peers include: BAC, BBT, CMA, FITB, KEY, MI, MTB, PNC, STI, USB, WFC
Our commercial loan portfolio has grown 4.6% since the end of 2009 reflecting our focus on middle market and small business segments
3 consecutive quarters of growth which has been higher than our peers average
Momentum continues in 2011, Commercial and industrial grew another 2.7%
10
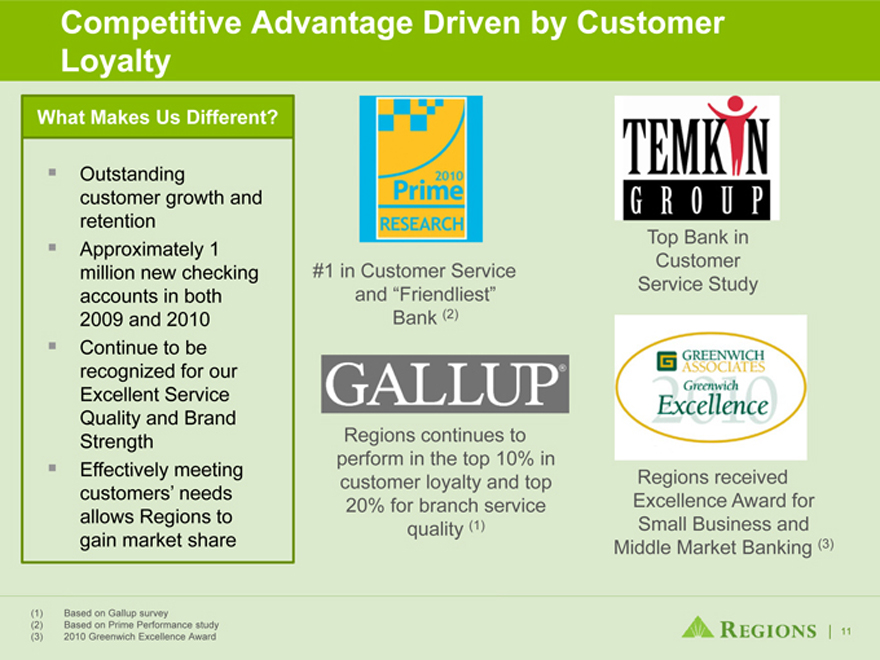
Competitive Advantage Driven by Customer Loyalty
What Makes Us Different?
Outstanding customer growth and retention Approximately 1 million new checking accounts in both 2009 and 2010 Continue to be recognized for our Excellent Service Quality and Brand Strength Effectively meeting customers’ needs allows Regions to gain market share
(1) Based on Gallup survey
(2) Based on Prime Performance study (3) 2010 Greenwich Excellence Award
#1 in Customer Service and “Friendliest” Bank (2)
Regions continues to perform in the top 10% in customer loyalty and top 20% for branch service quality (1)
Top Bank in Customer Service Study
Customer Service Study
Regions received Excellence Award for Small Business and Middle Market Banking (3)
11
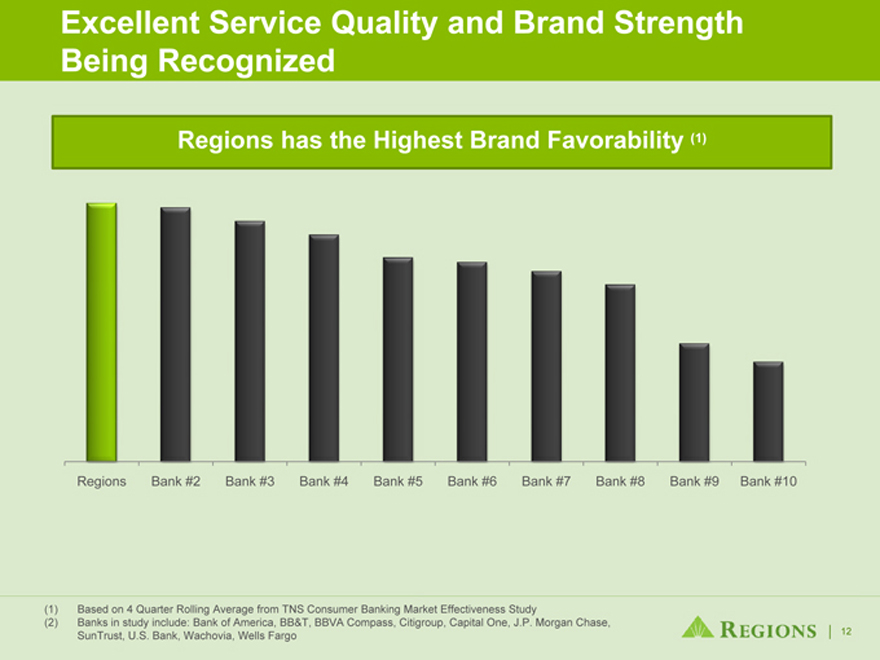
Excellent Service Quality and Brand Strength Being Recognized
Regions has the Highest Brand Favorability (1)
Regions Bank #2 Bank #3 Bank #4 Bank #5 Bank #6 Bank #7 Bank #8 Bank #9 Bank #10
(1) Based on 4 Quarter Rolling Average from TNS Consumer Banking Market Effectiveness Study
(2) Banks in study include: Bank of America, BB&T, BBVA Compass, Citigroup, Capital One, J.P. Morgan Chase, SunTrust, U.S. Bank, Wachovia, Wells Fargo
12
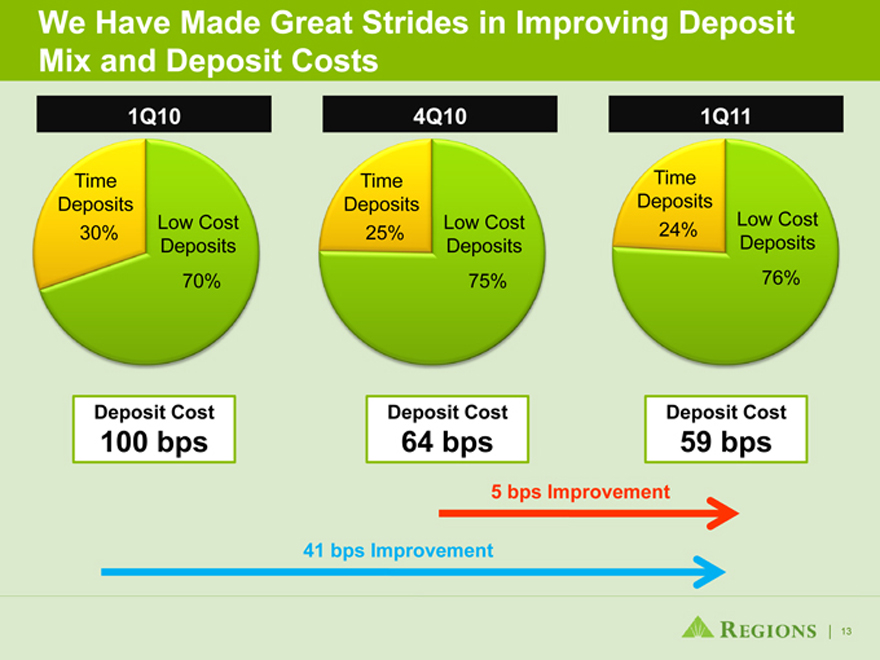
We Have Made Great Strides in Improving Deposit Mix and Deposit Costs
1Q10
4Q10
1Q11
Time
Deposits Low Cost 30% Deposits 70%
Time
Deposits Low Cost 25% Deposits 75%
Time
Deposits Low Cost 24% Deposits 76%
Deposit Cost
100 bps
Deposit Cost
64 bps
Deposit Cost
59 bps
5 bps Improvement
41 bps Improvement
13
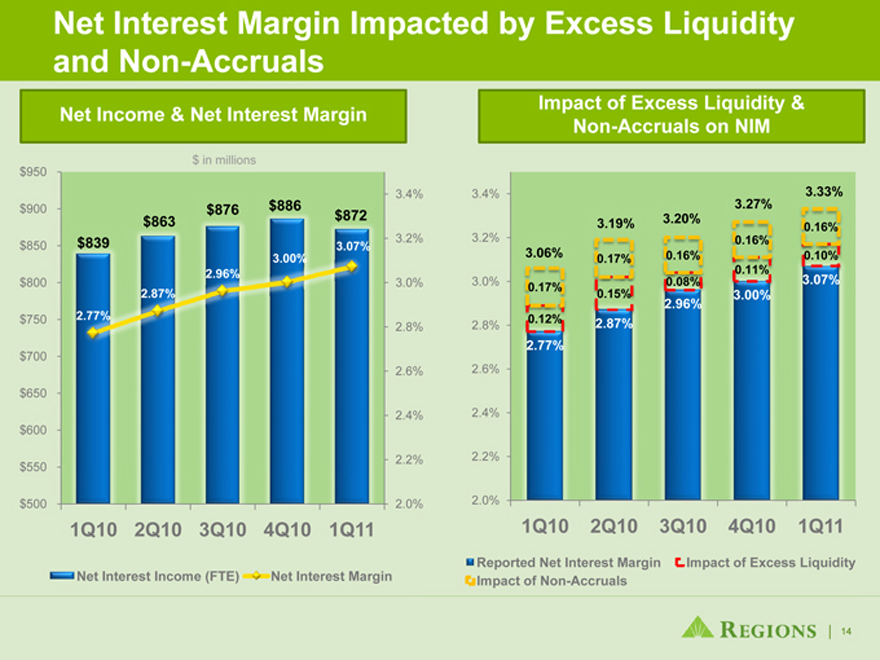
Net Interest Margin Impacted by Excess Liquidity and Non-Accruals
Net Income & Net Interest Margin
Impact of Excess Liquidity & Non-Accruals on NIM
$ in millions
$950 $900 $850 $800 $750 $700 $650 $600
$550 $500
$876 $886 $863 $872 $839 3.07%
3.00% 2.96% 2.87% 2.77%
1Q10 2Q10 3Q10 4Q10 1Q11
Net Interest Income (FTE)
Net Interest Margin
3.4%
3.2%
3.0%
2.8%
2.6%
2.4%
2.2%
2.0%
3.4%
3.2%
3.0%
2.8%
2.6%
2.4%
2.2%
2.0%
1Q10 2Q10 3Q10 4Q10 1Q11
Reported Net Interest Margin Impact of Excess Liquidity Impact of Non Accruals
3.27% 3.33% 3.19% 3.20%
0.16%
3.06% 0.16%
0.17% 0.16% 0.10%
0.11%
0.08% 3.07%
0.17%
0.15% 3.00%
2.96%
0.12% 2.87%
2.77%
14
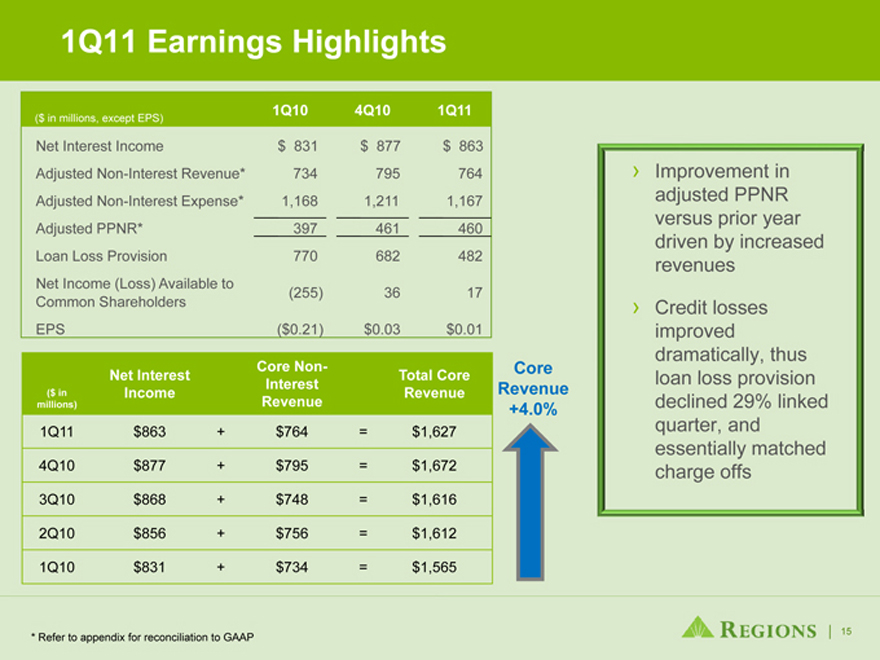
1Q11 Earnings Highlights
1Q10 4Q10 1Q11
($ in millions, except EPS)
Net Interest Income $ 831 $ 877 $ 863 Adjusted Non-Interest Revenue* 734 795 764 Adjusted Non-Interest Expense* 1,168 1,211 1,167 Adjusted PPNR* 397 461 460 Loan Loss Provision 770 682 482 Net Income (Loss) Available to (255) 36 17 Common Shareholders EPS ($0.21) $0.03 $0.01
Core Non-
Net Interest Total Core Interest ($ in Income Revenue
millions) Revenue
1Q11 $863 + $764 = $1,627 4Q10 $877 + $795 = $1,672 3Q10 $868 + $748 = $1,616 2Q10 $856 + $756 = $1,612 1Q10 $831 + $734 = $1,565
Core Revenue
+4.0%
› Improvement in adjusted PPNR versus prior year driven by increased revenues
› Credit losses improved dramatically, thus loan loss provision declined 29% linked quarter, and essentially matched charge offs
* Refer to appendix for reconciliation to GAAP
15
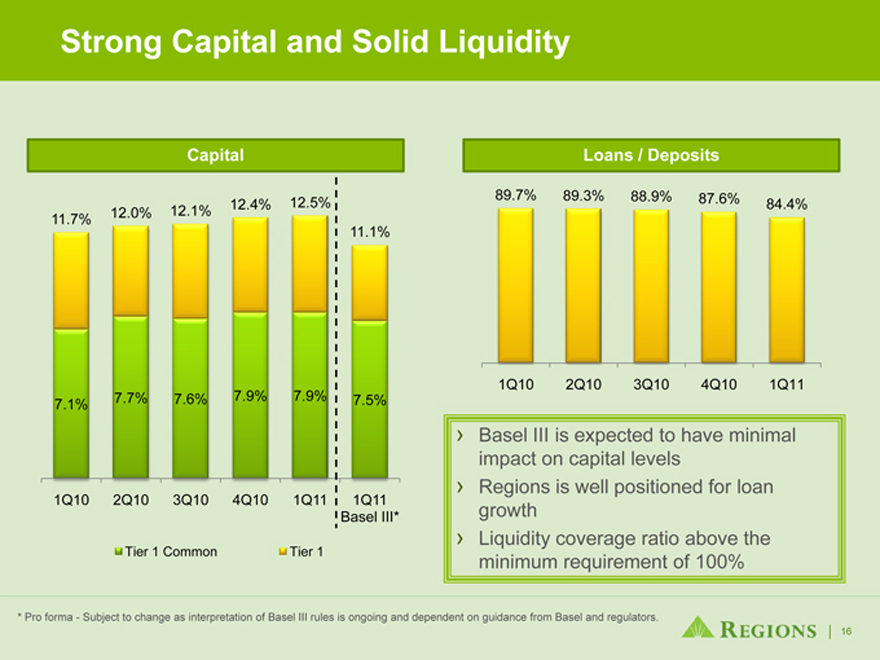
Strong Capital and Solid Liquidity
Capital
12.0% 12.1%
11.7%
11.1%
12.4%
12.5%
7.7% 7.6% 7.9% 7.9% 7.5%
7.1%
1Q10 2Q10 3Q10 4Q10 1Q11 1Q11 Basel III*
Tier 1 Common Tier 2
Loans / Deposits
89.7% 89.3% 88.9% 87.6%
84.4%
1Q10 2Q10 3Q10 4Q10 1Q11
Basel III is expected to have minimal impact on capital levels Regions is well positioned for loan growth Liquidity coverage ratio above the minimum requirement of 100%
* Pro forma - Subject to change as interpretation of Basel III rules is ongoing and dependent on guidance from Basel and regulators.
16
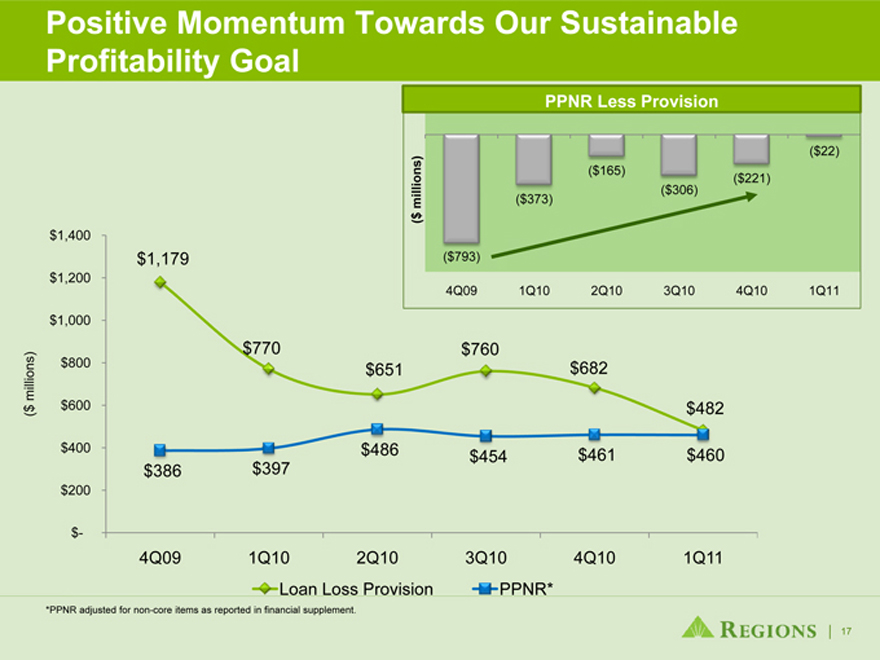
Positive Momentum Towards Our Sustainable Profitability Goal
PPNR Less Provision
($ millions)
($793)
($373)
($165)
($306)
($221)
($22)
4Q09 1Q10 2Q10 3Q10 4Q10 1Q11 ($ millions)
$1,400 $1,200 $1,000 $800 $600 $400 $200 $-
$1,179
$770
$651
$760
$682
$482
$386
$397
$486
$454
$461
$460
4Q09 1Q10 2Q10 3Q10 4Q10 1Q11
Loan Loss Provision
*PPNR adjusted for non-core items as reported in financial supplement.
17
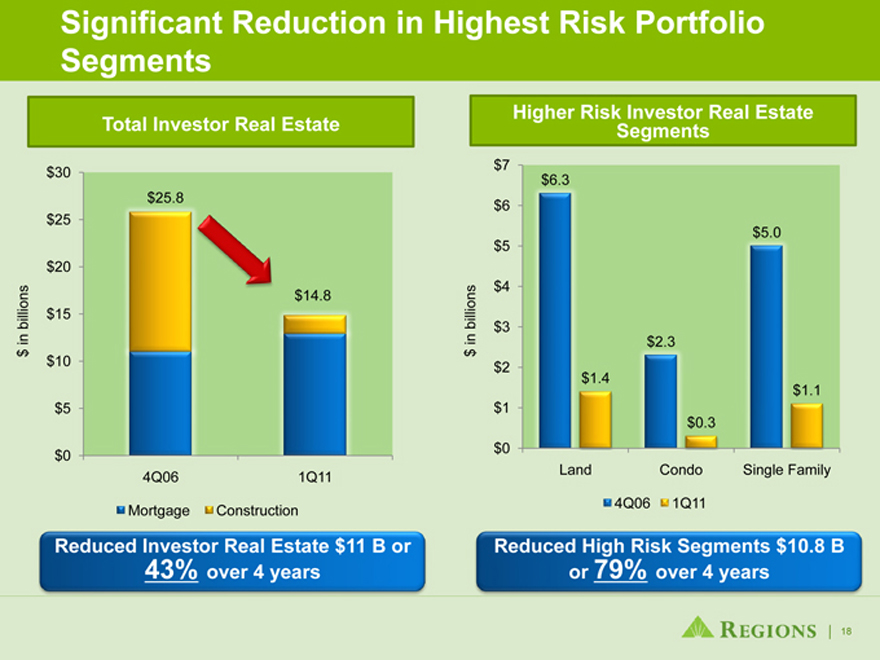
Significant Reduction in Highest Risk Portfolio Segments
Total Investor Real Estate
$30 $25 $20 $15 $10 $5 $0
$ in billions
$25.8
$14.8
4Q06
1Q11
Mortgage Construction
Reduced Investor Real Estate $11 B or 43% over 4 years
Higher Risk Investor Real Estate Segments
$ in billions
$7 $6 $5 $4 $3 $2 $1 $0
$6.3
$1.4
$2.3
$0.3
$5.0
$1.1
Land Condo Single Family
4Q06 1Q11
Reduced High Risk Segments $10.8 B or 79% over 4 years
18
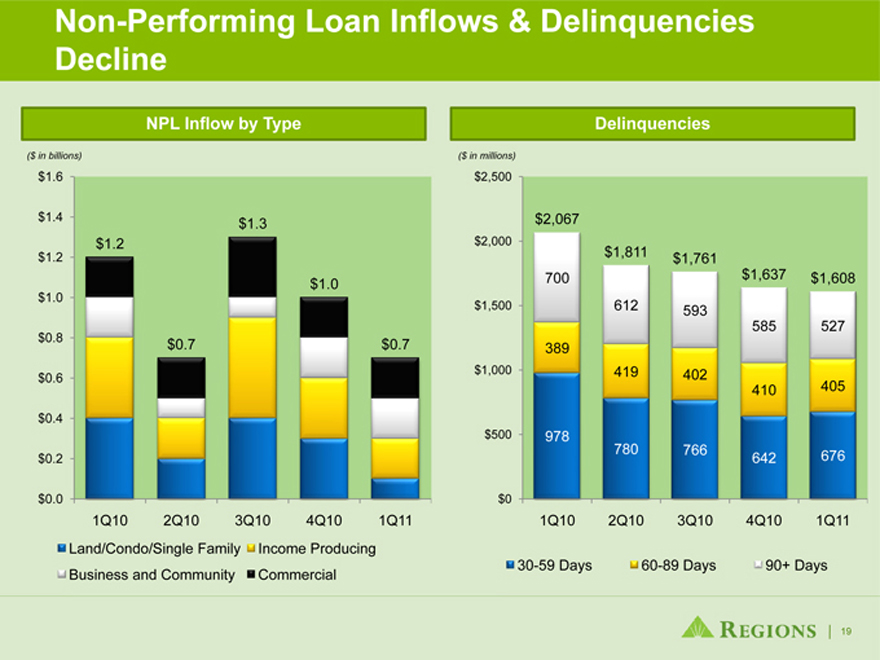
Non-Performing Loan Inflows & Delinquencies Decline
NPL Inflow by Type
($ in billions)
$1.6 $1.4 $1.2 $1.0 $0.8 $0.6 $0.4 $0.2 $0.0
$1.2
$0.7
$1.3
$1.0
$0.7
1Q10 2Q10 3Q10 4Q10 1Q11
Land/Condo/Single Family Income Producing Business and Community Commercial
Delinquencies
($ in millions)
$2,500 $2,000 $1,500 $1,000 $500 $0
$2,067
700
389
978
1Q10
$1,811
612
419
780
2Q10
$1,761
593
402 766 3Q10
$1,637
585
410 642 4Q10
$1,608 527 405
676
1Q11
30-59 Days 60-89 Days 90+ Days
19
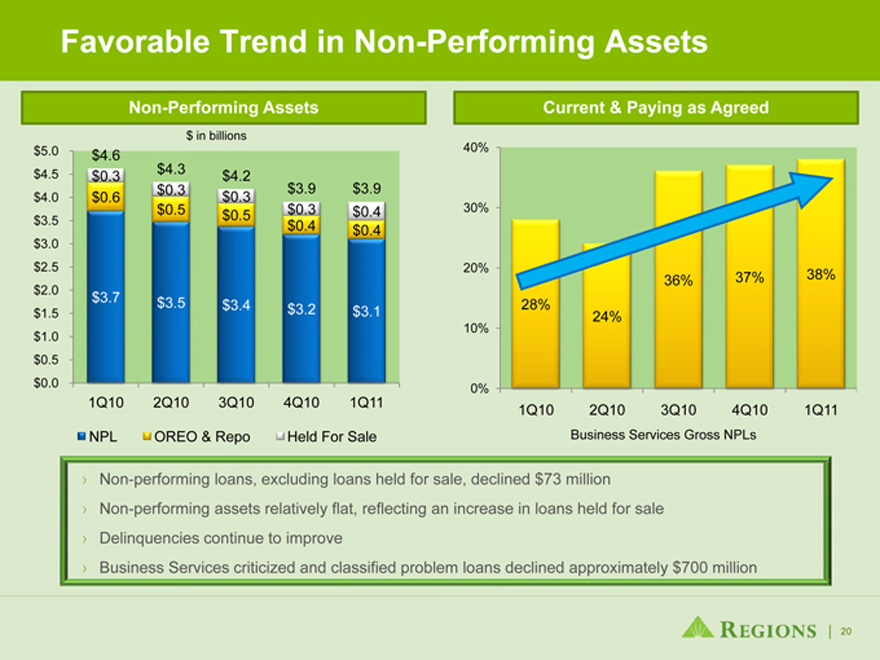
Favorable Trend in Non-Performing Assets
Non-Performing Assets
$ in billions
$5.0 $4.6 $4.5 $4.0 $3.5 $3.0 $2.5 $2.0 $1.5 $1.0 $0.5 $0.0
$0.3 $0.6
$3.7
1Q10
$4.3 $0.3 $0.5
$3.5
2Q10
$4.2 $0.3 $0.5
$3.4
3Q10
$3.9 $0.3 $0.4
$3.2
4Q10
$3.9 $0.4 $0.4
$3.1
1Q11
NPL OREO & Repo Held For Sale
Current & Paying as Agreed
40% 30% 20% 10% 0%
28%
1Q10
24%
2Q10
36%
3Q10
37%
4Q10
38%
1Q11
Business Services Gross NPLs
› Non-performing loans, excluding loans held for sale, declined $73 million
› Non-performing assets relatively flat, reflecting an increase in loans held for sale
› Delinquencies continue to improve
› Business Services criticized and classified problem loans declined approximately $700 million
20
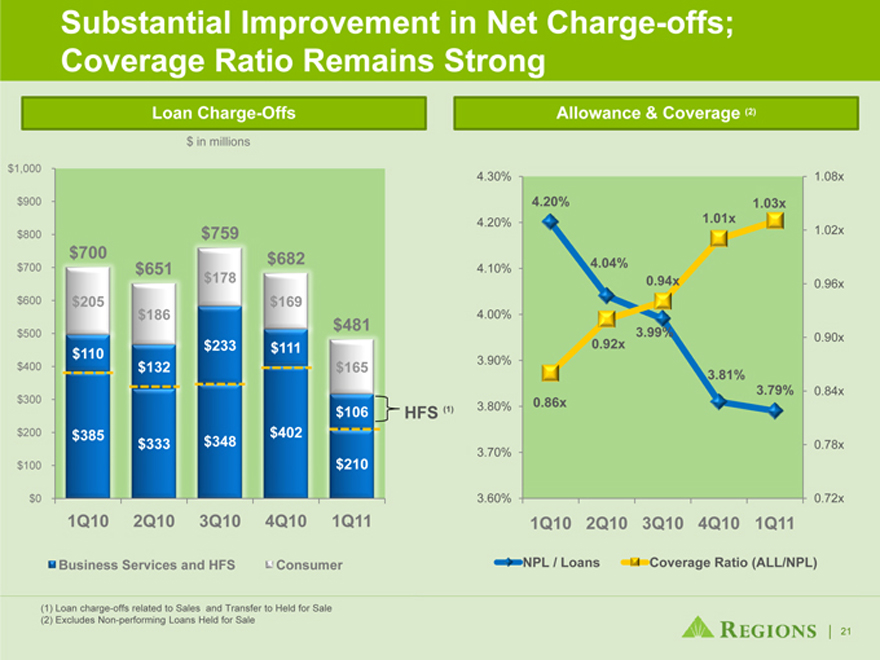
Substantial Improvement in Net Charge-offs; Coverage Ratio Remains Strong
Loan Charge-Offs
$ in millions
$1,000 $900 $800 $700 $600 $500 $400 $300 $200 $100 $0
$700 $205 $110
$385
1Q10
$651 $186 $132
$333
2Q10
$759
$178
$233 $348 3Q10
$682 $169 $111
$402
4Q10
$481 $165 $106 $210 1Q11
Business Services and HFS Consumer
HFS (1)
Allowance & Coverage (2)
4.30% 4.20% 4.10% 4.00% 3.90% 3.80% 3.70% 3.60%
4.20%
4.04% 0.94x
1.01x 1.03x
0.92x 3.99%
3.81%3.79%
0.86x
1.08x 1.02x 0.96x 0.90x 0.84x 0.78x 0.72x
1Q10 2Q10 3Q10 4Q10 1Q11
NPL / Loans Coverage Ratio (ALL/NPL)
(1) Loan charge-offs related to Sales and Transfer to Held for Sale (2) Excludes Non-performing Loans Held for Sale
21
Why Regions?
• Strong Southeastern United States footprint
• Experienced management
• Comprehensive line of product offerings
• Exceptional service quality
• Leading brand favorability
• Strong capital, reserves and liquidity
22

Appendix
23
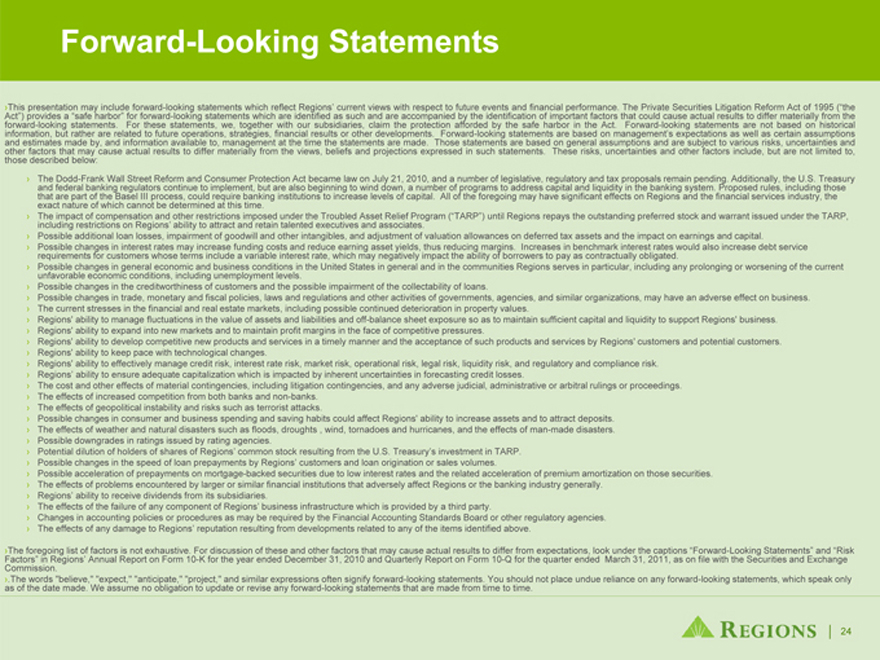
Forward-Looking Statements
This presentation may include forward-looking statements which reflect Regions’ current views with respect to future events and financial performance. The Private Securities Litigation Reform Act of 1995 (“the Act”) provides a “safe harbor” for forward-looking statements which are identified as such and are accompanied by the identification of important factors that could cause actual results to differ materially from the forward-looking statements. For these statements, we, together with our subsidiaries, claim the protection afforded by the safe harbor in the Act. Forward-looking statements are not based on historical information, but rather are related to future operations, strategies, financial results or other developments. Forward-looking statements are based on management’s expectations as well as certain assumptions and estimates made by, and information available to, management at the time the statements are made. Those statements are based on general assumptions and are subject to various risks, uncertainties and other factors that may cause actual results to differ materially from the views, beliefs and projections expressed in such statements. These risks, uncertainties and other factors include, but are not limited to, those described below:
The Dodd-Frank Wall Street Reform and Consumer Protection Act became law on July 21, 2010, and a number of legislative, regulatory and tax proposals remain pending. Additionally, the U.S. Treasury and federal banking regulators continue to implement, but are also beginning to wind down, a number of programs to address capital and liquidity in the banking system. Proposed rules, including those that are part of the Basel III process, could require banking institutions to increase levels of capital. All of the foregoing may have significant effects on Regions and the financial services industry, the exact nature of which cannot be determined at this time.
The impact of compensation and other restrictions imposed under the Troubled Asset Relief Program (“TARP”) until Regions repays the outstanding preferred stock and warrant issued under the TARP, including restrictions on Regions’ ability to attract and retain talented executives and associates.
Possible additional loan losses, impairment of goodwill and other intangibles, and adjustment of valuation allowances on deferred tax assets and the impact on earnings and capital.
Possible changes in interest rates may increase funding costs and reduce earning asset yields, thus reducing margins. Increases in benchmark interest rates would also increase debt service requirements for customers whose terms include a variable interest rate, which may negatively impact the ability of borrowers to pay as contractually obligated.
Possible changes in general economic and business conditions in the United States in general and in the communities Regions serves in particular, including any prolonging or worsening of the current unfavorable economic conditions, including unemployment levels.
Possible changes in the creditworthiness of customers and the possible impairment of the collectability of loans.
Possible changes in trade, monetary and fiscal policies, laws and regulations and other activities of governments, agencies, and similar organizations, may have an adverse effect on business.
The current stresses in the financial and real estate markets, including possible continued deterioration in property values.
Regions’ ability to manage fluctuations in the value of assets and liabilities and off-balance sheet exposure so as to maintain sufficient capital and liquidity to support Regions’ business.
Regions’ ability to expand into new markets and to maintain profit margins in the face of competitive pressures.
Regions’ ability to develop competitive new products and services in a timely manner and the acceptance of such products and services by Regions’ customers and potential customers.
Regions’ ability to keep pace with technological changes.
Regions’ ability to effectively manage credit risk, interest rate risk, market risk, operational risk, legal risk, liquidity risk, and regulatory and compliance risk.
Regions’ ability to ensure adequate capitalization which is impacted by inherent uncertainties in forecasting credit losses.
The cost and other effects of material contingencies, including litigation contingencies, and any adverse judicial, administrative or arbitral rulings or proceedings.
The effects of increased competition from both banks and non-banks.
The effects of geopolitical instability and risks such as terrorist attacks.
Possible changes in consumer and business spending and saving habits could affect Regions’ ability to increase assets and to attract deposits.
The effects of weather and natural disasters such as floods, droughts , wind, tornadoes and hurricanes, and the effects of man-made disasters.
Possible downgrades in ratings issued by rating agencies.
Potential dilution of holders of shares of Regions’ common stock resulting from the U.S. Treasury’s investment in TARP.
Possible changes in the speed of loan prepayments by Regions’ customers and loan origination or sales volumes.
Possible acceleration of prepayments on mortgage-backed securities due to low interest rates and the related acceleration of premium amortization on those securities.
The effects of problems encountered by larger or similar financial institutions that adversely affect Regions or the banking industry generally.
Regions’ ability to receive dividends from its subsidiaries.
The effects of the failure of any component of Regions’ business infrastructure which is provided by a third party.
Changes in accounting policies or procedures as may be required by the Financial Accounting Standards Board or other regulatory agencies.
The effects of any damage to Regions’ reputation resulting from developments related to any of the items identified above.
The foregoing list of factors is not exhaustive. For discussion of these and other factors that may cause actual results to differ from expectations, look under the captions “Forward-Looking Statements” and “Risk Factors” in Regions’ Annual Report on Form 10-K for the year ended December 31, 2010 and Quarterly Report on Form 10-Q for the quarter ended March 31, 2011, as on file with the Securities and Exchange Commission.
.The words “believe,” “expect,” “anticipate,” “project,” and similar expressions often signify forward-looking statements. You should not place undue reliance on any forward-looking statements, which speak only as of the date made. We assume no obligation to update or revise any forward-looking statements that are made from time to time.
24
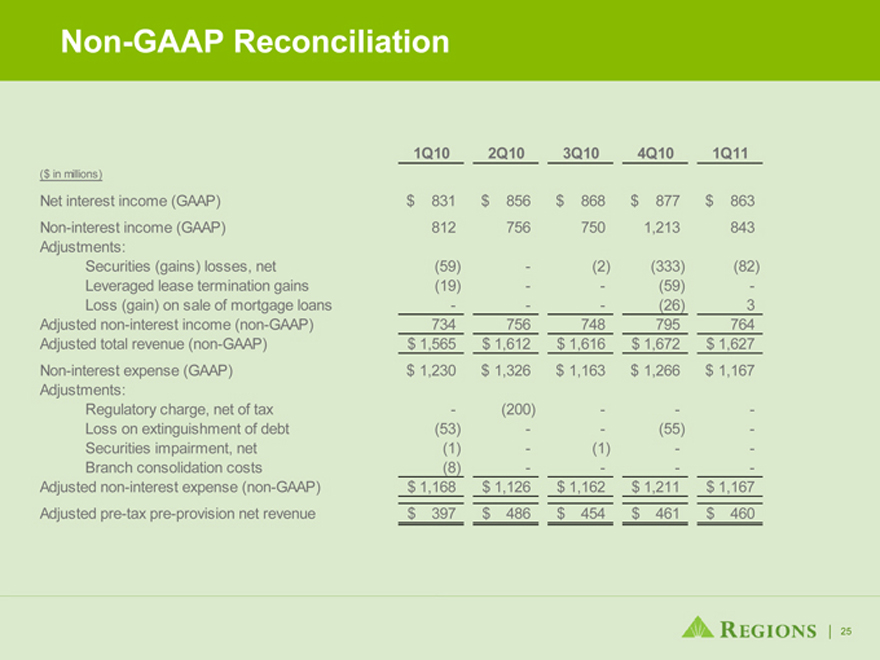
Non-GAAP Reconciliation
1Q10 2Q10 3Q10 4Q10 1Q11
($ in millions)
Net interest income (GAAP) $ 831 $ 856 $ 868 $ 877 $ 863
Non-interest income (GAAP) 812 756 750 1,213 843
Adjustments:
Securities (gains) losses, net(59) -(2)(333)(82)
Leveraged lease termination gains(19)--(59) -
Loss (gain) on sale of mortgage loans--(26) 3
Adjusted non-interest income (non-GAAP) 734 756 748 795 764
Adjusted total revenue (non-GAAP) $ 1,565 $ 1,612 $ 1,616 $ 1,672 $ 1,627
Non-interest expense (GAAP) $ 1,230 $ 1,326 $ 1,163 $ 1,266 $ 1,167
Adjustments:
Regulatory charge, net of tax -(200)--
Loss on extinguishment of debt(53)--(55) -
Securities impairment, net(1) -(1)--
Branch consolidation costs(8)-- -
Adjusted non-interest expense (non-GAAP) $ 1,168 $ 1,126 $ 1,162 $ 1,211 $ 1,167
Adjusted pre-tax pre-provision net revenue $ 397 $ 486 $ 454 $ 461 $ 460
25
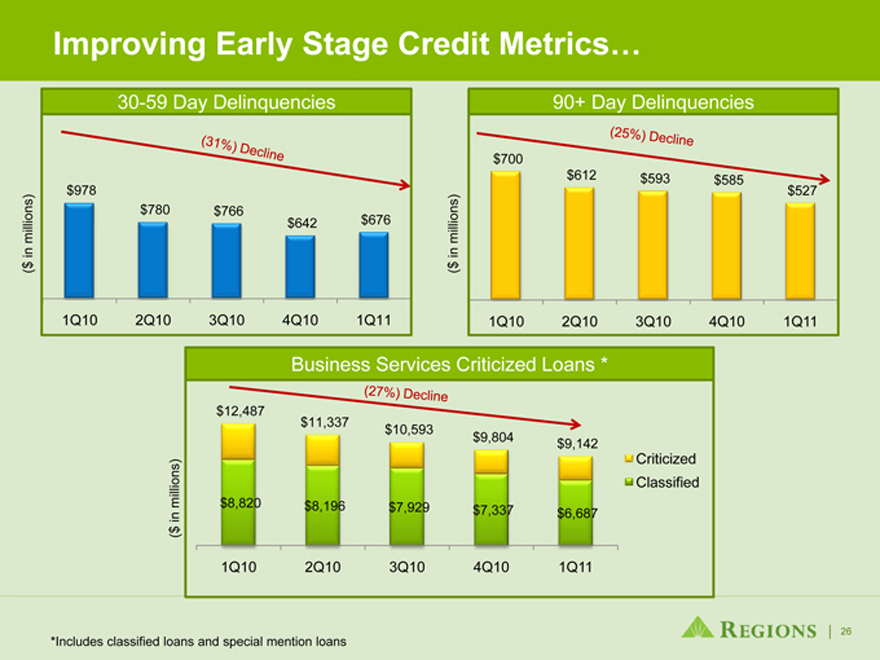
Improving Early Stage Credit Metrics…
30-59 Day Delinquencies
($ in millions)
(31%) Decline
$978 $780 $766 $642 $676
1Q10 2Q10 3Q10 4Q10 1Q11
90+ Day Delinquencies
(25%) Decline
($ in millions)
$700 $612 $593 $585 $527
1Q10 2Q10 3Q10 4Q10 1Q11
Business Services Criticized Loans *
(27%) Decline
($ in millions)
$12,487 $11,337 $10,593 $9,804 $9,142
$8,820 $8,196 $7,929 $7,337 $6,687
1Q10 2Q10 3Q10 4Q10 1Q11
Criticized Classified
*Includes classified loans and special mention loans
26
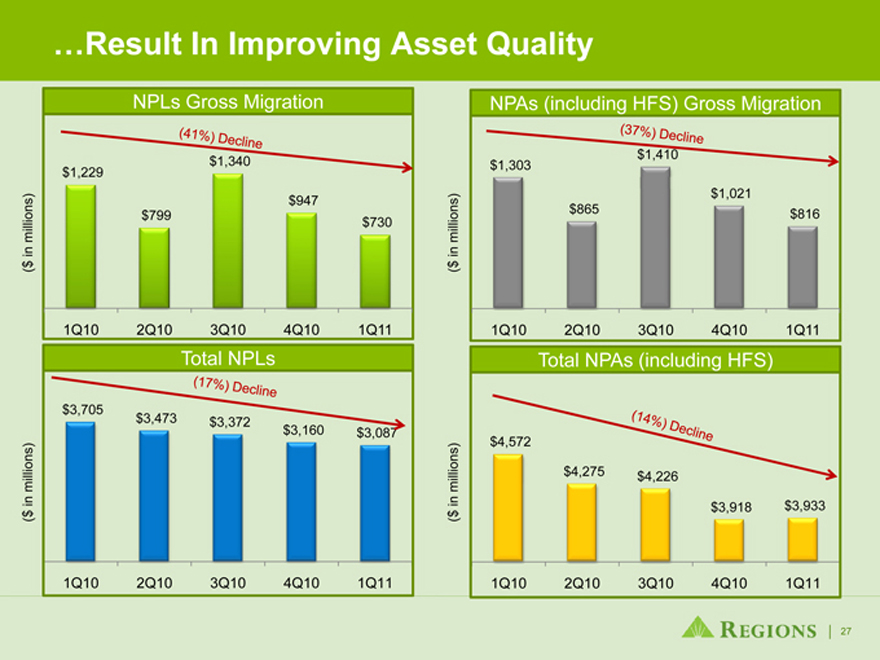
…Result In Improving Asset Quality
NPLs Gross Migration
($ in millions)
(41%) Decline
$1,229 $799, $1,340 $947 $730
1Q10 2Q10 3Q10 4Q10 1Q11
NPAs (including HFS) Gross Migration
(37 %) Decline
($ in millions)
$1,303 $865 $1,410 $1,021 $816
1Q10 2Q10 3Q10 4Q10 1Q11
Total NPLs
(17%) Decline
($ in millions)
$3,705 $3,473 $3,372 $3,160 $3,087
1Q10 2Q10 3Q10 4Q10 1Q11
Total NPAs (including HFS)
(14%) Decline
($ in millions)
$4,572 $4,275 $4,226 $3,918 $3,933
1Q10 2Q10 3Q10 4Q10 1Q11
27
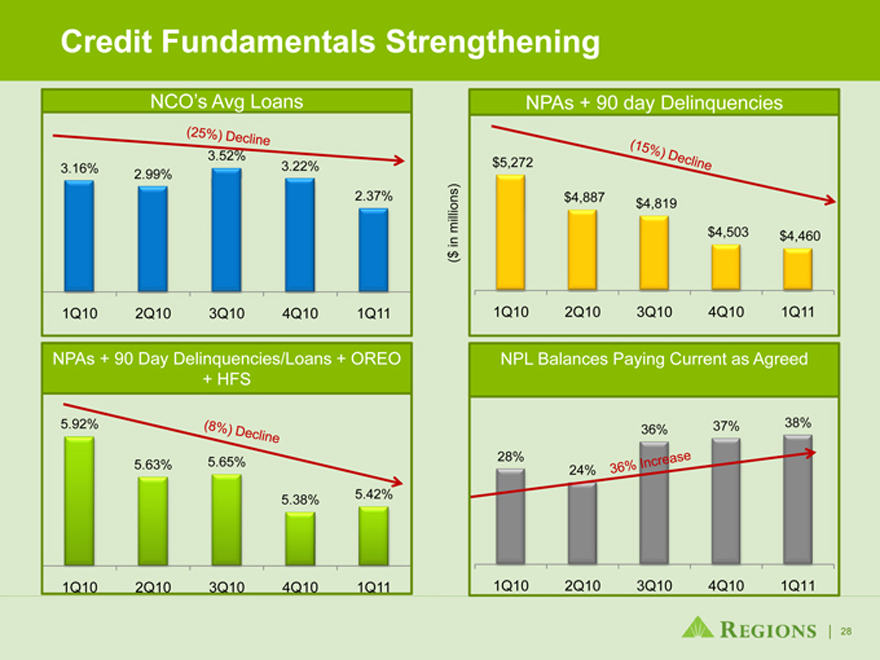
Credit Fundamentals Strengthening
NCO’s Avg Loans
(25%) Decline
3.16% 2.99% 3.52% 3.22% 2.37%
1Q10 2Q10 3Q10 4Q10 1Q11
NPAs + 90 Day Delinquencies/Loans + OREO + HFS
(8%) Decline
5.92% 5.63% 5.65% 5.38% 5.42%
1Q10 2Q10 3Q10 4Q10 1Q11
NPAs + 90 day Delinquencies
($ in millions)
$5,272 $4,887 $4,819 $4,503 $4,460
1Q10 2Q10 3Q10 4Q10 1Q11
NPL Balances Paying Current as Agreed
(36 %) Increase
28% 24% 36% 37% 38%
1Q10 2Q10 3Q10 4Q10 1Q11
28
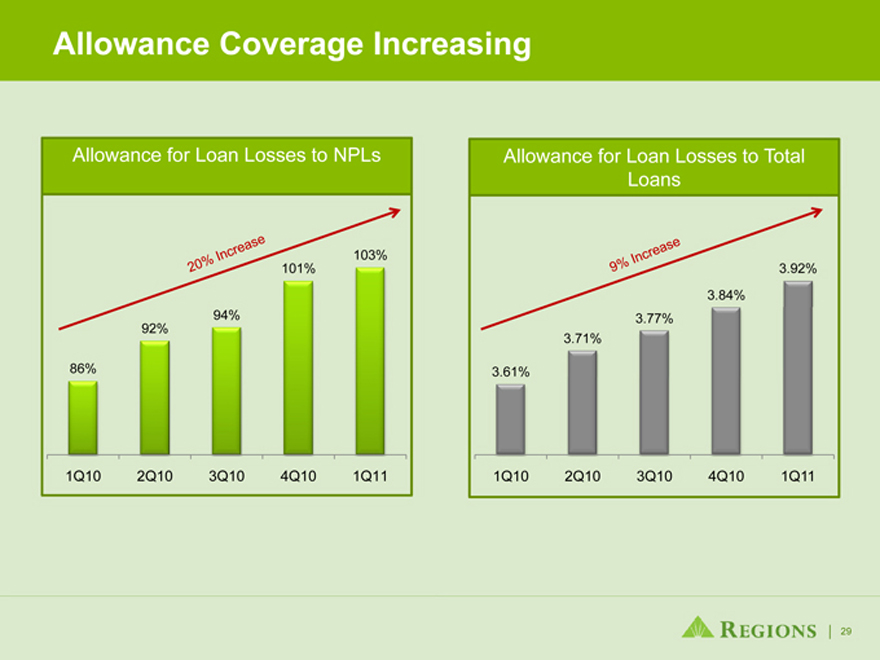
Allowance Coverage Increasing
Allowance for Loan Losses to NPLs
20% Increase
86% 92% 94% 101% 103%
1Q10 2Q10 3Q10 4Q10 1Q11
Allowance for Loan Losses to Total Loans
9% Increase
3.61% 3.71% 3.77% 3.84% 3.92%
1Q10 2Q10 3Q10 4Q10 1Q11
29
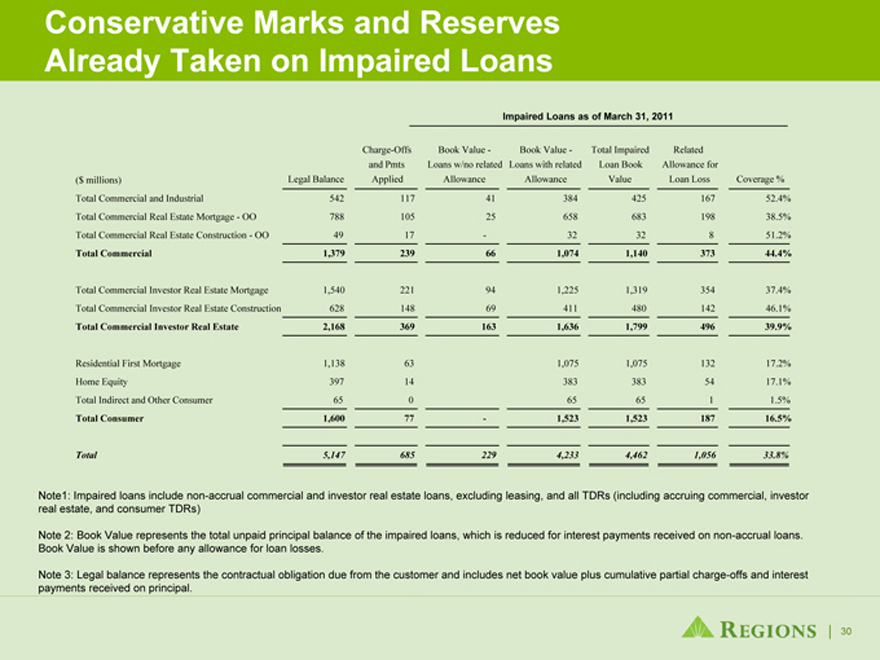
Conservative Marks and Reserves Already Taken on Impaired Loans
Impaired Loans as of March 31, 2011
Charge-Offs Book Value - Book Value - Total Impaired Related and Pmts Loans w/no related Loans with related Loan Book Allowance for
Legal Balance Applied Allowance Allowance Value Loan Loss Coverage %
($ millions)
Total Commercial and Industrial 542 117 41 384 425 167 52.4%
Total Commercial Real Estate Mortgage - OO 788 105 25 658 683 198 38.5%
Total Commercial Real Estate Construction - OO 49 17 - 32 32 8 51.2%
Total Commercial 1,379 239 66 1,074 1,140 373 44.4%
Total Commercial Investor Real Estate Mortgage 1,540 221 94 1,225 1,319 354 37.4%
Total Commercial Investor Real Estate Construction 628 148 69 411 480 142 46.1%
Total Commercial Investor Real Estate 2,168 369 163 1,636 1,799 496 39.9%
Residential First Mortgage 1,138 63 1,075 1,075 132 17.2%
Home Equity 397 14 383 383 54 17.1%
Total Indirect and Other Consumer 65 0 65 65 1 1.5%
Total Consumer 1,600 77 - 1,523 1,523 187 16.5%
Total 5,147 685 229 4,233 4,462 1,056 33.8%
Note1: Impaired loans include non-accrual commercial and investor real estate loans, excluding leasing, and all TDRs (including accruing commercial, investor real estate, and consumer TDRs)
Note 2: Book Value represents the total unpaid principal balance of the impaired loans, which is reduced for interest payments received on non-accrual loans. Book Value is shown before any allowance for loan losses.
Note 3: Legal balance represents the contractual obligation due from the customer and includes net book value plus cumulative partial charge-offs and interest payments received on principal.
30
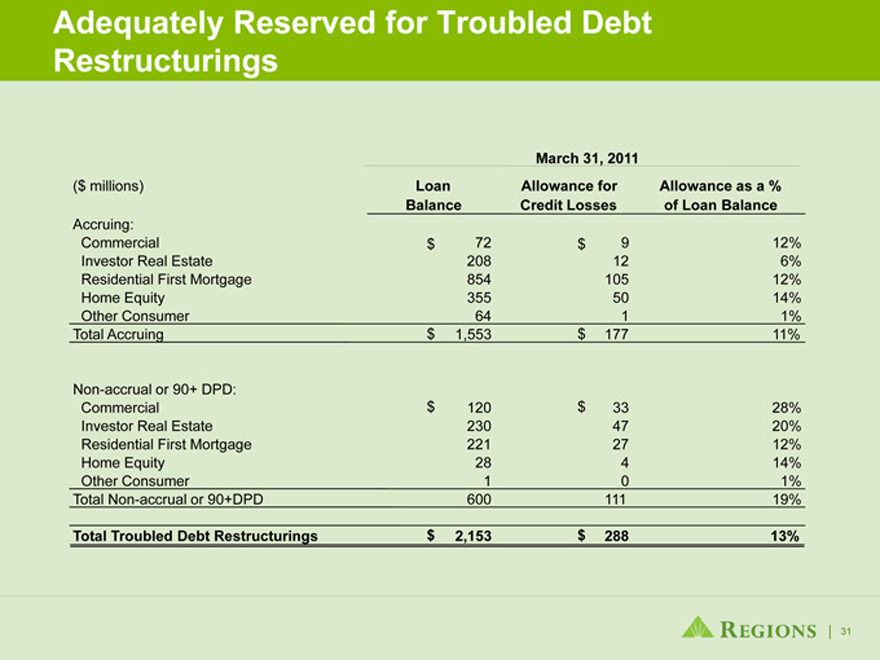
Adequately Reserved for Troubled Debt Restructurings
March 31, 2011
($ millions) Loan Allowance for Allowance as a %
Balance Credit Losses of Loan Balance
Accruing:
Commercial $ 72 $ 9 12%
Investor Real Estate 208 12 6%
Residential First Mortgage 854 105 12%
Home Equity 355 50 14%
Other Consumer 64 1 1%
Total Accruing $ 1,553 $ 177 11%
Non-accrual or 90+ DPD:
Commercial $ 120 $ 33 28%
Investor Real Estate 230 47 20%
Residential First Mortgage 221 27 12%
Home Equity 28 4 14%
Other Consumer 1 0 1%
Total Non-accrual or 90+DPD 600 111 19%
Total Troubled Debt Restructurings $ 2,153 $ 288 13%
31