 Regions Financial 3 rd Quarter Earnings Conference Call October 25, 2011 Exhibit 99.3 |
 Demonstrated Positive Earnings Growth › Adjusted pre-tax pre-provision income (“PPI”) exceeded the loan loss provision for the second consecutive quarter which is critical to achieving sustainable profitability › Fundamentally improving business model, generating profitable revenue streams › Focus on expense control resulted in 5% decline in adjusted non-interest expenses › Net Charge-offs down 7% and Business Services Criticized Loans down another 8% versus prior quarter › Investor Real Estate down $4 billion or 25% year-to-date ($ in millions) 3Q10 2Q11 3Q11 Net Income (Loss) ($209) $55 $101 Adjusted Pre-tax Pre-provision Income* $454 $500 $540 EPS ($0.17) $0.04 $0.08 Loan Loss Provision $760 $398 $355 Earnings Highlights * See appendix for non-GAAP reconciliation 1 |
 Maintaining Focus on Fundamentals 2 Loan Production Business Performance Improvement › Solid loan production of $14.7 billion; Business Services loan production of $12.5 billion and Consumer Services loan production of $2.2 billion › Business Services loan production reflected higher commercial loan growth › Consumer loan production continues to be impacted by customer deleveraging › Mortgage originations positively impacted by third quarter’s decline in interest rates › Deposit costs declined another 7 basis points linked quarter › Continue to show strength in gathering low-cost deposits, resulting in a 2% linked quarter increase in average low-cost deposits › Credit card income benefitting from prior quarter credit card portfolio purchase › Changes to our checking account fee structure and other new revenue and expense initiatives expected to make up the revenue shortfall from Durbin over time › Fundamentally changing our cost culture, continuously seeking opportunities to improve and control our expense base › Capital continues to build; tier 1 common ratio increased from 7.9% in 2Q11 to 8.2% in 3Q11; TCE increased 30 bps to 6.48% |
 3Q11 Earnings Highlights 3 › Results demonstrated slightly lower adjusted revenue, lower expenses and improved loan loss provision › Adjusted non-interest revenue* linked quarter decline driven by lower capital markets revenue partially offset by higher mortgage income and stable service charges › Adjusted non-interest expenses* decreased 5% due to a decline in FDIC premiums and salaries and benefits * See appendix for non-GAAP reconciliation ($ in millions, except EPS) 3Q10 2Q11 3Q11 Net Interest Income $ 868 $ 864 $ 858 $ (6) -1% $ (10) -1% Adjusted Non-Interest Revenue* 748 757 748 (9) -1% - 0% Adjusted Non-Interest Expense* 1,162 1,121 1,066 (55) -5% (96) -8% Adjusted PPI* 454 500 540 40 8% 86 19% Net Charge-Offs 759 548 511 (37) -7% (248) -33% Loan Loss Reserve Build / (Reduction) 1 (150) (156) (6) NM (157) NM Loan Loss Provision 760 398 355 (43) -11% (405) -53% Net Income (Loss) Available to Common Shareholders $ (209) $ 55 $ 101 $ 46 84% $ 310 148% EPS ($0.17) $0.04 $0.08 $0.04 100% $0.25 147% Adjusted EPS* ($0.17) $0.04 $0.08 $0.04 100% $0.25 147% 3Q11 vs. 2Q11 3Q11 vs. 3Q10 |
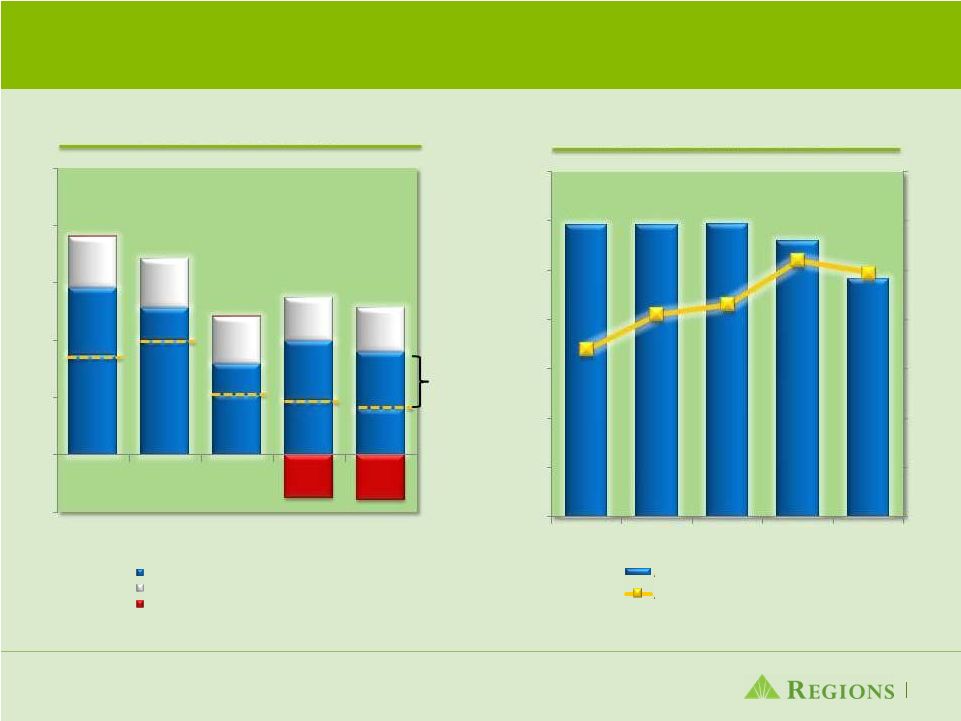
 Although NPL Inflows Increased, NPLs Current and Paying as Agreed Increased 3 bps 4 NPL Inflows by Type Business Services Gross NPLs Current and Paying as Agreed Note: 63% of 3Q11 NPL Additions remaining at 9/30/11 are current and paying as agreed Land/Condo/Single Family Income Producing Business and Community Commercial $1,340 $948 $730 $555 $755 $0 $200 $400 $600 $800 $1,000 $1,200 $1,400 $1,600 3Q10 4Q10 1Q11 2Q11 3Q11 $ in millions 36% 37% 38% 42% 45% 3Q10 4Q10 1Q11 2Q11 3Q11 Ending Balances |
 Non-Performing Assets Decline 6% › Non-performing loans, excluding loans held for sale, declined $74 million or 3% › Non-performing assets declined $211 million or 6% › Early-stage and late-stage delinquencies declined 2% and 15% respectively › Business Services criticized loans declined approximately $595 million or 8% 5 Non-Performing Assets NPL OREO & Repo Held For Sale 3Q10 4Q10 1Q11 2Q11 3Q11 $0.0 $0.5 $1.0 $1.5 $2.0 $2.5 $3.0 $3.5 $4.0 $4.5 $5.0 $3.4 $3.2 $3.1 $2.8 $2.7 $0.5 $0.4 $0.4 $0.4 $0.3 $0.3 $0.3 $0.4 $0.4 $0.4 $4.2 $3.9 $3.9 $3.6 $3.4 $ in billions |
 Loan Loss Provision Declined 11% Sales/ HFS (1) (1) Loan charge-offs related to Sales and Transfer to Held for Sale (2) Excludes loans held for sale 6 Loan Loss Provision Allowance and Coverage 348 402 210 190 160 233 111 106 207 198 178 169 165 151 153 (150) (156) $760 $682 $482 $398 $355 ($200) $0 $200 $400 $600 $800 $1,000 3Q10 4Q10 1Q11 2Q11 3Q11 Business Services and HFS Consumer Reserve Increase / Reduction $ in millions $3,185 $3,185 $3,186 $3,120 $2,964 94% 101% 103% 112% 109% 60% 70% 80% 90% 100% 110% 120% 130% $2,000 $2,200 $2,400 $2,600 $2,800 $3,000 $3,200 $3,400 3Q10 4Q10 1Q11 2Q11 3Q11 $ in millions Allowance for loan loss ALL/NPL (2) |
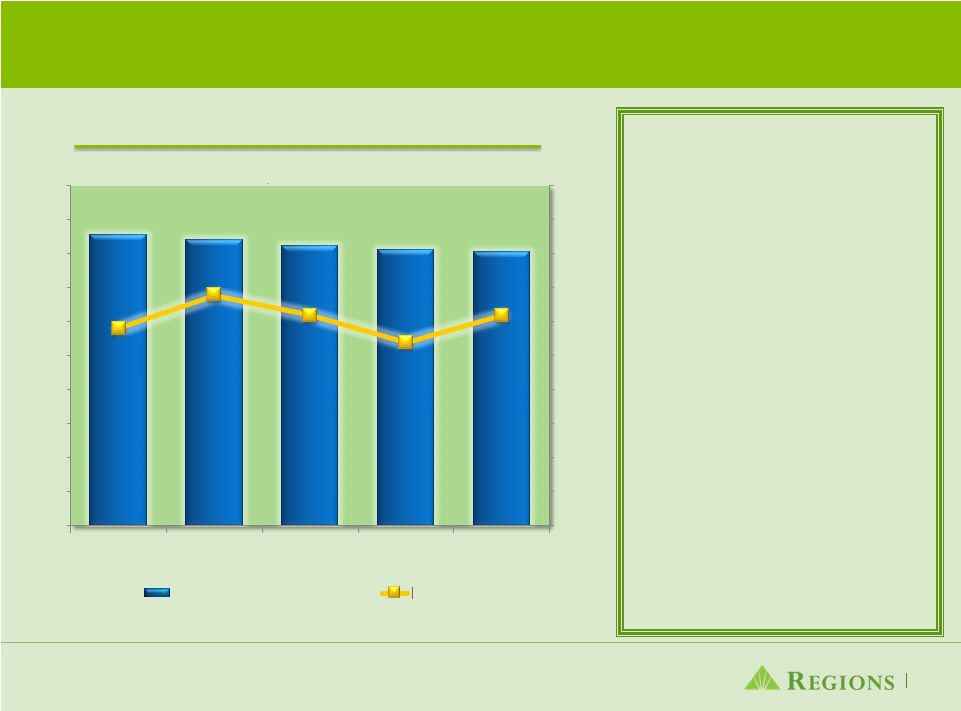 Loan Balances Reflect Commercial and Credit Card Growth Offset by Continued Decline in Investor Real Estate › Commercial & Industrial loan balances on an ending basis increased 13% from one year ago reflecting strength in our middle market segment › Commercial & industrial commitments increased $700 million or 3% linked quarter to $29 billion › Investor Real Estate reduced to 15.0% of total loans down from 20.7% one year ago › Loan yield increased 4 bps linked quarter › Credit card portfolio will gradually grow over time with strong cross-sell opportunities 7 * Average Balances Loan Balances* and Loan Yields $85,616 $84,108 $82,412 $81,106 $80,513 4.29% 4.34% 4.31% 4.27% 4.31% 4.00% 4.05% 4.10% 4.15% 4.20% 4.25% 4.30% 4.35% 4.40% 4.45% 4.50% $0 $10,000 $20,000 $30,000 $40,000 $50,000 $60,000 $70,000 $80,000 $90,000 $100,000 3Q10 4Q10 1Q11 2Q11 3Q11 $ in millions Avg. Loan Balance Loan Yield |
 Low Cost Deposit Growth Drives 7 bps Decline in Deposit Costs › Our improved deposit mix is resulting in lower deposit costs › Low cost deposits as a % of total deposits increased to 77.8% in 3Q11 from 73.5% in 3Q10 › Repricing opportunities remain with over $13.1 billion of CD’s maturing over the next 5 quarters at an average rate of 1.54% › Deposit costs declined 7 bps linked quarter; down 24 bps year-over-year 8 * Average Balances Deposit Balances* and Deposit Costs 69,917 71,273 72,286 73,616 $74,778 25,161 23,369 22,971 22,506 21,369 $95,078 $94,642 $95,257 $96,122 $96,147 70 bps 64 bps 59 bps 53 bps 46 bps 0 bps 20 bps 40 bps 60 bps 80 bps $0 $20,000 $40,000 $60,000 $80,000 $100,000 $120,000 $ in millions 100 bps 120 bps Low Cost Deposits Time Deposits + Other Deposit Cost 3Q10 4Q10 1Q11 2Q11 3Q11 |
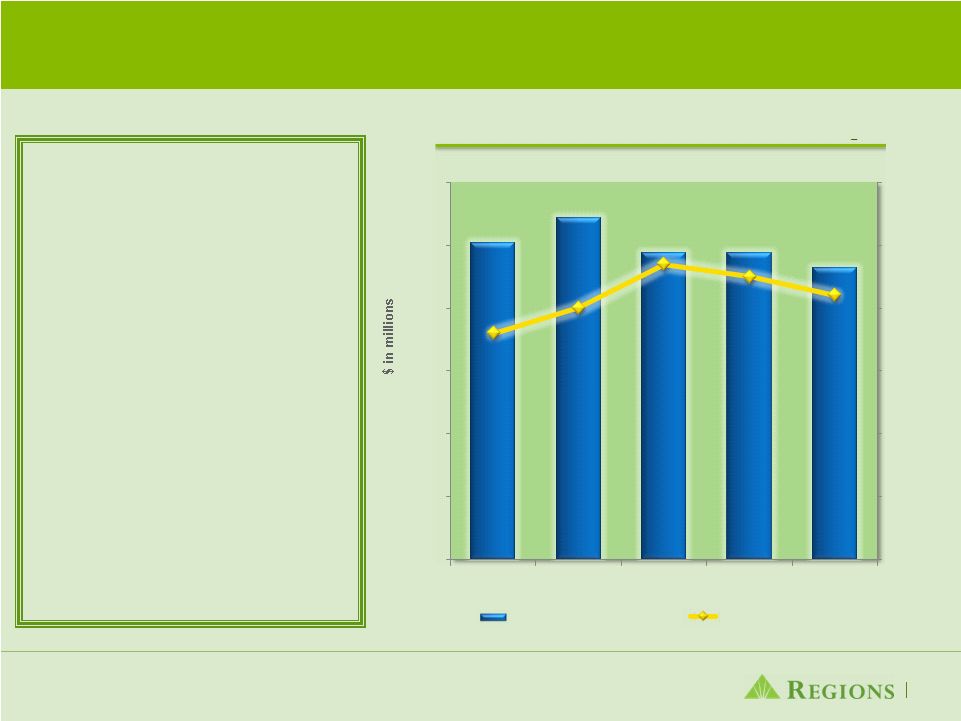 Net Interest Margin Impacted by Higher Prepayments in Investment Portfolio and Cash Reserves › Net Interest Margin down 3 bps linked quarter; up 6 bps versus prior year › Linked quarter decline driven by the impact of low long-term interest rates on prepayment activity and premium amortization in the investment portfolio › Cash reserves negatively impacted net interest margin 16 bps in 3Q11 versus 13 bps in 2Q11 9 Net Interest Income and Net Interest Margin $886 $872 $872 $866 2.96% 3.00% 3.07% 3.05% 3.02% 2.60% 2.70% 2.80% 2.90% 3.00% 3.10% 3.20% $750 $775 $800 $825 $850 $875 $900 3Q10 4Q10 1Q11 2Q11 3Q11 Net Interest Income (FTE) Net Interest Margin $876 |
 Non-Interest Revenues Reflect Higher Mortgage Income and Solid Service Charges › Adjusted non-interest revenue* 1% lower than prior quarter › Service charges increase reflects ongoing restructuring of our accounts to fee- eligible and an increase in total spending activity by customers › Interchange income benefited from increased transaction volume year to date › Mortgage revenue increased 36% driven by a decline in long term interest rates which led to a 9% increase in originations › Volatile market conditions resulted in a decline in brokerage, investment banking and capital markets 10 * Non – GAAP; Refer to Appendix Adjusted Non-Interest Revenue* 294 290 287 308 310 257 312 267 248 217 131 142 165 151 153 66 51 45 50 68 $748 $795 $764 $757 $748 $0 $100 $200 $300 $400 $500 $600 $700 $800 $900 3Q10 4Q10 1Q11 2Q11 3Q11 $ in millions Service Charges on Deposit Accounts Brokerage, Investment Banking and Capital Markets Other Mortgage Income |
 Continued Focused Expense Management Leads to Further Decline in Expenses › Adjusted non-interest expenses* 5% lower versus prior quarter › Salaries and benefits costs declined $32 million linked quarter › FDIC premium expenses decreased $25 million versus 2Q11 › Credit-related costs increased $8 million over prior quarter and accounted for 9% of third quarter’s adjusted non-interest expenses* › Headcount reduced another 380 positions this quarter, bringing headcount down 7% over the last 2 years 11 * Non – GAAP; Refer to Appendix Headcount Trends 28,995 28,509 28,213 27,895 27,898 27,829 27,557 27,261 26,881 3Q09 4Q09 1Q10 2Q10 3Q10 4Q10 1Q11 2Q11 3Q11 |
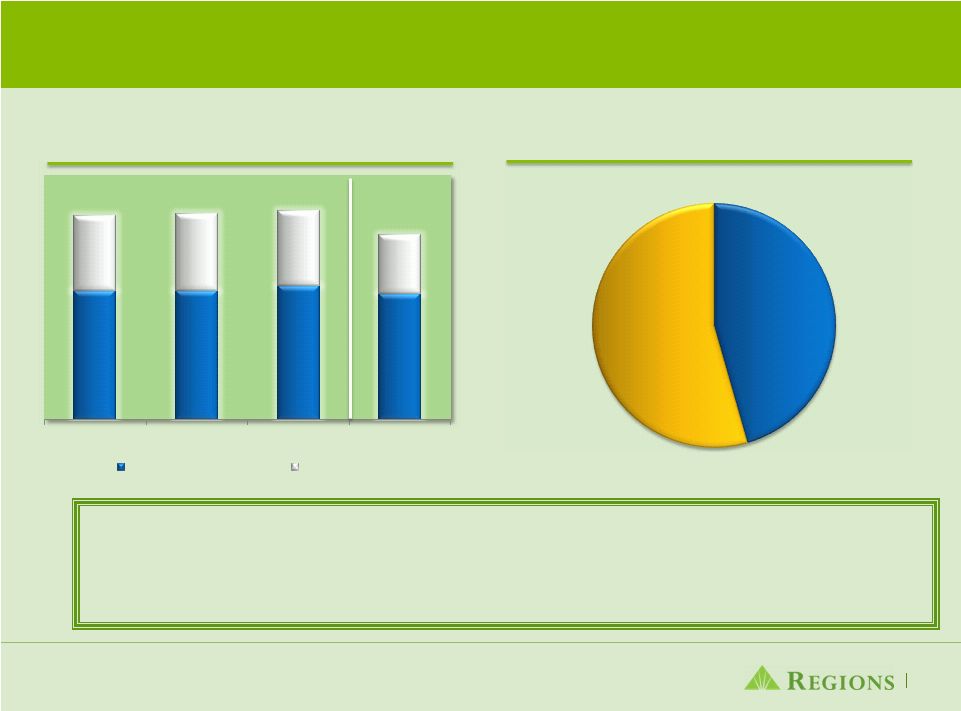 Capital Ratios Remain Strong; Liquidity Profile Solid * Current Quarter ratios are estimated ** Non-GAAP - Subject to change as interpretation of Basel III rules is ongoing and dependent on guidance from Basel and regulators; see appendix for reconciliation › Well-positioned with respect to the Liquidity Coverage Ratio prescribed under Basel III › Solid liquidity at both the bank and holding company › Loan-to-deposit ratio of 83% and cash held at the Federal Reserve totaled $6 billion 12 Capital Ratios Favorable Liquidity Position 7.9% 7.9% 8.2% 7.7% 12.5% 12.6% 12.8% 11.3% 1Q11 2Q11 3Q11* 3Q11 Basel III** Tier 1 Common Tier 1 Loans $80.5 Deposits $96.1 |
 |
 15 ›This presentation may include forward-looking statements which reflect Regions’ current views with respect to future events and financial performance. The Private Securities Litigation Reform Act of 1995 (“the Act”) provides a “safe harbor” for forward-looking statements which are identified as such and are accompanied by the identification of important factors that could cause actual results to differ materially from the forward-looking statements. For these statements, we, together with our subsidiaries, claim the protection afforded by the safe harbor in the Act. Forward-looking statements are not based on historical information, but rather are related to future operations, strategies, financial results or other developments. Forward-looking statements are based on management’s expectations as well as certain assumptions and estimates made by, and information available to, management at the time the statements are made. Those statements are based on general assumptions and are subject to various risks, uncertainties and other factors that may cause actual results to differ materially from the views, beliefs and projections expressed in such statements. These risks, uncertainties and other factors include, but are not limited to, those described below: › The Dodd-Frank Wall Street Reform and Consumer Protection Act (the "Dodd-Frank Act") became law on July 21, 2010, and a number of legislative, regulatory and tax proposals remain pending. Additionally, the U.S. Treasury and federal banking regulators continue to implement, but are also beginning to wind down, a number of programs to address capital and liquidity in the banking system. Proposed rules, including those that are part of the Basel III process, could require banking institutions to increase levels of capital. All of the foregoing may have significant effects on Regions and the financial services industry, the exact nature of which cannot be determined at this time. › Regions' ability to mitigate the impact of the Dodd-Frank Act on debit interchange fees through revenue enhancements and other revenue measures, which will depend on various factors, including the acceptance by our customers of modified fee structures for Regions' products and services. › The impact of compensation and other restrictions imposed under the Troubled Asset Relief Program (“TARP”) until Regions repays the outstanding preferred stock and warrant issued under the TARP, including restrictions on Regions’ ability to attract and retain talented executives and associates. › Possible additional loan losses, impairment of goodwill and other intangibles, and adjustment of valuation allowances on deferred tax assets and the impact on earnings and capital. › Possible changes in interest rates may increase funding costs and reduce earning asset yields, thus reducing margins. Increases in benchmark interest rates would also increase debt service requirements for customers whose terms include a variable interest rate, which may negatively impact the ability of borrowers to pay as contractually obligated. › Possible changes in general economic and business conditions in the United States in general and in the communities Regions serves in particular, including any prolonging or worsening of the current unfavorable economic conditions including unemployment levels. › Possible changes in the creditworthiness of customers and the possible impairment of the collectability of loans. › Possible changes in trade, monetary and fiscal policies, laws and regulations and other activities of governments, agencies, and similar organizations, may have an adverse effect on business. › The current stresses in the financial and real estate markets, including possible continued deterioration in property values. › Regions' ability to manage fluctuations in the value of assets and liabilities and off-balance sheet exposure so as to maintain sufficient capital and liquidity to support Regions' business. › Regions' ability to expand into new markets and to maintain profit margins in the face of competitive pressures. › Regions' ability to develop competitive new products and services in a timely manner and the acceptance of such products and services by Regions' customers and potential customers. › Regions' ability to keep pace with technological changes. › Regions' ability to effectively manage credit risk, interest rate risk, market risk, operational risk, legal risk, liquidity risk, and regulatory and compliance risk. › Regions’ ability to ensure adequate capitalization which is impacted by inherent uncertainties in forecasting credit losses. › The cost and other effects of material contingencies, including litigation contingencies, and any adverse judicial, administrative or arbitral rulings or proceedings. › The effects of increased competition from both banks and non-banks. › The effects of geopolitical instability and risks such as terrorist attacks. › Possible changes in consumer and business spending and saving habits could affect Regions' ability to increase assets and to attract deposits. › The effects of weather and natural disasters such as floods, droughts, wind, tornados and hurricanes, and the effects of man-made disasters. › Possible downgrades in ratings issued by rating agencies. › Potential dilution of holders of shares of Regions’ common stock resulting from the U.S. Treasury’s investment in TARP. › Possible changes in the speed of loan prepayments by Regions’ customers and loan origination or sales volumes. › Possible acceleration of prepayments on mortgage-backed securities due to low interest rates and the related acceleration of premium amortization on those securities. › The effects of problems encountered by larger or similar financial institutions that adversely affect Regions or the banking industry generally. › Regions’ ability to receive dividends from its subsidiaries. › The effects of the failure of any component of Regions’ business infrastructure which is provided by a third party. › Changes in accounting policies or procedures as may be required by the Financial Accounting Standards Board or other regulatory agencies. › The effects of any damage to Regions’ reputation resulting from developments related to any of the items identified above. ›The foregoing list of factors is not exhaustive. For discussion of these and other factors that may cause actual results to differ from expectations, look under the captions “Forward-Looking Statements” and “Risk Factors” in Regions’ Annual Report on Form 10-K for the year ended December 31, 2010 and quarterly report on Forms 10-Q for the quarter ended June 30, 2011 and March 31, 2011, as on file with the Securities and Exchange Commission. ›The words "believe," "expect," "anticipate," "project," and similar expressions often signify forward-looking statements. You should not place undue reliance on any forward-looking statements, which speak only as of the date made. We assume no obligation to update or revise any forward-looking statements that are made from time to time. Forward-Looking Statements |
 Non-GAAP Reconciliation: PPI 16 ($ in millions) 3Q10 4Q10 1Q11 2Q11 3Q11 Net interest income (GAAP) 868 $ 877 $ 863 $ 864 $ 858 $ Non-interest income (GAAP) 750 1,213 843 781 745 Adjustments: Securities (gains) losses, net (2) (333) (82) (24) 1 Leveraged lease termination (gains) / losses - (59) - - 2 Loss (gain) on sale of mortgage loans - (26) 3 - - Adjusted non-interest income (non-GAAP) 748 795 764 757 748 Adjusted total revenue (non-GAAP) 1,616 $ 1,672 $ 1,627 $ 1,621 $ 1,606 $ Non-interest expense (GAAP) 1,163 $ 1,266 $ 1,167 $ 1,198 $ 1,066 $ Adjustments: Loss on extinguishment of debt - (55) - - - Securities impairment, net (1) - - - - Branch consolidation and property and equipment charges - - - (77) - Adjusted non-interest expense (non-GAAP) 1,162 $ 1,211 $ 1,167 $ 1,121 $ 1,066 $ Adjusted pre-tax pre-provision income 454 $ 461 $ 460 $ 500 $ 540 $ |
 Non-GAAP Reconciliation: EPS 17 3Q10 2Q11 3Q11 EPS as reported (GAAP) (0.17) $ 0.04 $ 0.08 $ Significant Items: Regulatory charge and related tax benefit - (0.03) - Securities (gains) losses, net - (0.01) NM Leveraged lease termination gains - - NM Branch consolidation and property and equipment charges - 0.04 - Adjusted EPS (Non-GAAP) (0.17) $ 0.04 $ 0.08 $ |
 Non-GAAP Reconciliation: Capital 18 ($ amounts in millions) 09/30/11 Stockholders' equity (GAAP) 17,263 Non-qualifying goodwill and intangibles (1) (5,820) Adjustments, including other comprehensive income related to cash flow hedges, disallowed deferred tax assets, threshold deductions and other adjustments (809) 10,634 Qualifying non-controlling interests 4 Basel III Tier 1 Capital (non-GAAP) 10,638 Basel III Tier 1 Capital (non-GAAP) 10,638 Preferred Stock (3,409) Qualifying non-controlling interests (4) Basel III Tier 1 Common (non-GAAP) 7,225 Basel I risk-weighted assets 92,791 Basel III risk-weighted assets (2) 94,389 Minimum Basel III Tier 1 Capital Ratio 11.3% 8.5% Basel III Tier 1 Common Ratio 7.7% 7.0% (1) Under Basel III, regulatory capital must be reduced by purchased credit card relationship intangible assets. These assets are partially allowed in Basel I capital. (2) Regions continues to develop systems and internal controls to precisely calculate risk-weighted assets as required by Basel III. The amount included above is a reasonable approximation, based on our understanding of the requirements. |