Exhibit 99.3

Regions Financial 1st
Quarter Earnings
Conference Call
April 24, 2012
REGIONS
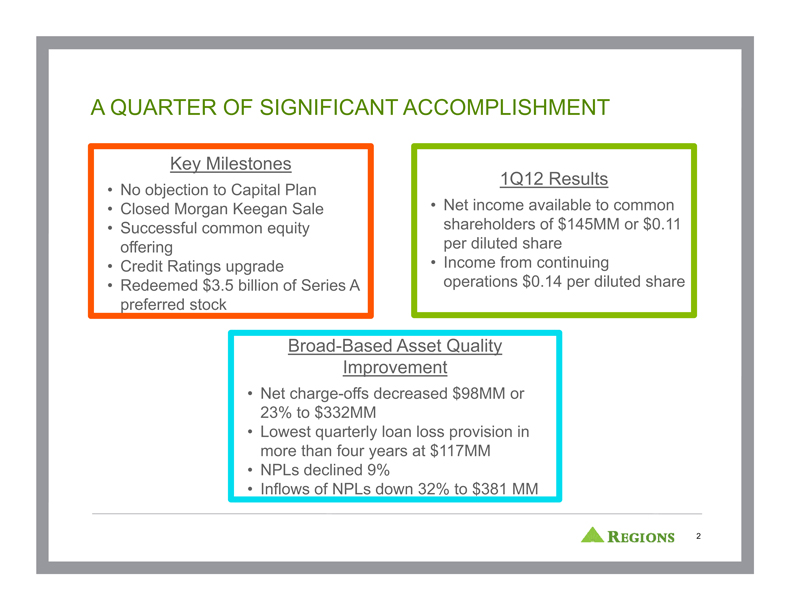
A QUARTER OF SIGNIFICANT ACCOMPLISHMENT
Key Milestones
• No objection to Capital Plan
• Closed Morgan Keegan Sale
• Successful common equity offering
• Credit Ratings upgrade
• Redeemed $3.5 billion of Series A preferred stock
1Q12 Results
• Net income available to common shareholders of $145MM or $0.11 per diluted share
• Income from continuing operations $0.14 per diluted share
Broad-Based Asset Quality Improvement
• Net charge-offs decreased $98MM or 23% to $332MM
• Lowest quarterly loan loss provision in more than four years at $117MM
• NPLs declined 9%
• Inflows of NPLs down 32% to $381 MM
REGIONS 2
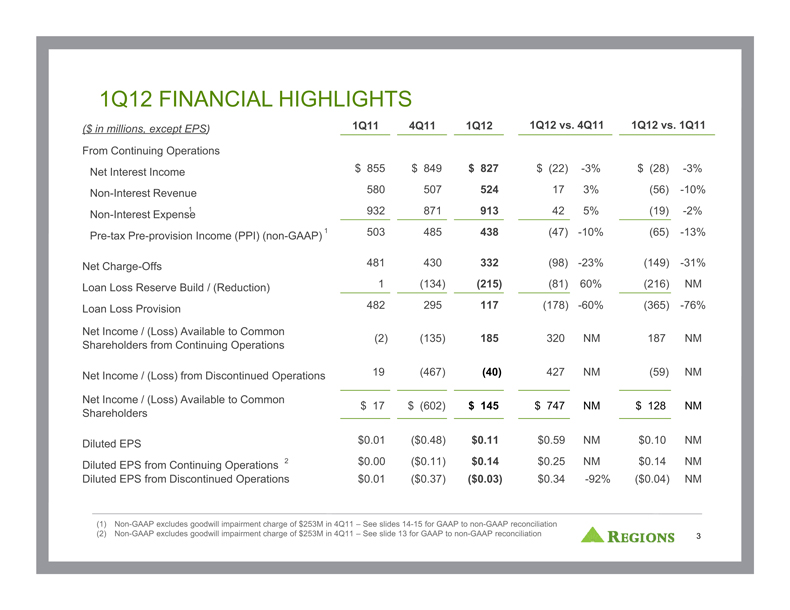
1Q12 FINANCIAL HIGHLIGHTS
($ in millions, except EPS) 1Q11 4Q11 1Q12 1Q12 vs. 4Q11 1Q12 vs. 1Q11
From Continuing Operations
Net Interest Income $ 855 $ 849 $ 827 $ (22) -3% $ (28) -3%
Non-Interest Revenue 580 507 524 17 3% (56) -10%
Non-Interest Expense1 932 871 913 42 5% (19) -2%
Pre-tax Pre-provision Income (PPI) (non-GAAP) 1 503 485 438 (47) -10% (65) -13%
Net Charge-Offs 481 430 332 (98) -23% (149) -31%
Loan Loss Reserve Build / (Reduction) 1 (134) (215) (81) 60% (216) NM
Loan Loss Provision 482 295 117 (178) -60% (365) -76%
Net Income / (Loss) Available to Common
Shareholders from Continuing Operations (2) (135) 185 320 NM 187 NM
Net Income / (Loss) from Discontinued Operations 19 (467) (40) 427 NM (59) NM
Net Income / (Loss) Available to Common $ 17 $ (602) $ 145 $ 747 NM $ 128 NM
Shareholders
Diluted EPS $0.01 ($0.48) $0.11 $0.59 NM $0.10 NM
Diluted EPS from Continuing Operations 2 $0.00 ($0.11) $0.14 $0.25 NM $0.14 NM
Diluted EPS from Discontinued Operations $0.01 ($0.37) ($0.03) $0.34 -92% ($0.04) NM
(1) Non-GAAP excludes goodwill impairment charge of $253M in 4Q11 – See slides 14-15 for GAAP to non-GAAP reconciliation
(2) Non-GAAP excludes goodwill impairment charge of $253M in 4Q11 – See slide 13 for GAAP to non-GAAP reconciliation
REGIONS 3
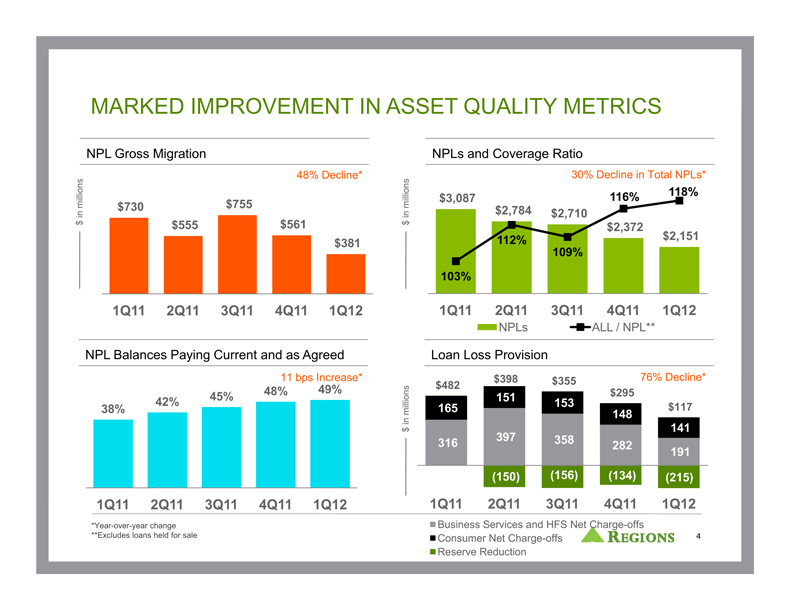
MARKED IMPROVEMENT IN ASSET QUALITY METRICS
NPL Gross Migration
$ in millions
48% Decline*
$730 $755 $555 $561 $381
1Q11 2Q11 3Q11 4Q11 1Q12
NPL Balances Paying Current and as Agreed
11 bps Increase*
48% 49% 42% 45% 38%
1Q11 2Q11 3Q11 4Q11 1Q12
*Year-over-year change
**Excludes loans held for sale
NPLs and Coverage Ratio
30% Decline in Total NPLs*
$ in millions
116% 118% $3,087 $2,784 $2,710 $2,372 112% $2,151 109% 103%
1Q11 2Q11 3Q11 4Q11 1Q12
NPLs ALL / NPL**
Loan Loss Provision
$ in millions
$398 $355 76% Decline* $482 151 153 $295 165 $117 148 141 397 358 316 282 191 (150) (156) (134) (215)
1Q11 2Q11 3Q11 4Q11 1Q12
Business Services and HFS Net Charge-offs
Consumer Net Charge-offs
Reserve Reduction
REGIONS 4
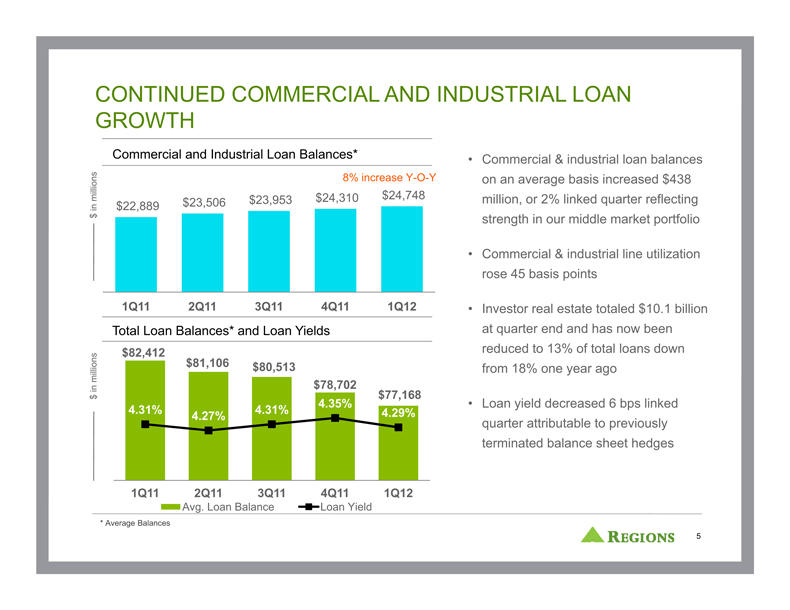
CONTINUED COMMERCIAL AND INDUSTRIAL LOAN GROWTH
Commercial and Industrial Loan Balances*
$ in millions
8% increase Y-O-Y
$22,889 $23,506 $23,953 $24,310 $24,748
1Q11 2Q11 3Q11 4Q11 1Q12
Total Loan Balances* and Loan Yields
$ in millions
$82,412 $81,106 $80,513 $78,702 $77,168
4.31% 4.27% 4.31% 4.35% 4.29%
1Q11 2Q11 3Q11 4Q11 1Q12
Avg. Loan Balance Loan Yield
* Average Balances
• Commercial & industrial loan balances on an average basis increased $438 million, or 2% linked quarter reflecting strength in our middle market portfolio
• Commercial & industrial line utilization rose 45 basis points
• Investor real estate totaled $10.1 billion at quarter end and has now been reduced to 13% of total loans down from 18% one year ago
• Loan yield decreased 6 bps linked quarter attributable to previously terminated balance sheet hedges
REGIONS 5
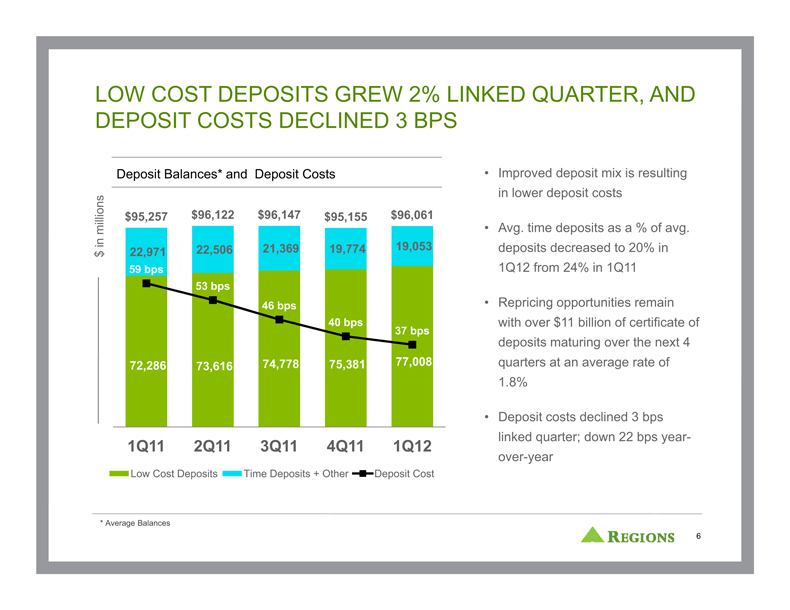
LOW COST DEPOSITS GREW 2% LINKED QUARTER, AND
DEPOSIT COSTS DECLINED 3 BPS
Deposit Balances* and Deposit Costs
$ in millions
$95,257 $96,122 $96,147 $95,155 $96,061
22,506 21,369 19,774 19,053 22,971
59 bps 53 bps 46 bps 40 bps 37 bps
72,286 73,616 74,778 75,381 77,008
1Q11 2Q11 3Q11 4Q11 1Q12
Low Cost Deposits Time Deposits + Other Deposit Cost
* Average Balances
• Improved deposit mix is resulting in lower deposit costs
• Avg. time deposits as a % of avg. deposits decreased to 20% in 1Q12 from 24% in 1Q11
• Repricing opportunities remain with over $11 billion of certificate of deposits maturing over the next 4 quarters at an average rate of 1.8%
• Deposit costs declined 3 bps linked quarter; down 22 bps year-over-year
REGIONS 6
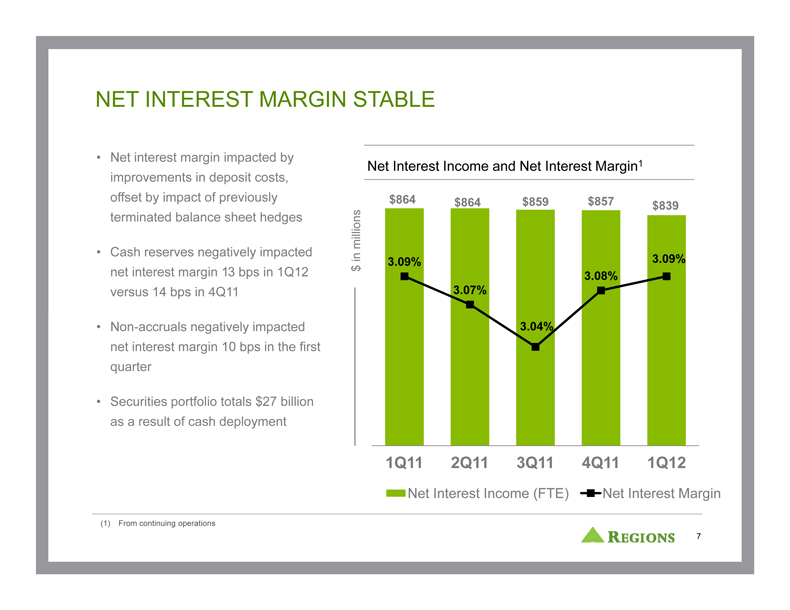
NET INTEREST MARGIN STABLE
• Net interest margin impacted by improvements in deposit costs, offset by impact of previously terminated balance sheet hedges
• Cash reserves negatively impacted net interest margin 13 bps in 1Q12 versus 14 bps in 4Q11
• Non-accruals negatively impacted net interest margin 10 bps in the first quarter
• Securities portfolio totals $27 billion as a result of cash deployment
Net Interest Income and Net Interest Margin1
$ in millions
$864 $864 $859 $857 $839
3.09% 3.07% 3.04% 3.08% 3.09%
1Q11 2Q11 3Q11 4Q11 1Q12
Net Interest Income (FTE) Net Interest Margin
(1) From continuing operations
REGIONS 7
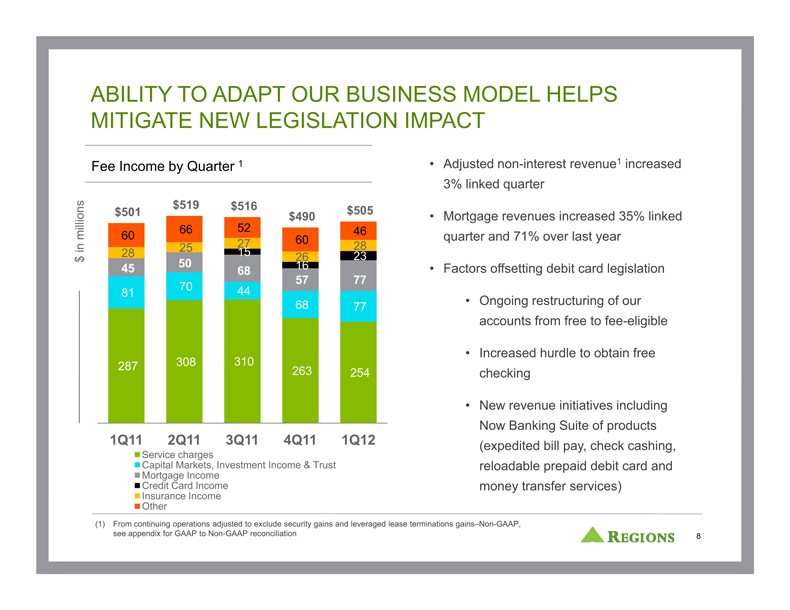
ABILITY TO ADAPT OUR BUSINESS MODEL HELPS
MITIGATE NEW LEGISLATION IMPACT
Fee Income by Quarter 1
$ in millions
$501 $519 $516 $490 $505
60 66 52 60 46
28 25 27 26 28
15 16 23
45 50 68 57 77
81 70 44 68 77
287 308 310 263 254
1Q11 2Q11 3Q11 4Q11 1Q12
Service charges
Capital Markets, Investment Income & Trust
Mortgage Income
Credit Card Income
Insurance Income
Other
• Adjusted non-interest revenue1 increased 3% linked quarter
• Mortgage revenues increased 35% linked quarter and 71% over last year
• Factors offsetting debit card legislation
• Ongoing restructuring of our accounts from free to fee-eligible
• Increased hurdle to obtain free checking
• New revenue initiatives including Now Banking Suite of products (expedited bill pay, check cashing, reloadable prepaid debit card and money transfer services)
(1) From continuing operations adjusted to exclude security gains and leveraged lease terminations gains–Non-GAAP, see appendix for GAAP to Non-GAAP reconciliation
REGIONS 8
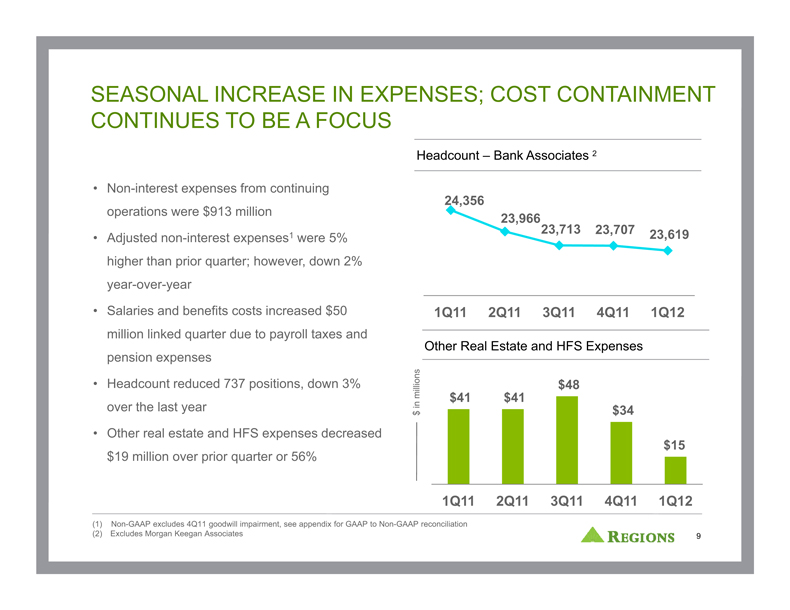
SEASONAL INCREASE IN EXPENSES; COST CONTAINMENT
CONTINUES TO BE A FOCUS
• Non-interest expenses from continuing operations were $913 million
• Adjusted non-interest expenses1 were 5% higher than prior quarter; however, down 2% year-over-year
• Salaries and benefits costs increased $50 million linked quarter due to payroll taxes and pension expenses
• Headcount reduced 737 positions, down 3% over the last year
• Other real estate and HFS expenses decreased $19 million over prior quarter or 56%
Headcount – Bank Associates 2
24,356 23,966 23,713 23,707 23,619
1Q11 2Q11 3Q11 4Q11 1Q12
Other Real Estate and HFS Expenses
$ in millions
$41 $41 $48 $34 $15
1Q11 2Q11 3Q11 4Q11 1Q12
(1) Non-GAAP excludes 4Q11 goodwill impairment, see appendix for GAAP to Non-GAAP reconciliation (2) Excludes Morgan Keegan Associates
REGIONS 9

STRONG CAPITAL RATIOS
• Tier 1 ratio is estimated at 14.3%, or 100 basis points higher linked quarter
• Tier 1 Capital adjusted to exclude TARP(3) stood at 10.6% at quarter end
• Basel III Tier 1 ratio estimated at 12.5% (2)
• Tier 1 Common ratio is estimated at 9.6%, or an increase of 110 bps linked quarter
• The $900 million common stock issuance contributed 95 basis points to quarter over quarter improvement
• Basel III Tier 1 Common ratio estimated at 8.9% (2)
Tier 1 Capital Ratio
12.5% 12.6% 12.8% 13.3% 14.3%
3.6% 3.6% 3.7% 3.9% 3.7%
8.9% 9.0% 9.1% 9.5% 10.6%
1Q11 2Q11 3Q11 4Q11 1Q12 (1)
Tier 1 Capital Excluding TARP(3) TARP Impact
(1) Current Quarter ratios are estimated
(2) Non-GAAP - Subject to change as interpretation of Basel III rules is ongoing and dependent on guidance from Basel and regulators; see slide 17 in appendix for reconciliation
(3) Non-GAAP – See appendix for reconciliation
(4) Based on ending balances
Loan to Deposit Ratio (4)
84% 84% 83% 81% 79%
1Q11 2Q11 3Q11 4Q11 1Q12
Tier 1 Common Ratio (3)
7.9% 7.9% 8.2% 8.5% 9.6%
1Q11 2Q11 3Q11 4Q11 1Q12 (1)
REGIONS 10
APPENDIX
REGIONS 11
FORWARD-LOOKING STATEMENTS
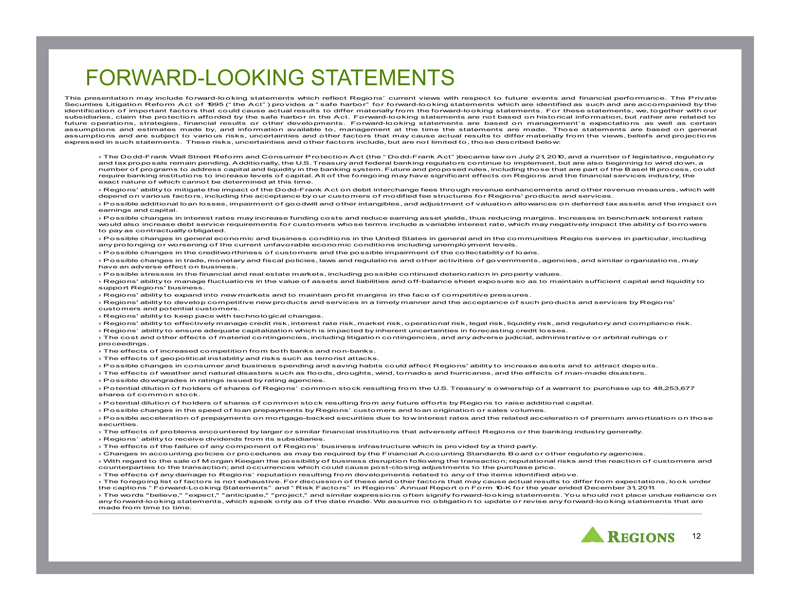
This presentation may include forward-looking statements which reflect Regions’ current views with respect to future events and financial performance. The Private Securities Litigation Reform Act of 1995 (“the Act”) provides a “safe harbor” for forward-looking statements which are identified as such and are accompanied by the identification of important factors that could cause actual results to differ materially from the forward-looking statements. For these statements, we, together with our subsidiaries, claim the protection afforded by the safe harbor in the Act. Forward-looking statements are not based on historical information, but rather are related to future operations, strategies, financial results or other developments. Forward-looking statements are based on management’s expectations as well as certain assumptions and estimates made by, and information available to, management at the time the statements are made. Those statements are based on general assumptions and are subject to various risks, uncertainties and other factors that may cause actual results to differ materially from the views, beliefs and projections expressed in such statements. These risks, uncertainties and other factors include, but are not limited to, those described below:
› The Dodd-Frank Wall Street Reform and Consumer Protection Act (the “Dodd-Frank Act”) became law on July 21, 2010, and a number of legislative, regulatory and tax proposals remain pending. Additionally, the U.S. Treasury and federal banking regulators continue to implement, but are also beginning to wind down, a number of programs to address capital and liquidity in the banking system. Future and proposed rules, including those that are part of the Basel III process, could require banking institutions to increase levels of capital. All of the foregoing may have significant effects on Regions and the financial services industry, the exact nature of which cannot be determined at this time.
› Regions’ ability to mitigate the impact of the Dodd-Frank Act on debit interchange fees through revenue enhancements and other revenue measures, which will depend on various factors, including the acceptance by our customers of modified fee structures for Regions’ products and services.
› Possible additional loan losses, impairment of goodwill and other intangibles, and adjustment of valuation allowances on deferred tax assets and the impact on earnings and capital.
› Possible changes in interest rates may increase funding costs and reduce earning asset yields, thus reducing margins. Increases in benchmark interest rates would also increase debt service requirements for customers whose terms include a variable interest rate, which may negatively impact the ability of borrowers to pay as contractually obligated.
› Possible changes in general economic and business conditions in the United States in general and in the communities Regions serves in particular, including any prolonging or worsening of the current unfavorable economic conditions including unemployment levels.
› Possible changes in the creditworthiness of customers and the possible impairment of the collectability of loans.
› Possible changes in trade, monetary and fiscal policies, laws and regulations and other activities of governments, agencies, and similar organizations, may have an adverse effect on business.
› Possible stresses in the financial and real estate markets, including possible continued deterioration in property values.
› Regions’ ability to manage fluctuations in the value of assets and liabilities and off-balance sheet exposure so as to maintain sufficient capital and liquidity to support Regions’ business.
› Regions’ ability to expand into new markets and to maintain profit margins in the face of competitive pressures.
› Regions’ ability to develop competitive new products and services in a timely manner and the acceptance of such products and services by Regions’ customers and potential customers.
› Regions’ ability to keep pace with technological changes.
› Regions’ ability to effectively manage credit risk, interest rate risk, market risk, operational risk, legal risk, liquidity risk, and regulatory and compliance risk.
› Regions’ ability to ensure adequate capitalization which is impacted by inherent uncertainties in forecasting credit losses.
› The cost and other effects of material contingencies, including litigation contingencies, and any adverse judicial, administrative or arbitral rulings or proceedings.
› The effects of increased competition from both banks and non-banks.
› The effects of geopolitical instability and risks such as terrorist attacks.
› Possible changes in consumer and business spending and saving habits could affect Regions’ ability to increase assets and to attract deposits.
› The effects of weather and natural disasters such as floods, droughts, wind, tornados and hurricanes, and the effects of man-made disasters.
› Possible downgrades in ratings issued by rating agencies.
› Potential dilution of holders of shares of Regions’ common stock resulting from the U.S. Treasury’s ownership of a warrant to purchase up to 48,253,677 shares of common stock.
› Potential dilution of holders of shares of common stock resulting from any future efforts by Regions to raise additional capital.
› Possible changes in the speed of loan prepayments by Regions’ customers and loan origination or sales volumes.
› Possible acceleration of prepayments on mortgage-backed securities due to low interest rates and the related acceleration of premium amortization on those securities.
› The effects of problems encountered by larger or similar financial institutions that adversely affect Regions or the banking industry generally.
› Regions’ ability to receive dividends from its subsidiaries.
› The effects of the failure of any component of Regions’ business infrastructure which is provided by a third party.
› Changes in accounting policies or procedures as may be required by the Financial Accounting Standards Board or other regulatory agencies.
› With regard to the sale of Morgan Keegan the possibility of business disruption following the transaction; reputational risks and the reaction of customers and counterparties to the transaction; and occurrences which could cause post-closing adjustments to the purchase price.
› The effects of any damage to Regions’ reputation resulting from developments related to any of the items identified above.
› The foregoing list of factors is not exhaustive. For discussion of these and other factors that may cause actual results to differ from expectations, look under the captions “Forward-Looking Statements” and “Risk Factors” in Regions’ Annual Report on Form 10-K for the year ended December 31, 2011.
› The words “believe,” “expect,” “anticipate,” “project,” and similar expressions often signify forward-looking statements. You should not place undue reliance on any forward-looking statements, which speak only as of the date made. We assume no obligation to update or revise any forward-looking statements that are made from time to time.
REGIONS 12
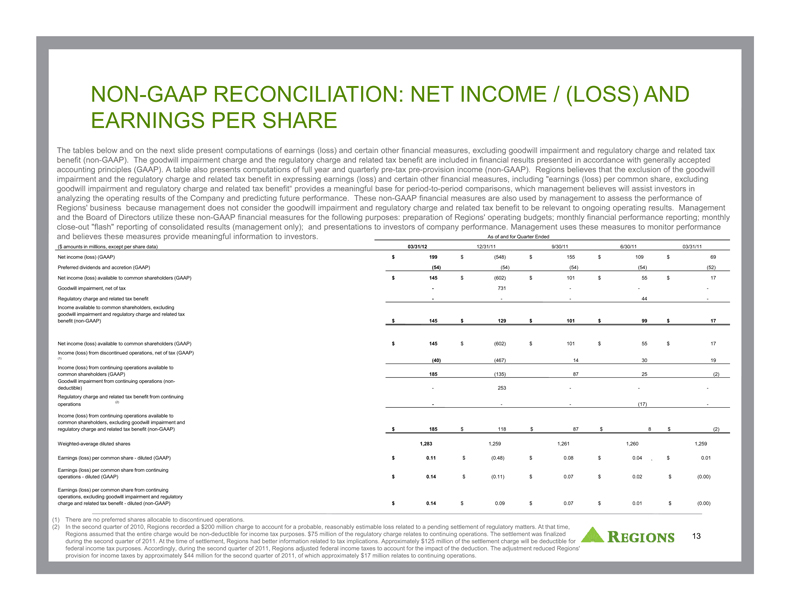
NON-GAAP RECONCILIATION: NET INCOME / (LOSS) AND EARNINGS PER SHARE
The tables below and on the next slide present computations of earnings (loss) and certain other financial measures, excluding goodwill impairment and regulatory charge and related tax benefit (non-GAAP). The goodwill impairment charge and the regulatory charge and related tax benefit are included in financial results presented in accordance with generally accepted accounting principles (GAAP). A table also presents computations of full year and quarterly pre-tax pre-provision income (non-GAAP). Regions believes that the exclusion of the goodwill impairment and the regulatory charge and related tax benefit in expressing earnings (loss) and certain other financial measures, including “earnings (loss) per common share, excluding goodwill impairment and regulatory charge and related tax benefit” provides a meaningful base for period-to-period comparisons, which management believes will assist investors in analyzing the operating results of the Company and predicting future performance. These non-GAAP financial measures are also used by management to assess the performance of Regions’ business because management does not consider the goodwill impairment and regulatory charge and related tax benefit to be relevant to ongoing operating results. Management and the Board of Directors utilize these non-GAAP financial measures for the following purposes: preparation of Regions’ operating budgets; monthly financial performance reporting; monthly close-out “flash” reporting of consolidated results (management only); and presentations to investors of company performance. Management uses these measures to monitor performance and believes these measures provide meaningful information to investors.
As of and for Quarter Ended
($ amounts in millions, except per share data) 03/31/12 12/31/11 9/30/11 6/30/11 03/31/11
Net income (loss) (GAAP) $ 199 $ (548) $ 155 $ 109 $ 69
Preferred dividends and accretion (GAAP) (54) (54) (54) (54) (52)
Net income (loss) available to common shareholders (GAAP) $ 145 $ (602) $ 101 $ 55 $ 17
Goodwill impairment, net of tax - 731- - -
Regulatory charge and related tax benefit - - - 44 -
Income available to common shareholders, excluding goodwill impairment and regulatory charge and related tax benefit (non-GAAP) $ 145 $ 129 $ 101 $ 99 $ 17
Net income (loss) available to common shareholders (GAAP) $ 145 $ (602) $ 101 $ 55 $ 17
Income (loss) from discontinued operations, net of tax (GAAP) (1) (40) (467) 14 30 19
Income (loss) from continuing operations available to common shareholders (GAAP) 185 (135) 87 25 (2)
Goodwill impairment from continuing operations (non-deductible) - 253 - - -
Regulatory charge and related tax benefit from continuing operations (2) - - - (17) -
Income (loss) from continuing operations available to common shareholders, excluding goodwill impairment and regulatory charge and related tax benefit (non-GAAP) $ 185 $ 118 $ 87 $ 8 $ (2)
Weighted-average diluted shares 1,283 1,259 1,261 1,260 1,259
Earnings (loss) per common share - diluted (GAAP) $ 0.11 $ (0.48) $ 0.08 $ 0.04 $ 0.01
Earnings (loss) per common share from continuing operations - diluted (GAAP) $ 0.14 $ (0.11) $ 0.07 $ 0.02 $ (0.00)
Earnings (loss) per common share from continuing operations, excluding goodwill impairment and regulatory charge and related tax benefit - diluted (non-GAAP) $ 0.14 $ 0.09 $ 0.07 $ 0.01 $ (0.00)
(1) There are no preferred shares allocable to discontinued operations.
(2) In the second quarter of 2010, Regions recorded a $200 million charge to account for a probable, reasonably estimable loss related to a pending settlement of regulatory matters. At that time, Regions assumed that the entire charge would be non-deductible for income tax purposes. $75 million of the regulatory charge relates to continuing operations. The settlement was finalized during the second quarter of 2011. At the time of settlement, Regions had better information related to tax implications. Approximately $125 million of the settlement charge will be deductible for federal income tax purposes. Accordingly, during the second quarter of 2011, Regions adjusted federal income taxes to account for the impact of the deduction. The adjustment reduced Regions’ provision for income taxes by approximately $44 million for the second quarter of 2011, of which approximately $17 million relates to continuing operations.
REGIONS 13
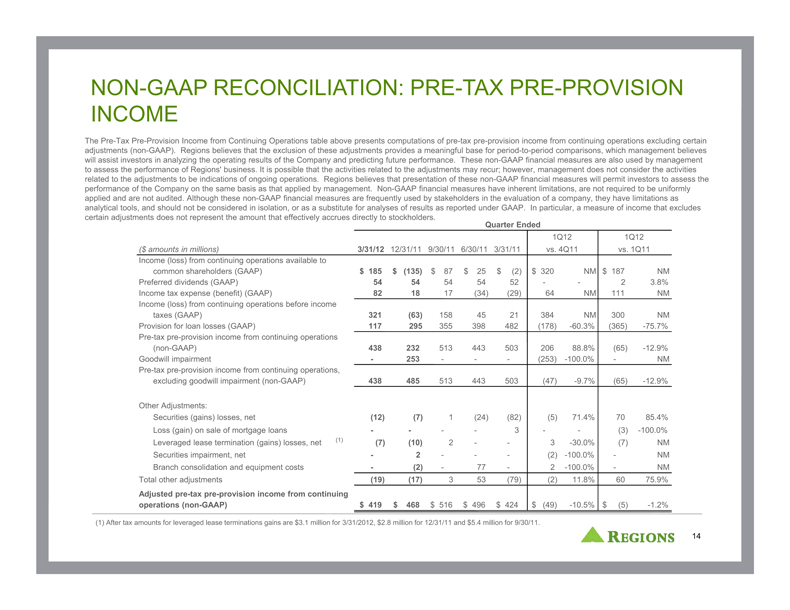
NON-GAAP RECONCILIATION: PRE-TAX PRE-PROVISION INCOME
The Pre-Tax Pre-Provision Income from Continuing Operations table above presents computations of pre-tax pre-provision income from continuing operations excluding certain adjustments (non-GAAP). Regions believes that the exclusion of these adjustments provides a meaningful base for period-to-period comparisons, which management believes will assist investors in analyzing the operating results of the Company and predicting future performance. These non-GAAP financial measures are also used by management to assess the performance of Regions’ business. It is possible that the activities related to the adjustments may recur; however, management does not consider the activities related to the adjustments to be indications of ongoing operations. Regions believes that presentation of these non-GAAP financial measures will permit investors to assess the performance of the Company on the same basis as that applied by management. Non-GAAP financial measures have inherent limitations, are not required to be uniformly applied and are not audited. Although these non-GAAP financial measures are frequently used by stakeholders in the evaluation of a company, they have limitations as analytical tools, and should not be considered in isolation, or as a substitute for analyses of results as reported under GAAP. In particular, a measure of income that excludes certain adjustments does not represent the amount that effectively accrues directly to stockholders.
Quarter Ended
($ amounts in millions) 3/31/12 12/31/11 9/30/11 6/30/11 3/31/11 1Q12 vs. 4Q11 1Q12 vs. 1Q11
Income (loss) from continuing operations available to common shareholders (GAAP) $ 185 $ (135) $ 87 $ 25 $ (2) $ 320 NM $ 187 NM
Preferred dividends (GAAP) 54 54 54 54 52 - - 2 3.8%
Income tax expense (benefit) (GAAP) 82 18 17 (34) (29) 64 NM 111 NM
Income (loss) from continuing operations before income taxes (GAAP) 321(63) 158 45 21 384 NM 300 NM
Provision for loan losses (GAAP) 117 295 355 398 482 (178) -60.3% (365) -75.7%
Pre-tax pre-provision income from continuing operations (non-GAAP) 438 232 513 443 503 206 88.8%(65) -12.9%
Goodwill impairment - 253 - - - (253) -100.0% - NM
Pre-tax pre-provision income from continuing operations, excluding goodwill impairment (non-GAAP) 438 485 513 443 503 (47) -9.7% (65) -12.9%
Other Adjustments:
Securities (gains) losses, net (12) (7) 1 (24) (82) (5) 71.4% 70 85.4%
Loss (gain) on sale of mortgage loans - - - - 3 - - (3) -100.0%
Leveraged lease termination (gains) losses, net (1) (7) (10) 2 - - 3 -30.0% (7) NM
Securities impairment, net - 2 - - - (2) -100.0% - NM
Branch consolidation and equipment costs - (2) - 77 - 2 -100.0% - NM
Total other adjustments (19) (17) 3 53 (79) (2) 11.8% 60 75.9%
Adjusted pre-tax pre-provision income from continuing operations (non-GAAP) $ 419 $ 468 $ 516 $ 496 $ 424 $ (49) -10.5% $ (5) -1.2%
(1) After tax amounts for leveraged lease terminations gains are $3.1 million for 3/31/2012, $2.8 million for 12/31/11 and $5.4 million for 9/30/11.
REGIONS 14
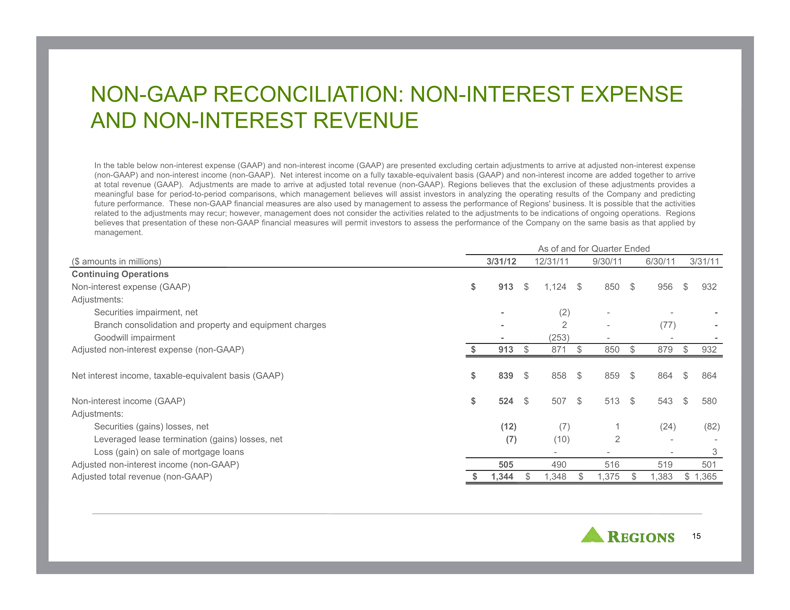
NON-GAAP RECONCILIATION: NON-INTEREST EXPENSE AND NON-INTEREST REVENUE
In the table below non-interest expense (GAAP) and non-interest income (GAAP) are presented excluding certain adjustments to arrive at adjusted non-interest expense (non-GAAP) and non-interest income (non-GAAP). Net interest income on a fully taxable-equivalent basis (GAAP) and non-interest income are added together to arrive at total revenue (GAAP). Adjustments are made to arrive at adjusted total revenue (non-GAAP). Regions believes that the exclusion of these adjustments provides a meaningful base for period-to-period comparisons, which management believes will assist investors in analyzing the operating results of the Company and predicting future performance. These non-GAAP financial measures are also used by management to assess the performance of Regions’ business. It is possible that the activities related to the adjustments may recur; however, management does not consider the activities related to the adjustments to be indications of ongoing operations. Regions believes that presentation of these non-GAAP financial measures will permit investors to assess the performance of the Company on the same basis as that applied by management.
As of and for Quarter Ended
($ amounts in millions) 3/31/12 12/31/11 9/30/11 6/30/11 3/31/11
Continuing Operations
Non-interest expense (GAAP) $ 913 $ 1,124 $ 850 $ 956 $ 932
Adjustments:
Securities impairment, net -(2) - - -
Branch consolidation and property and equipment charges - 2 - (77) -
Goodwill impairment - (253) - - -
Adjusted non-interest expense (non-GAAP) $ 913 $ 871 $ 850 $ 879 $ 932
Net interest income, taxable-equivalent basis (GAAP) $ 839 $ 858 $ 859 $ 864 $ 864
Non-interest income (GAAP) $ 524 $ 507 $ 513 $ 543 $ 580
Adjustments:
Securities (gains) losses, net (12) (7) 1 (24) (82)
Leveraged lease termination (gains) losses, net (7) (10) 2 - -
Loss (gain) on sale of mortgage loans - - - 3
Adjusted non-interest income (non-GAAP) 505 490 516 519 501
Adjusted total revenue (non-GAAP) $ 1,344 $ 1,348 $ 1,375 $ 1,383 $ 1,365
REGIONS 15
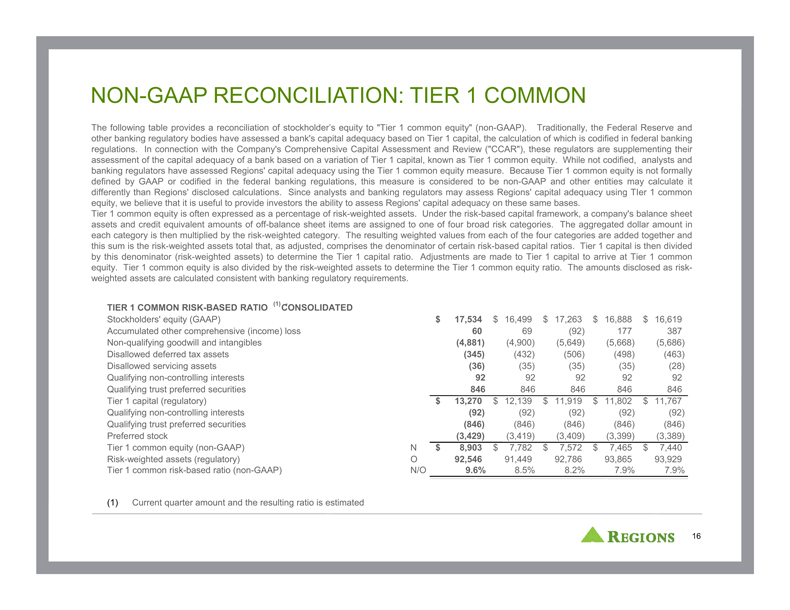
NON-GAAP RECONCILIATION: TIER 1 COMMON
The following table provides a reconciliation of stockholder’s equity to “Tier 1 common equity” (non-GAAP). Traditionally, the Federal Reserve and other banking regulatory bodies have assessed a bank’s capital adequacy based on Tier 1 capital, the calculation of which is codified in federal banking regulations. In connection with the Company’s Comprehensive Capital Assessment and Review (“CCAR”), these regulators are supplementing their assessment of the capital adequacy of a bank based on a variation of Tier 1 capital, known as Tier 1 common equity. While not codified, analysts and banking regulators have assessed Regions’ capital adequacy using the Tier 1 common equity measure. Because Tier 1 common equity is not formally defined by GAAP or codified in the federal banking regulations, this measure is considered to be non-GAAP and other entities may calculate it differently than Regions’ disclosed calculations. Since analysts and banking regulators may assess Regions’ capital adequacy using TIer 1 common equity, we believe that it is useful to provide investors the ability to assess Regions’ capital adequacy on these same bases.
Tier 1 common equity is often expressed as a percentage of risk-weighted assets. Under the risk-based capital framework, a company’s balance sheet assets and credit equivalent amounts of off-balance sheet items are assigned to one of four broad risk categories. The aggregated dollar amount in each category is then multiplied by the risk-weighted category. The resulting weighted values from each of the four categories are added together and this sum is the risk-weighted assets total that, as adjusted, comprises the denominator of certain risk-based capital ratios. Tier 1 capital is then divided by this denominator (risk-weighted assets) to determine the Tier 1 capital ratio. Adjustments are made to Tier 1 capital to arrive at Tier 1 common equity. Tier 1 common equity is also divided by the risk-weighted assets to determine the Tier 1 common equity ratio. The amounts disclosed as risk-weighted assets are calculated consistent with banking regulatory requirements.
TIER 1 COMMON RISK-BASED RATIO (1) CONSOLIDATED
Stockholders’ equity (GAAP) $ 17,534 $ 16,499 $ 17,263 $ 16,888 $ 16,619
Accumulated other comprehensive (income) loss 60 69 (92) 177 387
Non-qualifying goodwill and intangibles (4,881) (4,900) (5,649) (5,668) (5,686)
Disallowed deferred tax assets (345) (432) (506) (498) (463)
Disallowed servicing assets (36) (35) (35) (35) (28)
Qualifying non-controlling interests 92 92 92 92 92
Qualifying trust preferred securities 846 846 846 846 846
Tier 1 capital (regulatory) $ 13,270 $ 12,139 $ 11,919 $ 11,802 $ 11,767
Qualifying non-controlling interests (92) (92) (92) (92) (92)
Qualifying trust preferred securities (846) (846) (846) (846) (846)
Preferred stock (3,429) (3,419) (3,409) (3,399) (3,389)
Tier 1 common equity (non-GAAP) N $ 8,903 $ 7,782 $ 7,572 $ 7,465 $ 7,440
Risk-weighted assets (regulatory) O 92,546 91,449 92,786 93,865 93,929
Tier 1 common risk-based ratio (non-GAAP) N/O 9.6% 8.5% 8.2% 7.9% 7.9%
(1) Current quarter amount and the resulting ratio is estimated
REGIONS 16
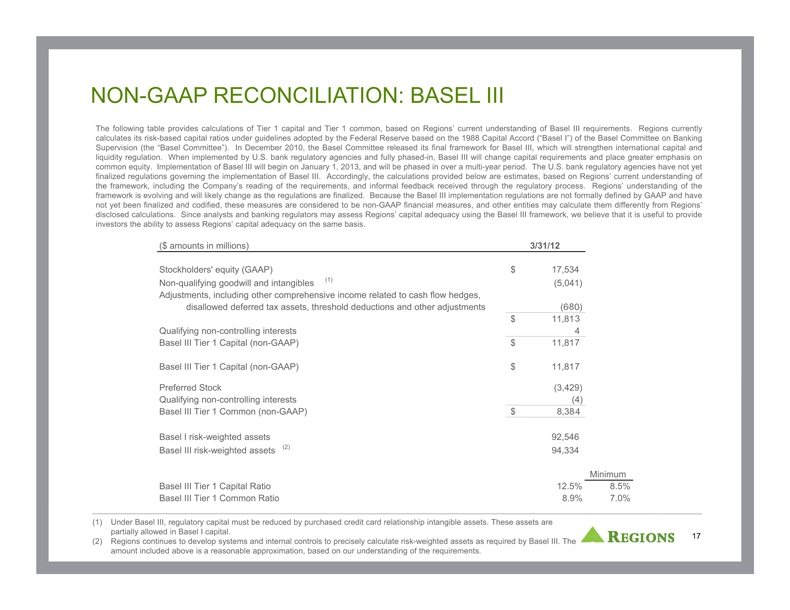
NON-GAAP RECONCILIATION: BASEL III
The following table provides calculations of Tier 1 capital and Tier 1 common, based on Regions’ current understanding of Basel III requirements. Regions currently calculates its risk-based capital ratios under guidelines adopted by the Federal Reserve based on the 1988 Capital Accord (“Basel I”) of the Basel Committee on Banking Supervision (the “Basel Committee”). In December 2010, the Basel Committee released its final framework for Basel III, which will strengthen international capital and liquidity regulation. When implemented by U.S. bank regulatory agencies and fully phased-in, Basel III will change capital requirements and place greater emphasis on common equity. Implementation of Basel III will begin on January 1, 2013, and will be phased in over a multi-year period. The U.S. bank regulatory agencies have not yet finalized regulations governing the implementation of Basel III. Accordingly, the calculations provided below are estimates, based on Regions’ current understanding of the framework, including the Company’s reading of the requirements, and informal feedback received through the regulatory process. Regions’ understanding of the framework is evolving and will likely change as the regulations are finalized. Because the Basel III implementation regulations are not formally defined by GAAP and have not yet been finalized and codified, these measures are considered to be non-GAAP financial measures, and other entities may calculate them differently from Regions’ disclosed calculations. Since analysts and banking regulators may assess Regions’ capital adequacy using the Basel III framework, we believe that it is useful to provide investors the ability to assess Regions’ capital adequacy on the same basis.
($ amounts in millions) 3/31/12
Stockholders’ equity (GAAP) $ 17,534
Non-qualifying goodwill and intangibles (1) (5,041)
Adjustments, including other comprehensive income related to cash flow hedges, disallowed deferred tax assets, threshold deductions and other adjustments (680)
$ 11,813
Qualifying non-controlling interests 4
Basel III Tier 1 Capital (non-GAAP) $ 11,817
Basel III Tier 1 Capital (non-GAAP) $ 11,817
Preferred Stock (3,429)
Qualifying non-controlling interests (4)
Basel III Tier 1 Common (non-GAAP) $ 8,384
Basel I risk-weighted assets 92,546
Basel III risk-weighted assets (2) 94,334
Minimum
Basel III Tier 1 Capital Ratio 12.5% 8.5%
Basel III Tier 1 Common Ratio 8.9% 7.0%
(1) Under Basel III, regulatory capital must be reduced by purchased credit card relationship intangible assets. These assets are partially allowed in Basel I capital.
(2) Regions continues to develop systems and internal controls to precisely calculate risk-weighted assets as required by Basel III. The amount included above is a reasonable approximation, based on our understanding of the requirements.
REGIONS 17
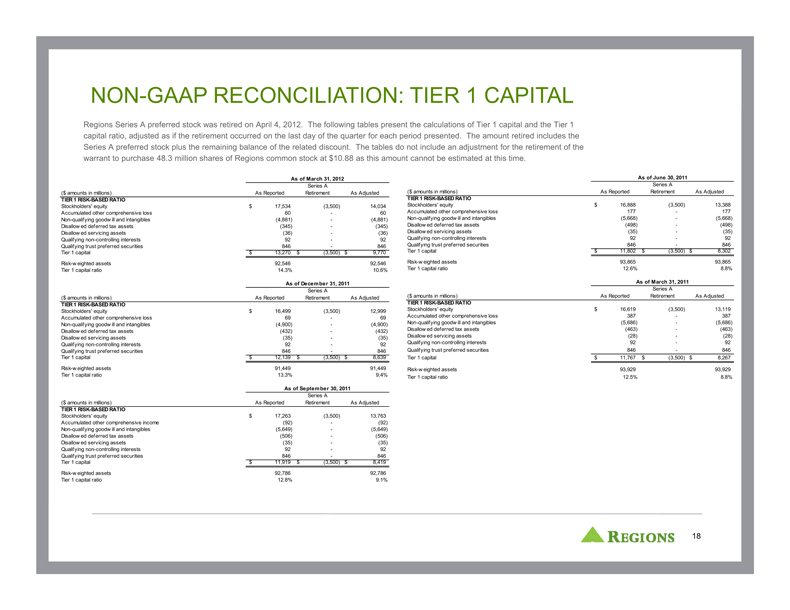
NON-GAAP RECONCILIATION: TIER 1 CAPITAL
Regions Series A preferred stock was retired on April 4, 2012. The following tables present the calculations of Tier 1 capital and the Tier 1 capital ratio, adjusted as if the retirement occurred on the last day of the quarter for each period presented. The amount retired includes the Series A preferred stock plus the remaining balance of the related discount. The tables do not include an adjustment for the retirement of the warrant to purchase 48.3 million shares of Regions common stock at $10.88 as this amount cannot be estimated at this time.
As of March 31, 2012
($ amounts in millions) As Reported Series A Retirement As Adjusted
TIER 1 RISK-BASED RATIO
Stockholders’ equity $ 17,534 (3,500) 14,034
Accumulated other comprehensive loss 60 - 60
Non-qualifying goodwill and intangibles (4,881) - (4,881)
Disallowed deferred tax assets (345) - (345)
Disallowed servicing assets (36) - (36)
Qualifying non-controlling interests 92 - 92
Qualifying trust preferred securities 846 - 846
Tier 1 capital $ 13,270 $ (3,500) $ 9,770
Risk-weighted assets 92,546 92,546
Tier 1 capital ratio 14.3% 10.6%
As of December 31, 2011
($ amounts in millions) As Reported Series A Retirement As Adjusted
TIER 1 RISK-BASED RATIO
Stockholders’ equity $ 16,499 (3,500) 12,999
Accumulated other comprehensive loss 69 - 69
Non-qualifying goodwill and intangibles (4,900) - (4,900)
Disallowed deferred tax assets (432) - (432)
Disallowed servicing assets (35) - (35)
Qualifying non-controlling interests 92 - 92
Qualifying trust preferred securities 846 - 846
Tier 1 capital $ 12,139 $ (3,500) $ 8,639
Risk-weighted assets 91,449 91,449
Tier 1 capital ratio 13.3% 9.4%
As of September 30, 2011
($ amounts in millions) As Reported Series A Retirement As Adjusted
TIER 1 RISK-BASED RATIO
Stockholders’ equity $ 17,263 (3,500) 13,763
Accumulated other comprehensive income (92) - (92)
Non-qualifying goodwill and intangibles (5,649) - (5,649)
Disallowed deferred tax assets (506) - (506)
Disallowed servicing assets (35) - (35)
Qualifying non-controlling interests 92 - 92
Qualifying trust preferred securities 846 - 846
Tier 1 capital $ 11,919 $ (3,500) $ 8,419
Risk-weighted assets 92,786 92,786
Tier 1 capital ratio 12.8% 9.1%
As of June 30, 2011
($ amounts in millions) As Reported Series A Retirement As Adjusted
TIER 1 RISK-BASED RATIO
Stockholders’ equity $ 16,888 (3,500) 13,388
Accumulated other comprehensive loss 177 - 177
Non-qualifying goodwill and intangibles (5,668) - (5,668)
Disallowed deferred tax assets (498) - (498)
Disallowed servicing assets (35) - (35)
Qualifying non-controlling interests 92 - 92
Qualifying trust preferred securities 846 - 846
Tier 1 capital $ 11,802 $ (3,500) $ 8,302
Risk-weighted assets 93,865 93,865
Tier 1 capital ratio 12.6% 8.8%
As of March 31, 2011
($ amounts in millions) As Reported Series A Retirement As Adjusted
TIER 1 RISK-BASED RATIO
Stockholders’ equity $ 16,619 (3,500) 13,119
Accumulated other comprehensive loss 387 - 387
Non-qualifying goodwill and intangibles (5,686) - (5,686)
Disallowed deferred tax assets (463) - (463)
Disallowed servicing assets (28) - (28)
Qualifying non-controlling interests 92 - 92
Qualifying trust preferred securities 846 - 846
Tier 1 capital $ 11,767 $ (3,500) $ 8,267
Risk-weighted assets 93,929 93,929
Tier 1 capital ratio 12.5% 8.8%
REGIONS 18

REGIONS