 BARCLAYS GLOBAL FINANCIAL SERVICES CONFERENCE September 11, 2012 David Turner Chief Financial Officer Exhibit 99.1 |
 2 INVESTMENT THESIS Attractive Market Presence • Leading Southeastern depository franchise with favorable demographics • Leading brand favorability • Top share in core markets Improved Credit Profile • Aggressive risk management initiatives • Significant reduction in higher risk loan portfolios • Significant improvement in credit quality metrics Comprehensive Product Offering • Balanced business mix • Momentum in C&I and consumer offerings • Focused on core banking business post sale of Morgan Keegan • Sustainable and improving core profitability • Opportunity for outperformance • Significant credit leverage remaining Strong Funding Profile and Capital Position • Continued growth in low cost core deposit base • Loan to deposit ratio well below historical and peer levels • Attractive liquidity position and funding profile • Capital levels are solid Profitability |
 3 FRANCHISE OVERVIEW • Bank Associates: 23,422 • Assets: $122B • Loans: $76B • Deposits: $95B • Branches: 1,719 • Insurance Offices: 30 • ATMs: 2,063 • Market Cap: $10.1B* *As of August 27, 2012 Business Services › Small and mid-sized C&I lending › Commercial Real Estate › Equipment Finance Consumer Services › Mortgage › Home Equity › Credit Card › Direct Lending › Indirect Auto Wealth Management › Institutional Services › Private Wealth Management › Investment Services › Insurance Ranked 4th or Better in Market Share Targeted Growth Areas |
 4 DOING THE RIGHT THING We believe being a responsible bank means being an integral part of our communities. Community Service Housing Assistance Disaster Response Policy › Regions associates volunteered for nearly 5,300 community service activities in first-half 2012 › Included teaching 3,300-plus financial education classes › Impacted students at all levels, potential first-time homebuyers, small business owners › Significant increase over previous years due to company-wide emphasis on service › Regions Customer Assistance Program (CAP) has helped more than 45,000 homeowners restructure $3.9 billion in mortgages, keeping people in their homes after job loss, natural disasters and other setbacks › Regions foreclosure rate remains well below industry average › Regions promotes affordable housing by investing in Low Income Housing Tax Credits › Assistance can include: › Penalty free withdrawals on CDs › Personal and business loan deferral › Up to 3 months payment forbearance/extensions for all Consumer Loan/Line Products › ATM fees waived › NSF/OD Fees waived › Mobile ATM available for deployment |
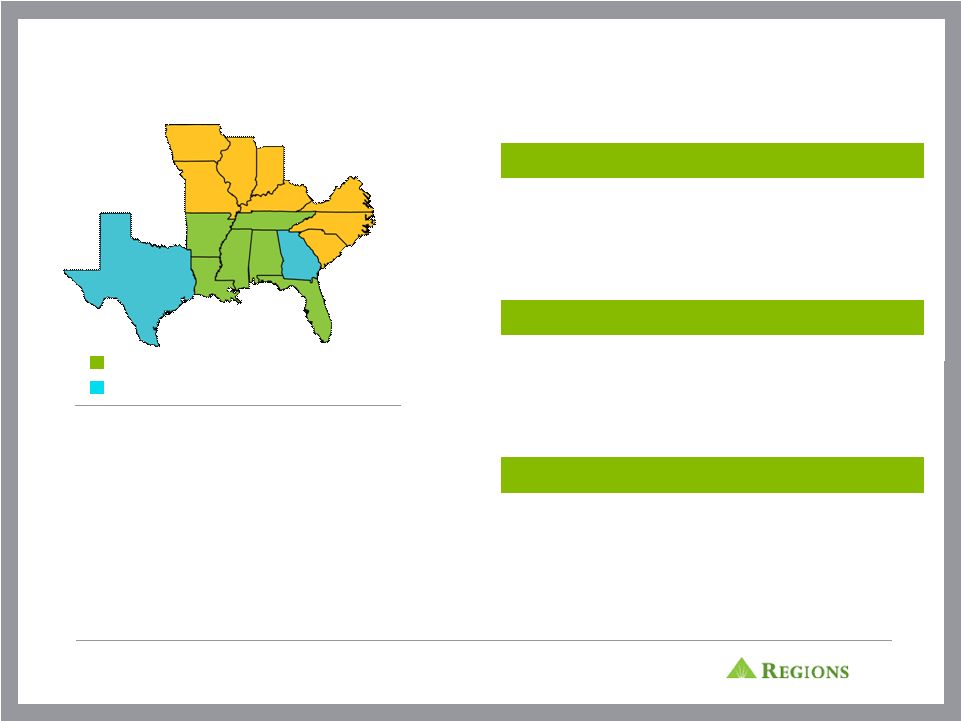
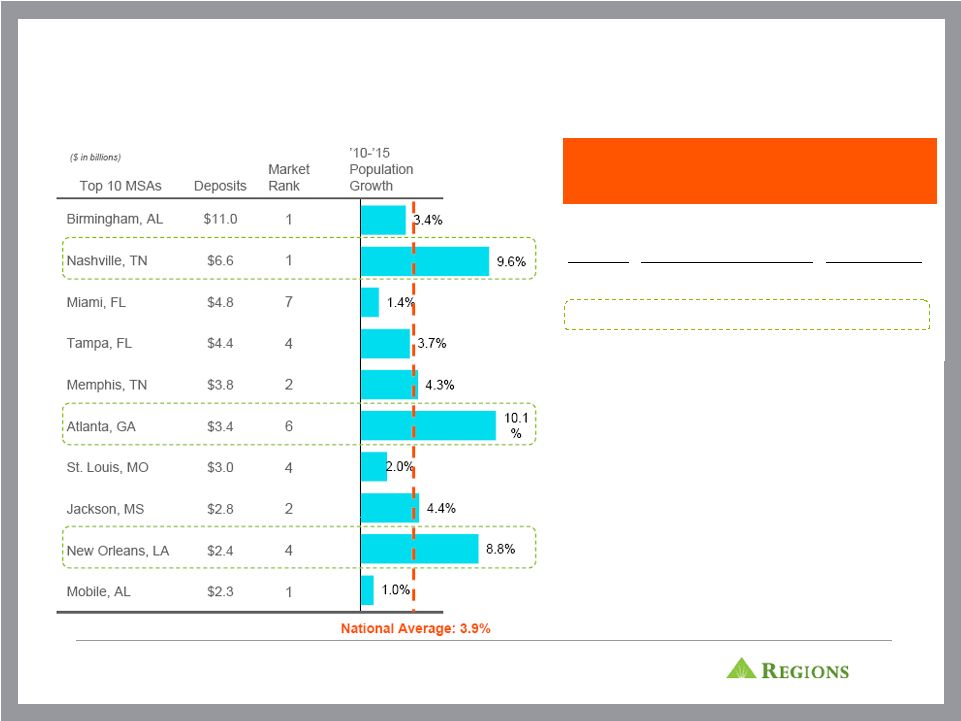 5 REGIONS’ FOOTPRINT IS CHARACTERIZED BY EITHER HIGH MARKET SHARE, HIGH GROWTH MARKETS OR BOTH Source: SNL Financial Note: Core Markets include AL, FL, LA, MS, AR, TN Weighted Average Deposit Market Share in Regions’ Core Markets Rank Name Market Share 1 Bank of America 11.5% 2 Regions 9.8% 3 Wells Fargo 9.4% 4 SunTrust 6.9% 5 JPMorgan Chase 3.3% 6 BB&T 2.5% 7 Capital One 2.3% 8 First Horizon 2.0% 9 Hancock 1.9% 10 PNC 1.4% |
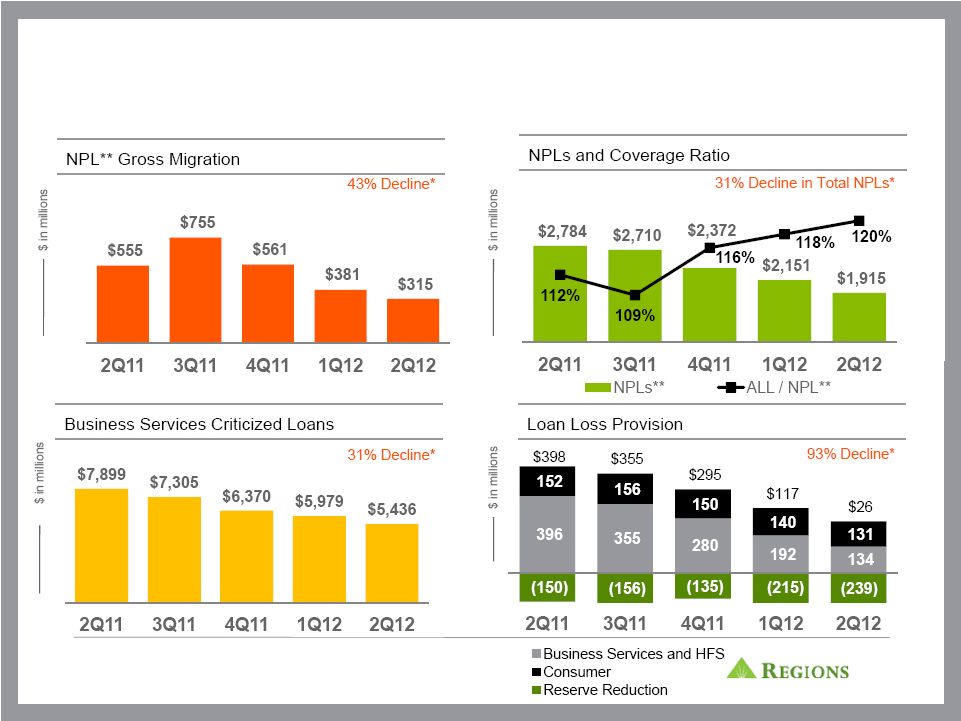 6 CONTINUED MOMENTUM IN ASSET QUALITY METRICS *Year-over-year change **Excludes loans held for sale |
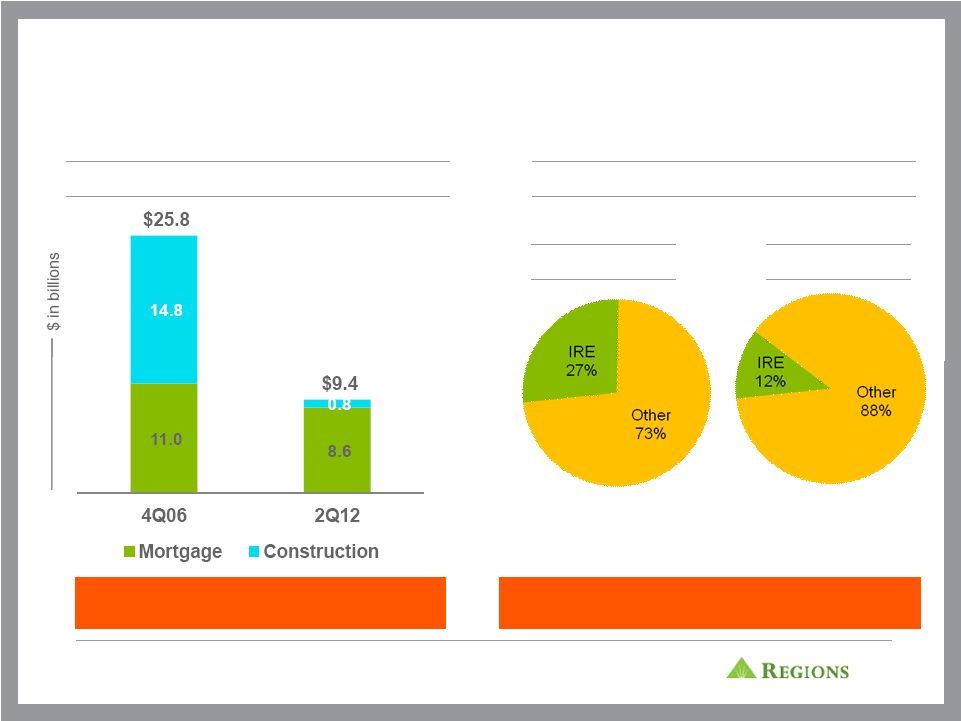 7 SIGNIFICANT REDUCTION IN HIGH RISK LOAN PORTFOLIOS Total Investor Real Estate Investor Real Estate as % of Total Loans Reduced Investor Real Estate $16.4 B or 64% since 4Q06 Investor Real Estate as a % of total loans has decreased since 4Q06 4Q06 2Q12 |
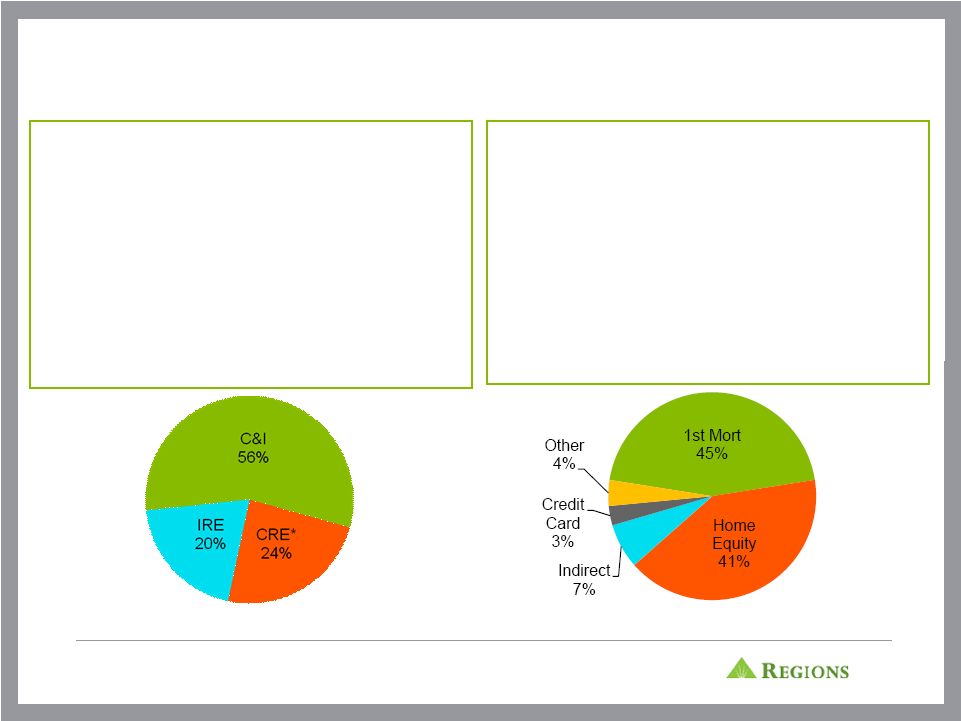 8 RENEWED FOCUS ON C&I AND CONSUMER LENDING BUSINESS SERVICES • 61% of Total Loan Portfolio • Focused on middle market and small business • Broad based middle-market commercial loan growth across footprint and industries • Driven by specialized industries, including healthcare, franchise restaurant, energy, transportation, as well as technology and defense CONSUMER SERVICES • 39% of Total Loan Portfolio • Consumer loan growth will be fueled by new businesses as well as growth in existing businesses • Mortgage loan production totaled $2.1 billion in 2Q • Non-real estate consumer portfolio has increased 3% YoY • $1B Regions-branded credit card portfolio now serviced in- house • Indirect auto lending grew 21% YoY 2Q12 Business Services Loans: $46B 2Q12 Consumer Services Loans: $30B * Includes commercial real estate owner occupied loans |
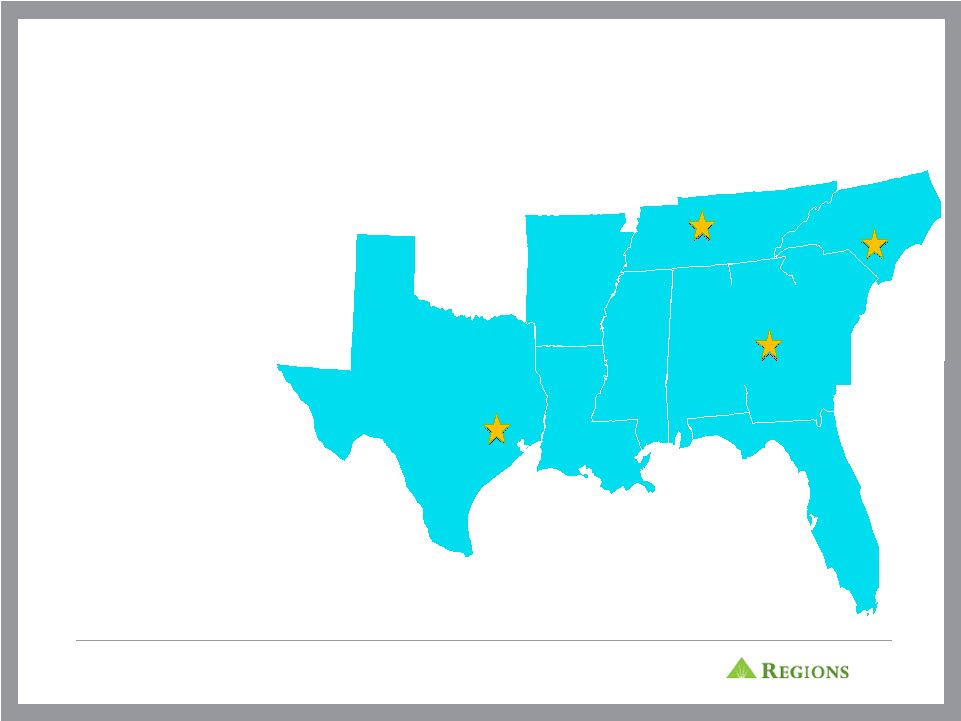 9 • Specialized lending groups are headquartered throughout our footprint • Our goal is to be the premier corporate middle market bank for the specialized industries we serve • Experienced positive year over year growth in all industries BUSINESS SERVICES FOCUSED ON SPECIALIZED INDUSTRIES Transportation Restaurant Healthcare Technology/Defense Energy (Houston) (Atlanta) (Charlotte) (Nashville) |
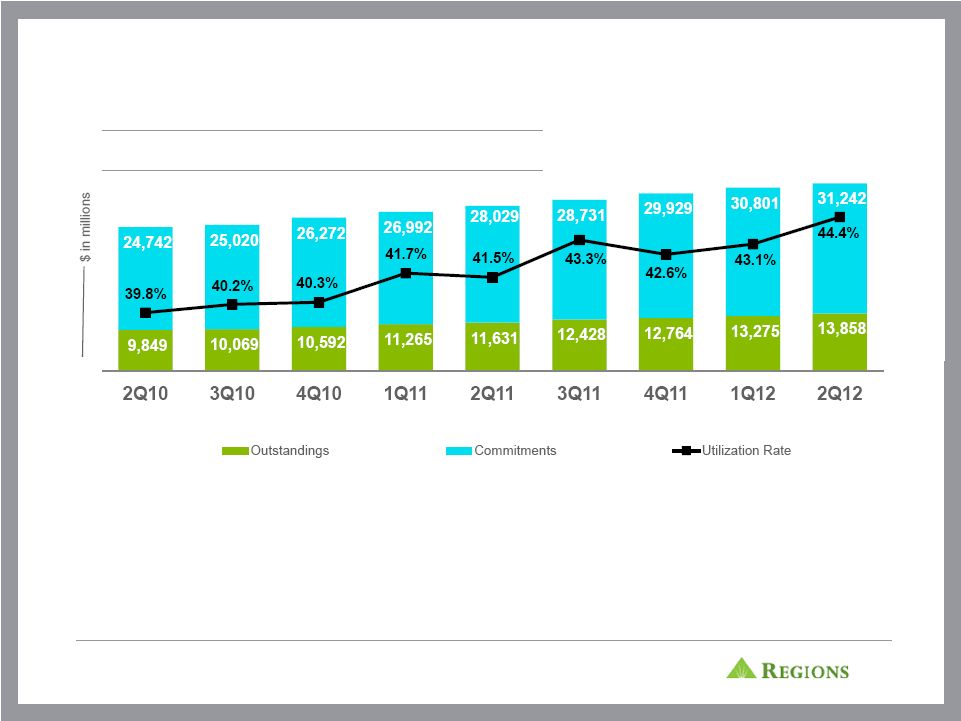 10 LOAN COMMITMENTS AND UTILIZATION INCREASE Commitments and Outstandings • Commercial & industrial line utilization rose 130 basis points linked quarter to 44.4% • Commitments increased $3.2 billion since last year to $31.2 billion • Commercial & industrial loan balances on an average basis increased $902 million, or 4% linked quarter reflecting strength in our middle market portfolio |
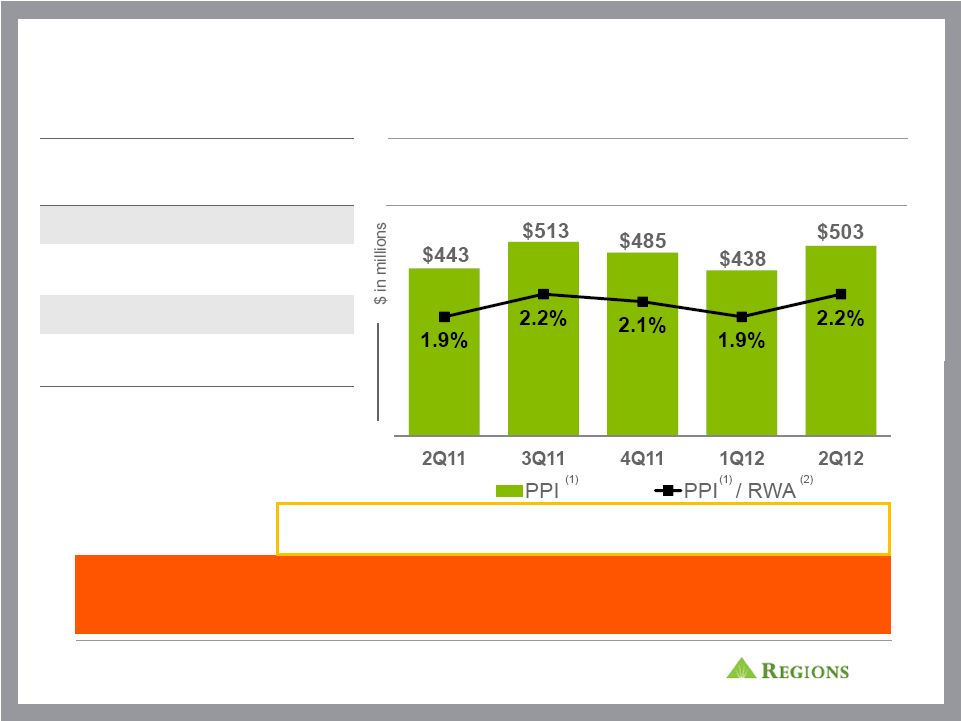 11 2Q12 FINANCIAL HIGHLIGHTS Adjusted Pre-tax Pre-provision Income from Continuing Operations (1) Loan Loss Provision $398 $355 $295 $117 $26 (1) Non-GAAP - See GAAP to non-GAAP reconciliation in appendix, excludes goodwill only (2) Annualized With each passing quarter, we are better positioned for ultimate outperformance. 2Q12 Financial Results Net Income $284MM Income from continuing operations $351MM EPS $0.20 Impact of Series A Preferred Stock (1) $0.05 |
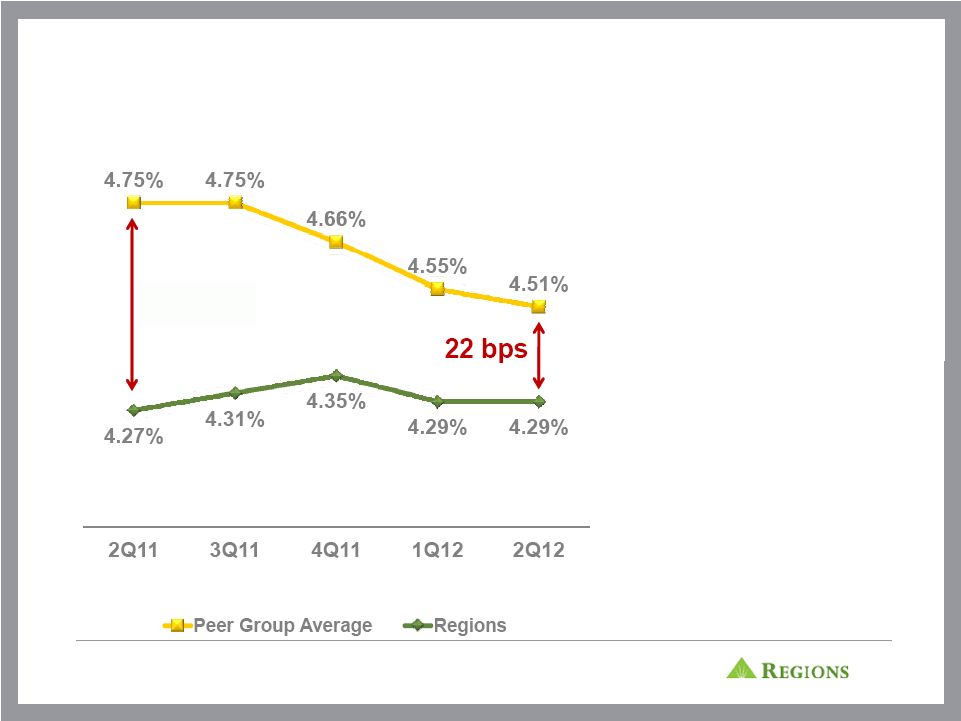 12 CLOSING THE GAP ON LOAN YIELDS • Commercial & industrial loan balances on an average basis increased 4% linked quarter reflecting strength in our middle market portfolio • Commercial & industrial line utilization rose 130 basis points to 44.4% • Loan yield remained flat linked quarter despite the low rate environment Note: Peer banks include BBT, CMA, FHN, FITB, HBAN, KEY, MTB, PNC, STI, USB, WFC, ZION 48 bps |
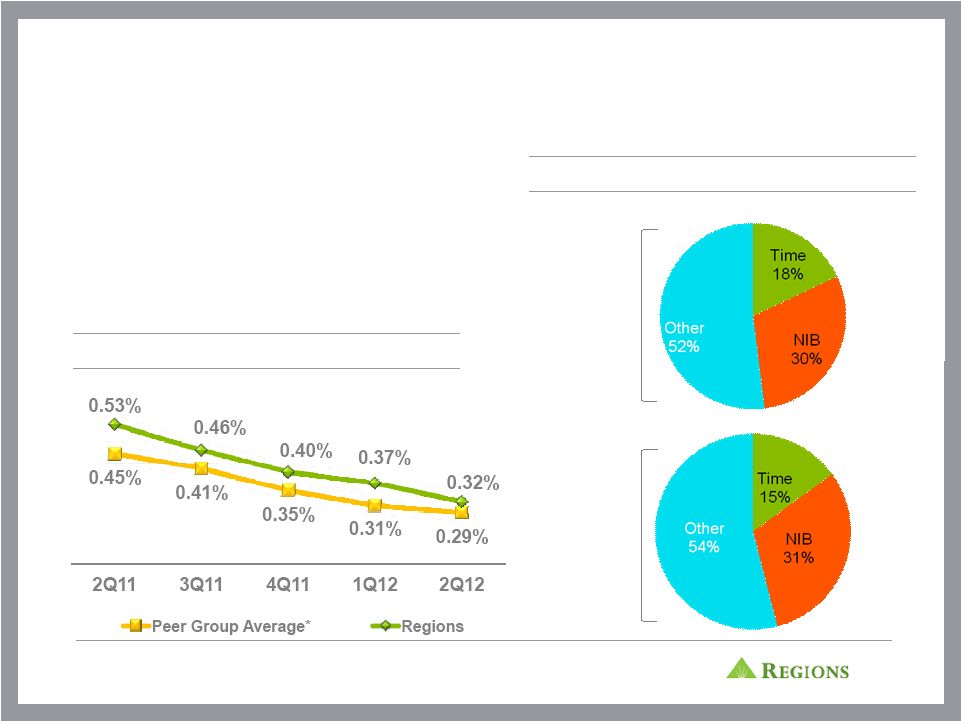 13 MIX AND COST OF DEPOSITS PROVIDE FURTHER OPPORTUNITY TO LOWER DEPOSIT COSTS AND IMPROVE MARGIN Deposit Mix Compared to Peers* Regions Peer Average *Average basis for 2Q12 Source: SNL Financial: Peer banks include BBT, CMA, FHN, FITB, HBAN, KEY, MTB, PNC, STI, USB, WFC, ZION • Deposit repricing opportunities remain, maturities include: • 3Q12 - $2.9B at 1.2% • 4Q12 - $3.0B at 2.1% • 1H13 - $4.6B at 1.8% • 2H13 - $1.9B at 0.8% Deposit Cost Opportunity Gap |
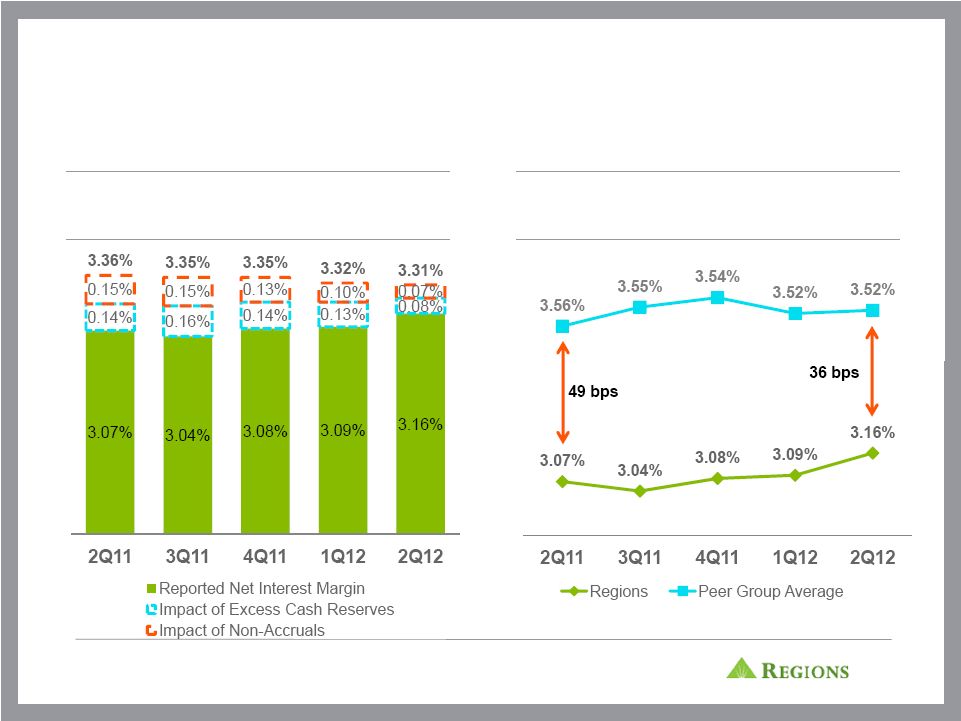 14 FUNDING MIX AND DEPLOYMENT OF CASH RESERVES HAVE AIDED NET INTEREST MARGIN AND CLOSING THE GAP TO PEERS Impact of Excess Cash Reserves & Non- Accruals on NIM* Regions has closed a portion of its gap vs. peers in the last 5 quarters * From continuing operations Source: SNL Financial: Peer banks include BBT, CMA, FHN, FITB, HBAN, KEY, MTB, PNC, STI, USB, WFC, ZION |
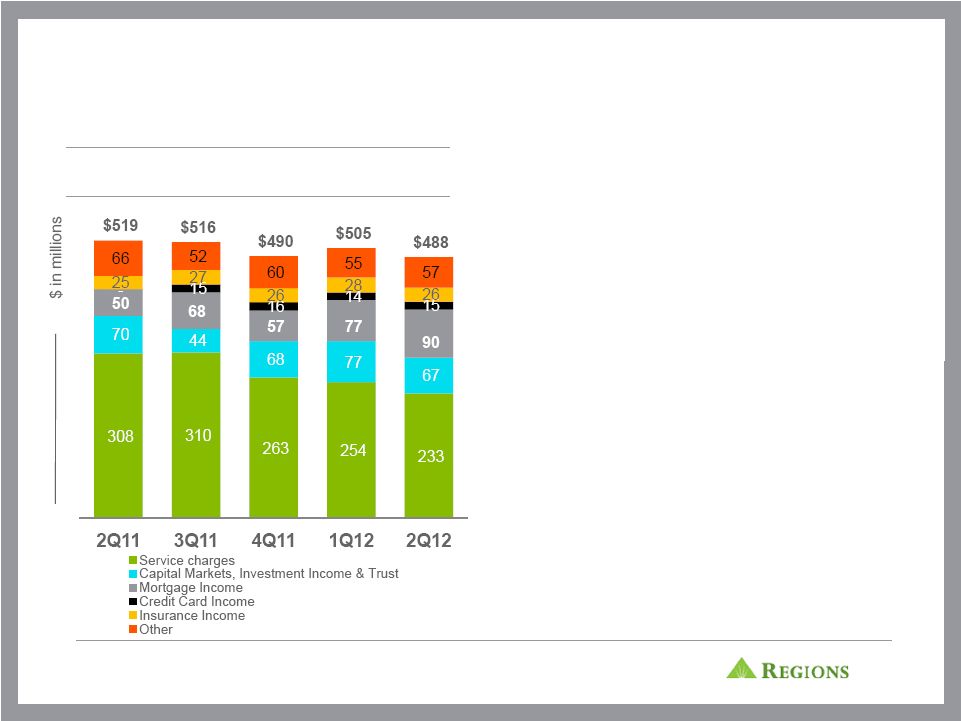 15 MORTGAGE INCOME INCREASED 17% LINKED QUARTER • Non-interest (1) revenue decreased 3% linked quarter • Mortgage revenues increased 17% linked quarter and 80% over last year • HARP II expected to increase mortgage volume by $1 billion in 2012 • Service charges declined linked quarter due to the establishment of a reserve for certain customer fee refunds resulting from a change in the company’s non- sufficient funds policy Fee Income by Quarter (1) From continuing operations adjusted to exclude security gains and leveraged lease terminations gains–Non-GAAP, see appendix for GAAP to Non-GAAP reconciliation 1 |
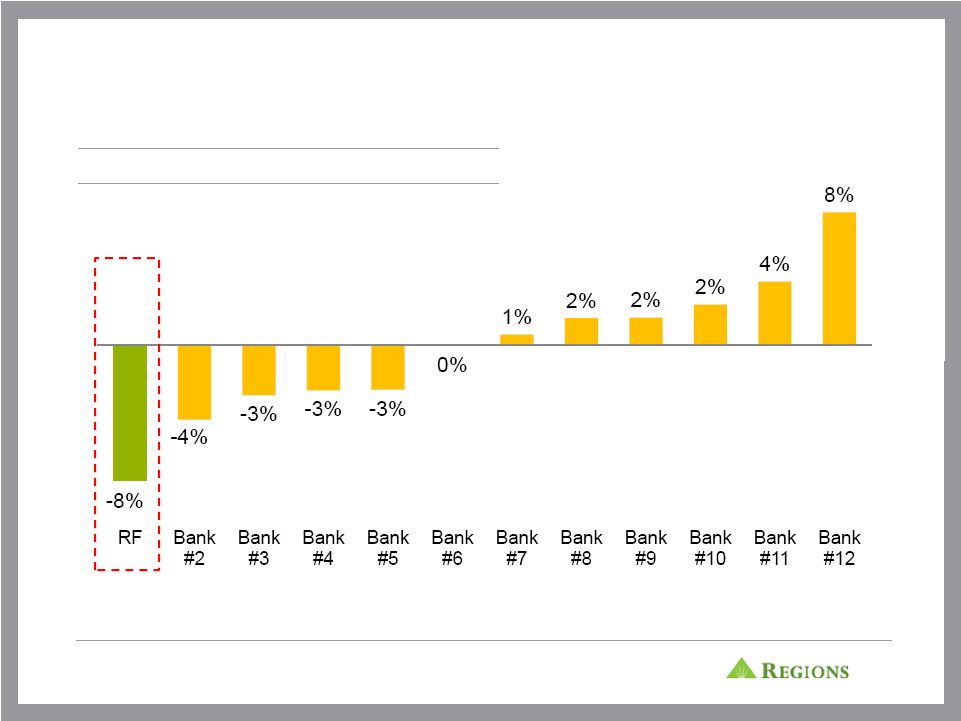 16 OUTPACED PEERS IN EXPENSE REDUCTION IN 2Q12 •Adjusted to exclude non-core items Source: SNL Financial: Peer banks include BBT, CMA, FITB, HBAN, KEY, MTB, PNC, STI, USB, WFC, ZION Change in Non-Interest Expense* 2Q12 vs 1Q12 |
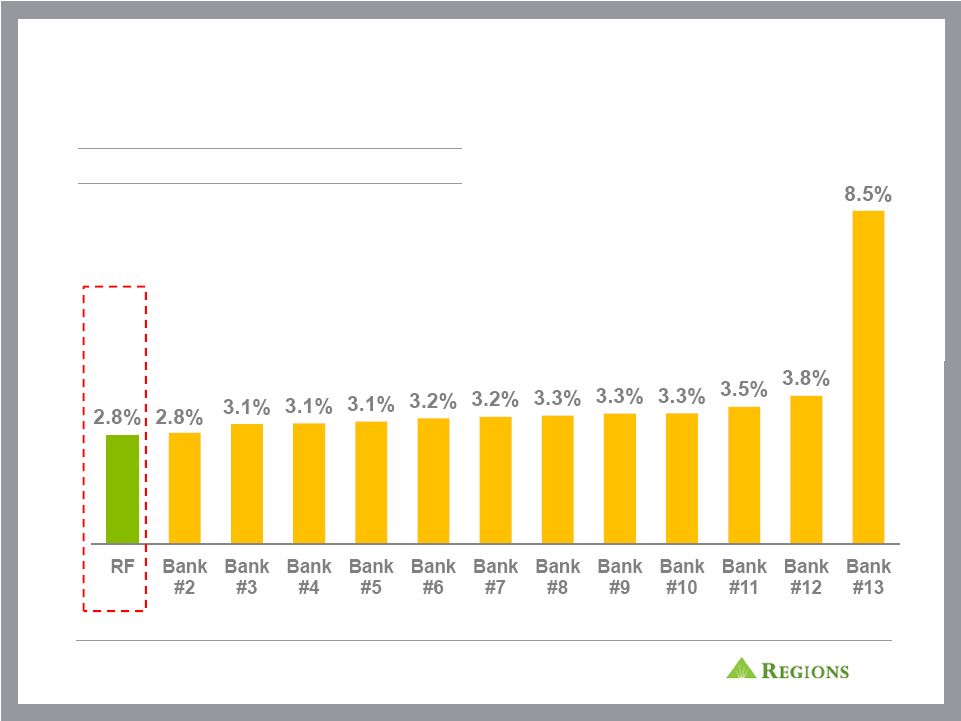 17 REGIONS HAS THE LOWEST EXPENSE TO ASSETS RATIO * Adjusted to exclude non-core items, ratios are annualized Source: SNL Financial: Peer banks include BBT, CMA, FHN, FITB, HBAN, KEY, MTB, PNC, STI, USB, WFC, ZION Non-Interest Expense* / Average Assets |
 18 STRONG FUNDING PROFILE AND LIQUIDITY POSITION Source: SNL Financial - Peers include BBT, CMA, FHN, FITB, HBAN, KEY, MTB, PNC, STI, USB, WFC, ZION *Based on ending balances (1) Non-GAAP – See appendix for reconciliation (2) Includes Series A Preferred Stock and associated warrant |
 19 OPPORTUNITY FOR OUTPERFORMANCE REVENUE EXPENSES CREDIT • Tangible opportunity to close peer margin gap • Over $12.4 billion of deposit repricing through 2H13 • Lower liquidity costs • Reduction of non-accruals • Continued momentum in C&I and Consumer lending • Development of new products and services • Ongoing expense initiatives • Anticipating reduced credit related / OREO expenses • Solid reserve position • Reduced provisions with continued credit improvement • Positioned for increased future capital return CAPITAL |
 20 APPENDIX |
 21 FORWARD-LOOKING STATEMENTS ›Regions’ ability to receive dividends from its subsidiaries. ›The effects of the failure of any component of Regions’ business infrastructure which is provided by a third party. ›Changes in accounting policies or procedures as may be required by the Financial Accounting Standards Board or other regulatory agencies. >The effects of any damage to Regions reputation resulting from developments related to any of the items identified above ›The foregoing list of factors is not exhaustive. For discussion of these and other factors that may cause actual results to differ from expectations, look under the captions “Forward-Looking Statements” and “Risk Factors” in Regions’ Annual Report on Form 10-K for the year ended December 31, 2011 and the "Foward-Looking Statements" section of Regions' Quarterly Reports on Form 10-Q for the quarters ended March 31, and June 30, 2012. ›The words "believe," "expect," "anticipate," "project," and similar expressions often signify forward-looking statements. You should not place undue reliance on any forward-looking statements, which speak only as of the date made. We assume no obligation to update or revise any forward-looking statements that are made from time to time. ›Possible changes in consumer and business spending and saving habits could affect Regions' ability to increase assets and to attract deposits. ›The effects of weather and natural disasters such as floods, droughts, wind, tornados and hurricanes, and the effects of man-made disasters. ›Possible downgrades in ratings issued by rating agencies. ›Possible changes in the speed of loan prepayments by Regions’ customers and loan origination or sales volumes. ›Possible acceleration of prepayments on mortgage-backed securities due to low interest rates and the related acceleration of premium amortization on those securities. ›The effects of problems encountered by larger or similar financial institutions that adversely affect Regions or the banking industry generally. ›Regions' ability to keep pace with technological changes. ›Regions' ability to effectively manage credit risk, interest rate risk, market risk, operational risk, legal risk, liquidity risk, reputational risk, and regulatory and compliance risk. ›Regions’ ability to ensure adequate capitalization which is impacted by inherent uncertainties in forecasting credit losses. ›The cost and other effects of material contingencies, including litigation contingencies, and any adverse judicial, administrative or arbitral rulings or proceedings. ›The effects of increased competition from both banks and non-banks. ›The effects of geopolitical instability and risks such as terrorist attacks. ›Possible changes in trade, monetary and fiscal policies, laws and regulations and other activities of governments, agencies, and similar organizations, may have an adverse effect on business. >Possible regulations issued by the Consumer Financial Protection Bureau or other regulators which might adversely impact Regions' business model or products and services. ›Possible stresses in the financial and real estate markets, including possible continued deterioration in property values. ›Regions' ability to manage fluctuations in the value of assets and liabilities and off-balance sheet exposure so as to maintain sufficient capital and liquidity to support Regions' business. ›Regions' ability to expand into new markets and to maintain profit margins in the face of competitive pressures. ›Regions' ability to develop competitive new products and services in a timely manner and the acceptance of such products and services by Regions' customers and potential customers. ›The Dodd-Frank Wall Street Reform and Consumer Protection Act (the “Dodd-Frank Act”)became law in July 2010, and a number of legislative, regulatory and tax proposals remain pending. Additionally, the U.S. Treasury Department and federal banking regulators continue to implement, but are also beginning to wind down, a number of programs to address capital and liquidity in the banking system. Future and proposed rules, including those that are part of the Basel III process, are expected to require banking institutions to increase levels of capital. All of the foregoing may have significant effects on Regions and the financial services industry, the exact nature and extent of which cannot be determined at this time. ›Possible additional loan losses, impairment of goodwill and other intangibles, and adjustment of valuation allowances on deferred tax assets and the impact on earnings and capital. ›Possible changes in interest rates may increase funding costs and reduce earning asset yields, thus reducing margins. Increases in benchmark interest rates would also increase debt service requirements for customers whose terms include a variable interest rate, which may negatively impact the ability of borrowers to pay as contractually obligated. ›Possible changes in general economic and business conditions in the United States in general and in the communities Regions serves in particular, including any prolonging or worsening of the current unfavorable economic conditions including unemployment levels. ›Possible changes in the creditworthiness of customers and the possible impairment of the collectability of loans. |
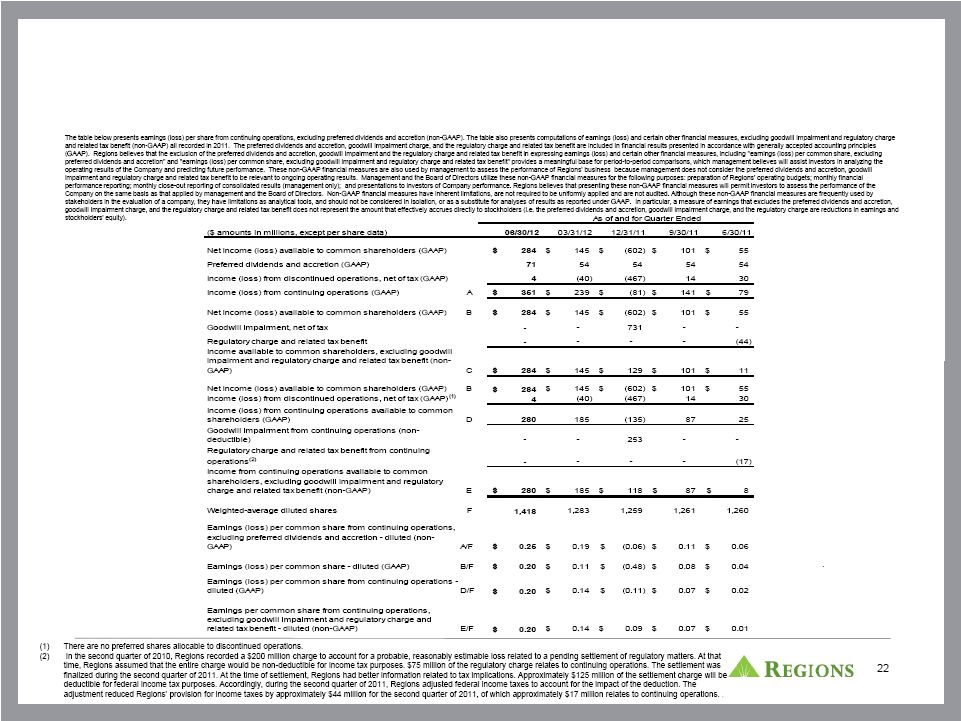 NON-GAAP RECONCILIATION: NET INCOME / (LOSS) AND EARNINGS PER SHARE ` (1) |
 23 NON-GAAP RECONCILIATION: PRE-TAX PRE-PROVISION INCOME The Pre-Tax Pre-Provision Income from Continuing Operations table below presents computations of pre-tax pre-provision income from continuing operations excluding certain adjustments (non-GAAP). Regions believes that the exclusion of these adjustments provides a meaningful base for period-to-period comparisons, which management believes will assist investors in analyzing the operating results of the Company and predicting future performance. These non-GAAP financial measures are also used by management to assess the performance of Regions' business. It is possible that the activities related to the adjustments may recur; however, management does not consider the activities related to the adjustments to be indications of ongoing operations. Regions believes that presentation of these non-GAAP financial measures will permit investors to assess the performance of the Company on the same basis as that applied by management. Non-GAAP financial measures have inherent limitations, are not required to be uniformly applied and are not audited. Although these non-GAAP financial measures are frequently used by stakeholders in the evaluation of a company, they have limitations as analytical tools, and should not be considered in isolation, or as a substitute for analyses of results as reported under GAAP. In particular, a measure of income that excludes certain adjustments does not represent the amount that effectively accrues directly to stockholders. (1) After tax amounts for leveraged lease terminations gains are $0.6 million for 6/30/2012, $3.1 million for 3/31/2012, $2.8 million for 12/31/11 and $5.4 million for 9/30/11. ($ amounts in millions) 6/30/12 3/31/12 12/31/11 9/30/11 6/30/11 common shareholders (GAAP) 280 $ 185 $ (135) $ 87 $ 25 $ 95 $ 51.4% 255 $ NM 71 54 54 54 54 17 31.5% 17 31.5% 126 82 18 17 (34) 44 53.7% 160 NM taxes (GAAP) 477 321 (63) 158 45 156 48.6% 432 NM 26 117 295 355 398 (91) -77.8% (372) -93.5% (non-GAAP) 503 438 232 513 443 65 14.8% 60 13.5% - - 253 - - - - - - excluding goodwill impairment (non-GAAP) 503 438 485 513 443 65 14.8% 60 13.5% Income (loss) from continuing operations before income Provision for loan losses (GAAP) Pre-tax pre-provision income from continuing operations Pre-tax pre-provision income from continuing operations, Goodwill impairment Quarter Ended 2Q12 vs. 1Q12 2Q12 vs. 2Q11 Income (loss) from continuing operations available to Preferred dividends (GAAP) Income tax expense (benefit) (GAAP) |
 24 NON-GAAP RECONCILIATION: FEE INCOME RATIOS AND EFFICIENCY RATIOS ($ amounts in millions) 6/30/12 3/31/12 12/31/11 9/30/11 6/30/11 Continuing Operations Non-interest expense (GAAP) 842 $ 913 $ 1,124 $ 850 $ 956 $ Adjustments: Securities impairment, net (2) - (2) - - Branch consolidation and property and equipment charges - - 2 - (77) Goodwill impairment - - (253) - - Adjusted non-interest expense (non-GAAP) G 840 $ 913 $ 871 $ 850 $ 879 $ Net interest income, taxable-equivalent basis (GAAP) 850 $ 839 $ 858 $ 859 $ 864 $ Non-interest income (GAAP) 507 $ 524 $ 507 $ 513 $ 543 $ Adjustments: Securities (gains) losses, net (12) (12) (7) 1 (24) Leveraged lease termination (gains) losses, net (7) (7) (10) 2 - Adjusted non-interest income (non-GAAP) H 488 505 490 516 519 Adjusted total revenue (non-GAAP) I 1,338 $ 1,344 $ 1,348 $ 1,375 $ 1,383 $ Fee income ratio (non-GAAP) H/I 36.5% 37.6% 36.4% 37.5% 37.5% Efficiency ratio (non-GAAP) G/I 62.8% 67.9% 64.6% 61.8% 63.6% As of and for Quarter Ended |
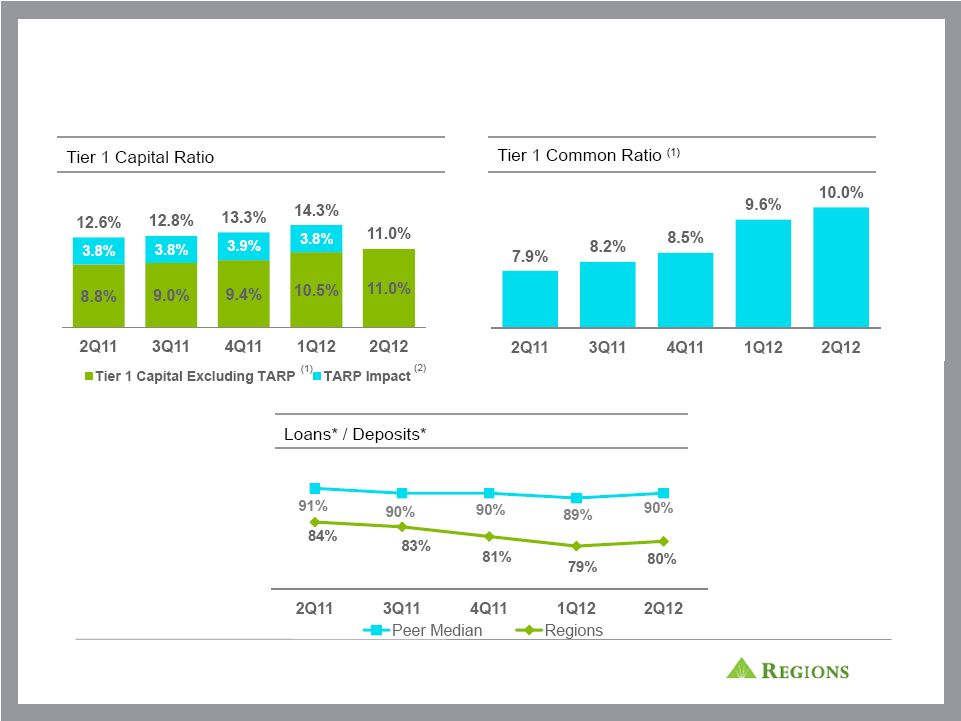
 25 NON-GAAP RECONCILIATION: TIER 1 COMMON ($ amounts in millions, except per share data) 6/30/12 3/31/12 12/31/11 9/30/11 6/30/11 TIER 1 COMMON RISK-BASED RATIO CONSOLIDATED - Stockholders' equity (GAAP) 14,455 $ 17,534 $ 16,499 $ 17,263 $ 16,888 $ Accumulated other comprehensive (income) loss (54) 60 69 (92) 177 Non-qualifying goodwill and intangibles (4,852) (4,881) (4,900) (5,649) (5,668) Disallowed deferred tax assets (336) (345) (432) (506) (498) Disallowed servicing assets (33) (36) (35) (35) (35) Qualifying non-controlling interests 92 92 92 92 92 Qualifying trust preferred securities 846 846 846 846 846 Tier 1 capital (regulatory) 10,118 $ 13,270 $ 12,139 $ 11,919 $ 11,802 $ Qualifying non-controlling interests (92) (92) (92) (92) (92) Qualifying trust preferred securities (846) (846) (846) (846) (846) Preferred stock - (3,429) (3,419) (3,409) (3,399) Tier 1 common equity (non-GAAP) O 9,180 $ 8,903 $ 7,782 $ 7,572 $ 7,465 $ Risk-weighted assets (regulatory) P 91,769 92,546 91,449 92,786 93,865 Tier 1 common risk-based ratio (non-GAAP) O/P 10.0% 9.6% 8.5% 8.2% 7.9% As of and for Quarter Ended |
 26 NON-GAAP RECONCILIATION: TIER 1 CAPITAL Regions' Series A preferred stock was repurchased on April 4, 2012 and the warrant to purchase 48.3 million shares of Regions common stock was retired on May 2, 2012. The following table presents the calculations of Tier 1 capital and the Tier 1 capital ratio, adjusted as if the repurchase of the shares and the retirement of the warrant occurred on the last day of the quarter for each prior period presented. The amount retired includes the Series A preferred stock plus the remaining balance of the related discount. ($ amounts in millions) 6/30/12 3/31/12 12/31/11 9/30/11 6/30/11 TIER 1 RISK-BASED RATIO Stockholders' equity 14,455 $ 17,534 $ 16,499 $ 17,263 $ 16,888 $ Accumulated other comprehensive (income) loss (54) 60 69 (92) 177 Non-qualifying goodwill and intangibles (4,852) (4,881) (4,900) (5,649) (5,668) Disallowed deferred tax assets (336) (345) (432) (506) (498) Disallowed servicing assets (33) (36) (35) (35) (35) Qualifying non-controlling interests 92 92 92 92 92 Qualifying trust preferred securities 846 846 846 846 846 Tier 1 capital as reported 10,118 $ 13,270 $ 12,139 $ 11,919 $ 11,802 $ Series A Preferred Stock Retirement (Reduction to Stockholders' equity) - $ (3,500) $ (3,500) $ (3,500) $ (3,500) $ Retirement of warrant to purchase 48.3 million shares of Regions common stock - (45) (45) (45) (45) Tier 1 capital as adjusted to exclude Series A Preferred Stock 10,118 $ 9,725 $ 8,594 $ 8,374 $ 8,257 $ Risk-weighted assets 1 91,769 92,546 91,449 92,786 93,865 Tier 1 capital ratio 11.0% 14.3% 13.3% 12.8% 12.6% Tier 1 capital ratio excluding Series A Preferred Stock and associated warrant 11.0% 10.5% 9.4% 9.0% 8.8% Quarter Ended |
 |