Exhibit 99.3

Regions Financial
3rd Quarter 2012 Earnings Conference Call
October 23, 2012
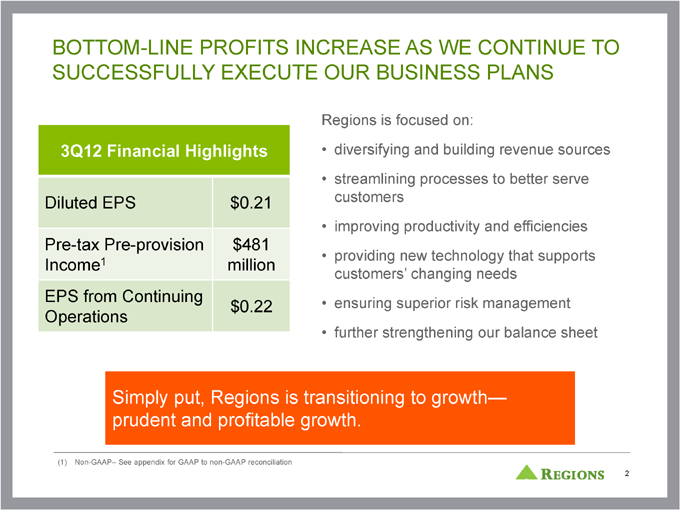
BOTTOM -LINE PROFITS INCREASE AS WE CONTINUE TO SUCCESSFULLY EXECUTE OUR BUSINESS PLANS
3Q12 Financial Highlights
Diluted EPS
$0.21
Pre-tax Pre-provision
$481
Income1
million
EPS from Continuing
Operations
$0.22
Regions is focused on:
diversifying and building revenue sources
streamlining processes to better serve customers
improving productivity and efficiencies
providing new technology that supports customers’ changing needs
ensuring superior risk management
further strengthening our balance sheet
Simply put, Regions is transitioning to growth—prudent and profitable growth.
(1) Non-GAAP– See appendix for GAAP to non-GAAP reconciliation
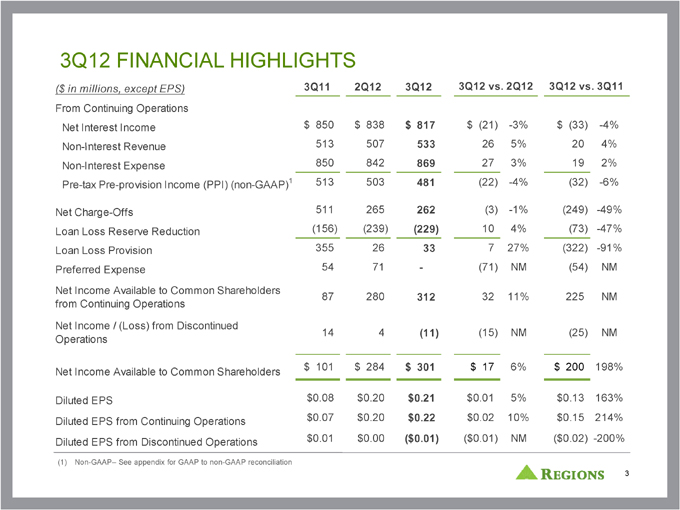
3Q12 FINANCIAL HIGHLIGHTS
($ in millions, except EPS)
3Q11
2Q12
3Q12
3Q12 vs. 2Q12
3Q12 vs. 3Q11
From Continuing Operations
Net Interest Income
$850
$838
$817
$(21)
-3%
$(33)
-4%
Non-Interest Revenue
513
507
533
26
5%
20
4%
Non-Interest Expense
850
842
869
27
3%
19
2%
Pre-tax Pre-provision Income (PPI) (non-GAAP)1
513
503
481
(22)
-4%
(32)
-6%
Net Charge-Offs
511
265
262
(3)
-1%
(249)
-49%
Loan Loss Reserve Reduction
(156)
(239)
(229)
10
4%
(73)
-47%
Loan Loss Provision
355
26
33
7
27%
(322)
-91%
Preferred Expense
54
71
—
(71)
NM
(54)
NM
Net Income Available to Common Shareholders
87
280
312
32
11%
225
NM
from Continuing Operations
Net Income / (Loss) from Discontinued
Operations
14
4
(11)
(15)
NM
(25)
NM
Net Income Available to Common Shareholders
$101
$284
$301
$17
6%
$200
198%
Diluted EPS
$0.08
$0.20
$0.21
$0.01
5%
$0.13
163%
Diluted EPS from Continuing Operations
$0.07
$0.20
$0.22
$0.02
10%
$0.15
214%
Diluted EPS from Discontinued Operations
$0.01
$0.00
($0.01)
($0.01)
NM
($0.02)
-200%
(1) Non-GAAP– See appendix for GAAP to non-GAAP reconciliation
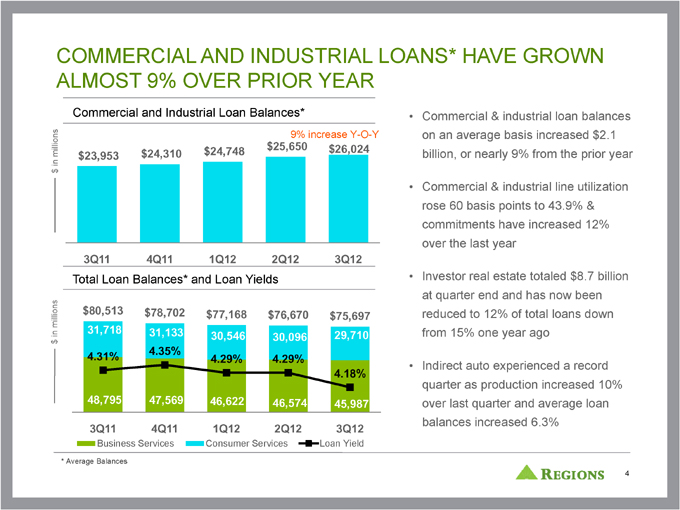
COMMERCIAL AND INDUSTRIAL LOANS* HAVE GROWN ALMOST 9% OVER PRIOR YEAR
Commercial & industrial loan balances on an average basis increased $2.1 billion, or nearly 9% from the prior year
Commercial & industrial line utilization rose 60 basis points to 43.9% & commitments have increased 12% over the last year
Investor real estate totaled $8.7 billion at quarter end and has now been reduced to 12% of total loans down from 15% one year ago
Indirect auto experienced a record quarter as production increased 10% over last quarter and average loan balances increased 6.3%
* Average Balances
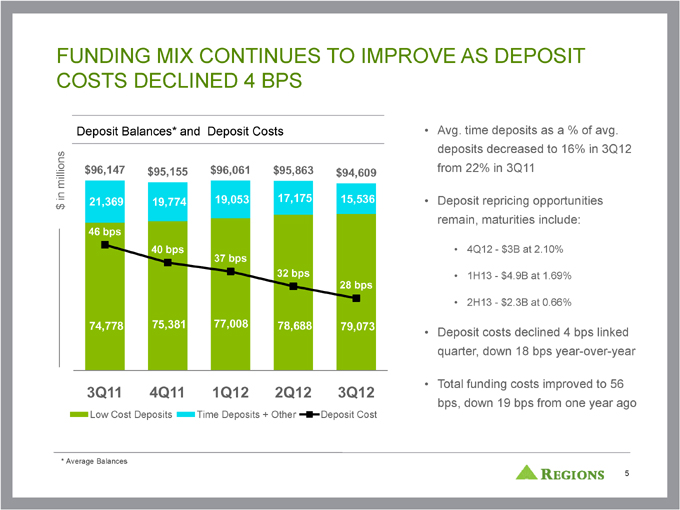
FUNDING MIX CONTINUES TO IMPROVE AS DEPOSIT COSTS DECLINED 4 BPS
Avg. time deposits as a % of avg. deposits decreased to 16% in 3Q12 from 22% in 3Q11
Deposit repricing opportunities remain, maturities include:
4Q12—$3B at 2.10%
1H13—$4.9B at 1.69%
2H13—$2.3B at 0.66%
Deposit costs declined 4 bps linked quarter, down 18 bps year-over-year
Total funding costs improved to 56 bps, down 19 bps from one year ago
* Average Balances
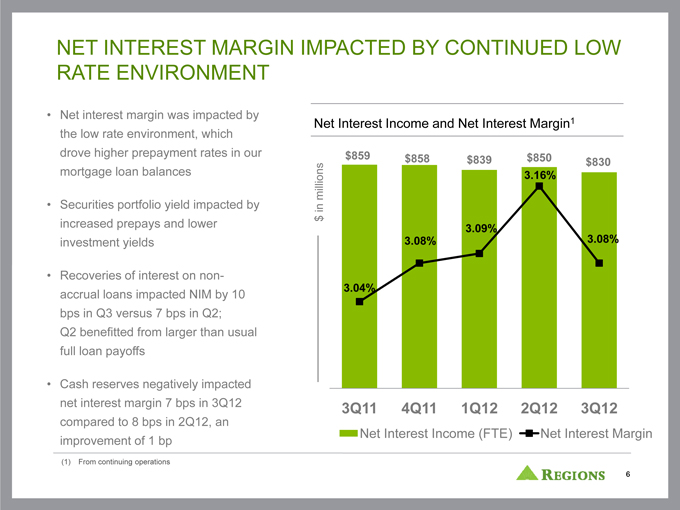
NET INTEREST MARGIN IMPACTED BY CONTINUED LOW RATE ENVIRONMENT
• Net interest margin was impacted by the low rate environment, which drove higher prepayment rates in our mortgage loan balances
• Securities portfolio yield impacted by increased prepays and lower investment yields
• Recoveries of interest on non-accrual loans impacted NIM by 10 bps in Q3 versus 7 bps in Q2; Q2 benefitted from larger than usual full loan payoffs
• Cash reserves negatively impacted net interest margin 7 bps in 3Q12 compared to 8 bps in 2Q12, an improvement of 1 bp
Net Interest Income and Net Interest Margin1
$ in millions
$859 $858 $839 $850 $830
3.16%
3.09%
3.08% 3.08%
3.04%
3Q11 4Q11 1Q12 2Q12 3Q12
Net Interest Income (FTE)
Net Interest Margin
(1) From continuing operations
REGIONS
6
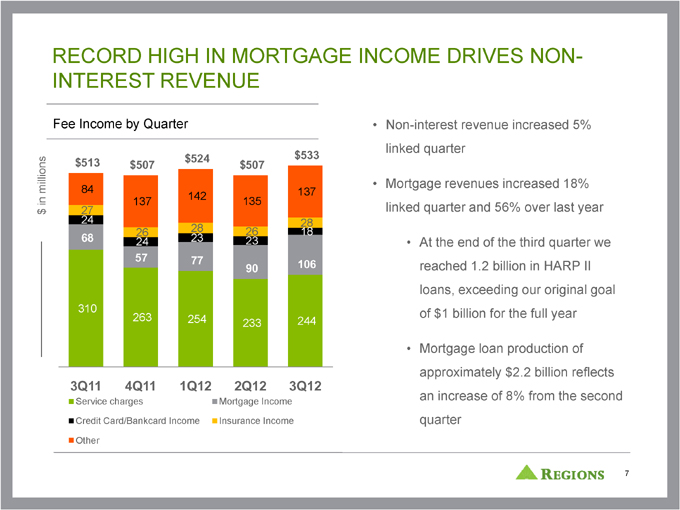
RECORD HIGH IN MORTGAGE INCOME DRIVES NON-INTEREST REVENUE
Non-interest revenue increased 5% linked quarter
Mortgage revenues increased 18% linked quarter and 56% over last year
At the end of the third quarter we reached 1.2 billion in HARP II loans, exceeding our original goal of $1 billion for the full year
Mortgage loan production of approximately $2.2 billion reflects an increase of 8% from the second quarter
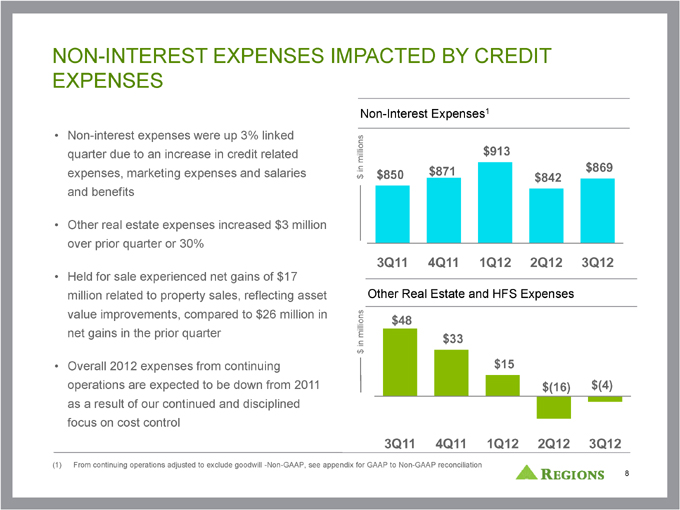
NON-INTEREST EXPENSES IMPACTED BY CREDIT EXPENSES
Non-interest expenses were up 3% linked quarter due to an increase in credit related expenses, marketing expenses and salaries and benefits
Other real estate expenses increased $3 million over prior quarter or 30%
Held for sale experienced net gains of $17 million related to property sales, reflecting asset value improvements, compared to $26 million in net gains in the prior quarter
Overall 2012 expenses from continuing operations are expected to be down from 2011 as a result of our continued and disciplined focus on cost control
(1) From continuing operations adjusted to exclude goodwill -Non-GAAP, see appendix for GAAP to Non-GAAP reconciliation
8
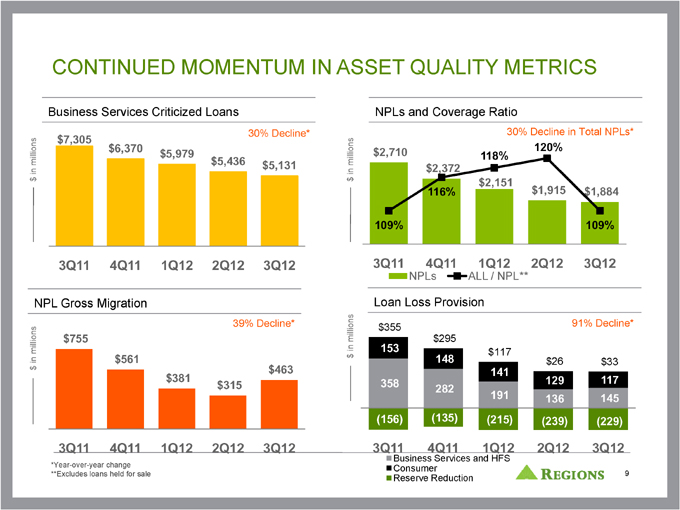
CONTINUED MOMENTUM IN ASSET QUALITY METRICS
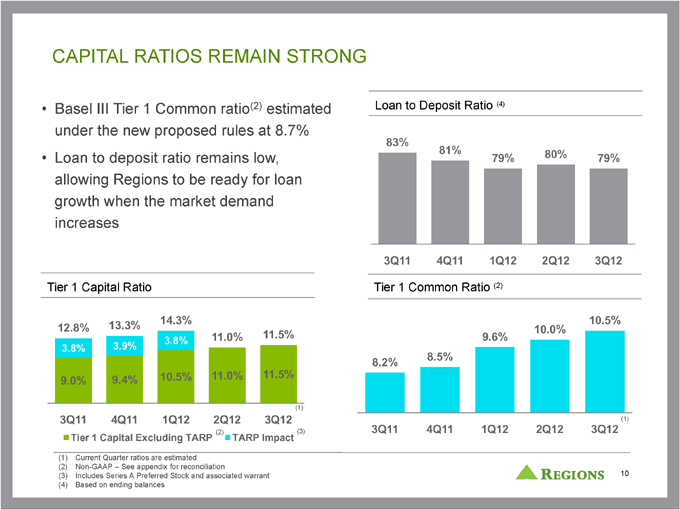
CAPITAL RATIOS REMAIN STRONG
• Basel III Tier 1 Common ratio(2) estimated under the new proposed rules at 8.7%
• Loan to deposit ratio remains low, allowing Regions to be ready for loan growth when the market demand increases
(1) Current Quarter ratios are estimated
(2) Non-GAAP – See appendix for reconciliation
(3) Includes Series A Preferred Stock and associated warrant
(4) Based on ending balances

APPENDIX
FORWARD-LOOKING STATEMENTS
This presentation may include forward-looking statements which reflect Regions’ current views with respect to future events and financial performance. The Private Securities Litigation Reform Act of 1995 (“ the Act” ) provides a “ safe harbor” for forward-looking statements which are identified as such and are accompanied by the identification of important factors that could cause actual results to differ materially from the forward-looking statements. For these statements, we, together with our subsidiaries, claim the protection afforded by the safe harbor in the Act. Forward-looking statements are not based on historical information, but rather are related to future operations, strategies, financial results or other developments. Forward-looking statements are based on management’s expectations as well as certain assumptions and estimates made by, and information available to, management at the time the statements are made. Those statements are based on general assumptions and are subject to various risks, uncertainties and other factors that may cause actual results to differ materially from the views, beliefs and projections expressed in such statements. These risks, uncertainties and other factors include, but are not limited to, those described below:
The Dodd-Frank Wall Street Reform and Consumer Protection Act (the “ Dodd-Frank Act” )became law in July 2010, and a number of legislative, regulatory and tax proposals remain pending. Additionally, the U.S. Treasury Department and federal banking regulators continue to implement, but are also beginning to windnd down, a numberumbe of programs to addressddre capital and liquiditliquidity in the banking system. Futurere and pro popo sed rules, includinging thoho se that are part of thehe Basel III process are expected to require banking institutions to increase levels of capital. All of the foregoing may have significant effects on Regions and the financial services industry, the exact nature and extent of which cannot be determined at this time.
Possible additional loan losses, impairment of goodwill and other intangibles, and adjustment of valuation allowances on deferred tax assets and the impact on earnings and capital.
Possible changes in interest rates may increase funding costs and reduce earning asset yields, thus reducing margins. Increases in benchmark interest rates would also increase debt service requirements for customers whose terms include a variable interest rate, which may negatively impact the ability of borrowers to pay as contractually obligated.
Possible changes in general economic and business conditions in the United States in general and in the communities Regions serves in particular, including any prolonging or worsening of the current unfavorable economic conditions including unemployment levels.
Possible changes in the creditworthiness of customers and the possible impairment of the collectability of loans.
Possible changes in trade, monetary and fiscal policies, laws and regulations and other activities of governments, agencies, and similar organizations, may have an adverse effect on business.
› Possible regulations issued by the Consumer Financial Protection Bureau or other regulators which might adversely impact Regions’ business model or products and services.
Possible stresses in the financial and real estate markets, including possible continued deterioration in property values.
Regions’ ability to manage fluctuations in the value of assets and liabilities and off-balance sheet exposure so as to maintain sufficient capital and liquidity to support Regions’ business.
Regions’ ability to expand into new markets and to maintain profit margins in the face of competitive pressures.
Regions’ ability to develop competitive new products and services in a timely manner and the acceptance of such products and services by Regions’ customers and potential customers.
Regions’ ability to keep pace with technological changes.
Regions’ ability to effectively manage credit risk, interest rate risk, market risk, operational risk, legal risk, liquidity risk, reputational risk, and regulatory and compliance risk.
Regions’ ability to ensure adequate capitalization which is impacted by inherent uncertainties in forecasting credit losses.
The cost and other effects of material contingencies, including litigation contingencies, and any adverse judicial, administrative or arbitral rulings or
The effects of increased competition from both banks and non-banks.
The effects of geopolitical instability and risks such as terrorist attacks.
Possible changes in consumer and business spending and saving habits could affect Regions’ ability to increase assets and to attract deposits.
The effects of weather and natural disasters such as floods, droughts, wind, tornados and hurricanes, and the effects of man-made disasters.
Possible downgrades in ratings issued by rating agencies.
Possible changes in the speed of loan prepayments by Regions’ customers and loan origination or sales volumes.
Possible acceleration of prepayments on mortgage-backed securities due to low interest rates and the related acceleration of premium amortization on those securities.
The effects of problems encountered by larger or similar financial institutions that adversely affect Regions or the banking industry generally.
Regions’ ability to receive dividends from its subsidiaries.
The effects of the failure of any component of Regions’ business infrastructure which is provided by a third party.
Changes in accounting policies or procedures as may be required by the Financial Accounting Standards Board or other regulatory agencies.
The effects of any damage to Regions reputation resulting from developments related to any of the items identified above
The foregoing list of factors is not exhaustive. For discussion of these and other factors that may cause actual results to differ from expectations, look under the captions “ Forward-Looking Statements” and “ Risk Factors” in Regions’ Annual Report on Form 10-K for the year ended December 31, 2011and the “Foward-Looking Statements” section of Regions’ Quarterly Reports on Form 10-Q for the quarters ended M arch 31, 2012 and June 30, 2012.
The words “believe,” “expect,” “anticipate,” “project,” and similar expressions often signify forward-looking statements. You should not place undue reliance on any forward-looking statements, which speak only as of the date made. We assume no obligation to update or revise any forward-looking statements that
aremadefrom timeto time.
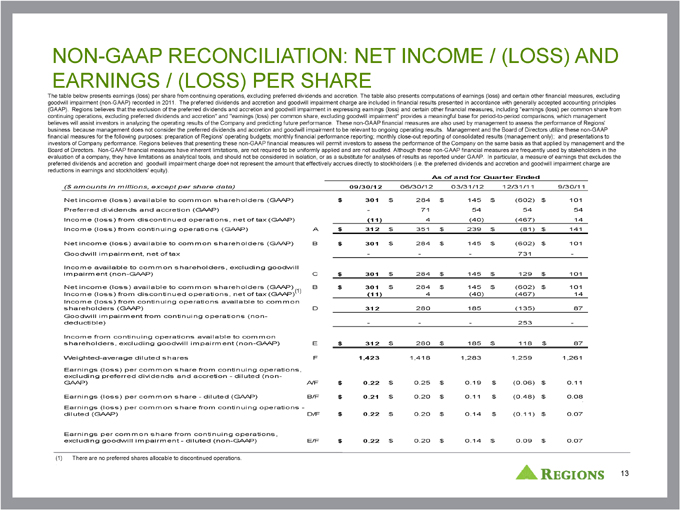
NON -GAAP RECONCILIATION: NET INCOME / (LOSS) AND EARNINGS / (LOSS) PER SHARE
The table below presents earnings (loss) per share from continuing operations, excluding preferred dividends and accretion. The table also presents computations of earnings (loss) and certain other financial measures, excluding goodwill impairment (non-GAAP) recorded in 2011. The preferred dividends and accretion and goodwill impairment charge are included in financial results presented in accordance with generally accepted accounting principles (GAAP) . Regions believes that the exclusion of the preferred dividends and accretion and goodwill impairment in expressing earnings (loss) and certain other financial measures, including “earnings (loss) per common share from continuing operations, excluding preferred dividends and accretion” and “earnings (loss) per common share, excluding goodwill impairment” provides a meaningful base for period-to-period comparisons, which management believes will assist investors in analyzing the operating results of the Company and predicting future performance. These non-GAAP financial measures are also used by management to assess the performance of Regions’ business because management does not consider the preferred dividends and accretion and goodwill impairment to be relevant to ongoing operating results. Management and the Board of Directors utilize these non-GAAP financial measures for the following purposes: preparation of Regions’ operating budgets; monthly financial performance reporting; monthly close-out reporting of consolidated results (management only); and presentations to investors of Company performance. Regions believes that presenting these non-GAAP financial measures will permit investors to assess the performance of the Company on the same basis as that applied by management and the Board of Directors. Non-GAAP financial measures have inherent limitations, are not required to be uniformly applied and are not audited. Although these non-GAAP financial measures are frequently used by stakeholders in the evaluation of a company, they have limitations as analytical tools, and should not be considered in isolation, or as a substitute for analyses of results as reported under GAAP. In particular, a measure of earnings that excludes the preferred dividends and accretion and goodwill impairment charge does not represent the amount that effectively accrues directly to stockholders (i.e. the preferred dividends and accretion and goodwill impairment charge are reductions in earnings and stockholders’ equity).
As of and for Quarter Ended
($ amounts in millions, except per share data)
09/30/12
06/30/12
03/31/12
12/31/11
9/30/11
Net income (loss) available to common shareholders (GAAP)
$301
$284
$145
$(602)
$101
Preferred dividends and accretion (GAAP)
—
71
54
54
54
Income (loss) from discontinued operations, net of tax (GAAP)
(11)
4
(40)
(467)
14
Income (loss) from continuing operations (GAAP)
A
$312
$351
$239
$(81)
$141
Net income (loss) available to common shareholders (GAAP)
B
$301
$284
$145
$(602)
$101
Goodwill impairment, net of tax
—
—
—
731
—
Income available to common shareholders, excluding goodwill
impairment (non-GAAP)
C
$301
$284
$145
$129
$101
Net income (loss) available to common shareholders (GAAP)
B
$301
$284
$145
$(602)
$101
Income (loss) from discontinued operations, net of tax (GAAP)(1)
(11)
4
(40)
(467)
14
Income (loss) from continuing operations available to common
shareholders (GAAP)
D
312
280
185
(135)
87
Goodwill impairment from continuing operations (non-
deductible)
—
—
—
253
—
Income from continuing operations available to common
shareholders, excluding goodwill impairment (non-GAAP)
E
$312
$280
$185
$118
$87
Weighted-average diluted shares
F
1,423
1,418
1,283
1,259
1,261
Earnings (loss) per common share from continuing operations,
excluding preferred dividends and accretion - diluted (non-
GAAP)
A/F
$0.22
$0.25
$0.19
$(0.06)
$0.11
Earnings (loss) per common share - diluted (GAAP)
B/F
$0.21
$0.20
$0.11
$(0.48)
$0.08
`
Earnings (loss) per common share from continuing operations -
diluted (GAAP)
D/F
$0.22
$0.20
$0.14
$(0.11)
$0.07
Earnings per common share from continuing operations,
excluding goodwill impairment - diluted (non-GAAP)
E/F
$0.22
$0.20
$0.14
$0.09
$0.07
(1) There are no preferred shares allocable to discontinued operations.
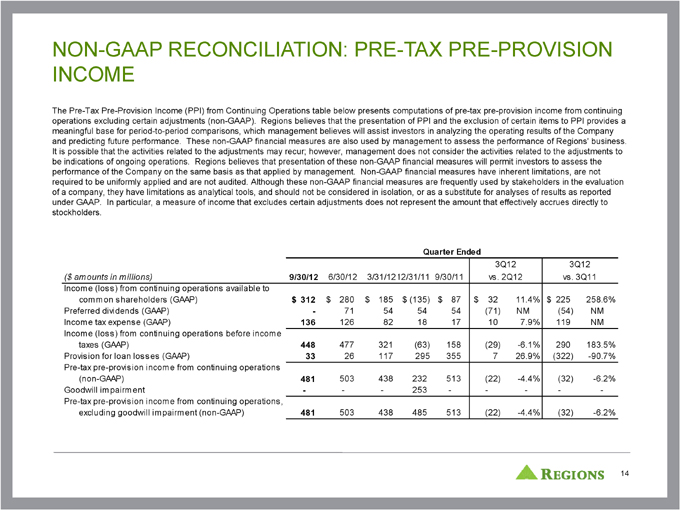
NON-GAAP RECONCILIATION: PRE-TAX PRE-PROVISION INCOME
The Pre-Tax Pre-Provision Income (PPI) from Continuing Operations table below presents computations of pre-tax pre-provision income from continuing operations excluding certain adjustments (non-GAAP) . Regions believes that the presentation of PPI and the exclusion of certain items to PPI provides a meaningful base for period-to-period comparisons, which management believes will assist investors in analyzing the operating results of the Company and predicting future performance. These non-GAAP financial measures are also used by management to assess the performance of Regions’ business. It is possible that the activities related to the adjustments may recur; however, management does not consider the activities related to the adjustments to be indications of ongoing operations. Regions believes that presentation of these non-GAAP financial measures will permit investors to assess the performance of the Company on the same basis as that applied by management. Non-GAAP financial measures have inherent limitations, are not required to be uniformly applied and are not audited. Although these non-GAAP financial measures are frequently used by stakeholders in the evaluation of a company, they have limitations as analytical tools, and should not be considered in isolation, or as a substitute for analyses of results as reported under GAAP. In particular, a measure of income that excludes certain adjustments does not represent the amount that effectively accrues directly to stockholders.Quarter Ended
3Q12 3Q12 ($ amounts in millions) 9/30/12 6/30/12 3/31/1212/31/11 9/30/11 vs. 2Q12 vs. 3Q11 Income (loss) from continuing operations available to common shareholders (GAAP) $ 312 $ 280 $ 185 $ (135) $ 87 $ 32 11.4% $ 225 258.6% Preferred dividends (GAAP) - 71 54 54 54 (71) NM (54) NM Income tax expense (GAAP) 136 126 82 18 17 10 7.9% 119 NM Income (loss) from continuing operations before income taxes (GAAP) 448 477 321 (63) 158 (29) -6.1% 290 183.5% Provision for loan losses (GAAP) 33 26 117 295 355 7 26.9% (322) -90.7% Pre-tax pre-provision income from continuing operations (non-GAAP) 481 503 438 232 513 (22) -4.4% (32) -6.2% Goodwill impairment - - - 253 - - - - -Pre-tax pre-provision income from continuing operations, excluding goodwill impairment (non-GAAP) 481 503 438 485 513 (22) -4.4% (32) -6.2%
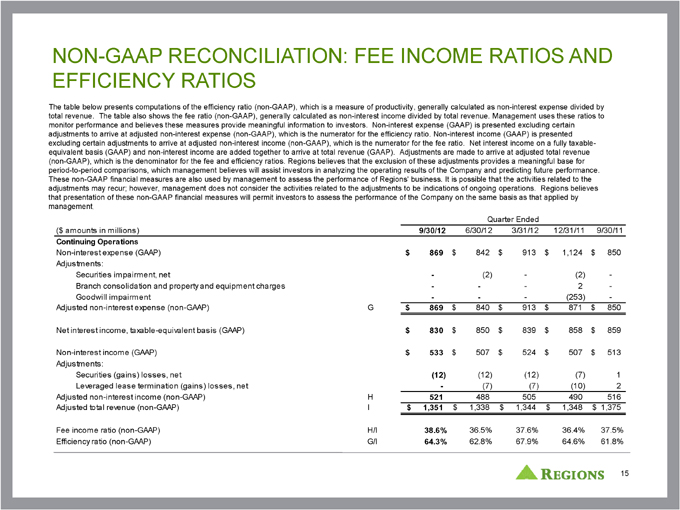
NON -GAAP RECONCILIATION: FEE INCOME RATIOS AND EFFICIENCY RATIOS
The table below presents computations of the efficiency ratio (non-GAAP), which is a measure of productivity, generally calculated as non-interest expense divided by total revenue. The table also shows the fee ratio (non-GAAP), generally calculated as non-interest income divided by total revenue. Management uses these ratios to monitor performance and believes these measures provide meaningful information to investors. Non-interest expense (GAAP) is presented excluding certain adjustments to arrive at adjusted non-interest expense (non-GAAP), which is the numerator for the efficiency ratio. Non-interest income (GAAP) is presented excludin g certain adjustments to arrive at adjusted non-interest income (non-GAAP), which is the numerator for the fee ratio. Net interest income on a fully taxable -equivalent basis (GAAP) and non-interest income are added together to arrive at total revenue (GAAP) . Adjustments are made to arrive at adjusted total revenue (non-GAAP), which is the denominator for the fee and efficiency ratios. Regions believes that the exclusion of these adjustments provides a meaningful base for period-to-period comparisons, which management believes will assist investors in analyzing the operating results of the Company and predicting future performance. These non-GAAP financial measures are also used by management to assess the performance of Regions’ business. It is possible that the activities related to the adjustments may recur; however, management does not consider the activities related to the adjustments to be indications of ongoing operations. Regions believes that presentation of these non-GAAP financial measures will permit investors to assess the performance of the Company on the same basis as that applied by management . ($ amounts in millions) 9/30/12 6/30/12 3/31/12 12/31/11 9/30/11 Continuing Operations Non-interest expense (GAAP) $ 869 $ 842 $ 913 $ 1,124 $ 850 Adjustments: Securities impairment, net - (2) - (2) -Branch consolidation and property and equipment charges - - - 2 -Goodwill impairment - - - (253) -Adjusted non-interest expense (non-GAAP) G $ 869 $ 840 $ 913 $ 871 $ 850 Net interest income, taxable-equivalent basis (GAAP) $ 830 $ 850 $ 839 $ 858 $ 859 Non-interest income (GAAP) $ 533 $ 507 $ 524 $ 507 $ 513 Adjustments: Securities (gains) losses, net (12) (12) (12) (7) 1 Leveraged lease termination (gains) losses, net - (7) (7) (10) 2 Adjusted non-interest income (non-GAAP) H 521 488 505 490 516 Adjusted total revenue (non-GAAP) I $ 1,351 $ 1,338 $ 1,344 $ 1,348 $ 1,375 Fee income ratio (non-GAAP) H/I 38.6% 36.5% 37.6% 36.4% 37.5% Efficiency ratio (non-GAAP) G/I 64.3% 62.8% 67.9% 64.6% 61.8%
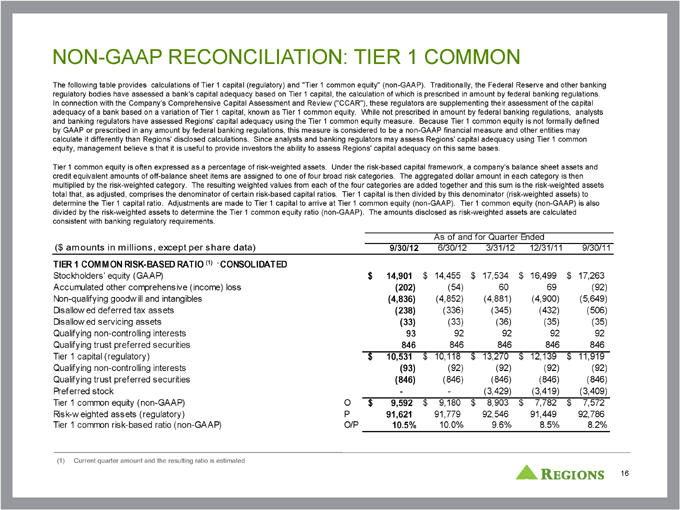
NON -GAAP RECONCILIATION: TIER 1 COMMON
The following table provides calculations of Tier 1 capital (regulatory) and “Tier 1 common equity” (non-GAAP) . Traditionally, the Federal Reserve and other banking regulatory bodies have assessed a bank’s capital adequacy based on Tier 1 capital, the calculation of which is prescribed in amount by federal banking regulations. In connection with the Company’s Comprehensive Capital Assessment and Review (“CCAR”), these regulators are supplementing their assessment of the capital adequacy of a bank based on a variation of Tier 1 capital, known as Tier 1 common equity. While not prescribed in amount by federal banking regulations, analysts and banking regulators have assessed Regions’ capital adequacy using the Tier 1 common equity measure. Because Tier 1 common equity is not formally defined by GAAP or prescribed in any amount by federal banking regulations, this measure is considered to be a non-GAAP financial measure and other entities may calculate it differently than Regions’ disclosed calculations. Since analysts and banking regulators may assess Regions’ capital adequacy using Tier 1 common equity, management believe s that it is useful to provide investors the ability to assess Regions’ capital adequacy on this same bases. Tier 1 common equity is often expressed as a percentage of risk-weighted assets. Under the risk-based capital framework, a company’s balance sheet assets and credit equivalent amounts of off-balance sheet items are assigned to one of four broad risk categories. The aggregated dollar amount in each category is then multiplied by the risk-weighted category. The resulting weighted values from each of the four categories are added together and this sum is the risk-weighted assets total that, as adjusted, comprises the denominator of certain risk-based capital ratios. Tier 1 capital is then divided by this denominator (risk-weighted assets) to determine the Tier 1 capital ratio. Adjustments are made to Tier 1 capital to arrive at Tier 1 common equity (non-GAAP) . Tier 1 common equity (non-GAAP) is also divided by the risk-weighted assets to determine the Tier 1 common equity ratio (non-GAAP) . The amounts disclosed as risk-weighted assets are calculated consistent with banking regulatory requirements. As of and for Quarter Ended ($ amounts in millions, except per share data) 9/30/12 6/30/12 3/31/12 12/31/11 9/30/11 TIER 1 COMMON RISK-BASED RATIO (1) - CONSOLIDATED Stockholders’ equity (GAAP) $ 14,901 $ 14,455 $ 17,534 $ 16,499 $ 17,263 Accumulated other comprehensive (income) loss (202) (54) 60 69 (92) Non-qualifying goodw ill and intangibles (4,836) (4,852) (4,881) (4,900) (5,649) Disallow ed deferred tax assets (238) (336) (345) (432) (506) Disallow ed servicing assets (33) (33) (36) (35) (35) Qualifying non-controlling interests 93 92 92 92 92 Qualifying trust preferred securities 846 846 846 846 846 Tier 1 capital (regulatory) $ 10,531 $ 10,118 $ 13,270 $ 12,139 $ 11,919 Qualifying non-controlling interests (93) (92) (92) (92) (92) Qualifying trust preferred securities (846) (846) (846) (846) (846) Preferred stock - - (3,429) (3,419) (3,409) Tier 1 common equity (non-GAAP) O $ 9,592 $ 9,180 $ 8,903 $ 7,782 $ 7,572 Risk-w eighted assets (regulatory) P 91,621 91,779 92,546 91,449 92,786 Tier 1 common risk-based ratio (non-GAAP) O/P 10.5% 10.0% 9.6% 8.5% 8.2%
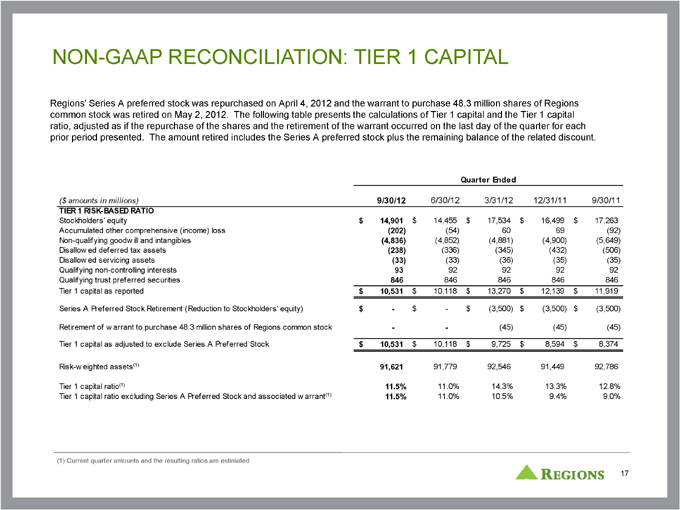
NON-GAAP RECONCILIATION: TIER 1 CAPITAL
Regions’ Series A preferred stock was repurchased on April 4, 2012 and the warrant to purchase 48.3 million shares of Regions common stock was retired on May 2, 2012. The following table presents the calculations of Tier 1 capital and the Tier 1 capital ratio, adjusted as if the repurchase of the shares and the retirement of the warrant occurred on the last day of the quarter for each prior period presented. The amount retired includes the Series A preferred stock plus the remaining balance of the related discount. Quarter Ended
($ amounts in millions) 9/30/12 6/30/12 3/31/12 12/31/11 9/30/11 TIER 1 RISK-BASED RATIO Stockholders’ equity $ 14,901 $ 14,455 $ 17,534 $ 16,499 $ 17,263 Accumulated other comprehensive (income) loss (202) (54) 60 69 (92) Non-qualifying goodw ill and intangibles (4,836) (4,852) (4,881) (4,900) (5,649) Disallow ed deferred tax assets (238) (336) (345) (432) (506) Disallow ed servicing assets (33) (33) (36) (35) (35) Qualifying non-controlling interests 93 92 92 92 92 Qualifying trust preferred securities 846 846 846 846 846 Tier 1 capital as reported $ 10,531 $ 10,118 $ 13,270 $ 12,139 $ 11,919 Series A Preferred Stock Retirement (Reduction to Stockholders’ equity) $ - $ - $ (3,500) $ (3,500) $ (3,500) Retirement of w arrant to purchase 48.3 million shares of Regions common stock - - (45) (45) (45) Tier 1 capital as adjusted to exclude Series A Preferred Stock $ 10,531 $ 10,118 $ 9,725 $ 8,594 $ 8,374 Risk-w eighted assets(1) 91,621 91,779 92,546 91,449 92,786 Tier 1 capital ratio(1) 11.5% 11.0% 14.3% 13.3% 12.8% Tier 1 capital ratio excluding Series A Preferred Stock and associated w arrant(1) 11.5% 11.0% 10.5% 9.4% 9.0% (1) Current quarter amounts and the resulting ratios are estimated
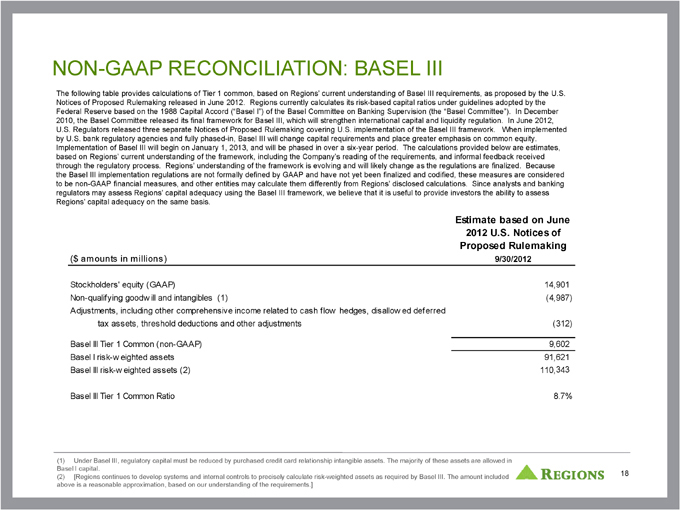
NON -GAAP RECONCILIATION: BASEL III
The following table provides calculations of Tier 1 common, based on Regions’ current understanding of Basel III requirements, as proposed by the U.S. Notices of Proposed Rulemaking released in June 2012. Regions currently calculates its risk-based capital ratios under guidelines adopted by the Federal Reserve based on the 1988 Capital Accord (“Basel I”) of the Basel Committee on Banking Supervision (the “Basel Committee”) . In December 2010, the Basel Committee released its final framework for Basel III, which will strengthen international capital and liquidity regulation. In June 2012, U.S. Regulators released three separate Notices of Proposed Rulemaking covering U.S. implementation of the Basel III framework. When implemented by U.S. bank regulatory agencies and fully phased -in, Basel III will change capital requirements and place greater emphasis on common equity. Implementation of Basel III will begin on January 1, 2013, and will be phased in over a six-year period. The calculations provided below are estimates, based on Regions’ current understanding of the framework, including the Company’s reading of the requirements, and informal feedback received through the regulatory process. Regions’ understanding of the framework is evolving and will likely change as the regulations are finalized. Because the Basel III implementation regulations are not formally defined by GAAP and have not yet been finalized and codified, these measures are considered to be non-GAAP financial measures, and other entities may calculate them differently from Regions’ disclosed calculations. Since analysts and banking regulators may assess Regions’ capital adequacy using the Basel III framework, we believe that it is useful to provide investors the ability to assess Regions’ capital adequacy on the same basis. Estimate based on June 2012 U.S. Notices of Proposed Rulemaking ($ amounts in millions) 9/30/2012 Stockholders’ equity (GAAP) 14,901 Non-qualifying goodw ill and intangibles (1) (4,987) Adjustments, including other comprehensive income related to cash flow hedges, disallow ed deferred tax assets, threshold deductions and other adjustments (312) Basel III Tier 1 Common (non-GAAP) 9,602 Basel I risk-w eighted assets 91,621 Basel III risk-w eighted assets (2) 110,343 Basel III Tier 1 Common Ratio 8.7%