 Regions Financial 2nd Quarter 2013 Earnings Conference Call July 23, 2013 Exhibit 99.3 |
 2 Continued momentum 2Q13 Highlights “By continuing to execute on our business priorities, our company is well-positioned to capitalize on opportunities.” • Loan balances grew $1.1B; almost 70% of markets experienced growth • Expanded customer base and grew core checking accounts • Invested in improved technology and experienced bankers • Disciplined expense management continued • Executed capital plan to reduce future funding costs Net Interest Income $808 Non-Interest Revenue $497 Non-Interest Expense $884 Net Income (1) $259 Diluted EPS $0.18 Adjusted Pre-Tax Pre- Provision Income (2) $469 (1) Available to common shareholders (2) Non-GAAP, see appendix for GAAP to Non-GAAP reconciliation ($ in millions, except per share data) |
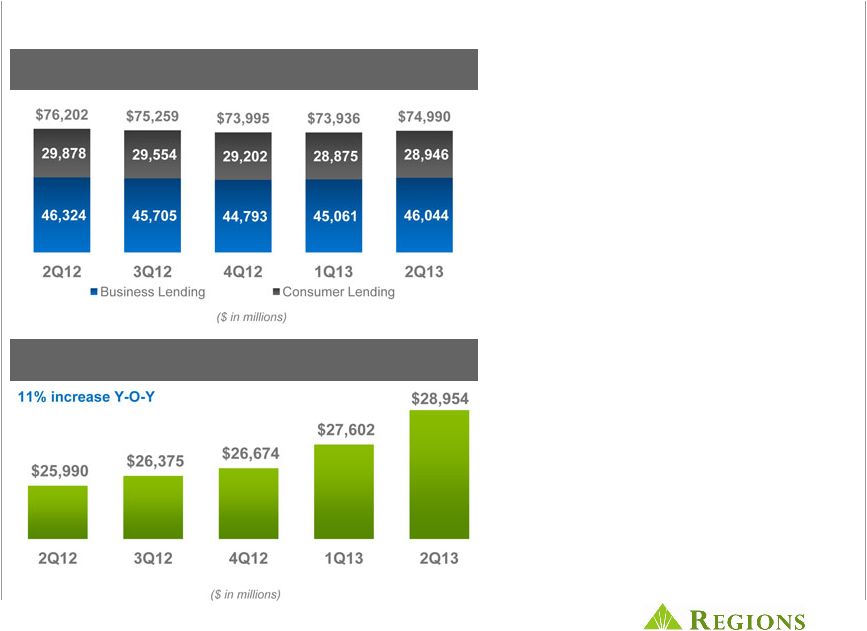 3 Loan balances increased Commercial and Industrial Loan Balances (1) Total Loan Balances (1) (1) Ending balances • Total loan balances grew $1.1 billion linked quarter • Commercial and industrial loans increased 5% linked quarter • Experienced more modest pace of decline in investor real estate portfolio • Indirect auto production up 21% linked quarter as dealer network expands • Credit card balances were up as the number of card holders increased over 2% • Continue to project loan growth in the low single-digits for 2013 |
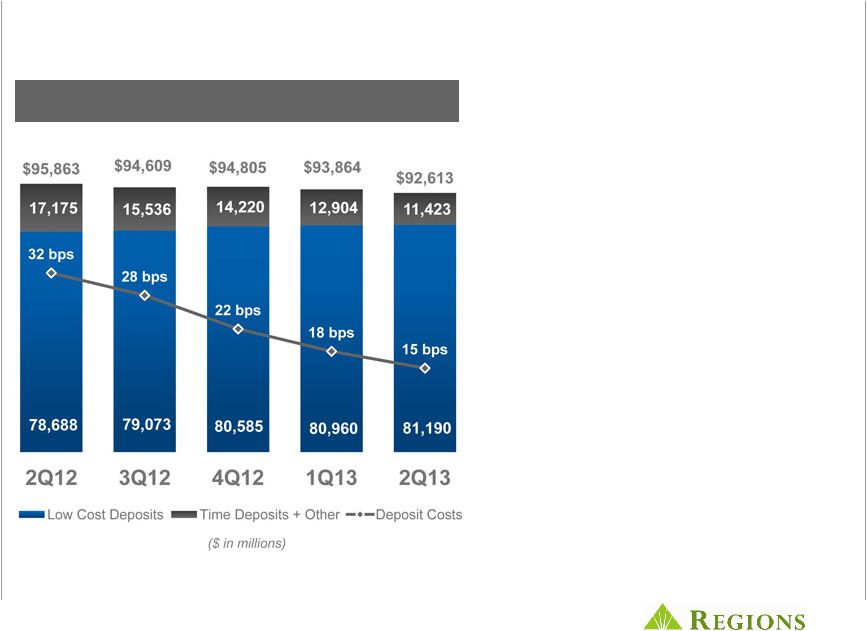 4 Improved funding mix continues to drive decline in deposit costs • Average low-cost deposits grew $230 million linked quarter • Positive re-pricing and mix shift led to deposit costs declining to 15 bps, down 3 bps for the quarter • Time deposits fell to 12% of total deposits • Additional $3.6 billion dollars of CDs maturing in the second half of 2013 at an average rate of 43 basis points Deposit Balances (1) and Deposit Costs (1) Average balances |
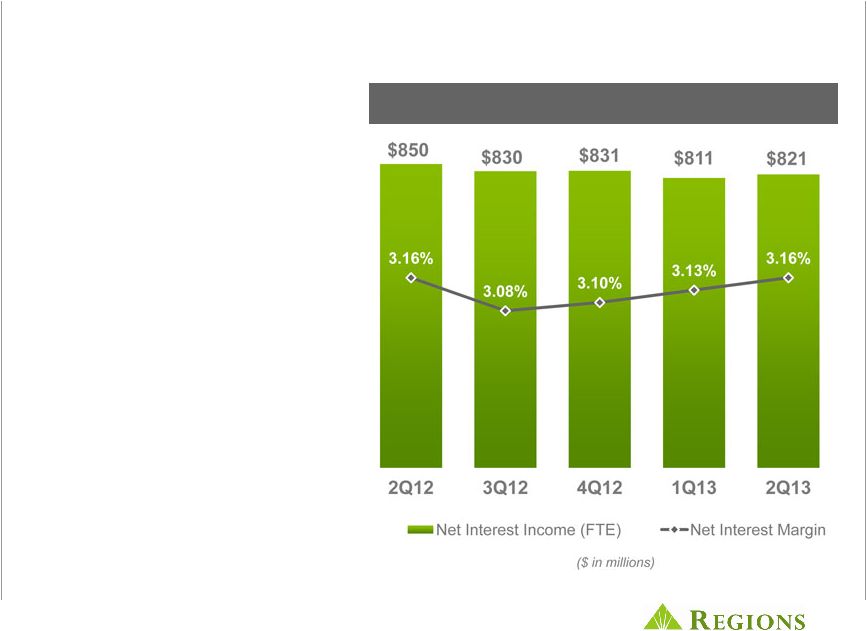 5 Net interest income increased and net interest margin expanded • Net interest income was up 1% linked quarter, driven by an additional day in the quarter, incremental loan growth, continued declines in deposit costs and liability management activity • Net interest margin was up 3 basis points linked quarter, driven by a reduction of deposit and borrowing costs, as well as a decline in excess average cash balances • Recent rise in long-term interest rates has increased expectations for future net interest margin; if rates remain at current level or increase further, modest margin expansion is expected over time Net Interest Income and Net Interest Margin |
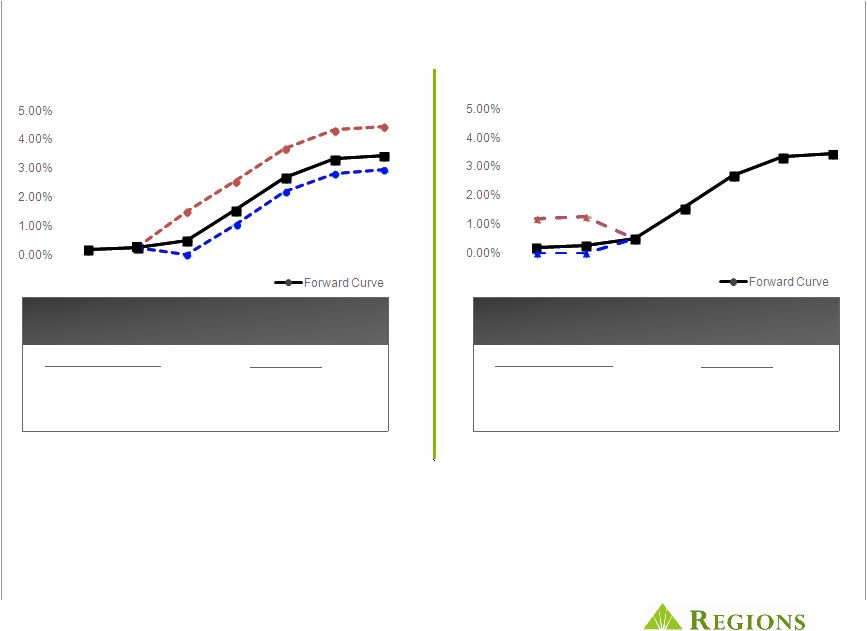 6 Interest rate sensitivity summary Net interest income remains asset sensitive to increases in both short-term and longer-term rates (1) NII impact due to instantaneous rate versus base case scenario *Based on market forward rates as of June 30, 2013 12- Month Net Interest Income Impact From Incremental Longer-term Rate Increases (1) LT Rate Change NII Impact +100 bps +$132 MM -50 bps -$72 MM 12- Month Net Interest Income Impact From Incremental Short-term Rate Increases (1) ST Rate Change NII Impact +100 bps +$81MM -50 bps -$56MM • As long-term rates rise, reinvestment yields are more favorable in the securities portfolio • Premium amortization declines as mortgage prepayments slow • Securities portfolio consists of $20 billion or 84% mortgage-backed securities |
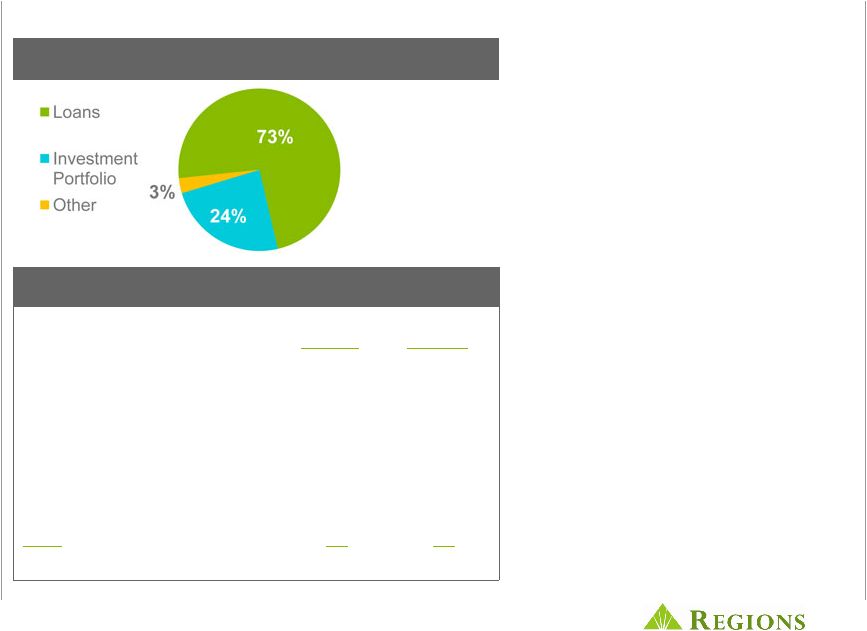 7 Investment portfolio activity Earning Assets* Securities Portfolio* ($ in billions) Available for Sale (1) Held to Maturity (2) Mortgage-backed securities: Residential agency $16.4 $1.9 Residential non-agency - - Commercial agency 0.8 - Commercial non-agency 1.1 0.2 Corporate and other debt securities 2.8 - Other (3) 0.9 0.3 Total $22.0 $2.4 • Overall size of investment portfolio declined $2.7 billion linked quarter • Moved $2.4 billion in securities to Held to Maturity • Will reduce wholesale borrowings, reduce overall balance sheet size, reduce tangible common equity volatility, as well as increase flexibility in asset and liability management • Offset portfolio sales with derivatives in order to maintain sensitivity profile • Including assets moved to Held to Maturity, securities portfolio was $24.4 billion or 24% of earning assets at the end of the second quarter (1) Fair value includes approximately $1 million of net unrealized pre-tax losses. (2) Carrying value includes approximately $111 million of net unrealized pre-tax loss recognized in Other Comprehensive Income on Held To Maturity securities resulting from the transfer of Available For Sale securities to Held To Maturity. (3) Includes U.S. Treasury securities, Federal agency securities, obligations of states and political subdivisions and equity securities *At June 30, 2013 |
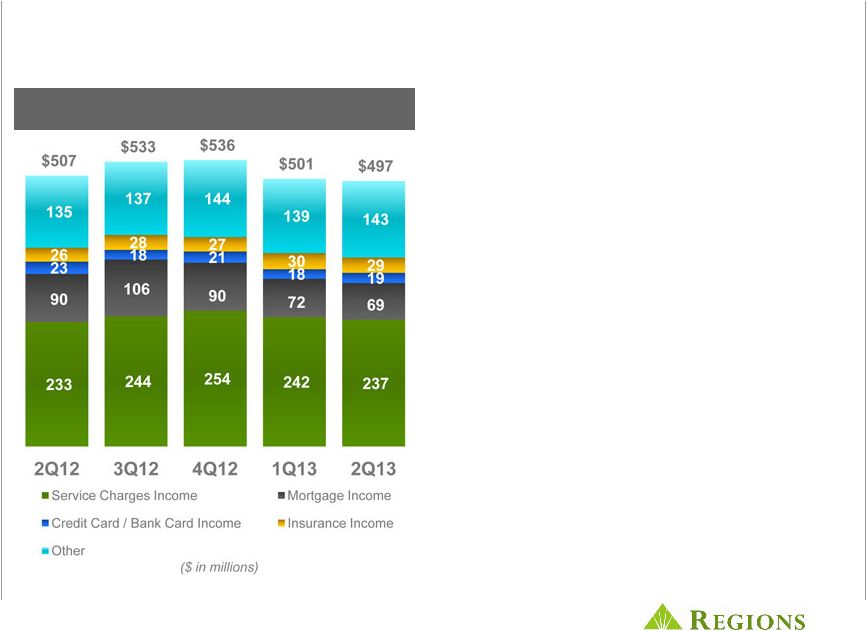 8 Non-interest revenue relatively flat • Mortgage income was slightly down • Mortgage loan production was $1.9 billion dollars, an increase of 6% over the prior quarter • Service charges income were impacted by lower NSF fees • Experienced an increase in net checking accounts and number of households • Continued focus on other revenue generating products and services, such as Now banking suite of products Non-Interest Revenue |
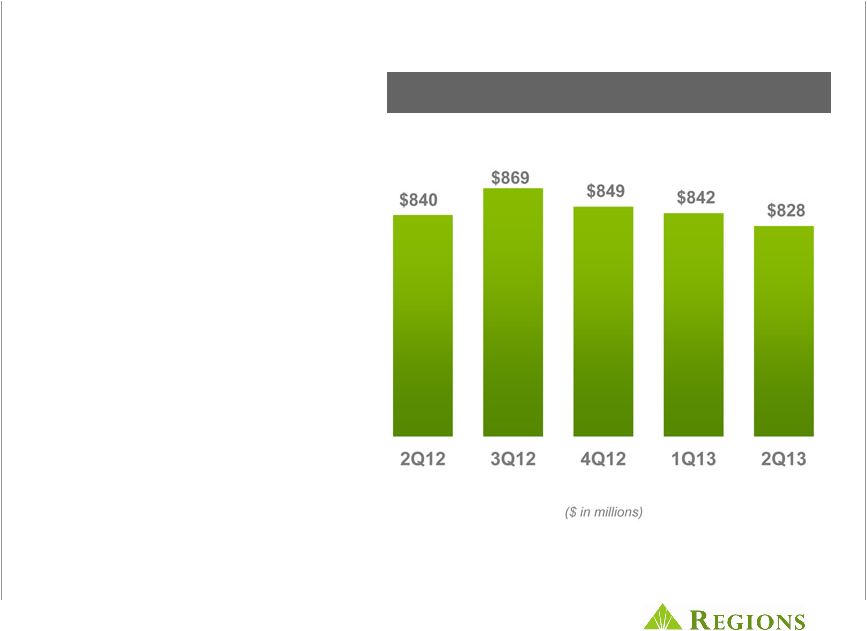 9 Expense control – a culture, not a campaign • Non-interest expenses¹ declined 2% linked quarter, excluding debt extinguishment costs related to the early termination of certain debt and preferred securities • Credit related costs continued to decline • Professional and legal fees declined • Salaries and benefits increased slightly related to additional staffing in income producing areas, as well as increases for merit and incentive compensation • Continue to expect overall 2013 expenses to be below 2012 expenses Adjusted Non-Interest Expenses (1) (1) Excluding certain adjustments-Non-GAAP, see appendix for GAAP to Non-GAAP reconciliation 1% decrease Y-O-Y |
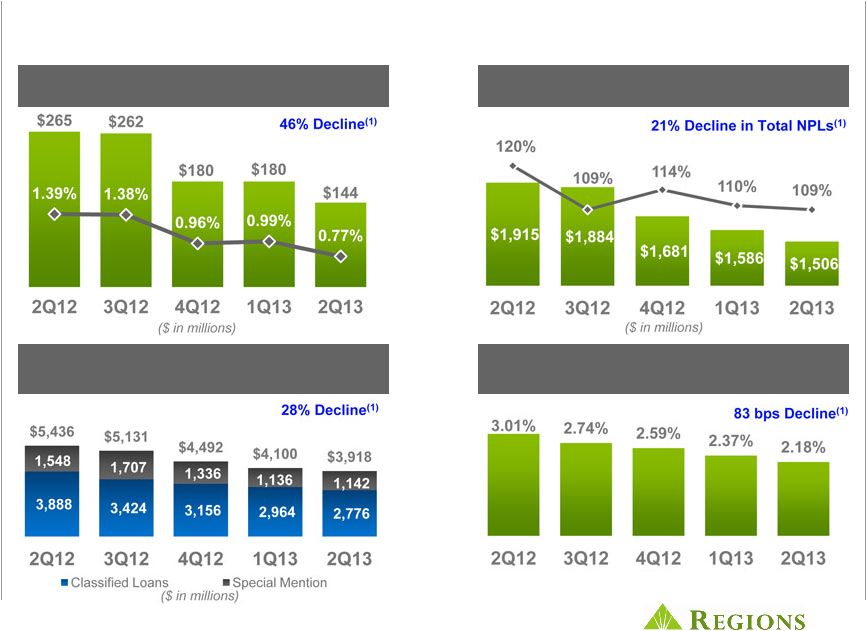 10 NPLs and Coverage Ratio (2) Continued improvement in asset quality Net Charge-Offs and Ratio Criticized and Classified Loans (3) Allowance for Loan Losses / Total Loans (1) Year-over-year change (2) Excludes loans held for sale (3) Includes commercial and investor real estate loans only |
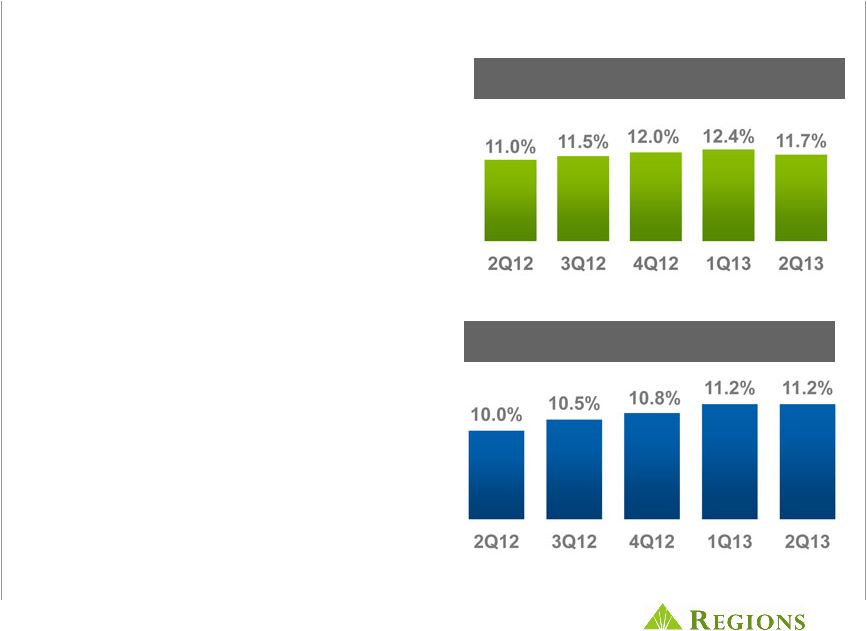 11 Capital position remains strong • Successfully completed several actions that serve to improve capital efficiency: • Redeemed $350 million of 7.75% senior notes • Issued $750 million of 2% senior notes • Redeemed $498 million of 6.625% Trust Preferred Securities • Redeemed $100 million of 7.75% Union Planters REIT Preferred Stock • Increased common stock dividend • Repurchased approximately half of the $350 million dollars in common stock that was approved by our Board of Directors • Basel III Tier 1 Common ratio (1)(2) estimated under the new proposed rules at 10.4% • Loan to deposit ratio remains low at 81% Tier 1 capital ratio (1) (1) Current quarter ratios are estimated (2) Non-GAAP – See appendix for reconciliation Tier 1 common ratio (1)(2) |
 12 Appendix |
 13 Liability management summary (1) Impact to net income after tax from liability management activities during the second quarter was $43.4 million (2) Union Planters Preferred and Institutional Trust Preferred Securities upfront costs include acceleration of unamortized issuance costs (3) Up-front costs associated with the Union Planters Preferred Tender are not tax deductible (4) Up-front cost and projected benefit include the impact of associated interest rate swap; 3 month libor assumed flat at 0.28% Security Face Amount Retired Dividend/Coupon Up-front Costs (pre-tax) (1) Projected Next 12 Month Run Rate Benefit (pre-tax) Strategic Impact Union Planters Preferred Tender (2) (3) $100 7.750% ($23.8) $8.4 Elimination of high cost Basel III inefficient security Parent Senior Debt Tender (4) $350 7.750% ($26.6) $17.8 Reduction in high cost long- term debt Institutional TruPS Call (2) $498 6.625% ($5.7) $33.1 Elimination of high cost Basel III inefficient security Aggregate Impact ($56.1) $59.4 Q2 2013 - Liability Management Summary ($ in millions) |
 14 Non-GAAP reconciliation: Pre-tax pre- provision income The Pre-Tax Pre-Provision Income (PPI) table below presents computations of pre-tax pre-provision income from continuing operations excluding certain adjustments (non-GAAP). Regions believes that the presentation of PPI and the exclusion of certain items to PPI provides a meaningful base for period-to-period comparisons, which management believes will assist investors in analyzing the operating results of the Company and predicting future performance. These non-GAAP financial measures are also used by management to assess the performance of Regions' business. It is possible that the activities related to the adjustments may recur; however, management does not consider the activities related to the adjustments to be indications of ongoing operations. Regions believes that presentation of these non-GAAP financial measures will permit investors to assess the performance of the Company on the same basis as that applied by management. Non-GAAP financial measures have inherent limitations, are not required to be uniformly applied and are not audited. Although these non-GAAP financial measures are frequently used by stakeholders in the evaluation of a company, they have limitations as analytical tools, and should not be considered in isolation, or as a substitute for analyses of results as reported under GAAP. In particular, a measure of income that excludes certain adjustments does not represent the amount that effectively accrues directly to stockholders. (1) After tax amounts for leveraged lease terminations gains are zero for 6/30/2013, 3/31/2013, 12/31/2012 and 9/30/2012, respectively, and $0.6 million for 6/30/2012. ($ amounts in millions) 6/30/13 3/31/13 12/31/12 9/30/12 6/30/12 common shareholders (GAAP) 260 $ 325 $ 273 $ 312 $ 280 $ (65) $ -20.0% (20) $ -7.1% 8 8 4 - 71 - - (63) -88.7% 122 114 138 136 126 8 7.0% (4) -3.2% taxes (GAAP) 390 447 415 448 477 (57) -12.8% (87) -18.2% 31 10 37 33 26 21 210.0% 5 19.2% (non-GAAP) 421 457 452 481 503 (36) -7.9% (82) -16.3% Other Adjustments: Securities gains, net (8) (15) (12) (12) (12) 7 -46.7% 4 -33.3% Leveraged lease termination gains, net (1) - - - - (7) - NM 7 -100.0% Loss on early extinguishment of debt 56 - 11 - - 56 NM 56 NM Securities impairment, net - - - - 2 - NM (2) -100.0% REIT investment early termination costs - - 42 - - - NM - NM Total other adjustments 48 (15) 41 (12) (17) 63 -420.0% 65 -382.4% operations (non-GAAP) 469 $ 442 $ 493 $ 469 $ 486 $ 27 $ 6.1% (17) $ -3.5% 2Q13 2Q13 vs. 1Q13 vs. 2Q12 Quarter Ended Pre-tax pre-provision income from continuing operations Adjusted pre-tax pre-provision income from continuing Income from continuing operations available to Preferred dividends (GAAP) Income tax expense (GAAP) Income from continuing operations before income Provision for loan losses (GAAP) |
 15 Non-GAAP reconciliation: Non-interest expense ($ amounts in millions) 6/30/13 3/31/13 12/31/12 9/30/12 6/30/12 Continuing Operations Non-interest expense (GAAP) 884 $ 842 $ 902 $ 869 $ 842 $ 42 $ 5.0% 42 $ 5.0% Adjustments: REIT investment early termination costs - - (42) - - - NM - NM Loss on early extinguishment of debt (56) - (11) - - (56) NM (56) NM Securities impairment, net - - - - (2) - NM 2 -100.0% Adjusted non-interest expense (non-GAAP) 828 $ 842 $ 849 $ 869 $ 840 $ (14) $ -1.7% (12) $ -1.4% Quarter Ended 2Q13 vs. 1Q13 2Q13 vs. 2Q12 The table below presents non-interest expense (GAAP) excluding certain adjustments to arrive at adjusted non-interest expense (non-GAAP). Regions believes that the exclusion of these adjustments provides a meaningful base for period-to-period comparisons, which management believes will assist investors in analyzing the operating results of the Company and predicting future performance. This non-GAAP financial measure is also used by management to assess the performance of Regions' business. It is possible that the activities related to the adjustments may recur; however, management does not consider the activities related to the adjustments to be indications of ongoing operations. Regions believes that presentation of this non-GAAP financial measure will permit investors to assess the performance of the Company on the same basis as that applied by management. |
 16 Non-GAAP reconciliation: Tier 1 common The following table provides calculations of Tier 1 capital (regulatory) and "Tier 1 common equity" (non-GAAP). Traditionally, the Federal Reserve and other banking regulatory bodies have assessed a bank's capital adequacy based on Tier 1 capital, the calculation of which is prescribed in amount by federal banking regulations. In connection with the Company's Comprehensive Capital Analysis and Review ("CCAR"), these regulators are supplementing their assessment of the capital adequacy of a bank based on a variation of Tier 1 capital, known as Tier 1 common equity. While not prescribed in amount by federal banking regulations (under Basel I), analysts and banking regulators have assessed Regions' capital adequacy using the Tier 1 common equity measure. Because Tier 1 common equity is not formally defined by GAAP or prescribed in any amount by federal banking regulations (under Basel I), this measure is currently considered to be a non-GAAP financial measure and other entities may calculate it differently than Regions' disclosed calculations. Since analysts and banking regulators may assess Regions' capital adequacy using Tier 1 common equity, management believes that it is useful to provide investors the ability to assess Regions' capital adequacy on this same basis. Tier 1 common equity is often expressed as a percentage of risk-weighted assets. Under the risk-based capital framework, a company's balance sheet assets and credit equivalent amounts of off-balance sheet items are assigned to one of four broad risk categories. The aggregated dollar amount in each category is then multiplied by the risk-weighted category. The resulting weighted values from each of the four categories are added together and this sum is the risk-weighted assets total that, as adjusted, comprises the denominator of certain risk-based capital ratios. Tier 1 capital is then divided by this denominator (risk-weighted assets) to determine the Tier 1 capital ratio. Adjustments are made to Tier 1 capital to arrive at Tier 1 common equity (non-GAAP). Tier 1 common equity (non-GAAP) is also divided by the risk-weighted assets to determine the Tier 1 common equity ratio (non-GAAP). The amounts disclosed as risk- weighted assets are calculated consistent with banking regulatory requirements. (1) Current quarter amount and the resulting ratio are estimated. ($ amounts in millions) 6/30/13 3/31/13 12/31/12 9/30/12 6/30/12 As of and for Quarter Ended TIER 1 COMMON RISK-BASED RATIO (1) - CONSOLIDATED Stockholders' equity (GAAP) 15,329 $ 15,740 $ 15,499 $ 14,901 $ 14,455 $ Accumulated other comprehensive (income) loss 478 12 (65) (202) (54) Non-qualifying goodwill and intangibles (4,813) (4,819) (4,826) (4,836) (4,852) Disallowed deferred tax assets - - (35) (238) (336) Disallowed servicing assets (30) (37) (33) (33) (33) Qualifying non-controlling interests - 93 93 93 92 Qualifying trust preferred securities 3 501 501 846 846 Tier 1 capital (regulatory) 10,967 $ 11,490 $ 11,134 $ 10,531 $ 10,118 $ Qualifying non-controlling interests - (93) (93) (93) (92) Qualifying trust preferred securities (3) (501) (501) (846) (846) Preferred stock (466) (474) (482) - - Tier 1 common equity (non-GAAP) A 10,498 $ 10,422 $ 10,058 $ 9,592 $ 9,180 $ Risk-weighted assets (regulatory) B 93,747 92,787 92,811 91,723 91,779 Tier 1 common risk-based ratio (non-GAAP) A/B 11.2% 11.2% 10.8% 10.5% 10.0% |
 17 Non-GAAP reconciliation: Basel III (1) Under Basel III, in addition to goodwill and other identified intangibles regulatory capital must be reduced by purchased credit card relationship intangible assets. The majority of these assets are allowed in Basel I capital. (2) Regions continues to develop systems and internal controls to precisely calculate risk-weighted assets as required by Basel III. The amount included above is a reasonable approximation, based on our understanding of the requirements. The following table provides calculations of Tier 1 common, based on Regions’ current understanding of the Final Basel III requirements, released in July 2013. Regions currently calculates its risk-based capital ratios under guidelines adopted by the Federal Reserve based on the 1988 Capital Accord (“Basel I”) of the Basel Committee on Banking Supervision (the “Basel Committee”). In December 2010, the Basel Committee released its final framework for Basel III, which will strengthen international capital and liquidity regulation. In June 2012, U.S. Regulators released three separate Notices of Proposed Rulemaking covering U.S. implementation of the Basel III framework. In July 2013, U.S. Regulators released final rules covering the U.S. implementation of the Basel III framework, which will change capital requirements and place greater emphasis on common equity. For Regions, the Basel III framework will be phased in beginning in 2015 with full implementation complete beginning in 2019. The calculations provided below are estimates, based on Regions’ current understanding of the final framework, including the Company’s interpretation of the requirements, and informal feedback received through the regulatory process. Regions’ understanding of the framework is evolving and will likely change as analysis and discussions with regulators continue. Because the Basel III implementation regulations are not formally defined by GAAP, these measures are considered to be non-GAAP financial measures, and other entities may calculate them differently from Regions’ disclosed calculations. Since analysts and banking regulators may assess Regions’ capital adequacy using the Basel III framework, we believe that it is useful to provide investors the ability to assess Regions’ capital adequacy on the same basis. Estimate based on July 2013 Final Rules ($ amounts in millions) 6/30/2013 Stockholders' equity (GAAP) 15,329 $ Non-qualifying goodwill and intangibles (1) (4,946) Final Rules Adjustments Adjustments, including all components of Accumulated Other Comprehensive Income, disallowed deferred tax assets, threshold deductions and other adjustments 350 Non-Common Tier 1 (466) Basel III Tier 1 Common (non-GAAP) 10,267 $ Basel I risk-weighted assets 93,747 Basel III risk-weighted assets (2) 98,627 Basel III Tier 1 Common Ratio 10.4% |
 18 Forward-looking statements This presentation may include forward-looking statements which reflect Regions’ current views with respect to future events and financial performance. The Private Securities Litigation Reform Act of 1995 (“the Act”) provides a “safe harbor” for forward-looking statements which are identified as such and are accompanied by the identification of important factors that could cause actual results to differ materially from the forward-looking statements. For these statements, we, together with our subsidiaries, unless the context implies otherwise, claim the protection afforded by the safe harbor in the Act. Forward-looking statements are not based on historical information, but rather are related to future operations, strategies, financial results or other developments. Forward-looking statements are based on management’s expectations as well as certain assumptions and estimates made by, and information available to, management at the time the statements are made. Those statements are based on general assumptions and are subject to various risks, uncertainties and other factors that may cause actual results to differ materially from the views, beliefs and projections expressed in such statements. These risks, uncertainties and other factors include, but are not limited to, those described below: >The Dodd-Frank Wall Street Reform and Consumer Protection Act (the “Dodd-Frank Act”) became law in July 2010, and a number of legislative, regulatory and tax proposals remain pending. Future and proposed rules may have significant effects on Regions and the financial services industry, the exact nature and extent of which cannot be determined at this time. >Possible additional loan losses, impairment of goodwill and other intangibles, and adjustment of valuation allowances on deferred tax assets and the impact on earnings and capital. >Possible changes in interest rates may increase funding costs and reduce earning asset yields, thus reducing margins. Increases in benchmark interest rates could also increase debt service requirements for customers whose terms include a variable interest rate, which may negatively impact the ability of borrowers to pay as contractually obligated. >Possible adverse changes in general economic and business conditions in the United States in general and in the communities Regions serves in particular. >Possible changes in the creditworthiness of customers and the possible impairment of the collectability of loans. >Possible changes in trade, monetary and fiscal policies, laws and regulations and other activities of governments, agencies, and similar organizations, may have an adverse effect on business. >Possible regulations issued by the Consumer Financial Protection Bureau or other regulators which might adversely impact Regions’ business model or products and services. >Regions’ ability to take certain capital actions, including paying dividends and any plans to increase common stock dividends, repurchase common stock under current or future programs, or issue or redeem preferred stock or other regulatory capital instruments, is subject to the review of such proposed actions by the Federal Reserve as part of Regions’ comprehensive capital plan for the applicable period in connection with the regulators’ Comprehensive Capital Analysis and Review (CCAR) process and to the acceptance of such capital plan and non-objection to such capital actions by the Federal Reserve. >Possible stresses in the financial and real estate markets, including possible deterioration in property values. >Regions’ ability to manage fluctuations in the value of assets and liabilities and off-balance sheet exposure so as to maintain sufficient capital and liquidity to support Regions’ business. >Regions’ ability to expand into new markets and to maintain profit margins in the face of competitive pressures. >Regions’ ability to develop competitive new products and services in a timely manner and the acceptance of such products and services by Regions’ customers and potential customers. >Cyber-security risks, including “denial of service,” “hacking” and “identity theft,” that could adversely affect our business and financial performance, or our reputation. >Regions’ ability to keep pace with technological changes. >Regions’ ability to effectively identify and manage credit risk, interest rate risk, market risk, operational risk, legal risk, liquidity risk, reputational risk, counterparty risk, international risk, regulatory risk, and compliance risk. >Regions’ ability to ensure adequate capitalization which is impacted by inherent uncertainties in forecasting credit losses. >The cost and other effects of material contingencies, including litigation contingencies, and any adverse judicial, administrative, or arbitral rulings or proceedings. >The effects of increased competition from both banks and non-banks. >The effects of geopolitical instability and risks such as terrorist attacks. >Regions' ability to identify and address data security breaches. >Possible changes in consumer and business spending and saving habits could affect Regions’ ability to increase assets and to attract deposits. >The effects of weather and natural disasters such as floods, droughts, wind, tornadoes and hurricanes, and the effects of man-made disasters. >Possible downgrades in ratings issued by rating agencies. >Possible changes in the speed of loan prepayments by Regions’ customers and loan origination or sales volumes. >Possible acceleration of prepayments on mortgage-backed securities due to low interest rates, and the related acceleration of premium amortization on those securities. >The effects of problems encountered by larger or similar financial institutions that adversely affect Regions or the banking industry generally. >Regions’ ability to receive dividends from its subsidiaries. >The effects of the failure of any component of Regions’ business infrastructure which is provided by a third party. >Changes in accounting policies or procedures as may be required by the Financial Accounting Standards Board or other regulatory agencies. >The effects of any damage to Regions’ reputation resulting from developments related to any of the items identified above. The foregoing list of factors is not exhaustive. For discussion of these and other factors that may cause actual results to differ from expectations, look under the captions “Forward-Looking Statements” and “Risk Factors" of Regions' Annual Report on Form 10-K for the year ended December 31, 2012 and the "Foward-Looking Statements" section of Regions' Quarterly Report on Form 10-Q for the quarter ended March 31, 2013, as filed with the Securities and Exchange Commission. The words "believe," "expect," "anticipate," "project," and similar expressions often signify forward-looking statements. You should not place undue reliance on any forward-looking statements, which speak only as of the date made. We assume no obligation to update or revise any forward-looking statements that are made from time to time. |
 |