 Growth in Consumer Lending Evercore Financials Forum August 6, 2013 Logan Pichel Head of Consumer Lending Exhibit 99.1 |
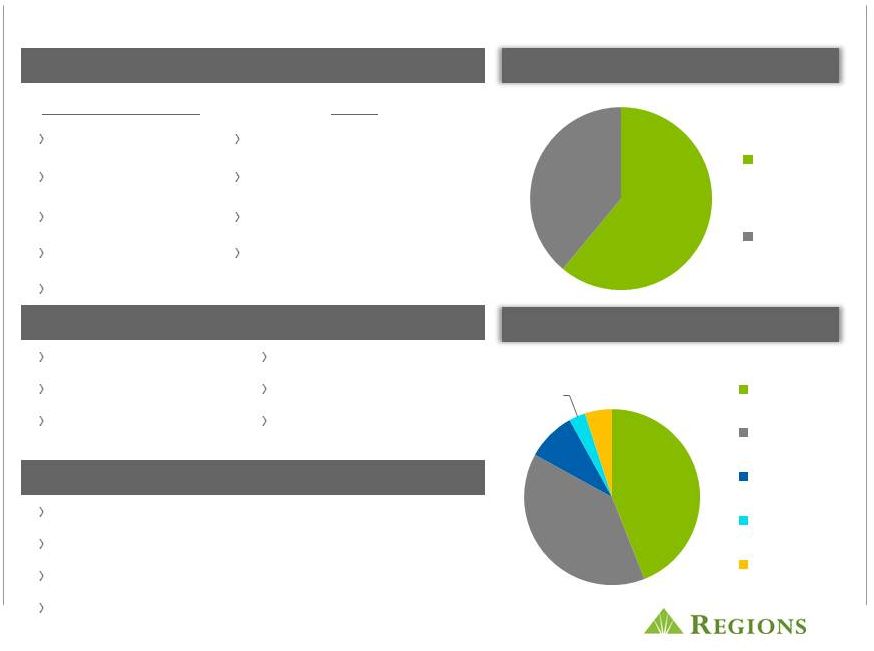 2 Overview Total loan portfolio* Consumer portfolio* *Ending balances as of June 30, 2013 Industrial management 39% 61% 39% 44% 9% 3% 5% Business Services Consumer Services Residential 1st Mortgage Home equity Indirect Credit card Other Consumer Services Consumer Lending Other Mortgage Corporate Marketing Home Equity Cards and Payments Credit Card eBusiness Indirect Delivery and branch Direct support Business Services Business capital Capital markets Commercial & Equipment Finance Real Estate banking Treasury Wealth Management Institutional services Private wealth management Investment services Insurance |
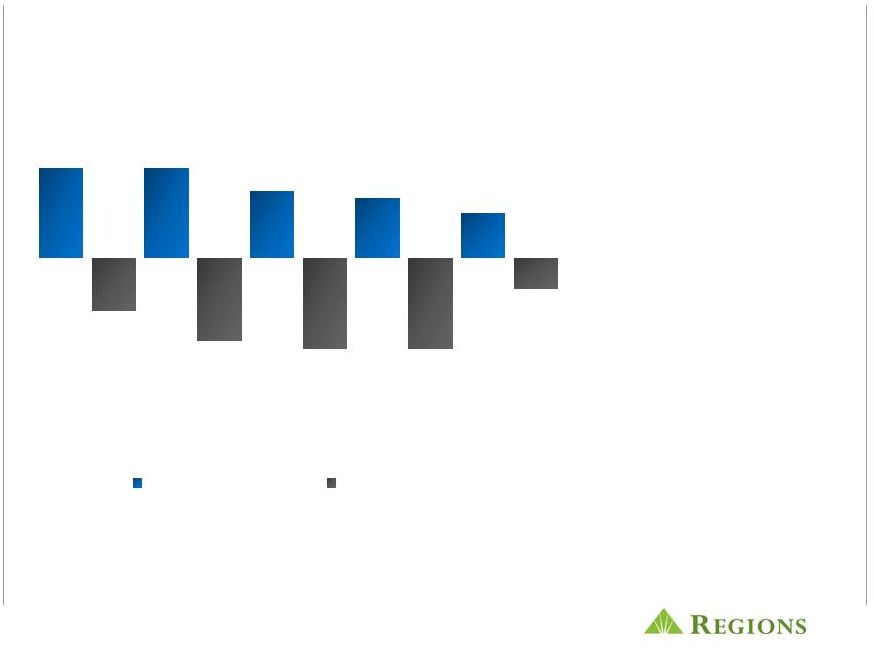
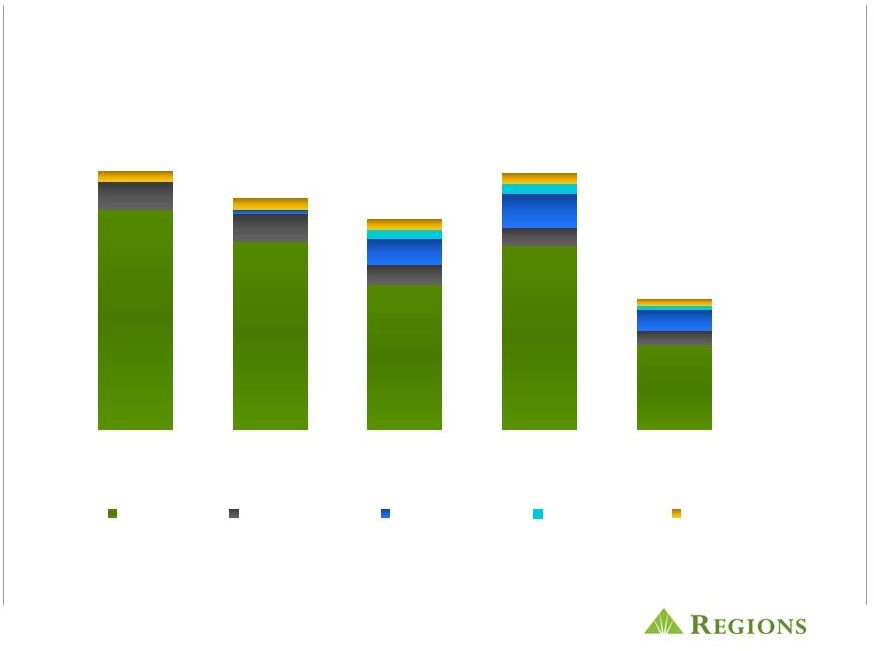 3 ($ in billions) Consumer lending – loan production 2013 production has returned to pre-crisis levels and is becoming more balanced $11.3 $10.1 $9.2 $11.2 $5.7 2009 2010 2011 2012 June 2013 YTD Mortgage Home Equity Indirect Auto Credit Card Direct |
 4 Consumer lending – balance change Increased production is resulting in balance sheet improvement ($ in billions) $(2.4) $(2.1) $(2.5) $(1.6) $(0.3) 2009 2010 2011 2012 June 2013 YTD |
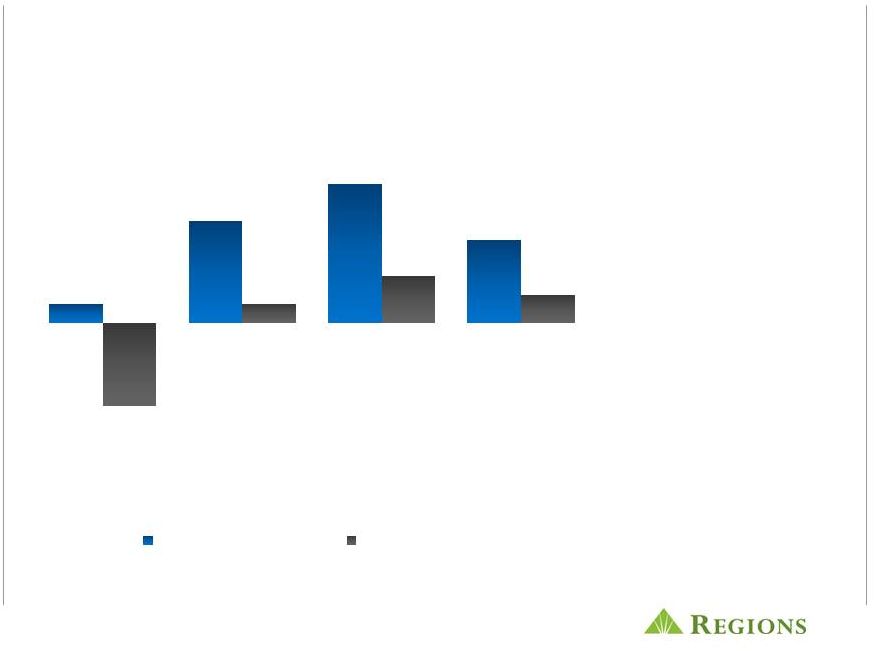 5 Indirect auto lending Industry growth and growth in number of dealers ($ in billions) OPPORTUNITIES • Industry growth • Expand dealer network • Increase loans per dealer • Automated approvals CHALLENGES • Compliance $0.2 $1.1 $0.2 $1.5 $0.5 $0.9 $0.3 $(0.9) 2010 2011 2012 June 2013 YTD Production Balance Change |
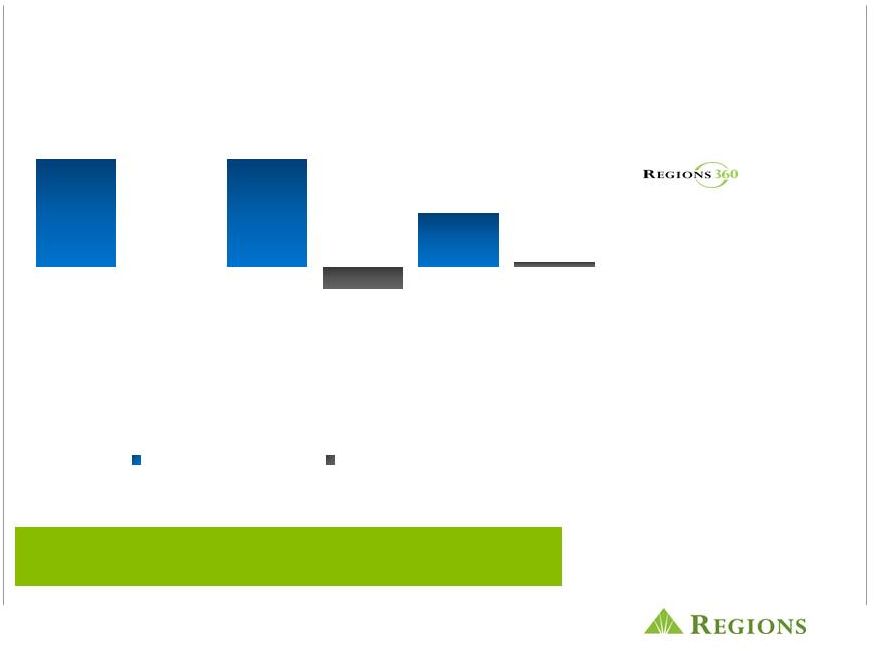
 6 Direct lending and expanded delivery channels will grow production ($ in billions) OPPORTUNITIES • • 10% of Regions households have a direct loan • Point-of-sale pre- approvals • Direct to consumers sales initiatives CHALLENGES • Reductions in average loan size $0.5 $0.5 $0.5 $0.5 $0.2 $0.00 $0.05 $0.02 $(0.03) $(0.06) 2009 2010 2011 2012 June 2013 YTD Production Balance Change |
 7 ($ in billions) OPPORTUNITIES • • Increased consumer household penetration • Expansion of account activation / utilization • Loyalty programs CHALLENGES • Elevated payment rates First year of Regions operating platform Credit Card $0.4 $0.4 $0.2 $0.02 $0.00 $(0.08) 2011 2012 June 2013 YTD Production Balance Change |
 8 Home equity lending Balanced production HELOANs (60%) and HELOCs (40%) ($ in billions) OPPORTUNITIES • Improvements in the economy and real estate values • Slower run-off as mortgage refinances decline • Approved not booked CHALLENGES • Portfolio is still declining $1.2 $1.2 $0.9 $0.8 $0.6 $(0.7) $(1.1) $(1.2) $(1.2) $(0.4) 2009 2010 2011 2012 June 2013 YTD Production Balance Change |
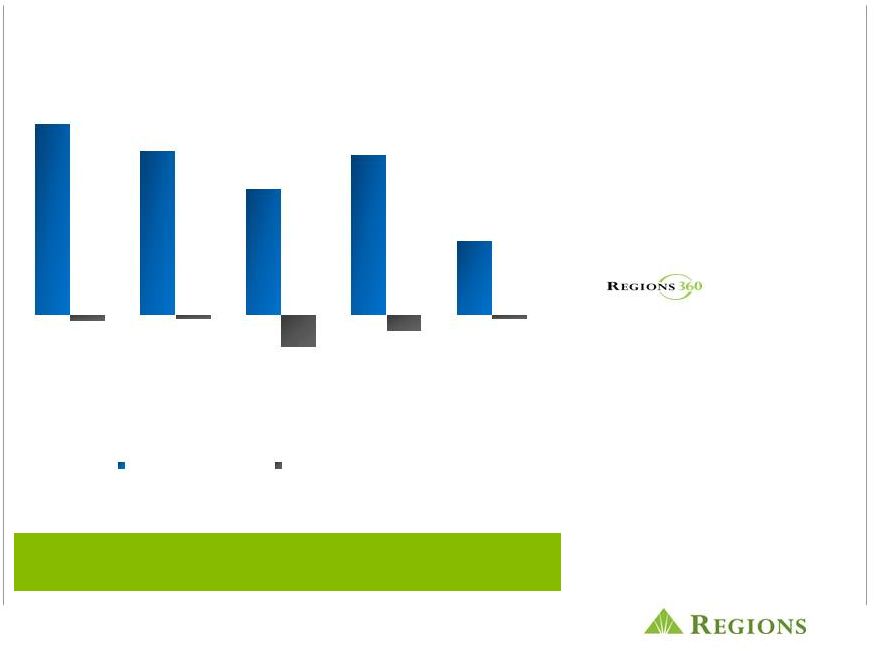 9 Mortgage lending ($ in billions) OPPORTUNITIES • Purchase business • 53% in 2Q • Expand sales force • HARP refinance • • Mortgage Loan Originator branding • Branch referrals • Servicing rights acquisitions CHALLENGES • Reduced refinance volume • Margin pressure • Compliance Retaining the 15 year fixed-rate product in the portfolio $9.6 $8.2 $6.3 $8.0 $3.7 ($0.3) $(0.2) $(1.6) $(0.8) $(0.2) 2009 2010 2011 2012 June 2013 YTD Production Balance Change |
 10 • Strong Customer Satisfaction Scores – Originations & Servicing • Low Cost Originator and Servicer • Low risk model • Retail production in footprint • Servicing retained • Servicing rights acquisitions are in footprint agency loans • Fully integrated with the bank • 30% of Mortgage Production results from Bank referrals • 32% of Mortgage only customers become Bank deposit customers • Capacity to grow • $40b in annual home financing needs from Bank customers • Servicing Business has capacity - $42b Servicing Portfolio Regions mortgage Well-positioned for the shift to purchase volume |
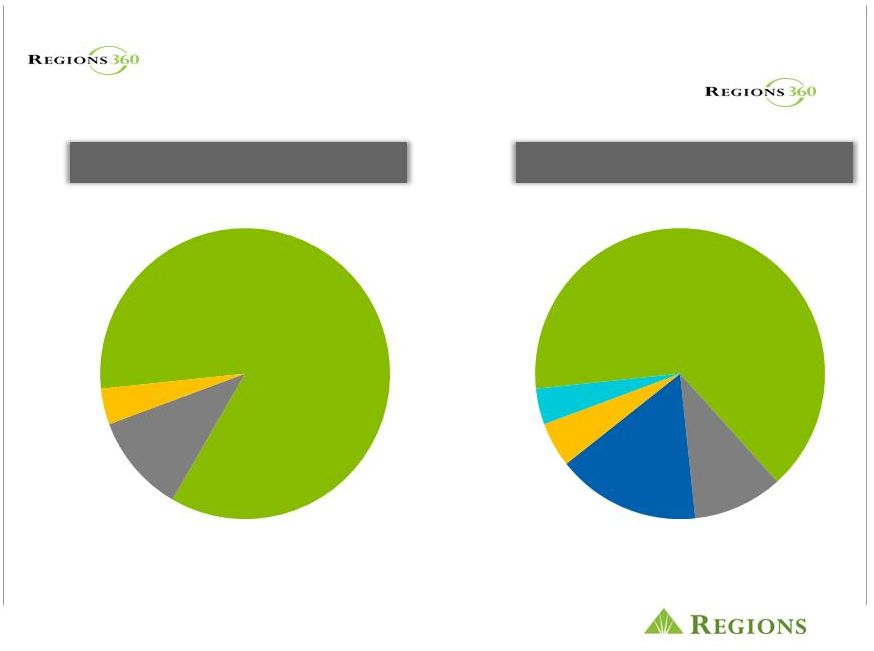 11 Mortgage 85% Home Equity 11% Direct 4% Mortgage 66% Home Equity 10% Indirect Auto 16% Direct 4% Credit Card 4% 2009 2013 Balanced production means more balanced production. Understanding and meeting customer needs and in turn building long-lasting relationships is the way we bring to life. |
 |