
Goldman Sachs U.S. Financial Services Conference Grayson Hall, Chairman and CEO December 6, 2016 EXHIBIT 99.1
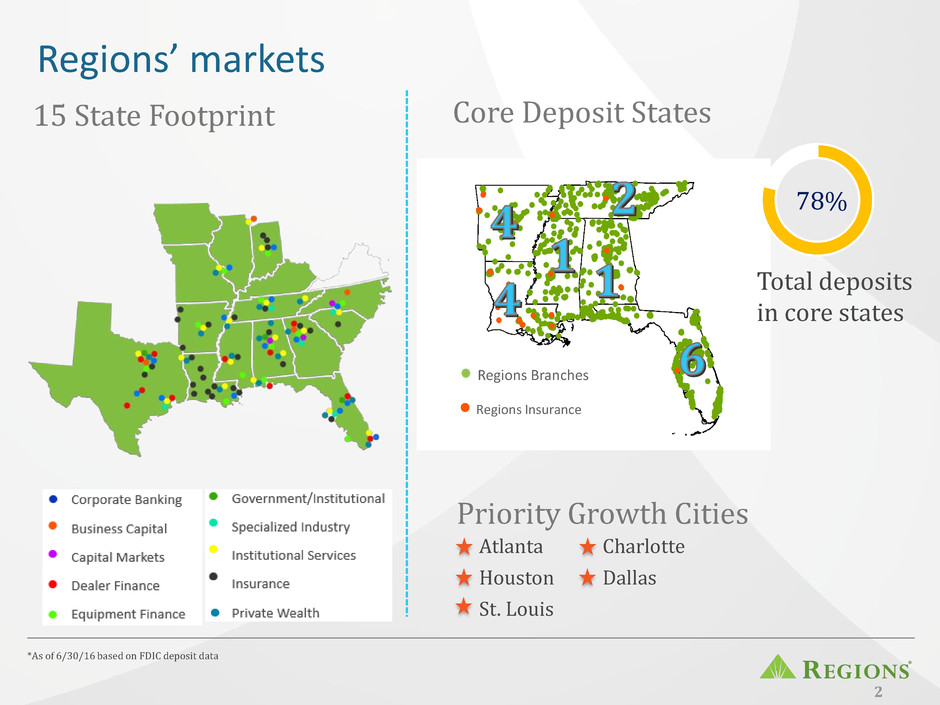
Regions Branches Regions Insurance Regions’ markets 2 *As of 6/30/16 based on FDIC deposit data 15 State Footprint Atlanta Houston St. Louis Core Deposit States Priority Growth Cities Total deposits in core states 78% Charlotte Dallas
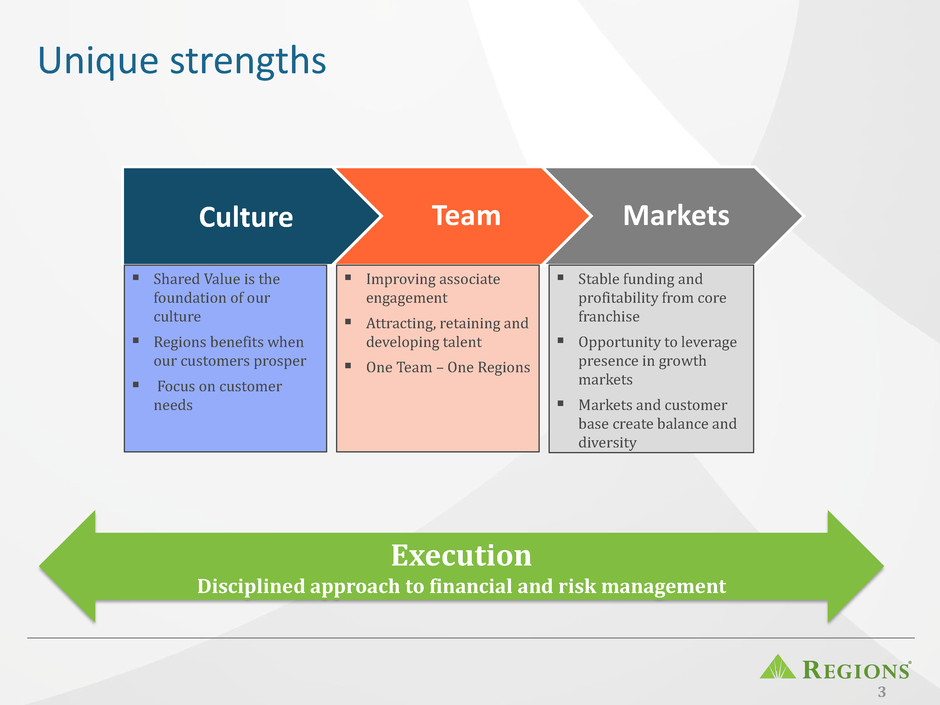
Unique strengths 3 Execution Disciplined approach to financial and risk management Culture Team Markets Shared Value is the foundation of our culture Regions benefits when our customers prosper Focus on customer needs Improving associate engagement Attracting, retaining and developing talent One Team – One Regions Stable funding and profitability from core franchise Opportunity to leverage presence in growth markets Markets and customer base create balance and diversity
4 Strength of culture Most Reputable Bank in the U.S. (2016) Gallup Great Workplace Award (2016) Regions has been recognized for executing on our strategy to “Build the Best Team” which includes creating a work environment that supports productivity and retention through engagement This workplace environment supports our customer approach which helped Regions earn the Reputation Institute award

Key assumptions & operating environment 5 Economy is expected to continue to improve at modest pace, with consumer spending the main driver of top-line GDP growth. Potential changes to fiscal and regulatory policy pose both upside and downside risks to growth; however, we believe there is more possibility to the upside. – Corporate tax reform changes could spark business investment – Downside risks mainly stem from potential disruptions to global trade Competition continues to grow outside of the traditional banking system Stable overall credit performance, but signs of stress in specific segments Cybersecurity remains an industry and customer concern
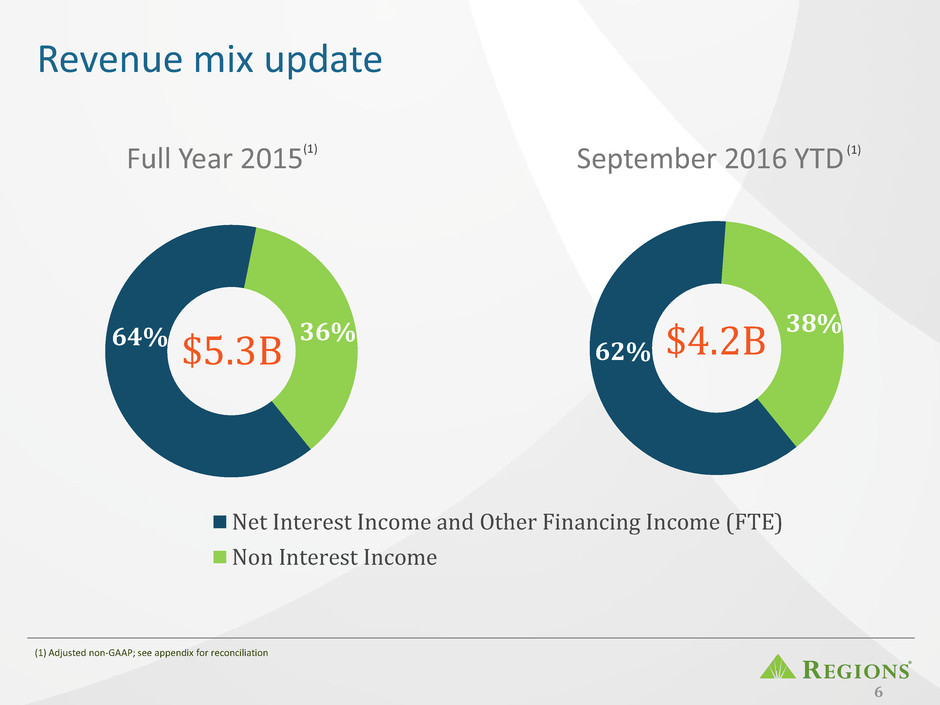
6 Revenue mix update 64% 36% (1) Adjusted non-GAAP; see appendix for reconciliation $5.3B $4.2B Full Year 2015 September 2016 YTD 62% 38% Net Interest Income and Other Financing Income (FTE) Non Interest Income (1) (1)
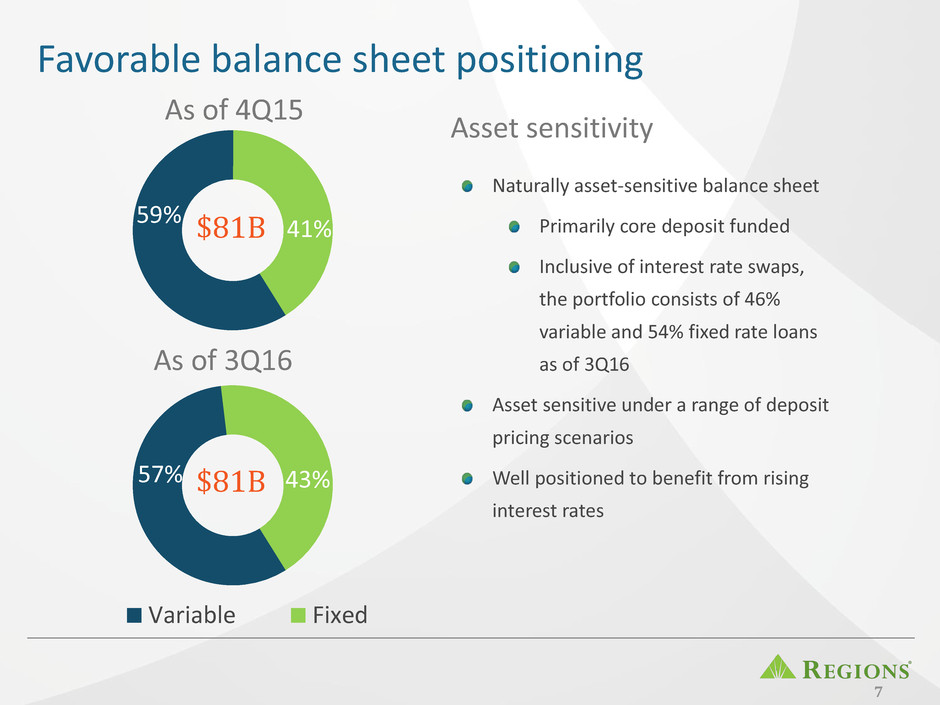
7 Favorable balance sheet positioning 57% 43% Variable Fixed Naturally asset-sensitive balance sheet Primarily core deposit funded Inclusive of interest rate swaps, the portfolio consists of 46% variable and 54% fixed rate loans as of 3Q16 Asset sensitive under a range of deposit pricing scenarios Well positioned to benefit from rising interest rates As of 4Q15 As of 3Q16 59% 41% $81B $81B Asset sensitivity
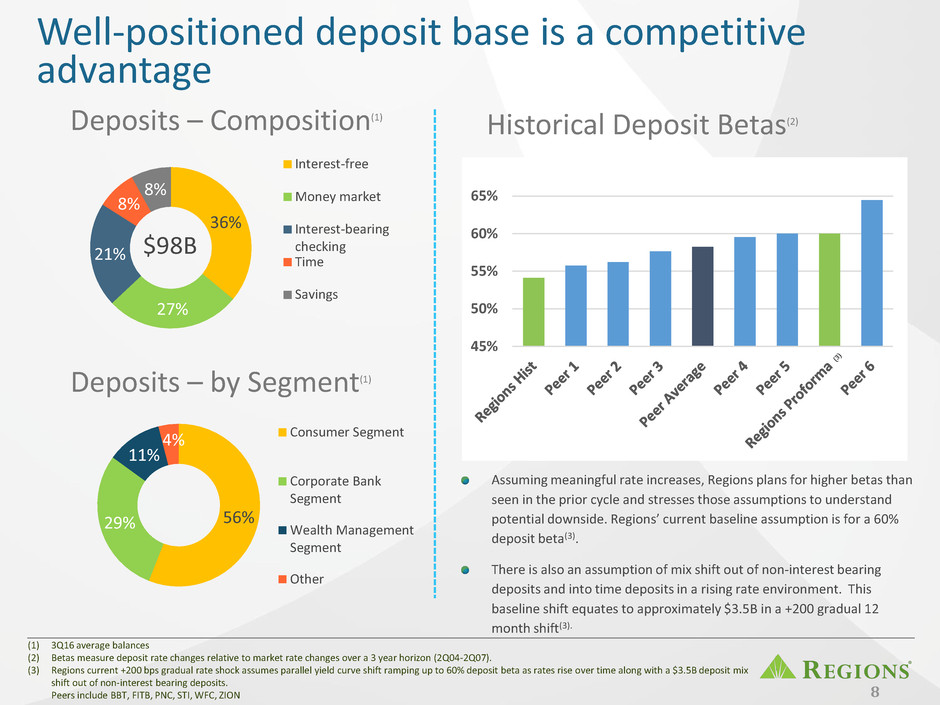
36% 27% 21% 8% 8% Interest-free Money market Interest-bearing checking Time Savings $98B 56% 29% 11% 4% Consumer Segment Corporate Bank Segment Wealth Management Segment Other Well-positioned deposit base is a competitive advantage Deposits – Composition(1) Deposits – by Segment(1) (1) 3Q16 average balances (2) Betas measure deposit rate changes relative to market rate changes over a 3 year horizon (2Q04-2Q07). (3) Regions current +200 bps gradual rate shock assumes parallel yield curve shift ramping up to 60% deposit beta as rates rise over time along with a $3.5B deposit mix shift out of non-interest bearing deposits. Peers include BBT, FITB, PNC, STI, WFC, ZION Historical Deposit Betas(2) 8 Assuming meaningful rate increases, Regions plans for higher betas than seen in the prior cycle and stresses those assumptions to understand potential downside. Regions’ current baseline assumption is for a 60% deposit beta(3). There is also an assumption of mix shift out of non-interest bearing deposits and into time deposits in a rising rate environment. This baseline shift equates to approximately $3.5B in a +200 gradual 12 month shift(3). 45% 50% 55% 60% 65%
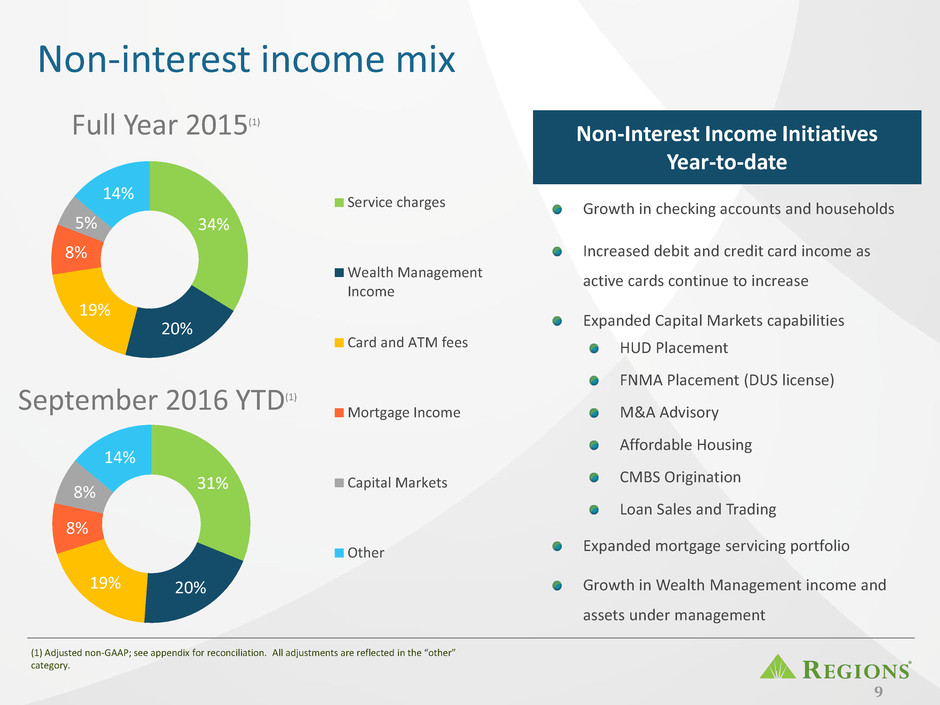
9 Non-interest income mix 34% 20% 19% 8% 5% 14% Full Year 2015(1) 31% 20% 19% 8% 8% 14% Service charges Wealth Management Income Card and ATM fees Mortgage Income Capital Markets Other September 2016 YTD(1) Non-Interest Income Initiatives Year-to-date Growth in checking accounts and households Increased debit and credit card income as active cards continue to increase Expanded Capital Markets capabilities HUD Placement FNMA Placement (DUS license) M&A Advisory Affordable Housing CMBS Origination Loan Sales and Trading Expanded mortgage servicing portfolio Growth in Wealth Management income and assets under management (1) Adjusted non-GAAP; see appendix for reconciliation. All adjustments are reflected in the “other” category.

Committed to improving efficiencies Customer Experience and Products Digitizing the Workforce Processes and Efficiency Leveraging and improving technology to improve efficiencies Elimination of core expenses of $400 million through 2019 Represents ~11.5% of 2015 adjusted expense base Evaluating opportunities to pull forward savings Expense eliminations driven by: Operational Efficiencies 60-65% 5% YTD reduction in staffing Branch and Real Estate Optimization 10-15% 2% YTD reduction in total square footage Announced plans to consolidate ~90 branches in 2016 Third-Party Discretionary & Other 25-30% 10
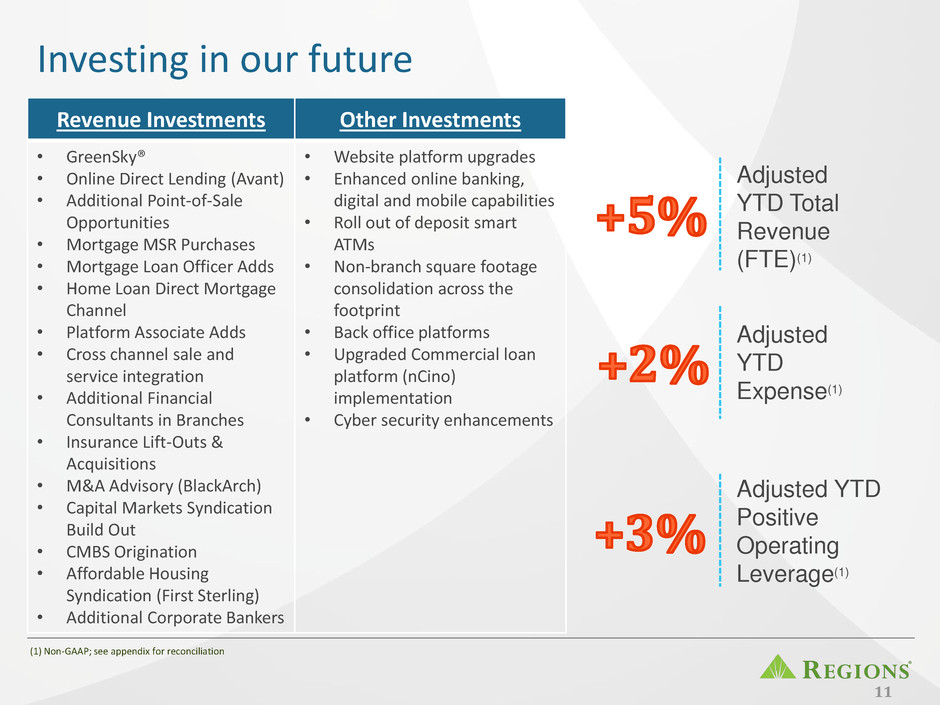
11 Investing in our future Revenue Investments Other Investments • GreenSky® • Online Direct Lending (Avant) • Additional Point-of-Sale Opportunities • Mortgage MSR Purchases • Mortgage Loan Officer Adds • Home Loan Direct Mortgage Channel • Platform Associate Adds • Cross channel sale and service integration • Additional Financial Consultants in Branches • Insurance Lift-Outs & Acquisitions • M&A Advisory (BlackArch) • Capital Markets Syndication Build Out • CMBS Origination • Affordable Housing Syndication (First Sterling) • Additional Corporate Bankers • Website platform upgrades • Enhanced online banking, digital and mobile capabilities • Roll out of deposit smart ATMs • Non-branch square footage consolidation across the footprint • Back office platforms • Upgraded Commercial loan platform (nCino) implementation • Cyber security enhancements Adjusted YTD Total Revenue (FTE)(1) Adjusted YTD Expense(1) Adjusted YTD Positive Operating Leverage(1) (1) Non-GAAP; see appendix for reconciliation
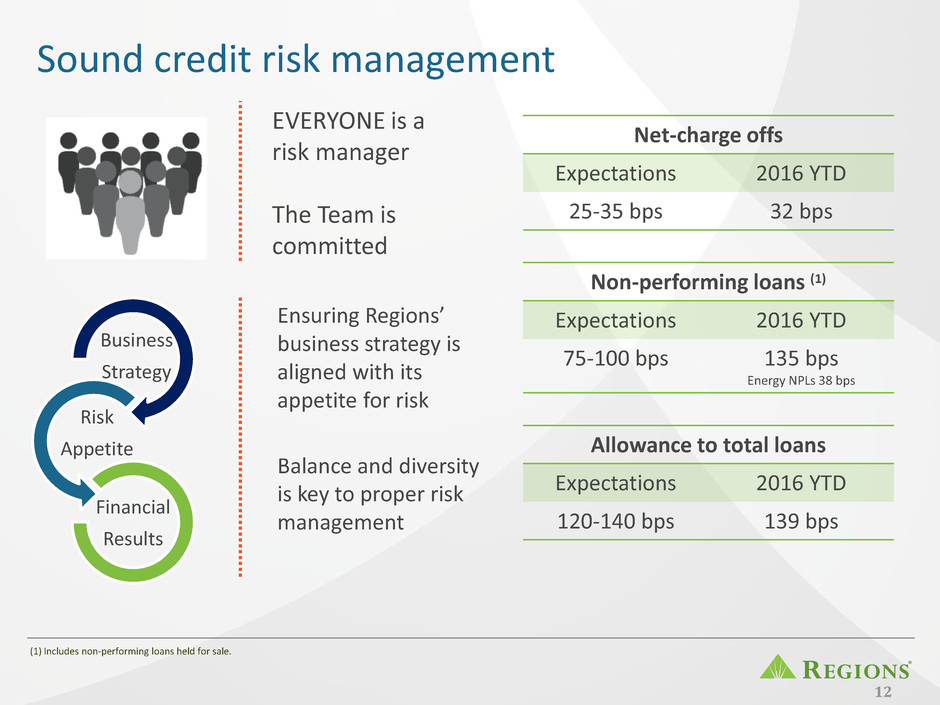
Sound credit risk management 12 EVERYONE is a risk manager The Team is committed Business Strategy Risk Appetite Financial Results Ensuring Regions’ business strategy is aligned with its appetite for risk Balance and diversity is key to proper risk management Net-charge offs Expectations 2016 YTD 25-35 bps 32 bps Non-performing loans (1) Expectations 2016 YTD 75-100 bps 135 bps Energy NPLs 38 bps Allowance to total loans Expectations 2016 YTD 120-140 bps 139 bps (1) Includes non-performing loans held for sale.
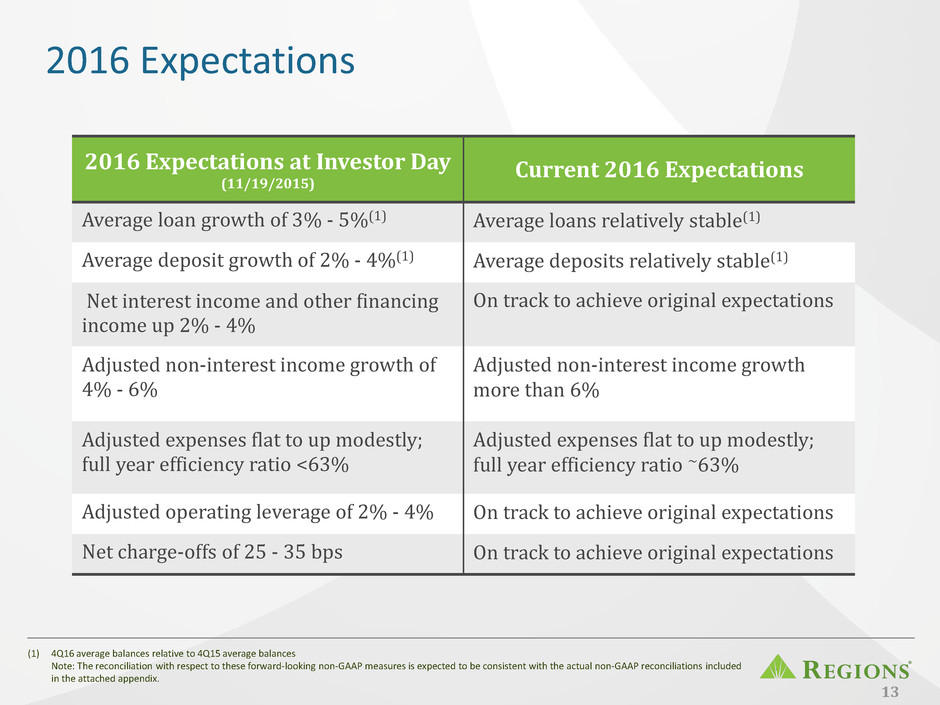
2016 Expectations 13 (1) 4Q16 average balances relative to 4Q15 average balances Note: The reconciliation with respect to these forward-looking non-GAAP measures is expected to be consistent with the actual non-GAAP reconciliations included in the attached appendix. 2016 Expectations at Investor Day (11/19/2015) Current 2016 Expectations Average loan growth of 3% - 5%(1) Average loans relatively stable(1) Average deposit growth of 2% - 4%(1) Average deposits relatively stable(1) Net interest income and other financing income up 2% - 4% On track to achieve original expectations Adjusted non-interest income growth of 4% - 6% Adjusted non-interest income growth more than 6% Adjusted expenses flat to up modestly; full year efficiency ratio <63% Adjusted expenses flat to up modestly; full year efficiency ratio ~63% Adjusted operating leverage of 2% - 4% On track to achieve original expectations Net charge-offs of 25 - 35 bps On track to achieve original expectations
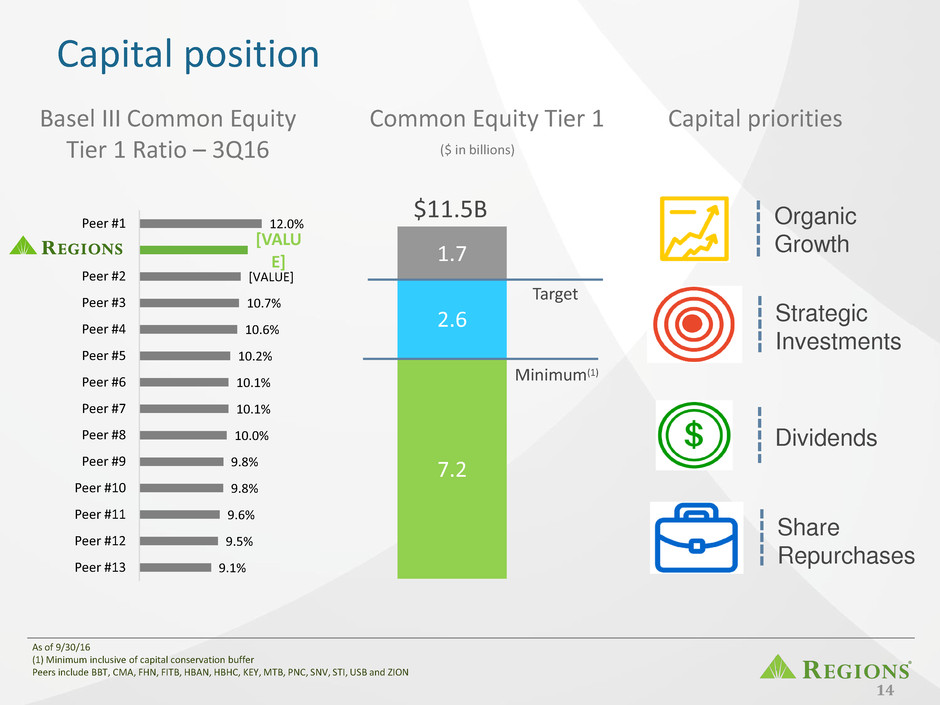
Capital position 14 9.1% 9.5% 9.6% 9.8% 9.8% 10.0% 10.1% 10.1% 10.2% 10.6% 10.7% [VALUE] [VALU E] 12.0% Peer #13 Peer #12 Peer #11 Peer #10 Peer #9 Peer #8 Peer #7 Peer #6 Peer #5 Peer #4 Peer #3 Peer #2 Peer #1 Dividends Organic Growth Strategic Investments Share Repurchases Capital priorities Common Equity Tier 1 Basel III Common Equity Tier 1 Ratio – 3Q16 As of 9/30/16 (1) Minimum inclusive of capital conservation buffer Peers include BBT, CMA, FHN, FITB, HBAN, HBHC, KEY, MTB, PNC, SNV, STI, USB and ZION 7.2 2.6 1.7 Minimum(1) Target $11.5B ($ in billions)

2016-2018 Long-term expected results 15 Adjusted EPS growth of 12-15% (CAGR) Adjusted efficiency ratio of <60% by 2018 Adjusted ROATCE 12-14% by 2018
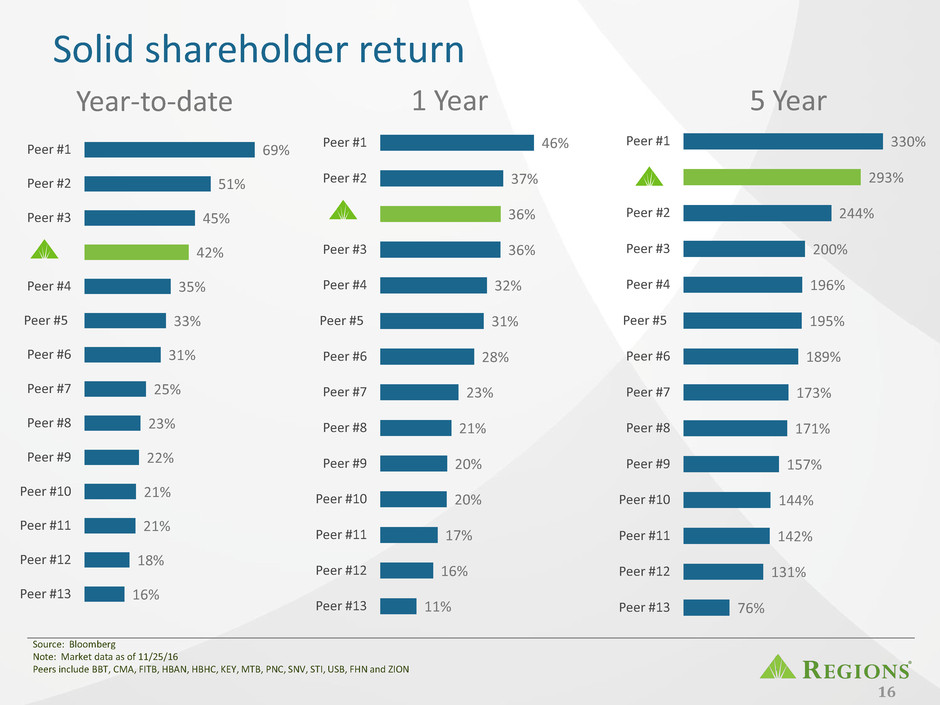
Solid shareholder return 16 16% 18% 21% 21% 22% 23% 25% 31% 33% 35% 42% 45% 51% 69% Peer #13 Peer #12 Peer #11 Peer #10 Peer #9 Peer #8 Peer #7 Peer #6 Peer #5 Peer #4 Peer #3 Peer #2 Peer #1 11% 16% 17% 20% 20% 21% 23% 28% 31% 32% 36% 36% 37% 46% Peer #13 Peer #12 Peer #11 Peer #10 Peer #9 Peer #8 Peer #7 Peer #6 Peer #5 Peer #4 Peer #3 Peer #2 Peer #1 Year-to-date 1 Year 5 Year Source: Bloomberg Note: Market data as of 11/25/16 Peers include BBT, CMA, FITB, HBAN, HBHC, KEY, MTB, PNC, SNV, STI, USB, FHN and ZION 76% 131% 142% 144% 157% 171% 173% 189% 195% 196% 200% 244% 293% 330% Peer #13 Peer #12 Peer #11 Peer #10 Peer #9 Peer #8 Peer #7 Peer #6 Peer #5 Peer #4 Peer #3 Peer #2 Peer #1
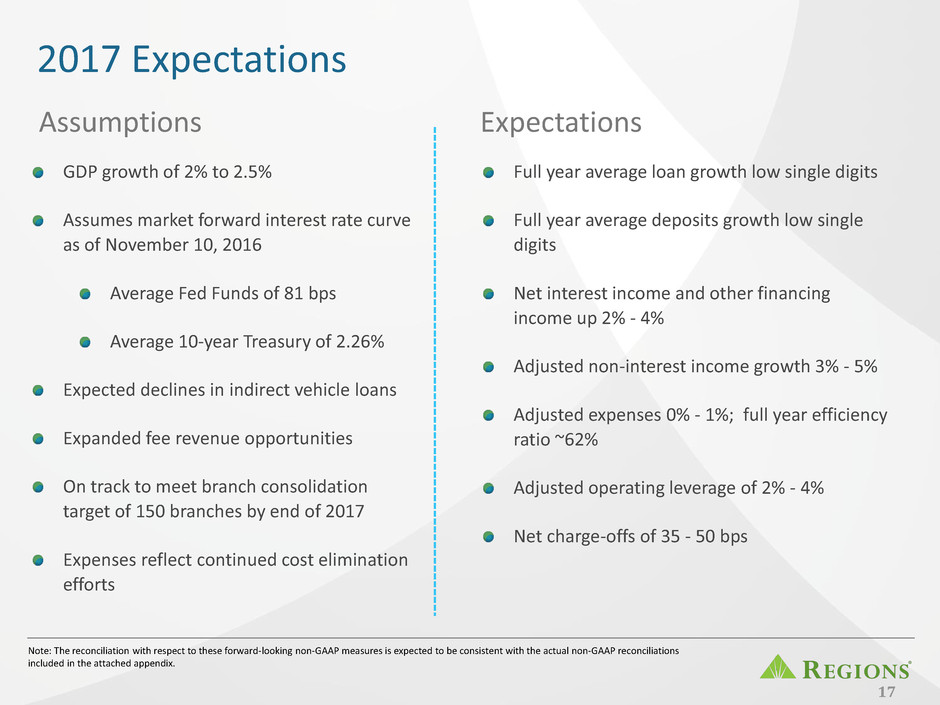
2017 Expectations 17 Full year average loan growth low single digits Full year average deposits growth low single digits Net interest income and other financing income up 2% - 4% Adjusted non-interest income growth 3% - 5% Adjusted expenses 0% - 1%; full year efficiency ratio ~62% Adjusted operating leverage of 2% - 4% Net charge-offs of 35 - 50 bps Note: The reconciliation with respect to these forward-looking non-GAAP measures is expected to be consistent with the actual non-GAAP reconciliations included in the attached appendix. Expectations Assumptions GDP growth of 2% to 2.5% Assumes market forward interest rate curve as of November 10, 2016 Average Fed Funds of 81 bps Average 10-year Treasury of 2.26% Expected declines in indirect vehicle loans Expanded fee revenue opportunities On track to meet branch consolidation target of 150 branches by end of 2017 Expenses reflect continued cost elimination efforts
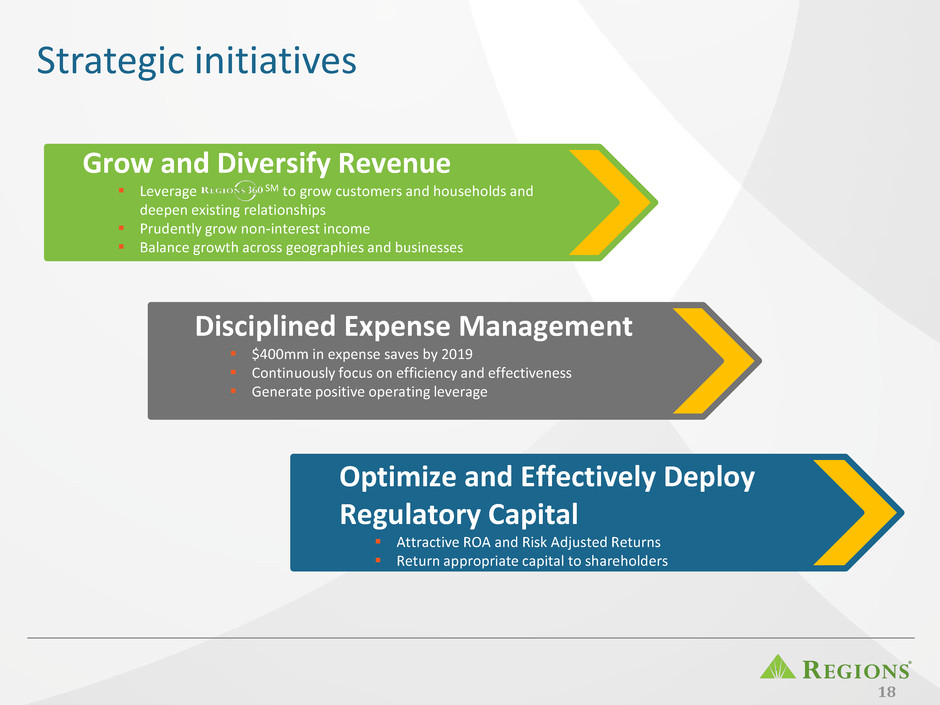
Strategic initiatives Optimize and Effectively Deploy Regulatory Capital Attractive ROA and Risk Adjusted Returns Return appropriate capital to shareholders Disciplined Expense Management $400mm in expense saves by 2019 Continuously focus on efficiency and effectiveness Generate positive operating leverage Grow and Diversify Revenue Leverage SM to grow customers and households and deepen existing relationships Prudently grow non-interest income Balance growth across geographies and businesses 18

Executing our strategic initiatives 19 Grow and Diversify Revenue Disciplined Expense Management Optimize and Effectively Deploy Regulatory Capital Efficiency Challenge Integration of Acquisitions Balance Sheet Optimization Expansion of Key Lending Partnerships Syndication Build-out Retail Network Strategy Treasury Capital Actions

Appendix 20
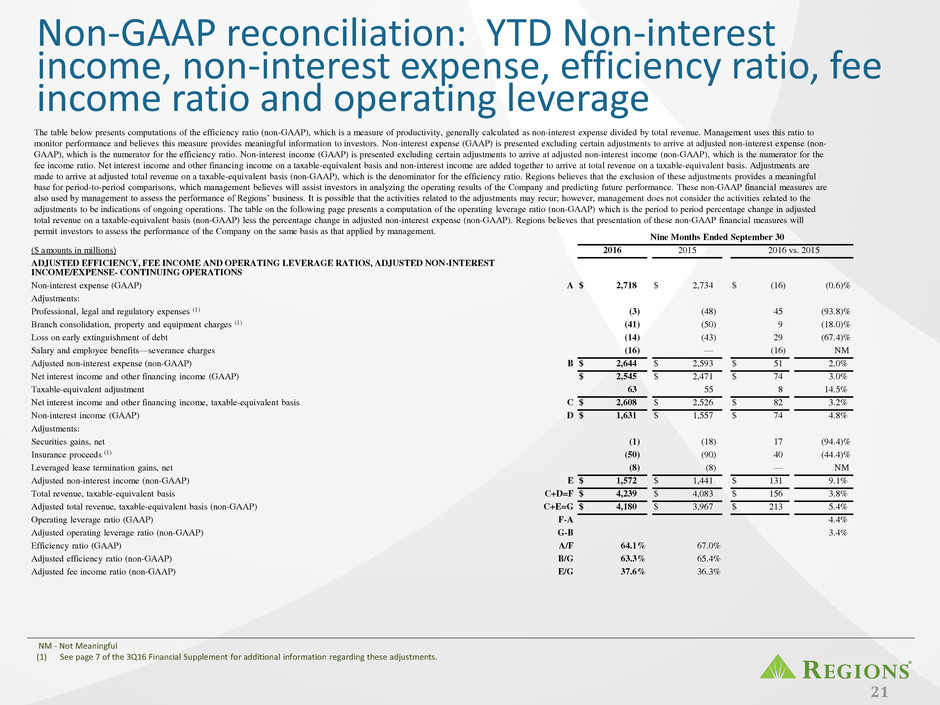
Non-GAAP reconciliation: YTD Non-interest income, non-interest expense, efficiency ratio, fee income ratio and operating leverage Nine Months Ended September 30 ($ amounts in millions) 2016 2015 2016 vs. 2015 ADJUSTED EFFICIENCY, FEE INCOME AND OPERATING LEVERAGE RATIOS, ADJUSTED NON-INTEREST INCOME/EXPENSE- CONTINUING OPERATIONS Non-interest expense (GAAP) A $ 2,718 $ 2,734 $ (16 ) (0.6 )% Adjustments: Professional, legal and regulatory expenses (1) (3 ) (48 ) 45 (93.8 )% Branch consolidation, property and equipment charges (1) (41 ) (50 ) 9 (18.0 )% Loss on early extinguishment of debt (14 ) (43 ) 29 (67.4 )% Salary and employee benefits—severance charges (16 ) — (16 ) NM Adjusted non-interest expense (non-GAAP) B $ 2,644 $ 2,593 $ 51 2.0 % Net interest income and other financing income (GAAP) $ 2,545 $ 2,471 $ 74 3.0 % Taxable-equivalent adjustment 63 55 8 14.5 % Net interest income and other financing income, taxable-equivalent basis C $ 2,608 $ 2,526 $ 82 3.2 % Non-interest income (GAAP) D $ 1,631 $ 1,557 $ 74 4.8 % Adjustments: Securities gains, net (1 ) (18 ) 17 (94.4 )% Insurance proceeds (1) (50 ) (90 ) 40 (44.4 )% Leveraged lease termination gains, net (8 ) (8 ) — NM Adjusted non-interest income (non-GAAP) E $ 1,572 $ 1,441 $ 131 9.1 % Total revenue, taxable-equivalent basis C+D=F $ 4,239 $ 4,083 $ 156 3.8 % Adjusted total revenue, taxable-equivalent basis (non-GAAP) C+E=G $ 4,180 $ 3,967 $ 213 5.4 % Operating leverage ratio (GAAP) F-A 4.4 % Adjusted operating leverage ratio (non-GAAP) G-B 3.4 % Efficiency ratio (GAAP) A/F 64.1 % 67.0 % Adjusted efficiency ratio (non-GAAP) B/G 63.3 % 65.4 % Adjusted fee income ratio (non-GAAP) E/G 37.6 % 36.3 % 21 NM - Not Meaningful (1) See page 7 of the 3Q16 Financial Supplement for additional information regarding these adjustments. The table below presents computations of the efficiency ratio (non-GAAP), which is a measure of productivity, generally calculated as non-interest expense divided by total revenue. Management uses this ratio to monitor performance and believes this measure provides meaningful information to investors. Non-interest expense (GAAP) is presented excluding certain adjustments to arrive at adjusted non-interest expense (non- GAAP), which is the numerator for the efficiency ratio. Non-interest income (GAAP) is presented excluding certain adjustments to arrive at adjusted non-interest income (non-GAAP), which is the numerator for the fee income ratio. Net interest income and other financing income on a taxable-equivalent basis and non-interest income are added together to arrive at total revenue on a taxable-equivalent basis. Adjustments are made to arrive at adjusted total revenue on a taxable-equivalent basis (non-GAAP), which is the denominator for the efficiency ratio. Regions believes that the exclusion of these adjustments provides a meaningful base for period-to-period comparisons, which management believes will assist investors in analyzing the operating results of the Company and predicting future performance. These non-GAAP financial measures are also used by management to assess the performance of Regions’ business. It is possible that the activities related to the adjustments may recur; however, management does not consider the activities related to the adjustments to be indications of ongoing operations. The table on the following page presents a computation of the operating leverage ratio (non-GAAP) which is the period to period percentage change in adjusted total revenue on a taxable-equivalent basis (non-GAAP) less the percentage change in adjusted non-interest expense (non-GAAP). Regions believes that presentation of these non-GAAP financial measures will permit investors to assess the performance of the Company on the same basis as that applied by management.
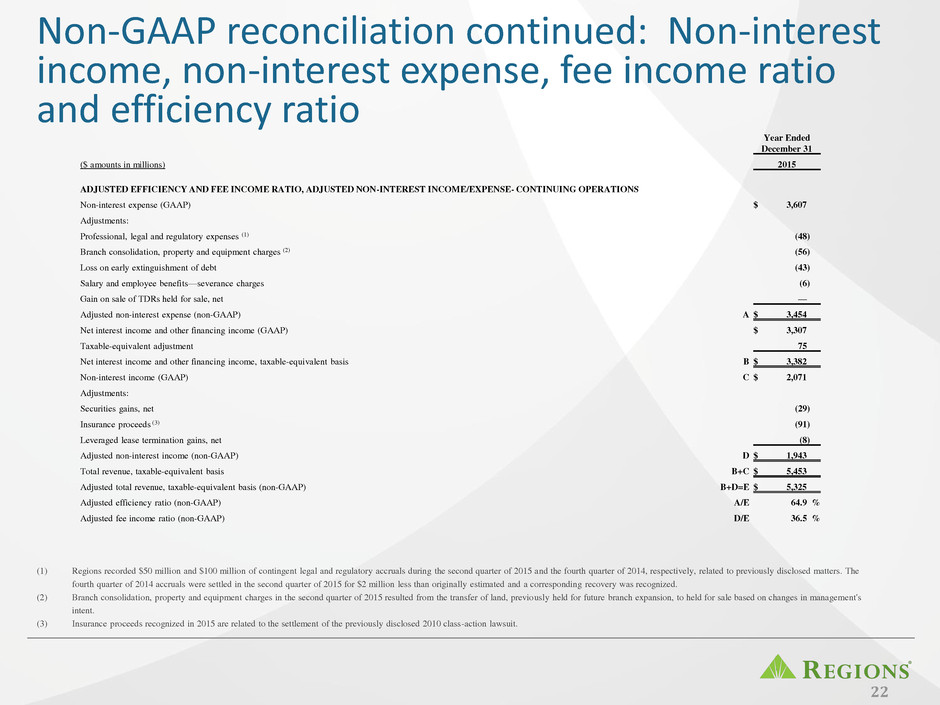
Non-GAAP reconciliation continued: Non-interest income, non-interest expense, fee income ratio and efficiency ratio 22 Year Ended December 31 ($ amounts in millions) 2015 ADJUSTED EFFICIENCY AND FEE INCOME RATIO, ADJUSTED NON-INTEREST INCOME/EXPENSE- CONTINUING OPERATIONS Non-interest expense (GAAP) $ 3,607 Adjustments: Professional, legal and regulatory expenses (1) (48 ) Branch consolidation, property and equipment charges (2) (56 ) Loss on early extinguishment of debt (43 ) Salary and employee benefits—severance charges (6 ) Gain on sale of TDRs held for sale, net — Adjusted non-interest expense (non-GAAP) A $ 3,454 Net interest income and other financing income (GAAP) $ 3,307 Taxable-equivalent adjustment 75 Net interest income and other financing income, taxable-equivalent basis B $ 3,382 Non-interest income (GAAP) C $ 2,071 Adjustments: Securities gains, net (29 ) Insurance proceeds (3) (91 ) Leveraged lease termination gains, net (8 ) Adjusted non-interest income (non-GAAP) D $ 1,943 Total revenue, taxable-equivalent basis B+C $ 5,453 Adjusted total revenue, taxable-equivalent basis (non-GAAP) B+D=E $ 5,325 Adjusted efficiency ratio (non-GAAP) A/E 64.9 % Adjusted fee income ratio (non-GAAP) D/E 36.5 % (1) Regions recorded $50 million and $100 million of contingent legal and regulatory accruals during the second quarter of 2015 and the fourth quarter of 2014, respectively, related to previously disclosed matters. The fourth quarter of 2014 accruals were settled in the second quarter of 2015 for $2 million less than originally estimated and a corresponding recovery was recognized. (2) Branch consolidation, property and equipment charges in the second quarter of 2015 resulted from the transfer of land, previously held for future branch expansion, to held for sale based on changes in management's intent. (3) Insurance proceeds recognized in 2015 are related to the settlement of the previously disclosed 2010 class-action lawsuit.
Forward-looking statements This presentation may include forward-looking statements, as defined in the Private Securities Litigation Reform Act of 1995, which reflect Regions’ current views with respect to future events and financial performance. Forward-looking statements are not based on historical information, but rather are related to future operations, strategies, financial results or other developments. Forward-looking statements are based on management’s expectations as well as certain assumptions and estimates made by, and information available to, management at the time the statements are made. Those statements are based on general assumptions and are subject to various risks, uncertainties and other factors that may cause actual results to differ materially from the views, beliefs and projections expressed in such statements. These risks, uncertainties and other factors include, but are not limited to, those described below: • Current and future economic and market conditions in the United States generally or in the communities we serve, including the effects of declines in property values, unemployment rates and potential reductions of economic growth, which may adversely affect our lending and other businesses and our financial results and conditions. • Possible changes in trade, monetary and fiscal policies of, and other activities undertaken by, governments, agencies, central banks and similar organizations, which could have a material adverse effect on our earnings. • The effects of a possible downgrade in the U.S. government’s sovereign credit rating or outlook, which could result in risks to us and general economic conditions that we are not able to predict. • Possible changes in market interest rates or capital markets could adversely affect our revenue and expense, the value of assets and obligations, and the availability and cost of capital and liquidity. • Any impairment of our goodwill or other intangibles, or any adjustment of valuation allowances on our deferred tax assets due to adverse changes in the economic environment, declining operations of the reporting unit, or other factors. • Possible changes in the creditworthiness of customers and the possible impairment of the collectability of loans. • Changes in the speed of loan prepayments, loan origination and sale volumes, charge-offs, loan loss provisions or actual loan losses where our allowance for loan losses may not be adequate to cover our eventual losses. • Possible acceleration of prepayments on mortgage-backed securities due to low interest rates, and the related acceleration of premium amortization on those securities. • Our ability to effectively compete with other financial services companies, some of whom possess greater financial resources than we do and are subject to different regulatory standards than we are. • Loss of customer checking and savings account deposits as customers pursue other, higher-yield investments, which could increase our funding costs. • Our inability to develop and gain acceptance from current and prospective customers for new products and services in a timely manner could have a negative impact on our revenue. • The effects of any developments, changes or actions relating to any litigation or regulatory proceedings brought against us or any of our subsidiaries. • Changes in laws and regulations affecting our businesses, such as the Dodd-Frank Act and other legislation and regulations relating to bank products and services, as well as changes in the enforcement and interpretation of such laws and regulations by applicable governmental and self-regulatory agencies, which could require us to change certain business practices, increase compliance risk, reduce our revenue, impose additional costs on us, or otherwise negatively affect our businesses. • Our ability to obtain a regulatory non-objection (as part of the CCAR process or otherwise) to take certain capital actions, including paying dividends and any plans to increase common stock dividends, repurchase common stock under current or future programs, or redeem preferred stock or other regulatory capital instruments, may impact our ability to return capital to stockholders and market perceptions of us. • Our ability to comply with stress testing and capital planning requirements (as part of the CCAR process or otherwise) may continue to require a significant investment of our managerial resources due to the importance and intensity of such tests and requirements. • Our ability to comply with applicable capital and liquidity requirements (including, among other things, the Basel III capital standards and the LCR rule), including our ability to generate capital internally or raise capital on favorable terms, and if we fail to meet requirements, our financial condition could be negatively impacted. • The Basel III framework calls for additional risk-based capital surcharges for globally systemically important banks. Although we are not subject to such surcharges, it is possible that in the future we may become subject to similar surcharges. • The costs, including possibly incurring fines, penalties, or other negative effects (including reputational harm) of any adverse judicial, administrative, or arbitral rulings or proceedings, regulatory enforcement actions, or other legal actions to which we or any of our subsidiaries are a party, and which may adversely affect our results. • Our ability to manage fluctuations in the value of assets and liabilities and off-balance sheet exposure so as to maintain sufficient capital and liquidity to support our business. • Our ability to execute on our strategic and operational plans, including our ability to fully realize the financial and non-financial benefits relating to our strategic initiatives. • The success of our marketing efforts in attracting and retaining customers. • Possible changes in consumer and business spending and saving habits and the related effect on our ability to increase assets and to attract deposits, which could adversely affect our net income. • Our ability to recruit and retain talented and experienced personnel to assist in the development, management and operation of our products and services may be affected by changes in laws and regulations in effect from time to time. • Fraud or misconduct by our customers, employees or business partners. 23

Forward-looking statements continued The foregoing list of factors is not exhaustive. For discussion of these and other factors that may cause actual results to differ from expectations, look under the captions “Forward-Looking Statements” and “Risk Factors" of Regions' Annual Report on Form 10-K for the year ended December 31, 2015, as filed with the Securities and Exchange Commission. The words “anticipates,” “intends,” “plans,” “seeks,” “believes,” “estimates,” “expects,” “targets,” “projects,” “outlook,” “forecast,” “will,” “may,” “could,” “should,” “can,” and similar expressions often signify forward-looking statements. You should not place undue reliance on any forward-looking statements, which speak only as of the date made. We assume no obligation to update or revise any forward- looking statements that are made from time to time. • Any inaccurate or incomplete information provided to us by our customers or counterparties. • The risks and uncertainties related to our acquisition and integration of other companies. • Inability of our framework to manage risks associated with our business such as credit risk and operational risk, including third-party vendors and other service providers, which could, among other things, result in a breach of operating or security systems as a result of a cyber attack or similar act. • The inability of our internal disclosure controls and procedures to prevent, detect or mitigate any material errors or fraudulent acts. • The effects of geopolitical instability, including wars, conflicts and terrorist attacks and the potential impact, directly or indirectly, on our businesses. • The effects of man-made and natural disasters, including fires, floods, droughts, tornadoes, hurricanes, and environmental damage, which may negatively affect our operations and/or our loan portfolios and increase our cost of conducting business. • Changes in commodity market prices and conditions could adversely affect the cash flows of our borrowers operating in industries that are impacted by changes in commodity prices (including businesses indirectly impacted by commodities prices such as businesses that transport commodities or manufacture equipment used in the production of commodities), which could impair their ability to service any loans outstanding to them and/or reduce demand for loans in those industries. • Our inability to keep pace with technological changes could result in losing business to competitors. • Our ability to identify and address cyber-security risks such as data security breaches, “denial of service” attacks, “hacking” and identity theft, a failure of which could disrupt our business and result in the disclosure of and/or misuse or misappropriation of confidential or proprietary information; disruption or damage to our systems; increased costs; losses; or adverse effects to our reputation. • Our ability to realize our efficiency ratio target as part of our expense management initiatives. • Significant disruption of, or loss of public confidence in, the Internet and services and devices used to access the Internet could affect the ability of our customers to access their accounts and conduct banking transactions. • Possible downgrades in our credit ratings or outlook could increase the costs of funding from capital markets. • The effects of problems encountered by other financial institutions that adversely affect us or the banking industry generally could require us to change certain business practices, reduce our revenue, impose additional costs on us, or otherwise negatively affect our businesses. • The effects of the failure of any component of our business infrastructure provided by a third party could disrupt our businesses; result in the disclosure of and/or misuse of confidential information or proprietary information; increase our costs; negatively affect our reputation; and cause losses. • Our ability to receive dividends from our subsidiaries could affect our liquidity and ability to pay dividends to stockholders. • Changes in accounting policies or procedures as may be required by the FASB or other regulatory agencies could materially affect how we report our financial results. • Other risks identified from time to time in reports that we file with the SEC. • The effects of any damage to our reputation resulting from developments related to any of the items identified above. 24

® 25


