Exhibit 99.3 3rd Quarter Earnings Conference Call October 22, 2019
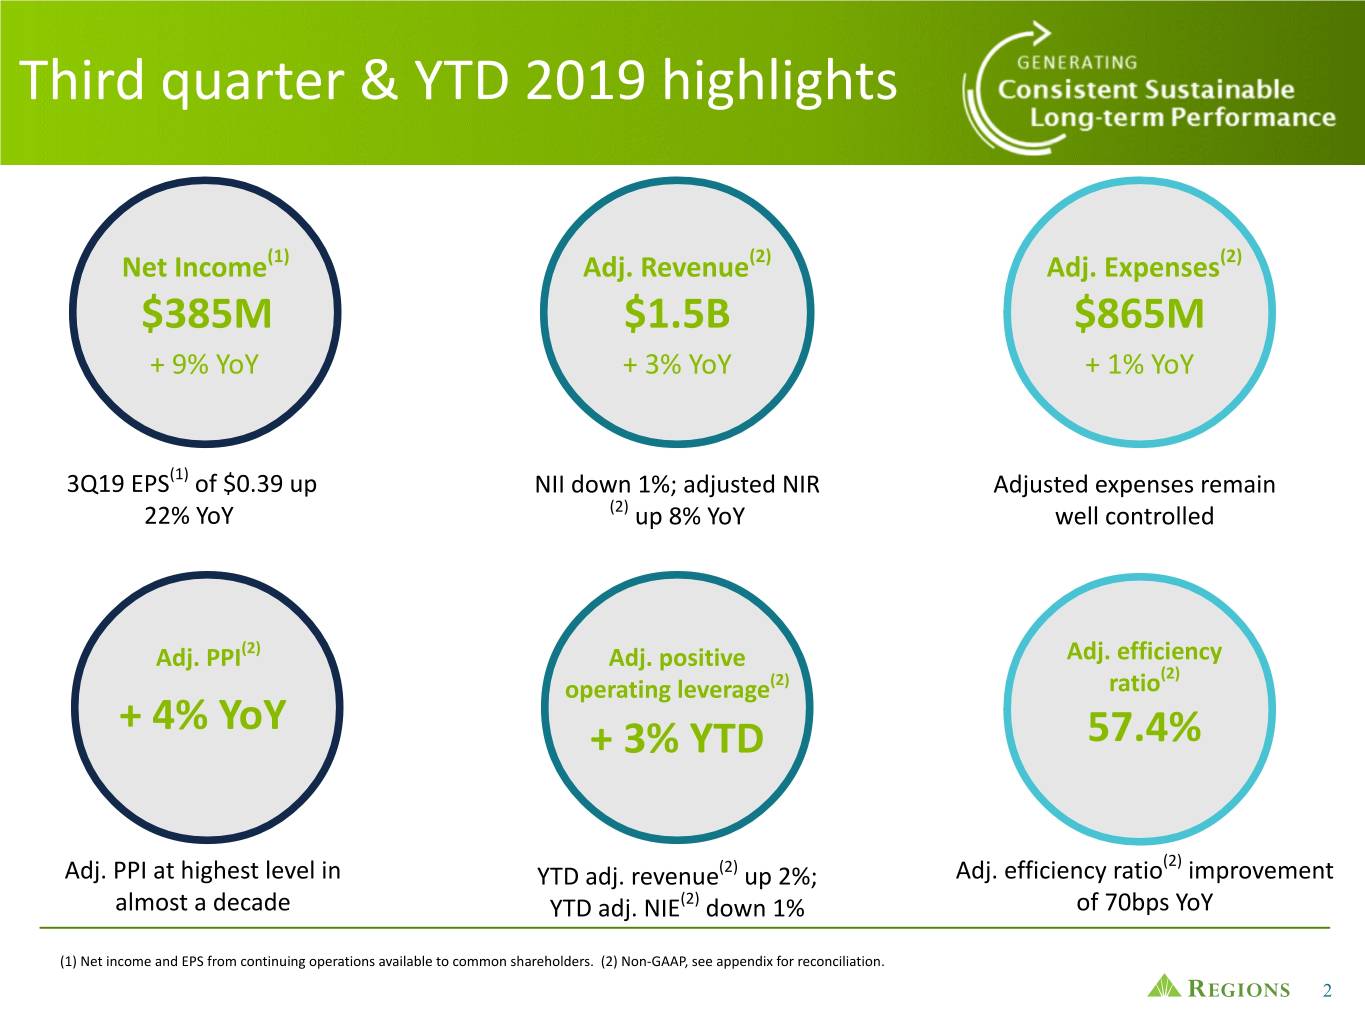
Third quarter & YTD 2019 highlights Net Income(1) Adj. Revenue(2) Adj. Expenses(2) $385M $1.5B $865M + 9% YoY + 3% YoY + 1% YoY 3Q19 EPS(1) of $0.39 up NII down 1%; adjusted NIR Adjusted expenses remain 22% YoY (2) up 8% YoY well controlled Adj. PPI(2) Adj. positive Adj. efficiency (2) operating leverage(2) ratio + 4% YoY + 3% YTD 57.4% (2) Adj. PPI at highest level in YTD adj. revenue(2) up 2%; Adj. efficiency ratio improvement almost a decade YTD adj. NIE(2) down 1% of 70bps YoY (1) Net income and EPS from continuing operations available to common shareholders. (2) Non-GAAP, see appendix for reconciliation. 2

Delivering consistent performance Interest Rate Proactive strategic hedging Sensitivity program Credit Risk Balance sheet de-risking & Framework optimization Capital Allocation Focused on risk-adjusted returns Improving Simplify and Grow, technology, Efficiency priority markets, and efficiency 3
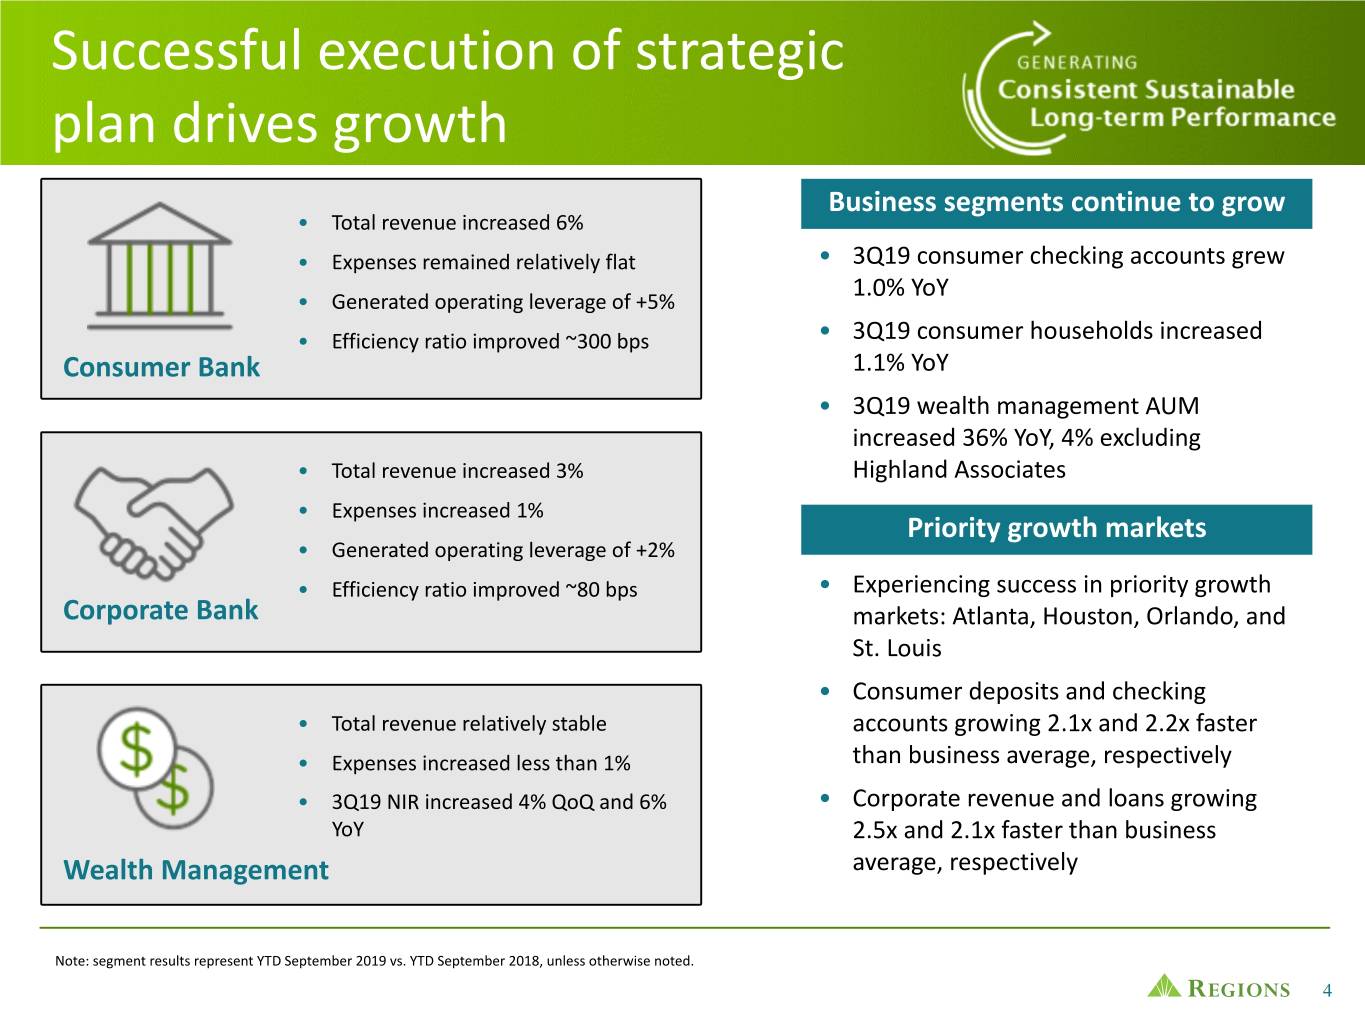
Successful execution of strategic plan drives growth Business segments continue to grow • Total revenue increased 6% • Expenses remained relatively flat • 3Q19 consumer checking accounts grew 1.0% YoY • Generated operating leverage of +5% • Efficiency ratio improved ~300 bps • 3Q19 consumer households increased Consumer Bank 1.1% YoY • 3Q19 wealth management AUM increased 36% YoY, 4% excluding • Total revenue increased 3% Highland Associates • Expenses increased 1% Priority growth markets • Generated operating leverage of +2% • Efficiency ratio improved ~80 bps • Experiencing success in priority growth Corporate Bank markets: Atlanta, Houston, Orlando, and St. Louis • Consumer deposits and checking • Total revenue relatively stable accounts growing 2.1x and 2.2x faster • Expenses increased less than 1% than business average, respectively • 3Q19 NIR increased 4% QoQ and 6% • Corporate revenue and loans growing YoY 2.5x and 2.1x faster than business Wealth Management average, respectively Note: segment results represent YTD September 2019 vs. YTD September 2018, unless otherwise noted. 4
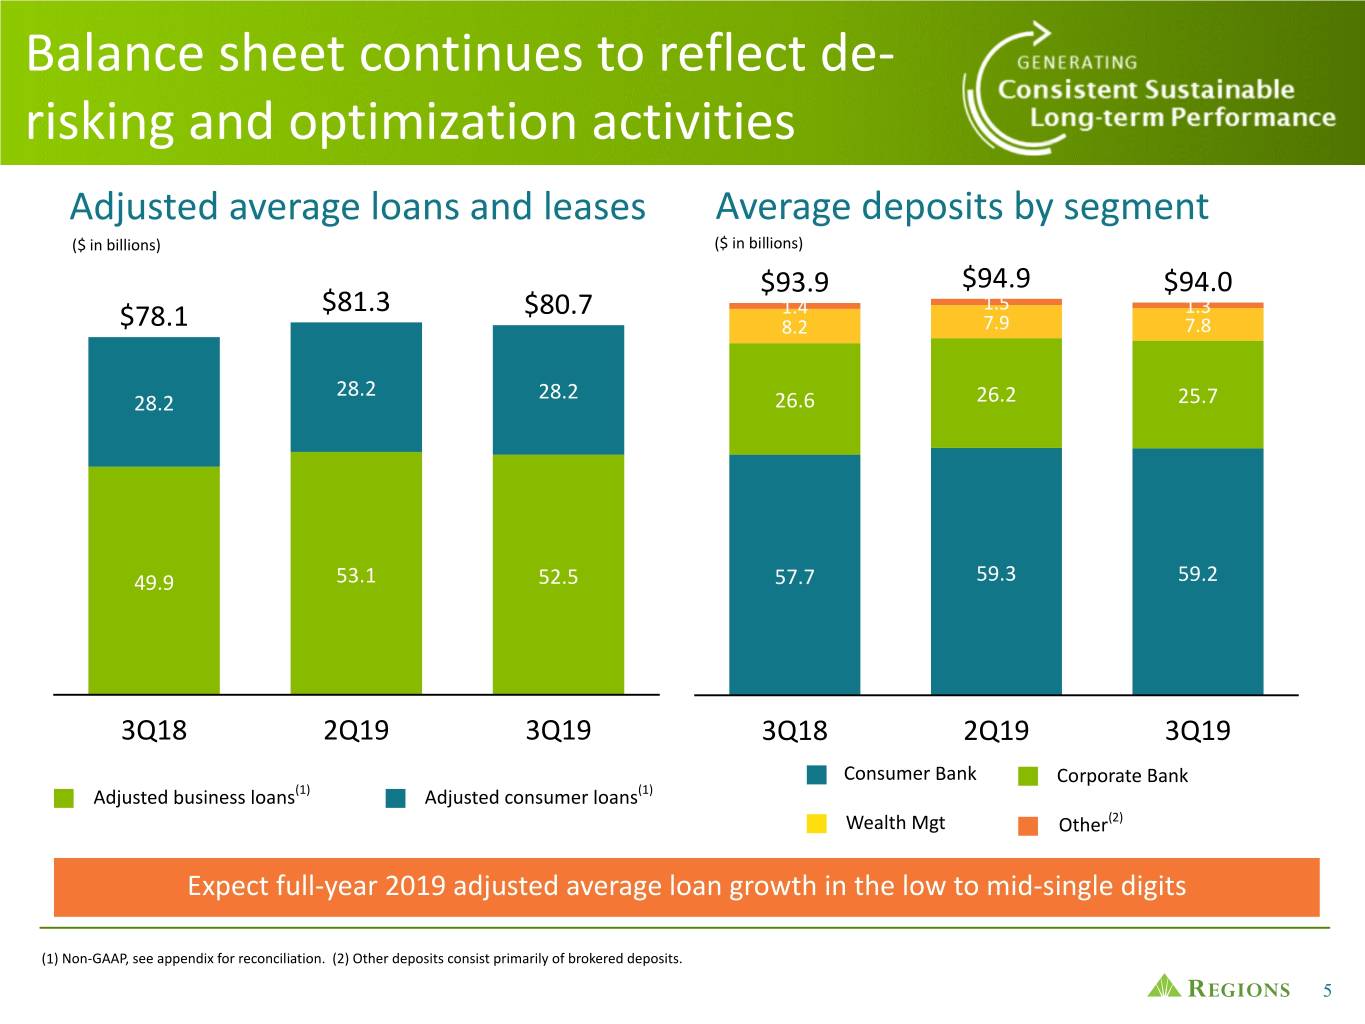
Balance sheet continues to reflect de- risking and optimization activities Adjusted average loans and leases Average deposits by segment ($ in billions) ($ in billions) $93.9 $94.9 $94.0 $81.3 $80.7 1.4 1.5 1.3 $78.1 8.2 7.9 7.8 28.2 28.2 28.2 26.6 26.2 25.7 49.9 53.1 52.5 57.7 59.3 59.2 3Q18 2Q19 3Q19 3Q18 2Q19 3Q19 Consumer Bank Corporate Bank Adjusted business loans(1) Adjusted consumer loans(1) Wealth Mgt Other(2) Expect full-year 2019 adjusted average loan growth in the low to mid-single digits (1) Non-GAAP, see appendix for reconciliation. (2) Other deposits consist primarily of brokered deposits. 5
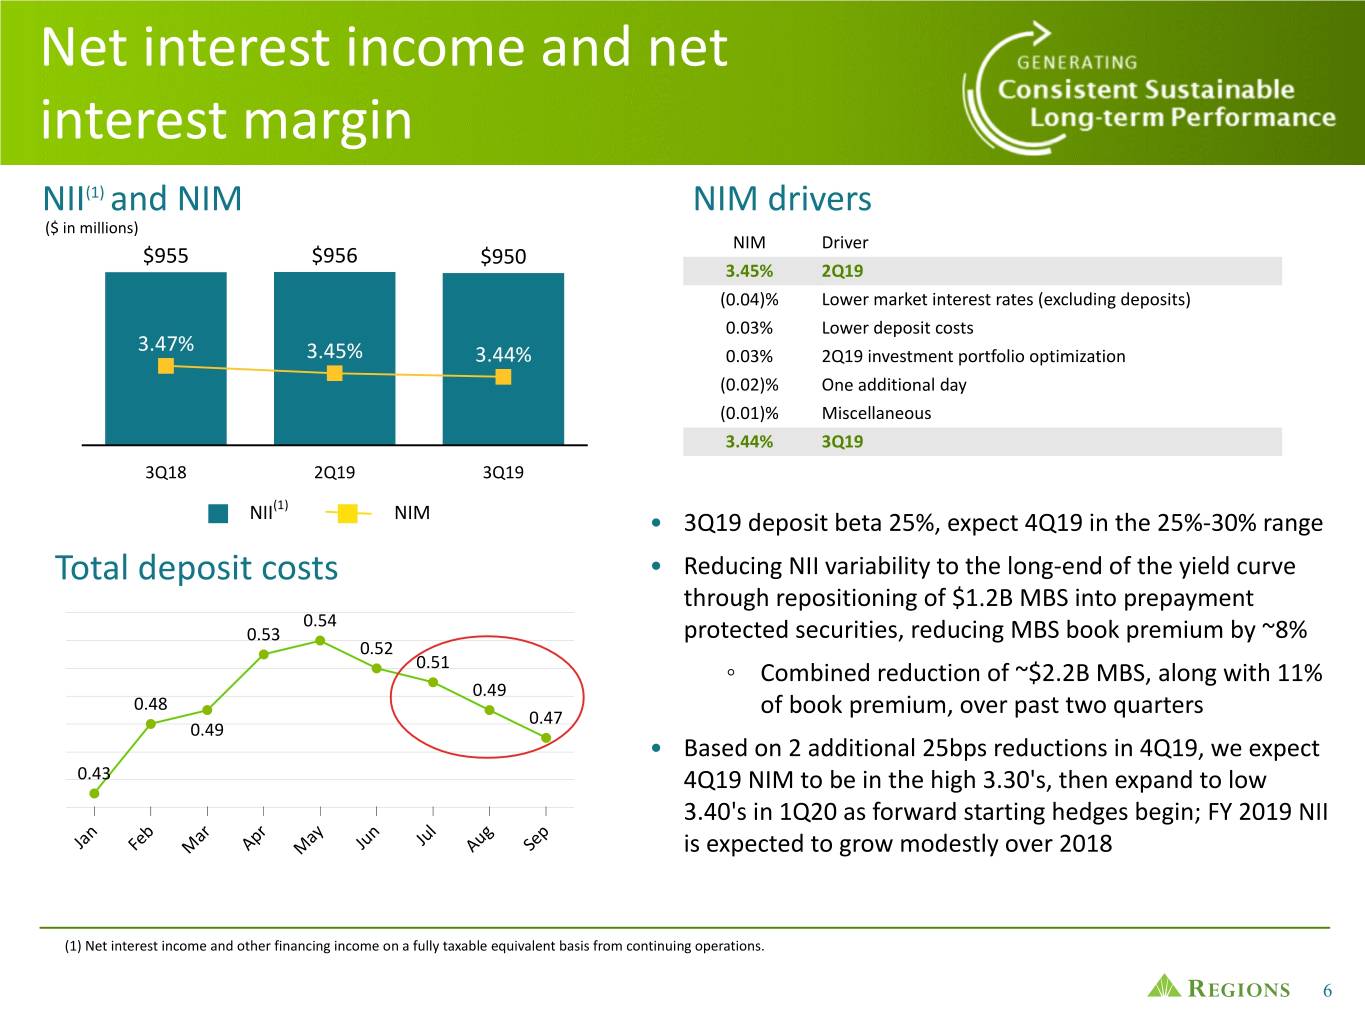
Net interest income and net interest margin NII(1) and NIM NIM drivers ($ in millions) NIM Driver $955 $956 $950 3.45% 2Q19 (0.04)% Lower market interest rates (excluding deposits) 0.03% Lower deposit costs 3.47% 3.45% 3.44% 0.03% 2Q19 investment portfolio optimization (0.02)% One additional day (0.01)% Miscellaneous 3.44% 3Q19 3Q18 2Q19 3Q19 (1) NII NIM • 3Q19 deposit beta 25%, expect 4Q19 in the 25%-30% range Total deposit costs • Reducing NII variability to the long-end of the yield curve through repositioning of $1.2B MBS into prepayment 0.54 0.53 protected securities, reducing MBS book premium by ~8% 0.52 0.51 ◦ Combined reduction of ~$2.2B MBS, along with 11% 0.49 0.48 0.47 of book premium, over past two quarters 0.49 • Based on 2 additional 25bps reductions in 4Q19, we expect 0.43 4Q19 NIM to be in the high 3.30's, then expand to low 3.40's in 1Q20 as forward starting hedges begin; FY 2019 NII n b r r y n l g p a e a p a u Ju u e J F M A M J A S is expected to grow modestly over 2018 (1) Net interest income and other financing income on a fully taxable equivalent basis from continuing operations. 6

Growing non-interest income & disciplined expense management Adjusted non-interest income(1) Adjusted non-interest expense(1) ($ in millions) ($ in millions) $557 $515 $513 $853 $857 $865 58.3% 58.1% 57.4% 3Q18 2Q19 3Q19 3Q18 2Q19 3Q19 Adjusted non-interest expense(1) Adjusted efficiency ratio(1) • Adjusted non-interest income increased QoQ driven • Non-interest expense remained relatively stable by growth in service charges, wealth, and mortgage • Adjusted efficiency ratio(1) 57.4%, 90bps improvement income QoQ • Offsetting items include decreased card & ATM fees • Continued benefits from Simplify and Grow initiative and capital markets income • Effective tax rate of approximately 20.6% Expect full-year 2019 adjusted NIE to be relatively stable Expect full-year 2019 adjusted revenue growth of ~2% with 2018; 2019 effective tax rate of 20-21% (1) Non-GAAP; see appendix for reconciliation. 7
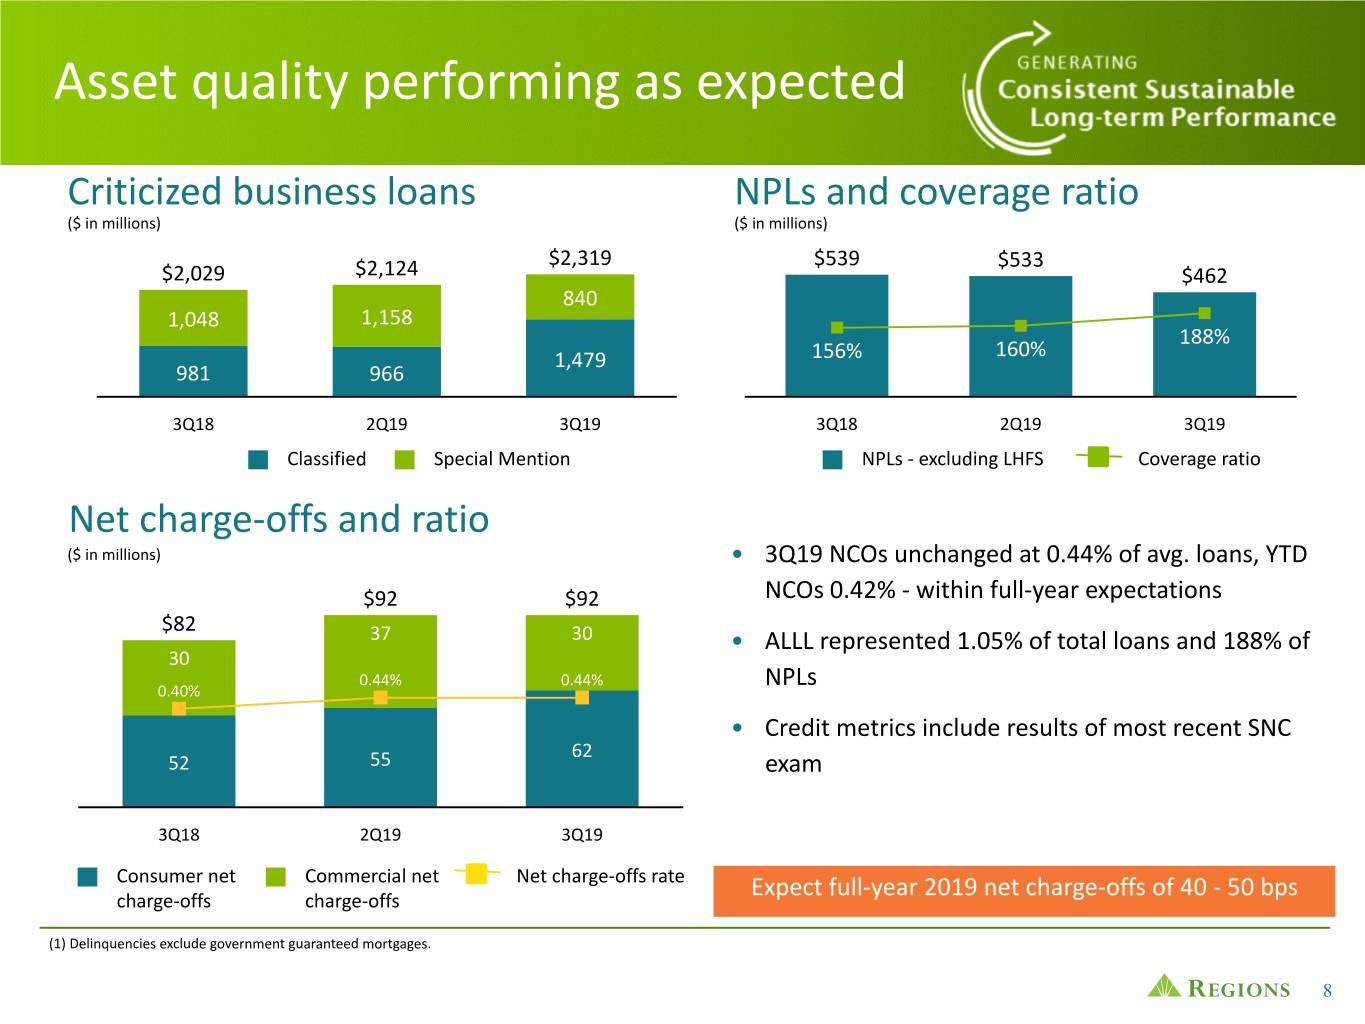
Asset quality performing as expected Criticized business loans NPLs and coverage ratio ($ in millions) ($ in millions) $2,319 $539 $533 $2,029 $2,124 $462 840 1,048 1,158 188% 1,479 156% 160% 981 966 53 3Q18 2Q19 3Q19 3Q18 2Q19 3Q19 Classified Special Mention NPLs - excluding LHFS Coverage ratio Net charge-offs and ratio ($ in millions) • 3Q19 NCOs unchanged at 0.44% of avg. loans, YTD $92 $92 NCOs 0.42% - within full-year expectations $82 37 30 • ALLL represented 1.05% of total loans and 188% of 30 0.44% 0.44% NPLs 0.40% • Credit metrics include results of most recent SNC 62 52 55 exam 3Q18 2Q19 3Q19 Consumer net Commercial net Net charge-offs rate Expect full-year 2019 net charge-offs of 40 - 50 bps charge-offs charge-offs (1) Delinquencies exclude government guaranteed mortgages. 8
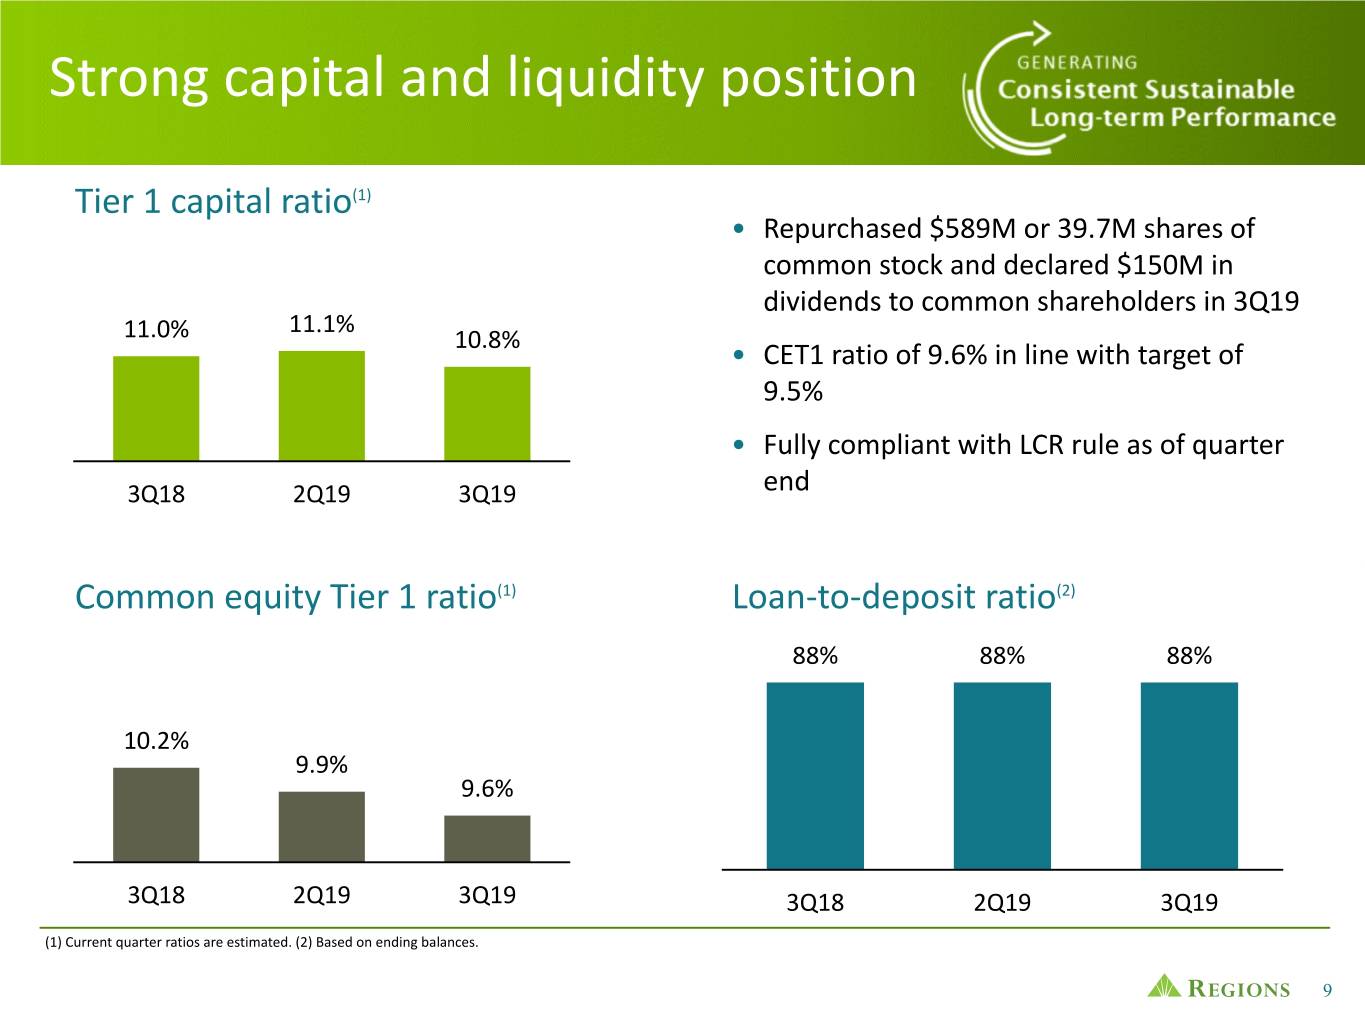
Strong capital and liquidity position Tier 1 capital ratio(1) • Repurchased $589M or 39.7M shares of common stock and declared $150M in dividends to common shareholders in 3Q19 11.1% 11.0% 10.8% • CET1 ratio of 9.6% in line with target of 9.5% • Fully compliant with LCR rule as of quarter 3Q18 2Q19 3Q19 end Common equity Tier 1 ratio(1) Loan-to-deposit ratio(2) 88% 88% 88% 10.2% 9.9% 9.6% 3Q18 2Q19 3Q19 3Q18 2Q19 3Q19 (1) Current quarter ratios are estimated. (2) Based on ending balances. 9
Appendix 10
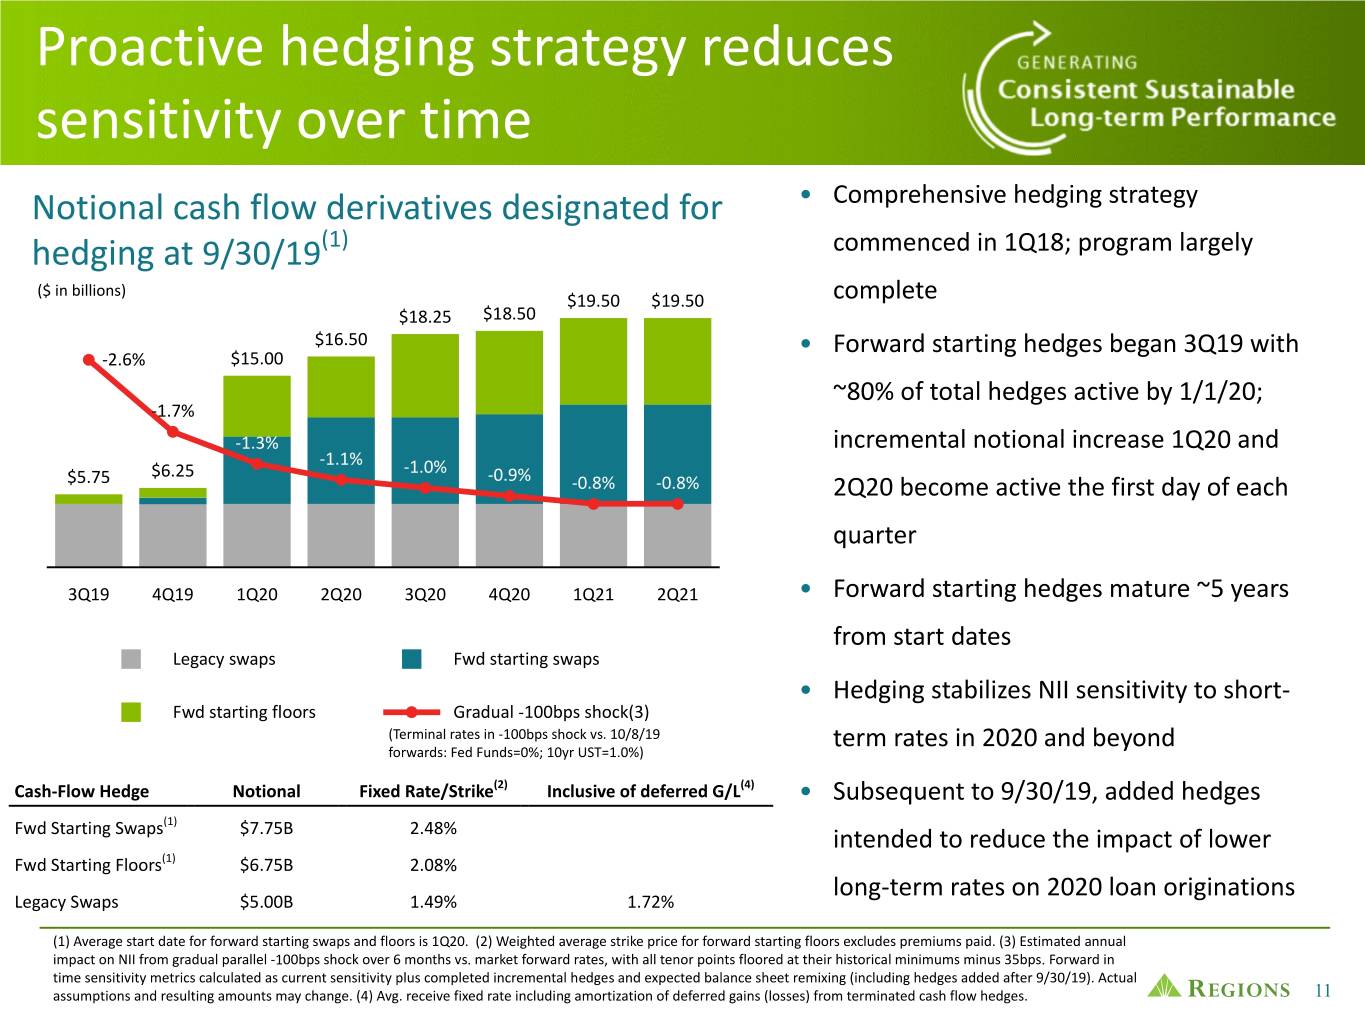
Proactive hedging strategy reduces sensitivity over time Notional cash flow derivatives designated for • Comprehensive hedging strategy hedging at 9/30/19(1) commenced in 1Q18; program largely ($ in billions) $19.50 $19.50 complete $18.25 $18.50 $16.50 • Forward starting hedges began 3Q19 with -2.6% $15.00 ~80% of total hedges active by 1/1/20; -1.7% -1.3% incremental notional increase 1Q20 and -1.1% $6.25 -1.0% $5.75 -0.9% -0.8% -0.8% 2Q20 become active the first day of each quarter 3Q19 4Q19 1Q20 2Q20 3Q20 4Q20 1Q21 2Q21 • Forward starting hedges mature ~5 years from start dates Legacy swaps Fwd starting swaps • Hedging stabilizes NII sensitivity to short- Fwd starting floors Gradual -100bps shock(3) (Terminal rates in -100bps shock vs. 10/8/19 term rates in 2020 and beyond forwards: Fed Funds=0%; 10yr UST=1.0%) Cash-Flow Hedge Notional Fixed Rate/Strike(2) Inclusive of deferred G/L(4) • Subsequent to 9/30/19, added hedges (1) Fwd Starting Swaps $7.75B 2.48% intended to reduce the impact of lower Fwd Starting Floors(1) $6.75B 2.08% long-term rates on 2020 loan originations Legacy Swaps $5.00B 1.49% 1.72% (1) Average start date for forward starting swaps and floors is 1Q20. (2) Weighted average strike price for forward starting floors excludes premiums paid. (3) Estimated annual impact on NII from gradual parallel -100bps shock over 6 months vs. market forward rates, with all tenor points floored at their historical minimums minus 35bps. Forward in time sensitivity metrics calculated as current sensitivity plus completed incremental hedges and expected balance sheet remixing (including hedges added after 9/30/19). Actual assumptions and resulting amounts may change. (4) Avg. receive fixed rate including amortization of deferred gains (losses) from terminated cash flow hedges. 11
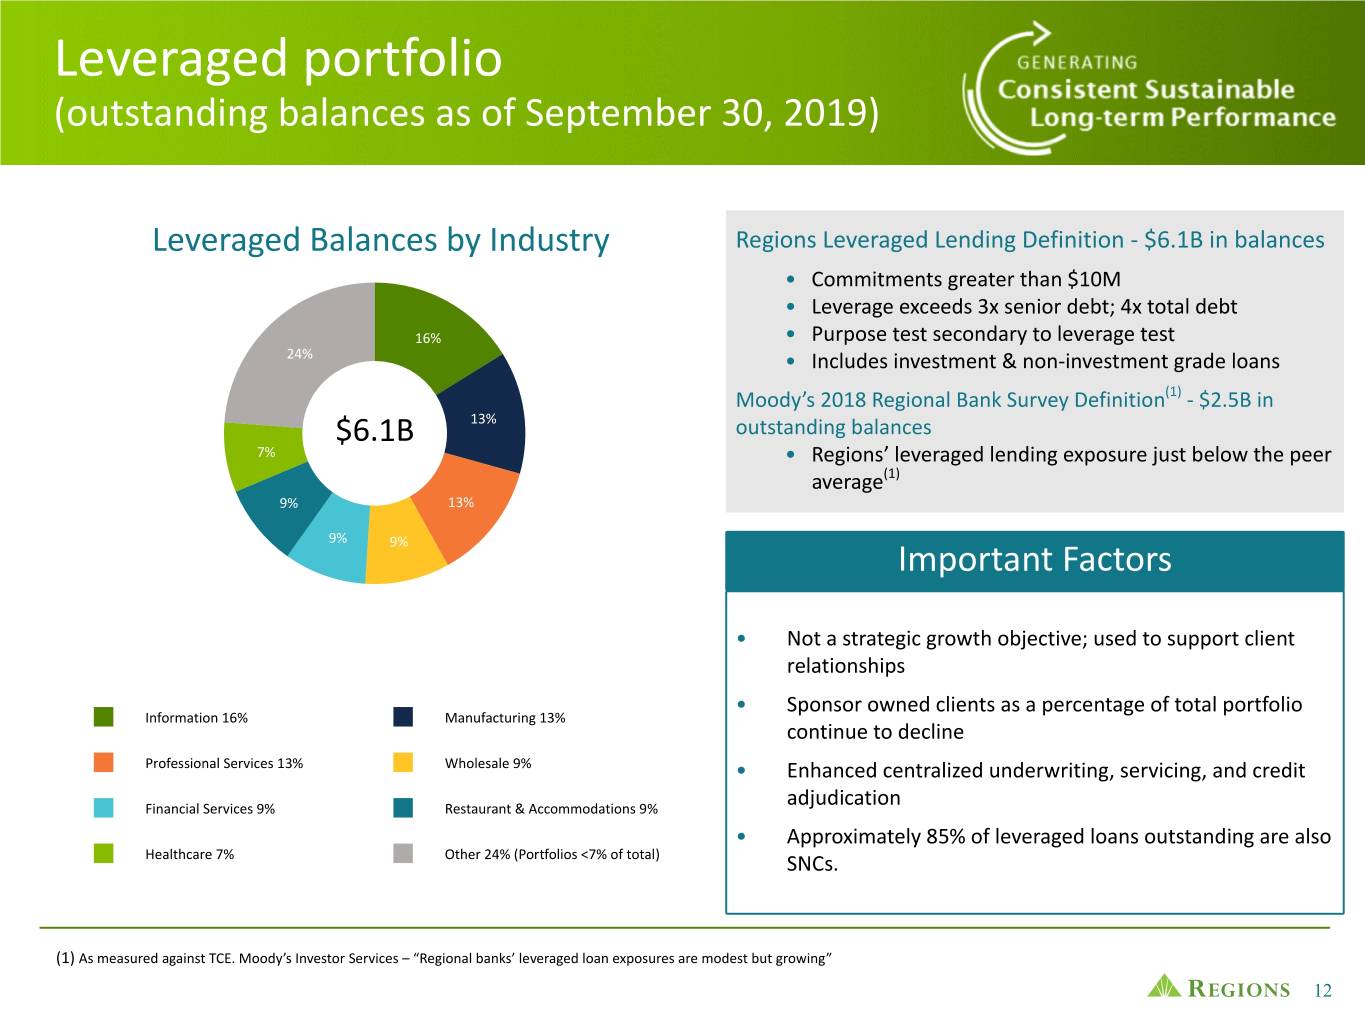
Leveraged portfolio (outstanding balances as of September 30, 2019) Leveraged Balances by Industry Regions Leveraged Lending Definition - $6.1B in balances • Commitments greater than $10M • Leverage exceeds 3x senior debt; 4x total debt 16% • Purpose test secondary to leverage test 24% • Includes investment & non-investment grade loans Moody’s 2018 Regional Bank Survey Definition(1) - $2.5B in $6.1B 13% outstanding balances 7% • Regions’ leveraged lending exposure just below the peer average(1) 9% 13% 9% 9% Important Factors • Not a strategic growth objective; used to support client relationships • Sponsor owned clients as a percentage of total portfolio Information 16% Manufacturing 13% continue to decline Professional Services 13% Wholesale 9% • Enhanced centralized underwriting, servicing, and credit Financial Services 9% Restaurant & Accommodations 9% adjudication • Approximately 85% of leveraged loans outstanding are also Healthcare 7% Other 24% (Portfolios <7% of total) SNCs. (1) As measured against TCE. Moody’s Investor Services – “Regional banks’ leveraged loan exposures are modest but growing” 12
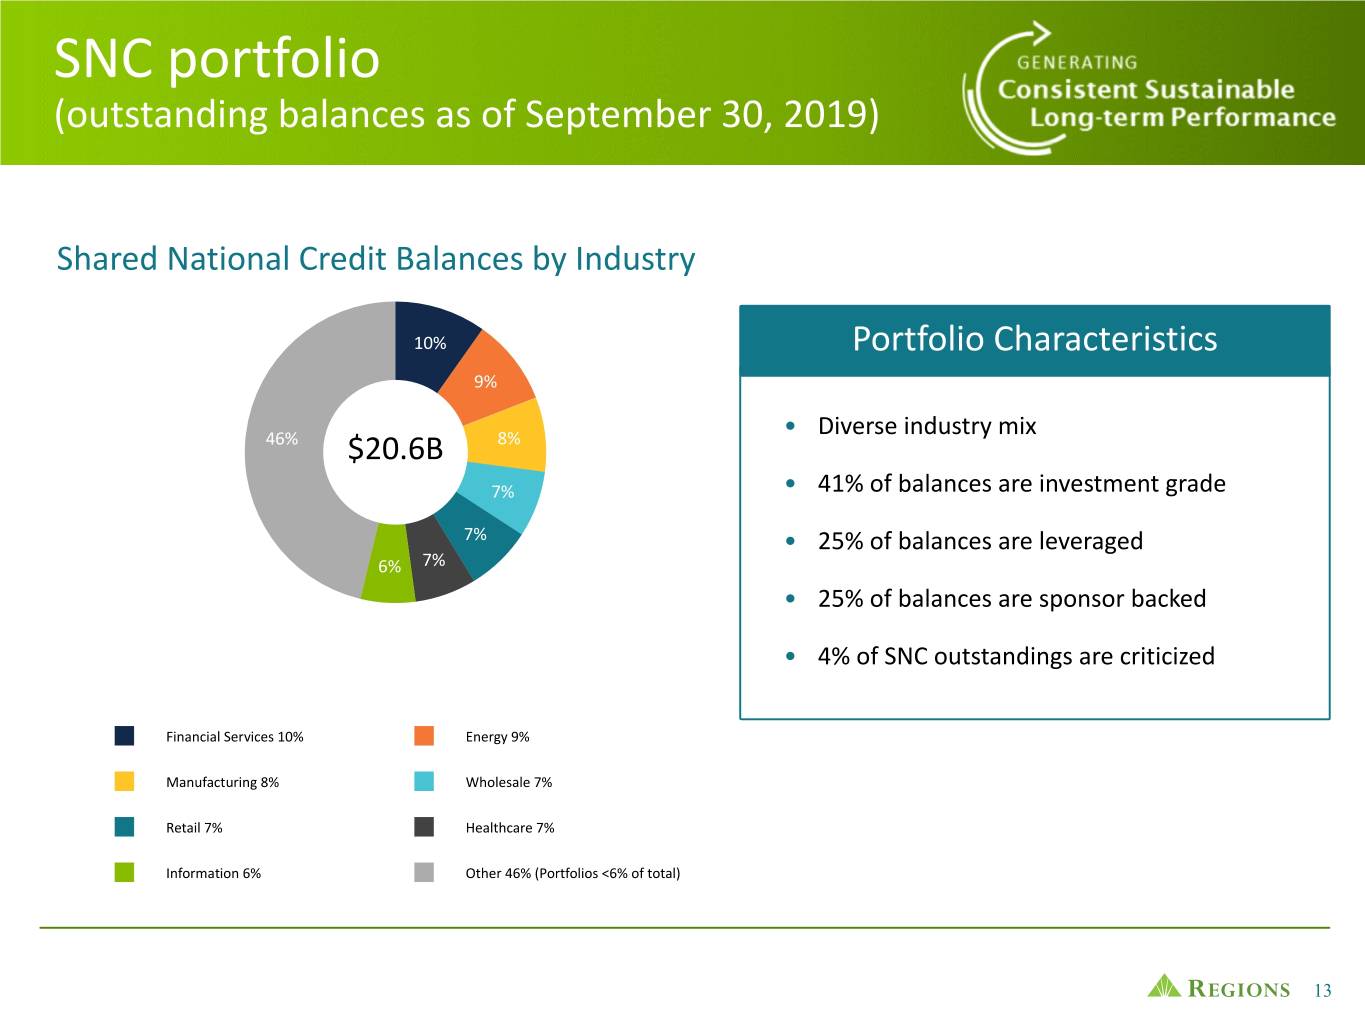
SNC portfolio (outstanding balances as of September 30, 2019) Shared National Credit Balances by Industry 10% Portfolio Characteristics 9% • Diverse industry mix 46% $20.6B 8% 7% • 41% of balances are investment grade 7% • 25% of balances are leveraged 6% 7% • 25% of balances are sponsor backed • 4% of SNC outstandings are criticized Financial Services 10% Energy 9% Manufacturing 8% Wholesale 7% Retail 7% Healthcare 7% Information 6% Other 46% (Portfolios <6% of total) 13
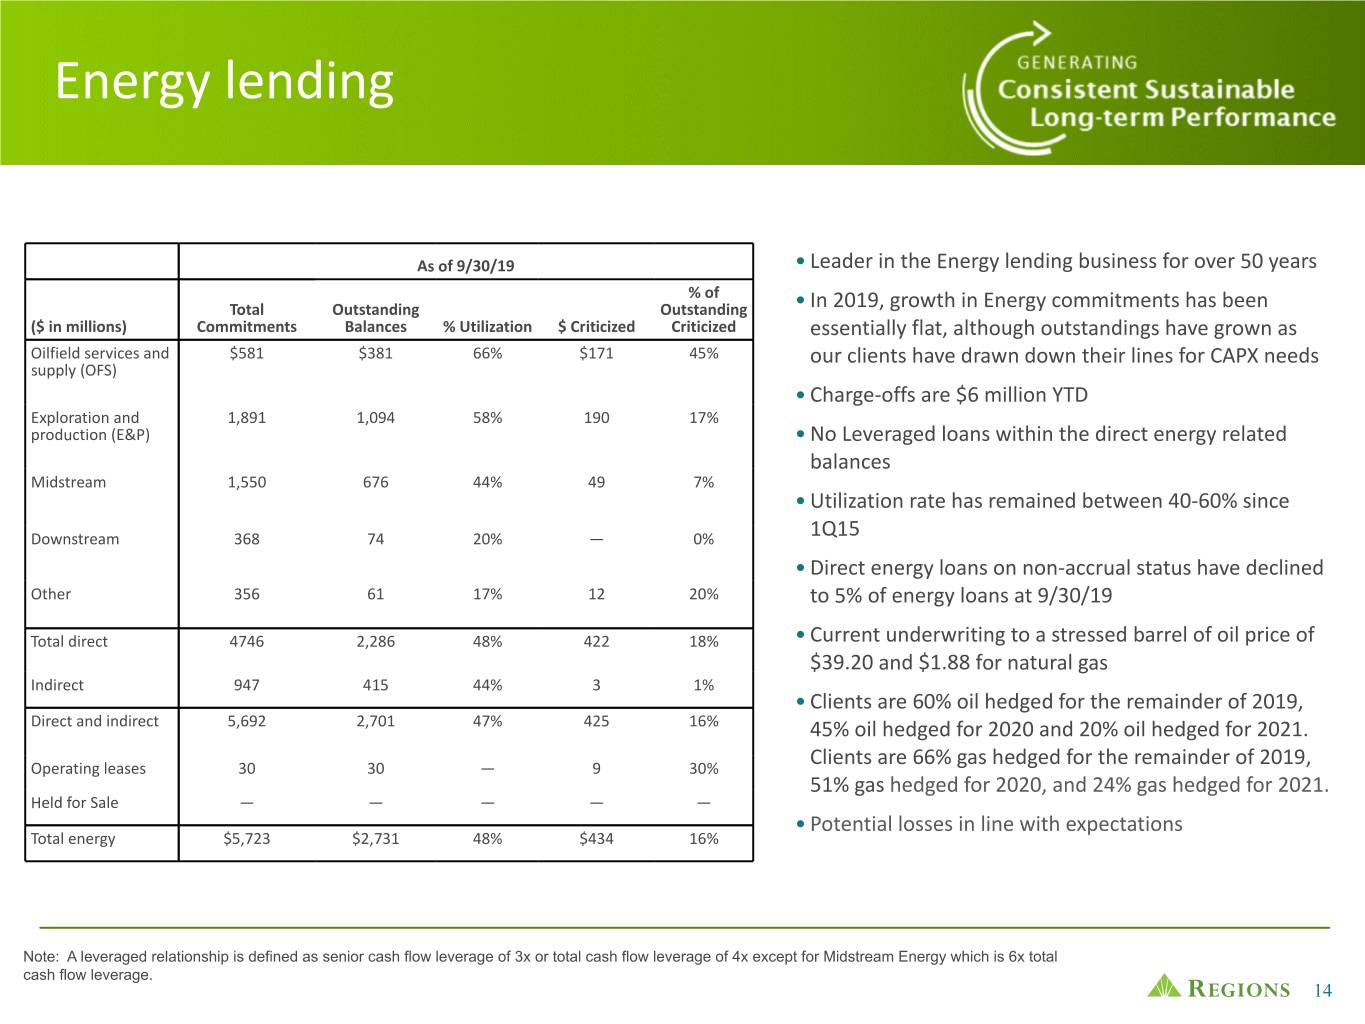
Energy lending As of 9/30/19 • Leader in the Energy lending business for over 50 years % of Total Outstanding Outstanding • In 2019, growth in Energy commitments has been ($ in millions) Commitments Balances % Utilization $ Criticized Criticized essentially flat, although outstandings have grown as Oilfield services and $581 $381 66% $171 45% our clients have drawn down their lines for CAPX needs supply (OFS) 53 • Charge-offs are $6 million YTD Exploration and 1,891 1,094 58% 190 17% production (E&P) • No Leveraged loans within the direct energy related balances Midstream 1,550 676 44% 49 7% • Utilization rate has remained between 40-60% since Downstream 368 74 20% — 0% 1Q15 • Direct energy loans on non-accrual status have declined Other 356 61 17% 12 20% to 5% of energy loans at 9/30/19 Total direct 4746 2,286 48% 422 18% • Current underwriting to a stressed barrel of oil price of $39.20 and $1.88 for natural gas Indirect 947 415 44% 3 1% • Clients are 60% oil hedged for the remainder of 2019, Direct and indirect 5,692 2,701 47% 425 16% 45% oil hedged for 2020 and 20% oil hedged for 2021. Operating leases 30 30 — 9 30% Clients are 66% gas hedged for the remainder of 2019, 51% gas hedged for 2020, and 24% gas hedged for 2021. Held for Sale — — — — — • Potential losses in line with expectations Total energy $5,723 $2,731 48% $434 16% Note: A leveraged relationship is defined as senior cash flow leverage of 3x or total cash flow leverage of 4x except for Midstream Energy which is 6x total cash flow leverage. 14

Restaurant lending • Team of bankers in place with specialization in this As of 9/30/19 industry 53 % of ($ in Total Outstanding % Outstanding millions) # of Clients* Commitments Balances Utilization $ Criticized Criticized • Consumer spending will continue to support this Quick 2,869 $1,476 $1,182 80% $108 9% industry Service • Changes in consumer preferences have put Casual 39 683 552 81% 177 32% increased stress on the Casual segment Dining • Labor and food costs are rising Other 28 173 128 74% 12 9% • Greater risk focus on quality of sponsor Total 2,936 $2,332 $1,862 80% $297 16% • 29% of Restaurant outstandings are leveraged Restaurants • Charge-offs are $16 million YTD *Represents the number of clients with loan balances outstanding 15
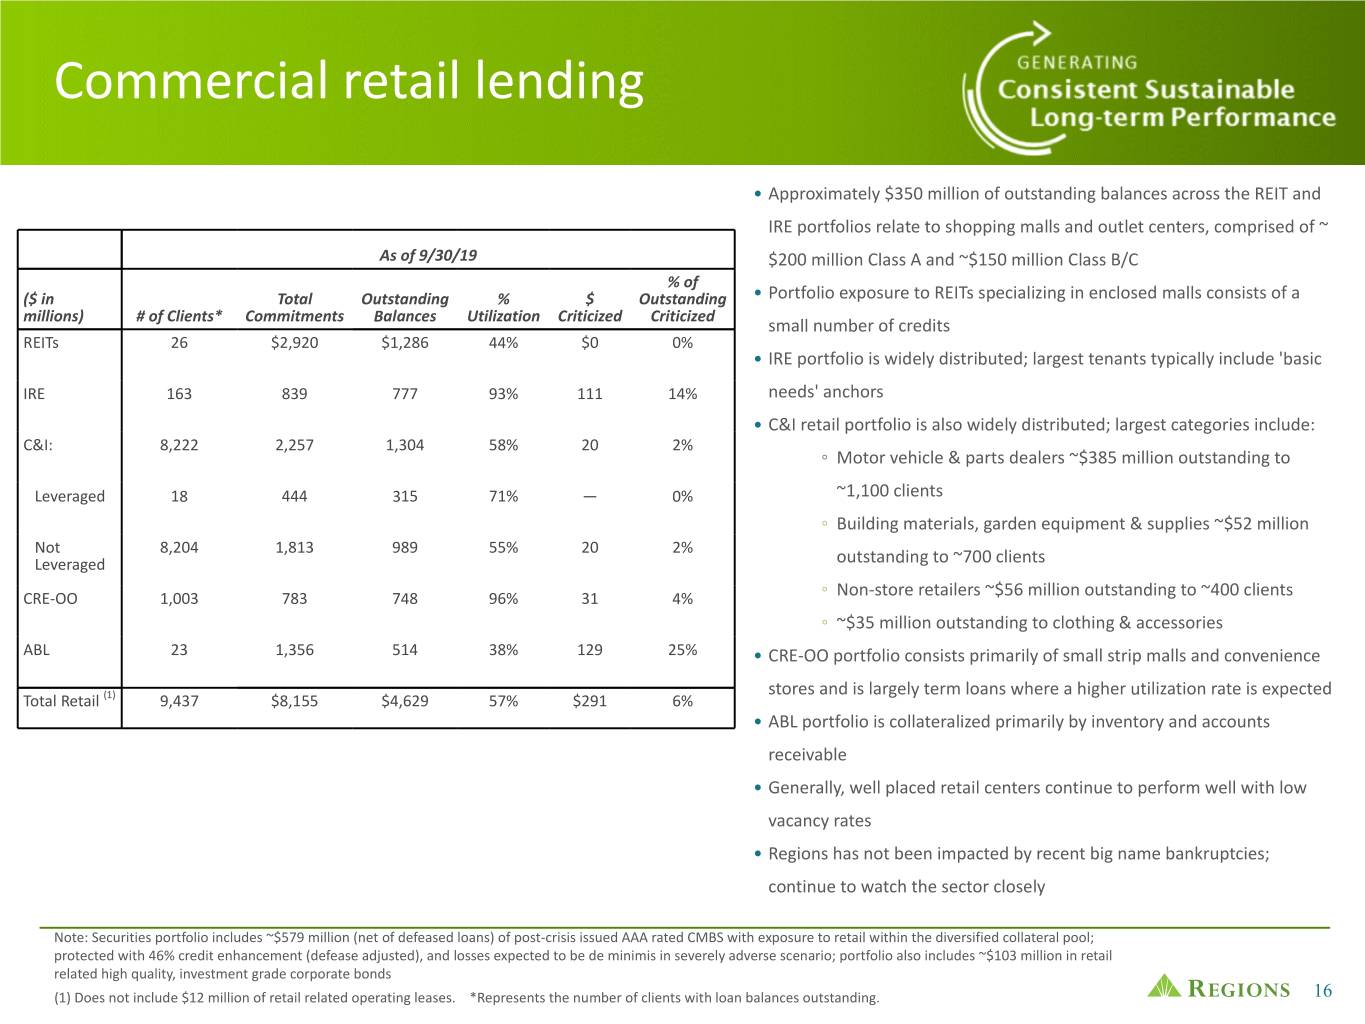
Commercial retail lending • Approximately $350 million of outstanding balances across the REIT and IRE portfolios relate to shopping malls and outlet centers, comprised of ~ As of 9/30/19 $200 million Class A and ~$150 million Class B/C % of ($ in Total Outstanding % $ Outstanding • Portfolio exposure to REITs specializing in enclosed malls consists of a millions) # of Clients* Commitments Balances Utilization Criticized Criticized small number of credits REITs 26 $2,920 $1,286 44% $0 0% • IRE portfolio is widely distributed; largest tenants typically include 'basic IRE 163 839 777 53 93% 111 14% needs' anchors • C&I retail portfolio is also widely distributed; largest categories include: C&I: 8,222 2,257 1,304 58% 20 2% ◦ Motor vehicle & parts dealers ~$385 million outstanding to Leveraged 18 444 315 71% — 0% ~1,100 clients ◦ Building materials, garden equipment & supplies ~$52 million Not 8,204 1,813 989 55% 20 2% Leveraged outstanding to ~700 clients ◦ CRE-OO 1,003 783 748 96% 31 4% Non-store retailers ~$56 million outstanding to ~400 clients ◦ ~$35 million outstanding to clothing & accessories ABL 23 1,356 514 38% 129 25% • CRE-OO portfolio consists primarily of small strip malls and convenience stores and is largely term loans where a higher utilization rate is expected Total Retail (1) 9,437 $8,155 $4,629 57% $291 6% • ABL portfolio is collateralized primarily by inventory and accounts receivable • Generally, well placed retail centers continue to perform well with low vacancy rates • Regions has not been impacted by recent big name bankruptcies; continue to watch the sector closely Note: Securities portfolio includes ~$579 million (net of defeased loans) of post-crisis issued AAA rated CMBS with exposure to retail within the diversified collateral pool; protected with 46% credit enhancement (defease adjusted), and losses expected to be de minimis in severely adverse scenario; portfolio also includes ~$103 million in retail related high quality, investment grade corporate bonds (1) Does not include $12 million of retail related operating leases. *Represents the number of clients with loan balances outstanding. 16
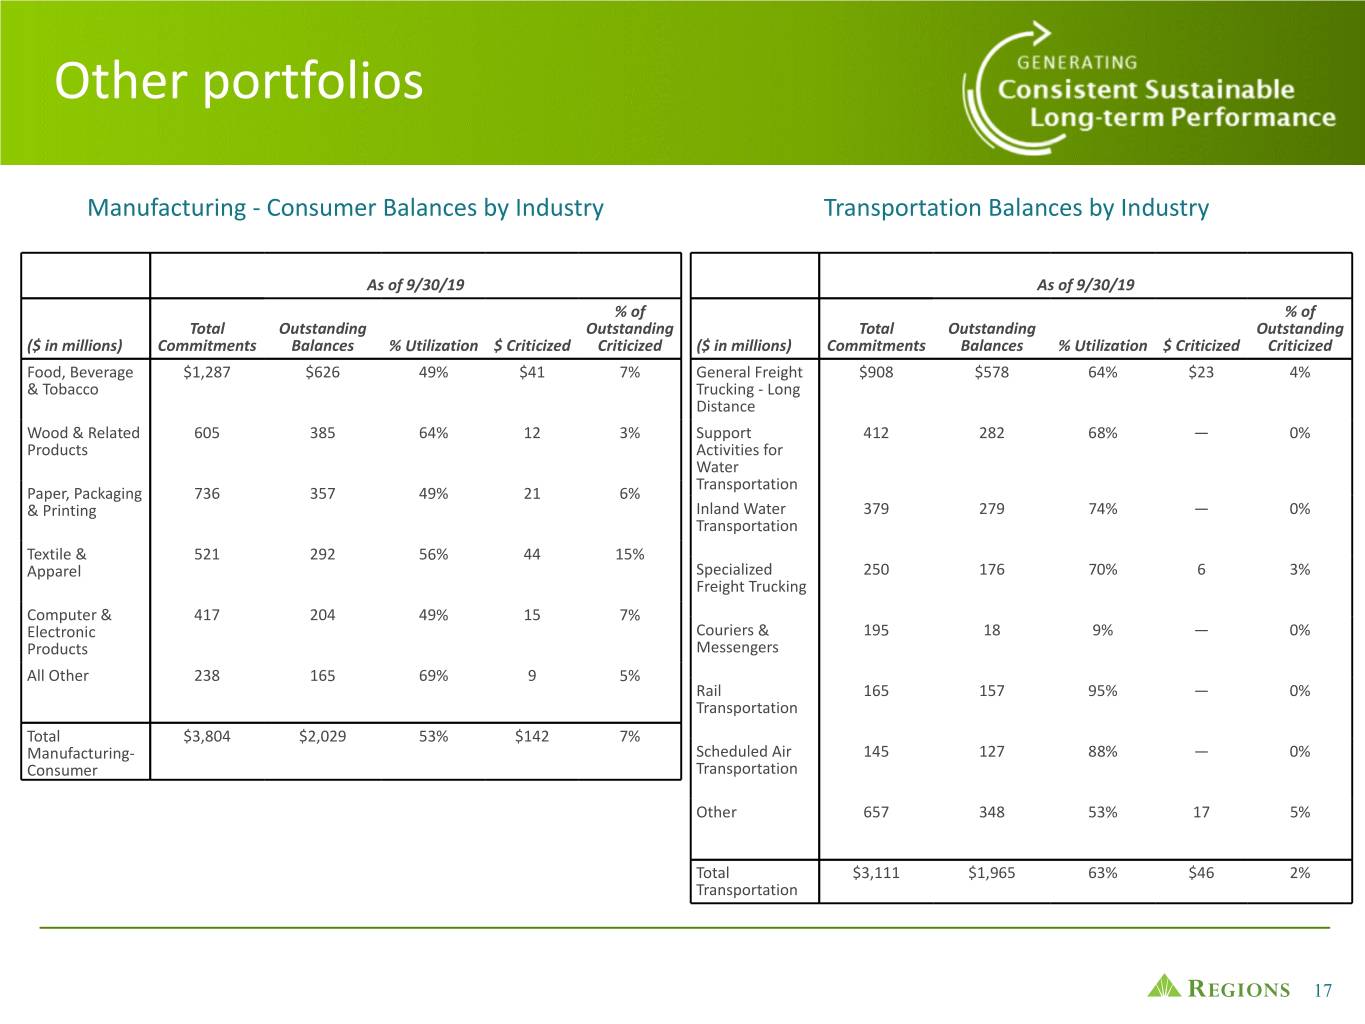
Other portfolios Manufacturing - Consumer Balances by Industry Transportation Balances by Industry As of 9/30/19 As of 9/30/19 % of % of Total Outstanding Outstanding Total Outstanding Outstanding ($ in millions) Commitments Balances % Utilization $ Criticized Criticized ($ in millions) Commitments Balances % Utilization $ Criticized Criticized Food, Beverage $1,287 $626 49% $41 7% General Freight $908 $578 64% $23 4% & Tobacco 53 Trucking - Long Distance Wood & Related 605 385 64% 12 3% Support 412 282 68% — 0% Products Activities for Water Transportation Paper, Packaging 736 357 49% 21 6% & Printing Inland Water 379 279 74% — 0% Transportation Textile & 521 292 56% 44 15% Apparel Specialized 250 176 70% 6 3% Freight Trucking Computer & 417 204 49% 15 7% Electronic Couriers & 195 18 9% — 0% Products Messengers All Other 238 165 69% 9 5% Rail 165 157 95% — 0% Transportation Total $3,804 $2,029 53% $142 7% Manufacturing- Scheduled Air 145 127 88% — 0% Consumer Transportation Other 657 348 53% 17 5% Total $3,111 $1,965 63% $46 2% Transportation 17

Consumer lending portfolio statistics Residential Mortgage Home Equity Portfolio Statistics • Avg. origination FICO 768 • Avg. origination FICO 756 • Current LTV 59% • Current LTV 46% • 95% owner occupied • Only $409M of resets through 2021 • 66% of portfolio is 1st lien • Avg. loan size $40,567 Consumer Credit Card Consumer Third-Party Lending Other Consumer Unsecured Portfolio Statistics • Avg. origination FICO 736 • Avg. origination FICO 755 • Avg. origination FICO 737 • Avg. new line $5,639 • Avg. new line $16,250 • Avg. new loan $8,903 • Yield 13.1% • 66% home improvement loans • QTD NCO 4.3% • Yield 9.2% • NCO 2.8% 18

LIBOR transition Four pillars of execution ◦ Regions completed a comprehensive LIBOR Impact Assessment in 1H 2019 ◦ Using the results of the assessment, we have mobilized a company-wide initiative to transition to alternative rate(s) by YE 2021 Core Products & Corporate Strategy & Legacy Contracts Communications Integration Forecasting How do we adjust existing How do we forecast for the How will we treat existing When and how do we platforms and prepare to offer transition and measure its contracts and incorporate communicate effectively to all a new rate(s)? impact over time? industry fallback language? stakeholders? Cross functional team Cross functional team Cross functional team Cross functional team • Strategic Planning • Corporate Banking Group • Corporate Banking Group • Corporate Banking Group • Treasury • Consumer Banking Group • Consumer Banking Group • Consumer Banking Group • Accounting • Private Wealth Mgt. • Private Wealth Mgt. • Private Wealth Mgt. • Finance • Capital Markets • Capital Markets • Capital Markets • Capital Markets • Ops & Tech • Risk Testing Organization • Marketing • Corporate Banking Group • Finance • Legal • Investor Relations • Consumer Banking Group • Risk • Ops & Tech • Learning & Development • Ops & Tech Topics • Legal • Risk Topics • Technology solutions to • Corporate Communications • Loan origination process search and catalog LIBOR- Topics • System updates based contracts Topics • Financial forecasting • Derivative systems • Regions360 approach • Client education • Loan pricing • Business deposits (clients w/ multiple • Associate training • Financial objectives • New swap arrangements products) • External communication • Corporate hedging • Update fallback language • Disclosures 19
Non-GAAP information This document contains non-GAAP financial measures, which exclude certain items management does not consider indicative of the Company’s on-going financial performance. Management believes that the exclusion of these items provides a meaningful base for period- to-period comparisons, which management believes will assist investors in analyzing the operating results of the Company and predicting future performance. These non-GAAP financial measures are also used by management to assess the performance of Regions’ business. It is possible that the activities related to these adjustments may recur; however, management does not consider these activities to be indications of ongoing operations. Management believes that presentation of these non-GAAP financial measures will permit investors to assess the performance of the Company on the same basis as that applied by management. Other companies may use similarly titled non-GAAP financial measures that are calculated differently from the way we calculate such measures. Accordingly, our non-GAAP financial measures may not be comparable to similar measures used by other companies. We caution investors not to place undue reliance on such non-GAAP financial measures, but to consider them with the most directly comparable GAAP measures. Non-GAAP financial measures have limitations as analytical tools and should not be considered in isolation or as a substitute for our results reported under GAAP. The following tables present reconciliations of Regions' non-GAAP measures to the most directly comparable GAAP financial measures. 20
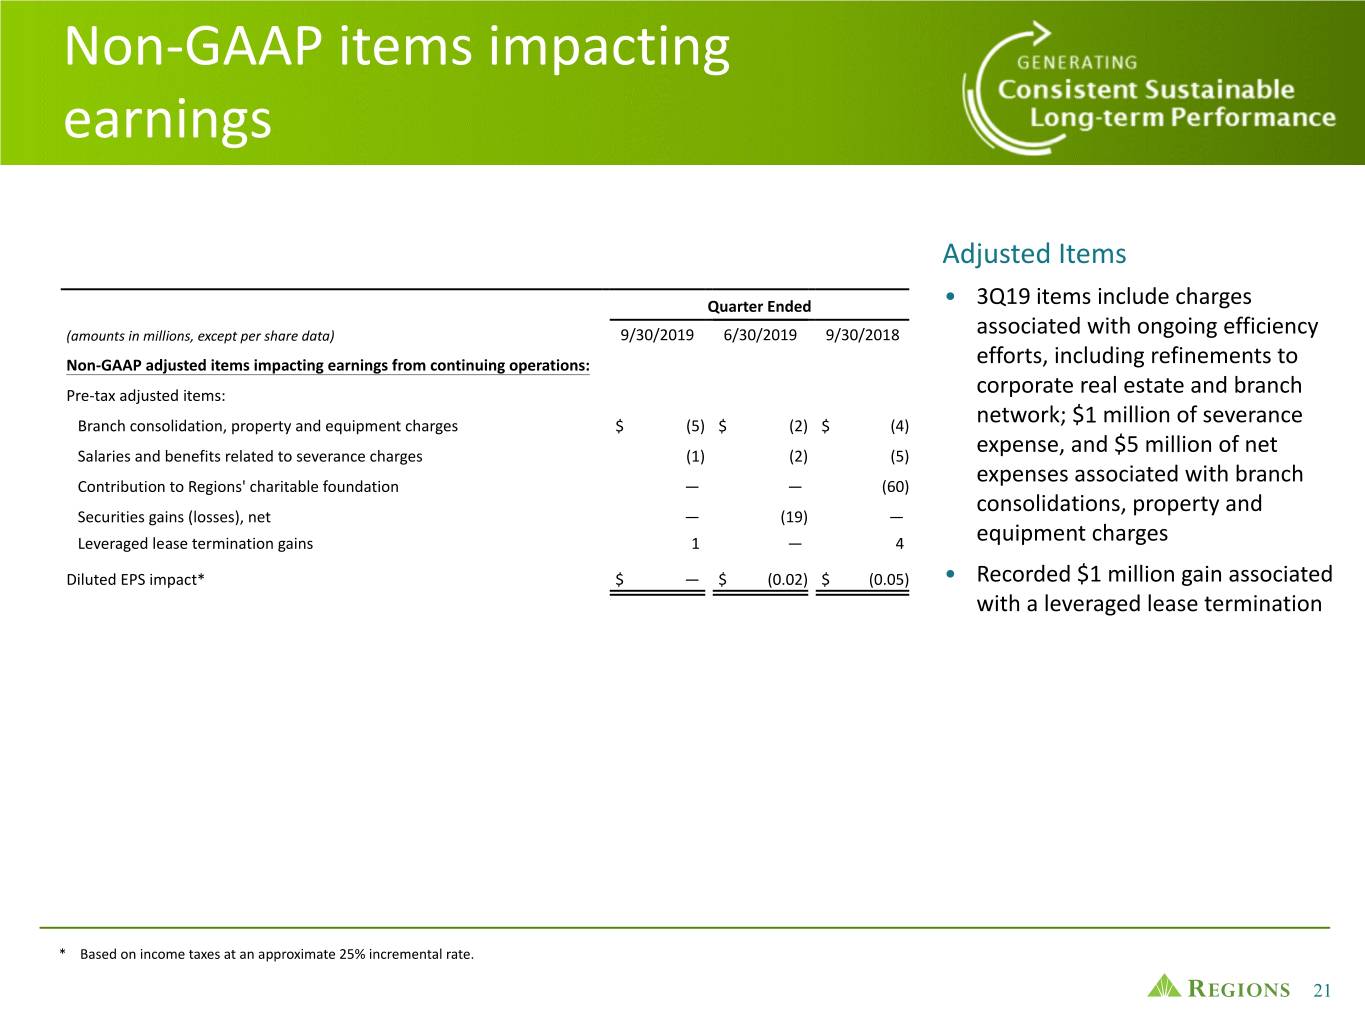
Non-GAAP items impacting earnings Adjusted Items Quarter Ended • 3Q19 items include charges (amounts in millions, except per share data) 9/30/2019 6/30/2019 9/30/2018 associated with ongoing efficiency Non-GAAP adjusted items impacting earnings from continuing operations: efforts, including refinements to Pre-tax adjusted items: corporate real estate and branch Branch consolidation, property and equipment charges $ (5) $ (2) $ (4) network; $1 million of severance Salaries and benefits related to severance charges (1) (2) (5) expense, and $5 million of net expenses associated with branch Contribution to Regions' charitable foundation — — (60) consolidations, property and Securities gains (losses), net — (19) — Leveraged lease termination gains 1 — 4 equipment charges Diluted EPS impact* $ — $ (0.02) $ (0.05) • Recorded $1 million gain associated with a leveraged lease termination * Based on income taxes at an approximate 25% incremental rate. 21
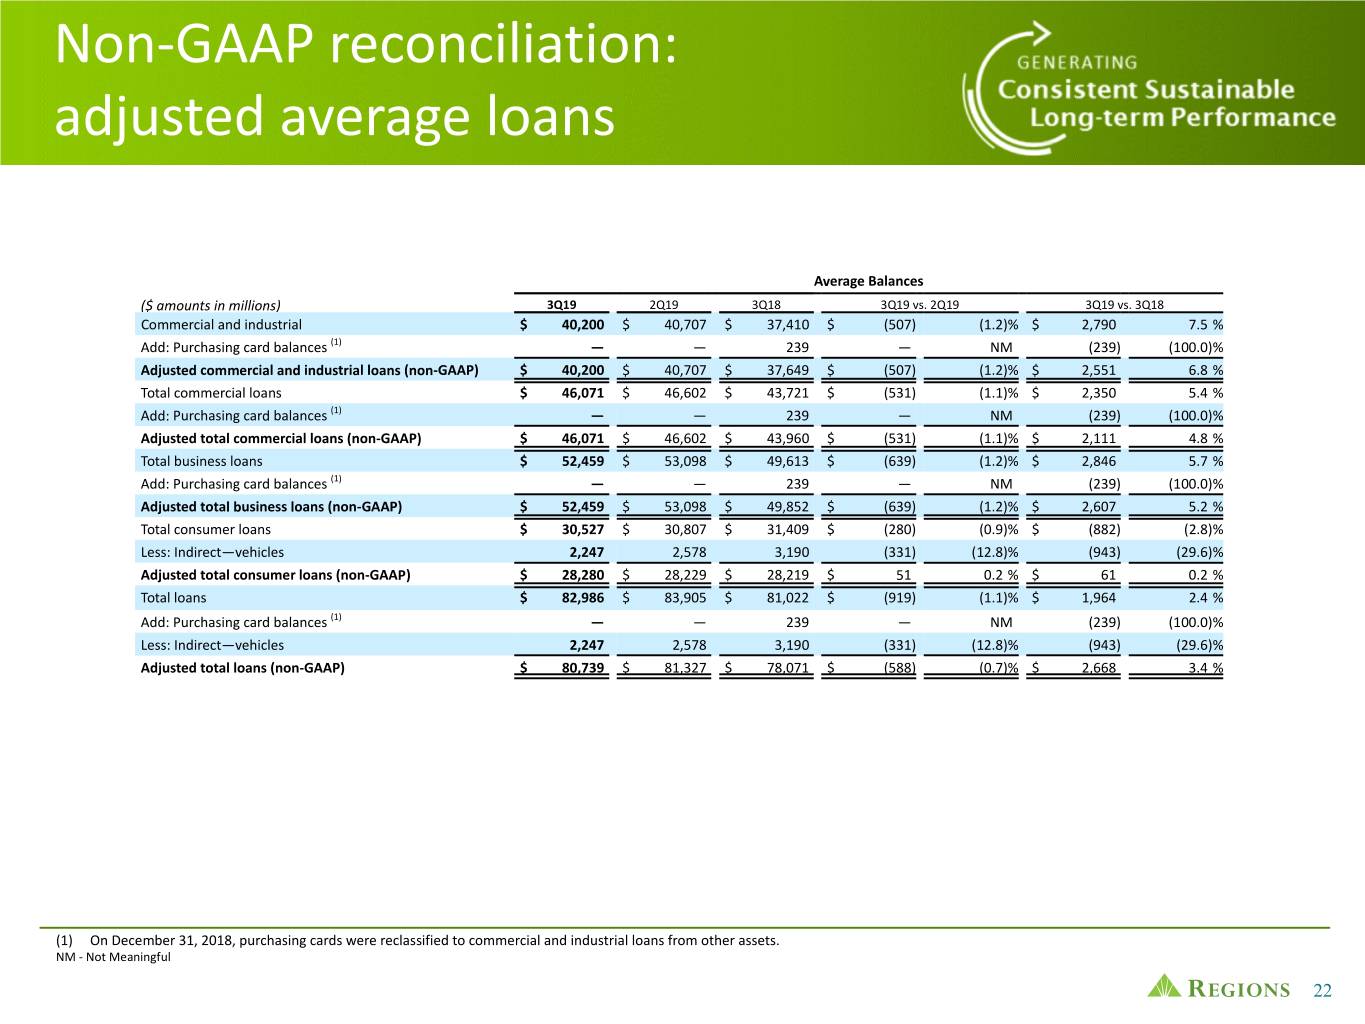
Non-GAAP reconciliation: adjusted average loans Average Balances ($ amounts in millions) 3Q19 2Q19 3Q18 3Q19 vs. 2Q19 3Q19 vs. 3Q18 Commercial and industrial $ 40,200 $ 40,707 $ 37,410 $ (507) (1.2)% $ 2,790 7.5 % Add: Purchasing card balances (1) — — 239 — NM (239) (100.0)% Adjusted commercial and industrial loans (non-GAAP) $ 40,200 $ 40,707 $ 37,649 $ (507) (1.2)% $ 2,551 6.8 % Total commercial loans $ 46,071 $ 46,602 $ 43,721 $ (531) (1.1)% $ 2,350 5.4 % Add: Purchasing card balances (1) — — 239 — NM (239) (100.0)% Adjusted total commercial loans (non-GAAP) $ 46,071 $ 46,602 $ 43,960 $ (531) (1.1)% $ 2,111 4.8 % Total business loans $ 52,459 $ 53,098 $ 49,613 $ (639) (1.2)% $ 2,846 5.7 % Add: Purchasing card balances (1) — — 239 — NM (239) (100.0)% Adjusted total business loans (non-GAAP) $ 52,459 $ 53,098 $ 49,852 $ (639) (1.2)% $ 2,607 5.2 % Total consumer loans $ 30,527 $ 30,807 $ 31,409 $ (280) (0.9)% $ (882) (2.8)% Less: Indirect—vehicles 2,247 2,578 3,190 (331) (12.8)% (943) (29.6)% Adjusted total consumer loans (non-GAAP) $ 28,280 $ 28,229 $ 28,219 $ 51 0.2 % $ 61 0.2 % Total loans $ 82,986 $ 83,905 $ 81,022 $ (919) (1.1)% $ 1,964 2.4 % Add: Purchasing card balances (1) — — 239 — NM (239) (100.0)% Less: Indirect—vehicles 2,247 2,578 3,190 (331) (12.8)% (943) (29.6)% Adjusted total loans (non-GAAP) $ 80,739 $ 81,327 $ 78,071 $ (588) (0.7)% $ 2,668 3.4 % (1) On December 31, 2018, purchasing cards were reclassified to commercial and industrial loans from other assets. NM - Not Meaningful 22
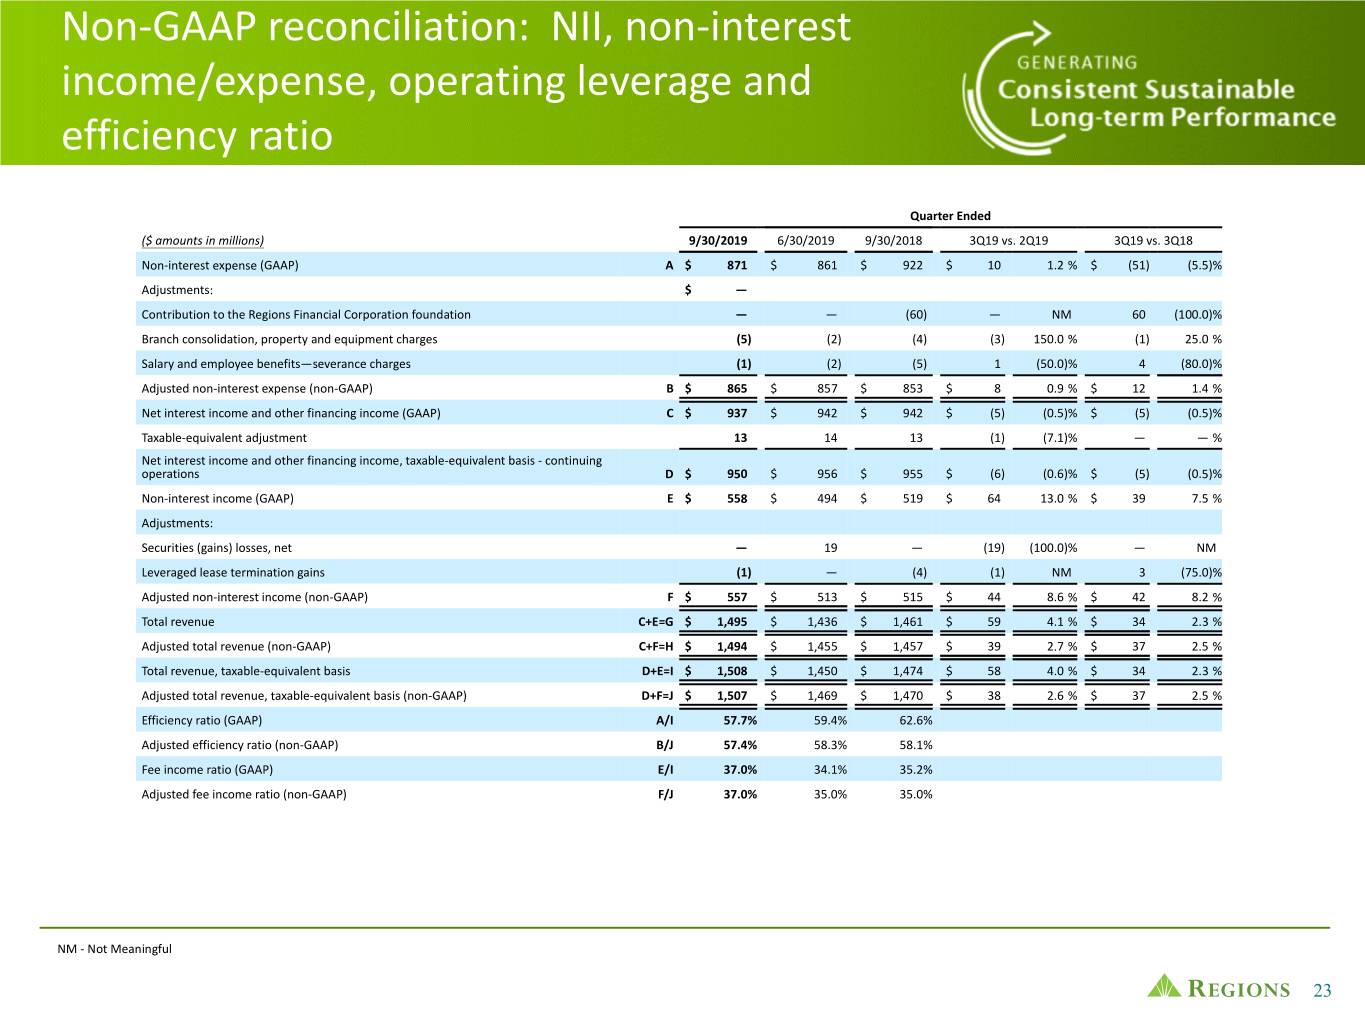
Non-GAAP reconciliation: NII, non-interest income/expense, operating leverage and efficiency ratio Quarter Ended ($ amounts in millions) 9/30/2019 6/30/2019 9/30/2018 3Q19 vs. 2Q19 3Q19 vs. 3Q18 Non-interest expense (GAAP) A $ 871 $ 861 $ 922 $ 10 1.2 % $ (51) (5.5)% Adjustments: $ — Contribution to the Regions Financial Corporation foundation — — (60) — NM 60 (100.0)% Branch consolidation, property and equipment charges (5) (2) (4) (3) 150.0 % (1) 25.0 % Salary and employee benefits—severance charges (1) (2) (5) 1 (50.0)% 4 (80.0)% Adjusted non-interest expense (non-GAAP) B $ 865 $ 857 $ 853 $ 8 0.9 % $ 12 1.4 % Net interest income and other financing income (GAAP) C $ 937 $ 942 $ 942 $ (5) (0.5)% $ (5) (0.5)% Taxable-equivalent adjustment 13 14 13 (1) (7.1)% — — % Net interest income and other financing income, taxable-equivalent basis - continuing operations D $ 950 $ 956 $ 955 $ (6) (0.6)% $ (5) (0.5)% Non-interest income (GAAP) E $ 558 $ 494 $ 519 $ 64 13.0 % $ 39 7.5 % Adjustments: Securities (gains) losses, net — 19 — (19) (100.0)% — NM Leveraged lease termination gains (1) — (4) (1) NM 3 (75.0)% Adjusted non-interest income (non-GAAP) F $ 557 $ 513 $ 515 $ 44 8.6 % $ 42 8.2 % Total revenue C+E=G $ 1,495 $ 1,436 $ 1,461 $ 59 4.1 % $ 34 2.3 % Adjusted total revenue (non-GAAP) C+F=H $ 1,494 $ 1,455 $ 1,457 $ 39 2.7 % $ 37 2.5 % Total revenue, taxable-equivalent basis D+E=I $ 1,508 $ 1,450 $ 1,474 $ 58 4.0 % $ 34 2.3 % Adjusted total revenue, taxable-equivalent basis (non-GAAP) D+F=J $ 1,507 $ 1,469 $ 1,470 $ 38 2.6 % $ 37 2.5 % Efficiency ratio (GAAP) A/I 57.7% 59.4% 62.6% Adjusted efficiency ratio (non-GAAP) B/J 57.4% 58.3% 58.1% Fee income ratio (GAAP) E/I 37.0% 34.1% 35.2% Adjusted fee income ratio (non-GAAP) F/J 37.0% 35.0% 35.0% NM - Not Meaningful 23
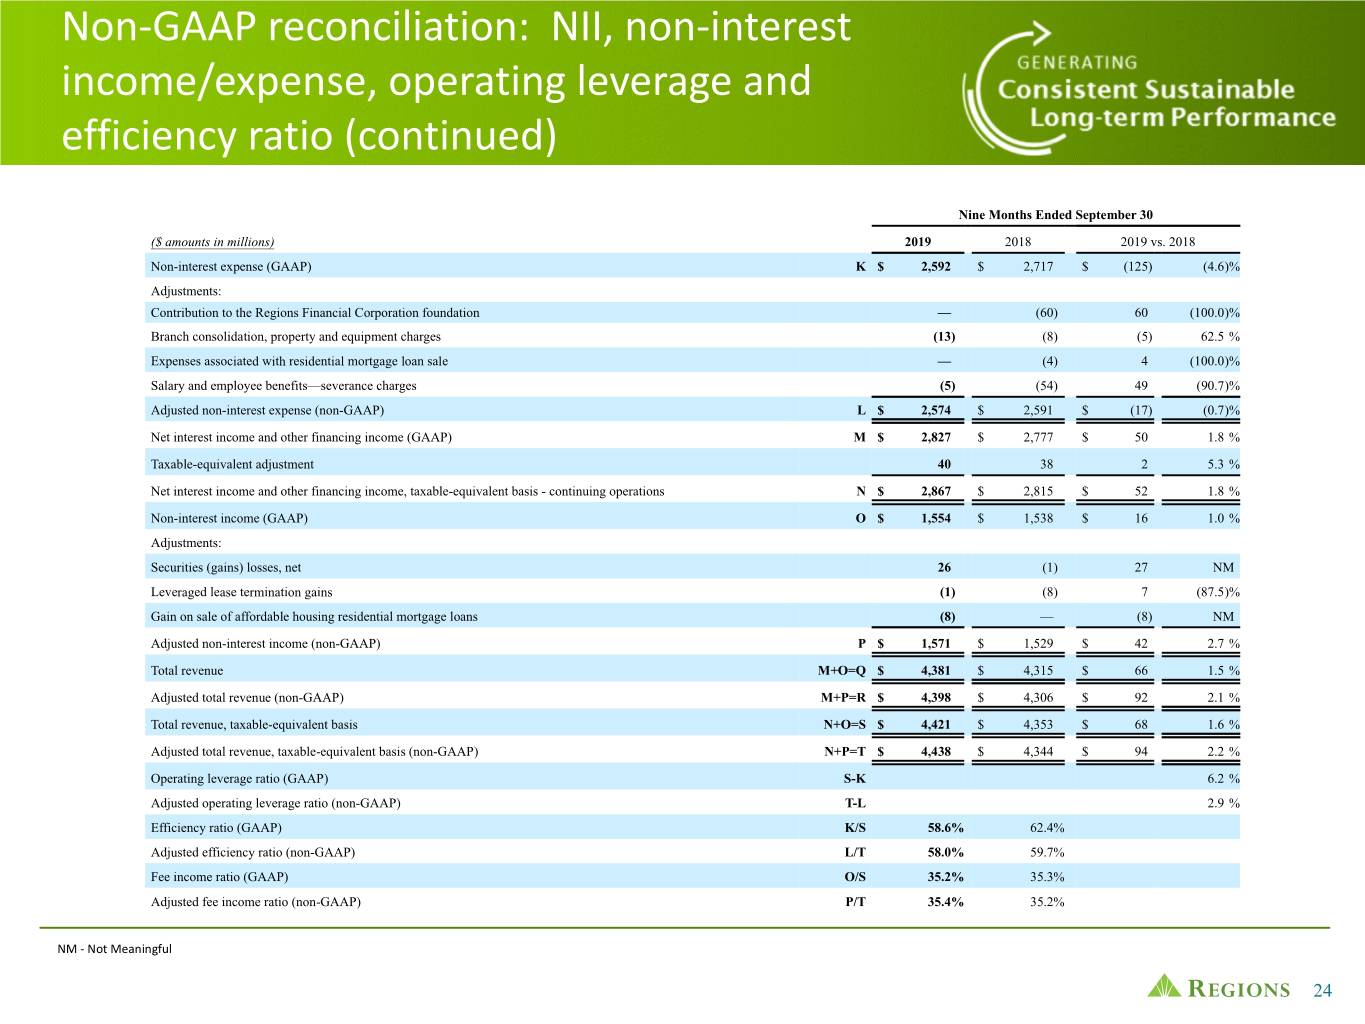
Non-GAAP reconciliation: NII, non-interest income/expense, operating leverage and efficiency ratio (continued) Nine Months Ended September 30 ($ amounts in millions) 2019 2018 2019 vs. 2018 Non-interest expense (GAAP) K $ 2,592 $ 2,717 $ (125) (4.6)% Adjustments: Contribution to the Regions Financial Corporation foundation — (60) 60 (100.0)% Branch consolidation, property and equipment charges (13) (8) (5) 62.5 % Expenses associated with residential mortgage loan sale — (4) 4 (100.0)% Salary and employee benefits—severance charges (5) (54) 49 (90.7)% Adjusted non-interest expense (non-GAAP) L $ 2,574 $ 2,591 $ (17) (0.7)% Net interest income and other financing income (GAAP) M $ 2,827 $ 2,777 $ 50 1.8 % Taxable-equivalent adjustment 40 38 2 5.3 % Net interest income and other financing income, taxable-equivalent basis - continuing operations N $ 2,867 $ 2,815 $ 52 1.8 % Non-interest income (GAAP) O $ 1,554 $ 1,538 $ 16 1.0 % Adjustments: Securities (gains) losses, net 26 (1) 27 NM Leveraged lease termination gains (1) (8) 7 (87.5)% Gain on sale of affordable housing residential mortgage loans (8) — (8) NM Adjusted non-interest income (non-GAAP) P $ 1,571 $ 1,529 $ 42 2.7 % Total revenue M+O=Q $ 4,381 $ 4,315 $ 66 1.5 % Adjusted total revenue (non-GAAP) M+P=R $ 4,398 $ 4,306 $ 92 2.1 % Total revenue, taxable-equivalent basis N+O=S $ 4,421 $ 4,353 $ 68 1.6 % Adjusted total revenue, taxable-equivalent basis (non-GAAP) N+P=T $ 4,438 $ 4,344 $ 94 2.2 % Operating leverage ratio (GAAP) S-K 6.2 % Adjusted operating leverage ratio (non-GAAP) T-L 2.9 % Efficiency ratio (GAAP) K/S 58.6% 62.4% Adjusted efficiency ratio (non-GAAP) L/T 58.0% 59.7% Fee income ratio (GAAP) O/S 35.2% 35.3% Adjusted fee income ratio (non-GAAP) P/T 35.4% 35.2% NM - Not Meaningful 24
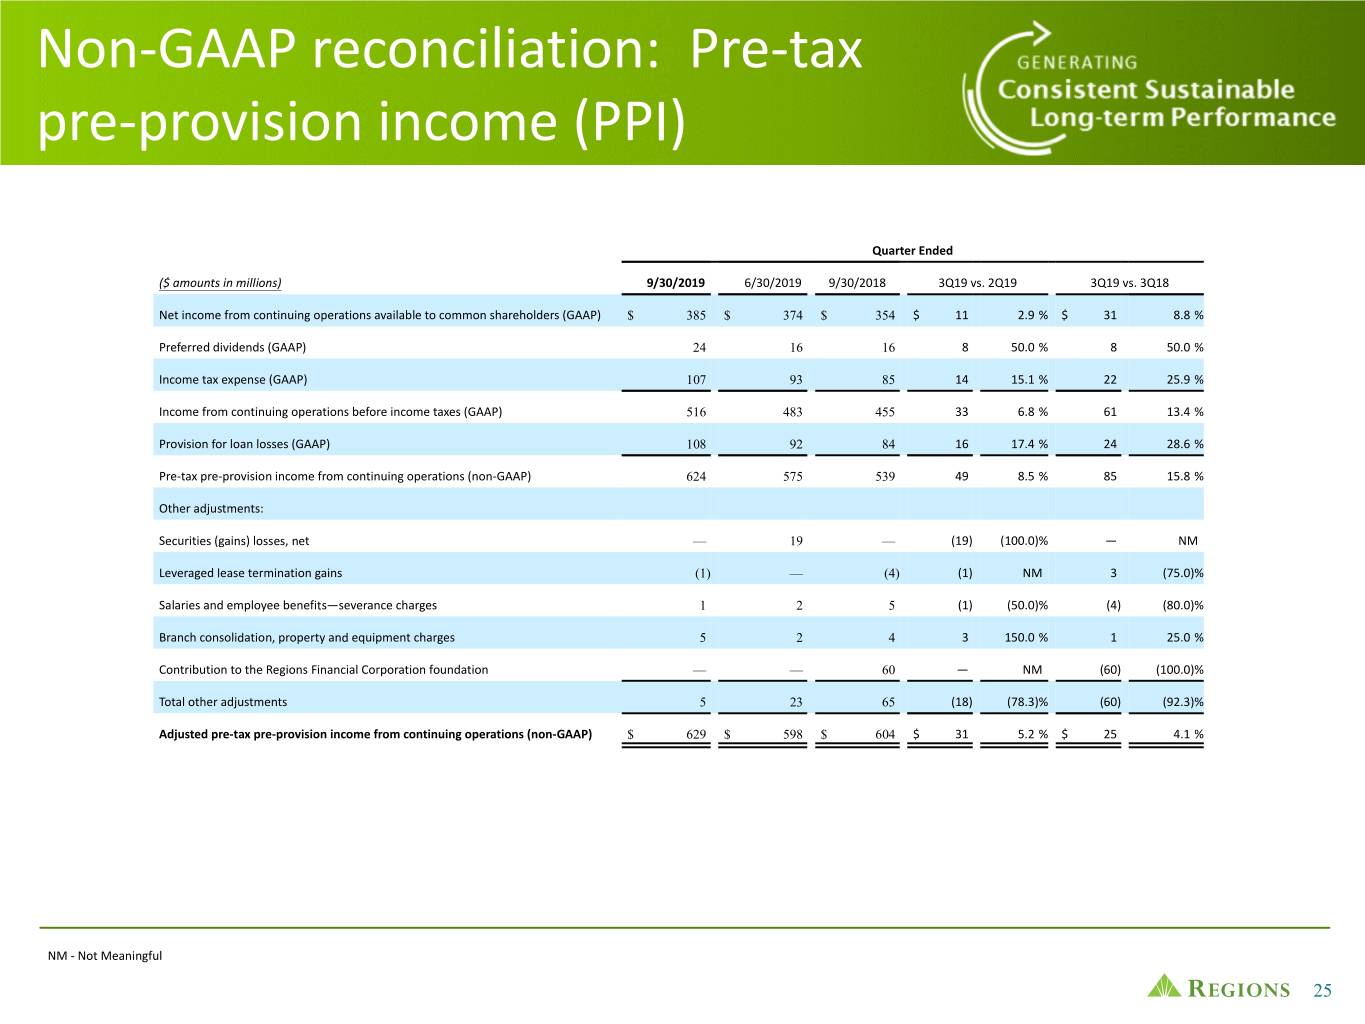
Non-GAAP reconciliation: Pre-tax pre-provision income (PPI) Quarter Ended ($ amounts in millions) 9/30/2019 6/30/2019 9/30/2018 3Q19 vs. 2Q19 3Q19 vs. 3Q18 Net income from continuing operations available to common shareholders (GAAP) $ 385 $ 374 $ 354 $ 11 2.9 % $ 31 8.8 % Preferred dividends (GAAP) 24 16 16 8 50.0 % 8 50.0 % Income tax expense (GAAP) 107 93 85 14 15.1 % 22 25.9 % Income from continuing operations before income taxes (GAAP) 516 483 455 33 6.8 % 61 13.4 % Provision for loan losses (GAAP) 108 92 84 16 17.4 % 24 28.6 % Pre-tax pre-provision income from continuing operations (non-GAAP) 624 575 539 49 8.5 % 85 15.8 % Other adjustments: Securities (gains) losses, net — 19 — (19) (100.0)% — NM Leveraged lease termination gains (1) — (4) (1) NM 3 (75.0)% Salaries and employee benefits—severance charges 1 2 5 (1) (50.0)% (4) (80.0)% Branch consolidation, property and equipment charges 5 2 4 3 150.0 % 1 25.0 % Contribution to the Regions Financial Corporation foundation — — 60 — NM (60) (100.0)% Total other adjustments 5 23 65 (18) (78.3)% (60) (92.3)% Adjusted pre-tax pre-provision income from continuing operations (non-GAAP) $ 629 $ 598 $ 604 $ 31 5.2 % $ 25 4.1 % NM - Not Meaningful 25
Forward-looking statements Forward-Looking Statements This presentation may include forward-looking statements as defined in the Private Securities Litigation Reform Act of 1995. Forward-looking statements are not based on historical information, but rather are related to future operations, strategies, financial results or other developments. Forward-looking statements are based on management’s current expectations as well as certain assumptions and estimates made by, and information available to, management at the time the statements are made. Those statements are based on general assumptions and are subject to various risks, and because they also relate to the future they are likewise subject to inherent uncertainties and other factors that may cause actual results to differ materially from the views, beliefs and projections expressed in such statements. Therefore, we caution you against relying on any of these forward-looking statements. These risks, uncertainties and other factors include, but are not limited to, those described below: • Current and future economic and market conditions in the United States generally or in the communities we serve, including the effects of possible declines in property values, increases in unemployment rates and potential reductions of economic growth, which may adversely affect our lending and other businesses and our financial results and conditions. • Possible changes in trade, monetary and fiscal policies of, and other activities undertaken by, governments, agencies, central banks and similar organizations, which could have a material adverse effect on our earnings. • Possible changes in market interest rates or capital markets could adversely affect our revenue and expense, the value of assets and obligations, and the availability and cost of capital and liquidity. • Any impairment of our goodwill or other intangibles, any repricing of assets, or any adjustment of valuation allowances on our deferred tax assets due to changes in law, adverse changes in the economic environment, declining operations of the reporting unit or other factors. • The effect of changes in tax laws, including the effect of any future interpretations of or amendments to Tax Reform, which may impact our earnings, capital ratios and our ability to return capital to stockholders. • Possible changes in the creditworthiness of customers and the possible impairment of the collectability of loans and leases, including operating leases. • Changes in the speed of loan prepayments, loan origination and sale volumes, charge-offs, loan loss provisions or actual loan losses where our allowance for loan losses may not be adequate to cover our eventual losses. • Possible acceleration of prepayments on mortgage-backed securities due to low interest rates, and the related acceleration of premium amortization on those securities. • Loss of customer checking and savings account deposits as customers pursue other, higher-yield investments, which could increase our funding costs. • Possible changes in consumer and business spending and saving habits and the related effect on our ability to increase assets and to attract deposits, which could adversely affect our net income. • Our ability to effectively compete with other traditional and non-traditional financial services companies, some of whom possess greater financial resources than we do or are subject to different regulatory standards than we are. • Our inability to develop and gain acceptance from current and prospective customers for new products and services and the enhancement of existing products and services to meet customers’ needs and respond to emerging technological trends in a timely manner could have a negative impact on our revenue. • Our inability to keep pace with technological changes could result in losing business to competitors. • Changes in laws and regulations affecting our businesses, including legislation and regulations relating to bank products and services, as well as changes in the enforcement and interpretation of such laws and regulations by applicable governmental and self- regulatory agencies, which could require us to change certain business practices, increase compliance risk, reduce our revenue, impose additional costs on us, or otherwise negatively affect our businesses. • Our ability to obtain a regulatory non-objection (as part of the CCAR process or otherwise) to take certain capital actions, including paying dividends and any plans to increase common stock dividends, repurchase common stock under current or future programs, or redeem preferred stock or other regulatory capital instruments, may impact our ability to return capital to stockholders and market perceptions of us. • Our ability to comply with stress testing and capital planning requirements (as part of the CCAR process or otherwise) may continue to require a significant investment of our managerial resources due to the importance of such tests and requirements. • Our ability to comply with applicable capital and liquidity requirements (including, among other things, the Basel III capital standards and the LCR rule), including our ability to generate capital internally or raise capital on favorable terms, and if we fail to meet requirements, our financial condition could be negatively impacted. • The effects of any developments, changes or actions relating to any litigation or regulatory proceedings brought against us or any of our subsidiaries. • The costs, including possibly incurring fines, penalties, or other negative effects (including reputational harm) of any adverse judicial, administrative, or arbitral rulings or proceedings, regulatory enforcement actions, or other legal actions to which we or any of our subsidiaries are a party, and which may adversely affect our results. • Our ability to manage fluctuations in the value of assets and liabilities and off-balance sheet exposure so as to maintain sufficient capital and liquidity to support our business. • Our ability to execute on our strategic and operational plans, including our ability to fully realize the financial and non-financial benefits relating to our strategic initiatives. • The risks and uncertainties related to our acquisition or divestiture of businesses. 26
Forward-looking statements (continued) • The success of our marketing efforts in attracting and retaining customers. • Our ability to recruit and retain talented and experienced personnel to assist in the development, management and operation of our products and services may be affected by changes in laws and regulations in effect from time to time. • Fraud or misconduct by our customers, employees or business partners. • Any inaccurate or incomplete information provided to us by our customers or counterparties. • Inability of our framework to manage risks associated with our business such as credit risk and operational risk, including third-party vendors and other service providers, which could, among other things, result in a breach of operating or security systems as a result of a cyber attack or similar act or failure to deliver our services effectively. • Dependence on key suppliers or vendors to obtain equipment and other supplies for our business on acceptable terms. • The inability of our internal controls and procedures to prevent, detect or mitigate any material errors or fraudulent acts. • The effects of geopolitical instability, including wars, conflicts and terrorist attacks and the potential impact, directly or indirectly, on our businesses. • The effects of man-made and natural disasters, including fires, floods, droughts, tornadoes, hurricanes, and environmental damage, which may negatively affect our operations and/or our loan portfolios and increase our cost of conducting business. The severity and impact of future earthquakes, fires, hurricanes, tornadoes, droughts, floods and other weather-related events are difficult to predict and may be exacerbated by global climate change. • Changes in commodity market prices and conditions could adversely affect the cash flows of our borrowers operating in industries that are impacted by changes in commodity prices (including businesses indirectly impacted by commodities prices such as businesses that transport commodities or manufacture equipment used in the production of commodities), which could impair their ability to service any loans outstanding to them and/or reduce demand for loans in those industries. • Our ability to identify and address cyber-security risks such as data security breaches, malware, “denial of service” attacks, “hacking” and identity theft, including account take-overs, a failure of which could disrupt our business and result in the disclosure of and/or misuse or misappropriation of confidential or proprietary information, disruption or damage to our systems, increased costs, losses, or adverse effects to our reputation. • Our ability to realize our adjusted efficiency ratio target as part of our expense management initiatives. • Possible cessation or market replacement of LIBOR and the related effect on our LIBOR-based financial products and contracts, including, but not limited to, hedging products, debt obligations, investments, and loans. • Possible downgrades in our credit ratings or outlook could increase the costs of funding from capital markets. • The effects of a possible downgrade in the U.S. government’s sovereign credit rating or outlook, which could result in risks to us and general economic conditions that we are not able to predict. • The effects of problems encountered by other financial institutions that adversely affect us or the banking industry generally could require us to change certain business practices, reduce our revenue, impose additional costs on us, or otherwise negatively affect our businesses. • The effects of the failure of any component of our business infrastructure provided by a third party could disrupt our businesses, result in the disclosure of and/or misuse of confidential information or proprietary information, increase our costs, negatively affect our reputation, and cause losses. • Our ability to receive dividends from our subsidiaries could affect our liquidity and ability to pay dividends to shareholders. • Changes in accounting policies or procedures as may be required by the FASB or other regulatory agencies could materially affect our financial statements and how we report those results, and expectations and preliminary analyses relating to how such changes will affect our financial results could prove incorrect. • Other risks identified from time to time in reports that we file with the SEC. • Fluctuations in the price of our common stock and inability to complete stock repurchases in the time frame and/or on the terms anticipated. • The effects of any damage to our reputation resulting from developments related to any of the items identified above. The foregoing list of factors is not exhaustive. For discussion of these and other factors that may cause actual results to differ from expectations, look under the captions “Forward-Looking Statements” and “Risk Factors” of Regions’ Annual Report on Form 10-K for the year ended December 31, 2018 as filed with the SEC. The words "future," “anticipates,” "assumes," “intends,” “plans,” “seeks,” “believes,” "predicts," "potential," "objectives," “estimates,” “expects,” “targets,” “projects,” “outlook,” “forecast,” "would," “will,” “may,” “might,” “could,” “should,” “can,” and similar terms and expressions often signify forward-looking statements. You should not place undue reliance on any forward-looking statements, which speak only as of the date made. Factors or events that could cause our actual results to differ may emerge from time to time, and it is not possible to predict all of them. We assume no obligation and do not intend to update or revise any forward-looking statements that are made from time to time, either as a result of future developments, new information or otherwise, except as may be required by law. Regions’ Investor Relations contact is Dana Nolan at (205) 264-7040; Regions’ Media contact is Evelyn Mitchell at (205) 264-4551. 27

® 28


