Exhibit 99.3 2nd Quarter Earnings Conference Call July 23, 2021
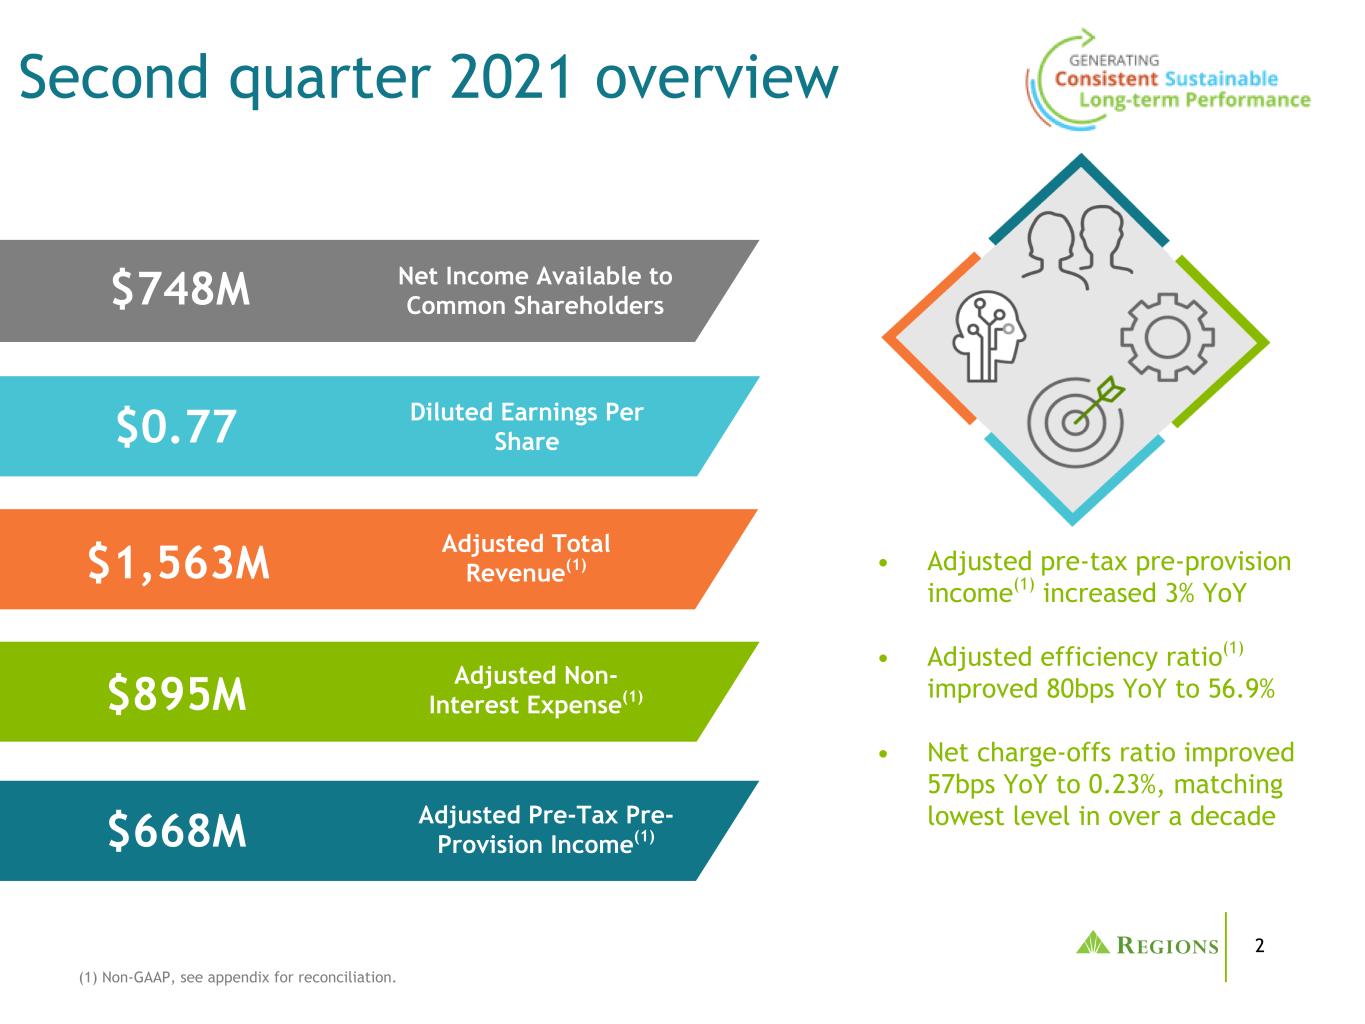
2 Second quarter 2021 overview (1) Non-GAAP, see appendix for reconciliation. Adjusted Pre-Tax Pre- Provision Income(1) Diluted Earnings Per Share Adjusted Total Revenue(1) Adjusted Non- Interest Expense(1) Net Income Available to Common Shareholders $668M $0.77 $1,563M $895M $748M • Adjusted pre-tax pre-provision income(1) increased 3% YoY • Adjusted efficiency ratio(1) improved 80bps YoY to 56.9% • Net charge-offs ratio improved 57bps YoY to 0.23%, matching lowest level in over a decade
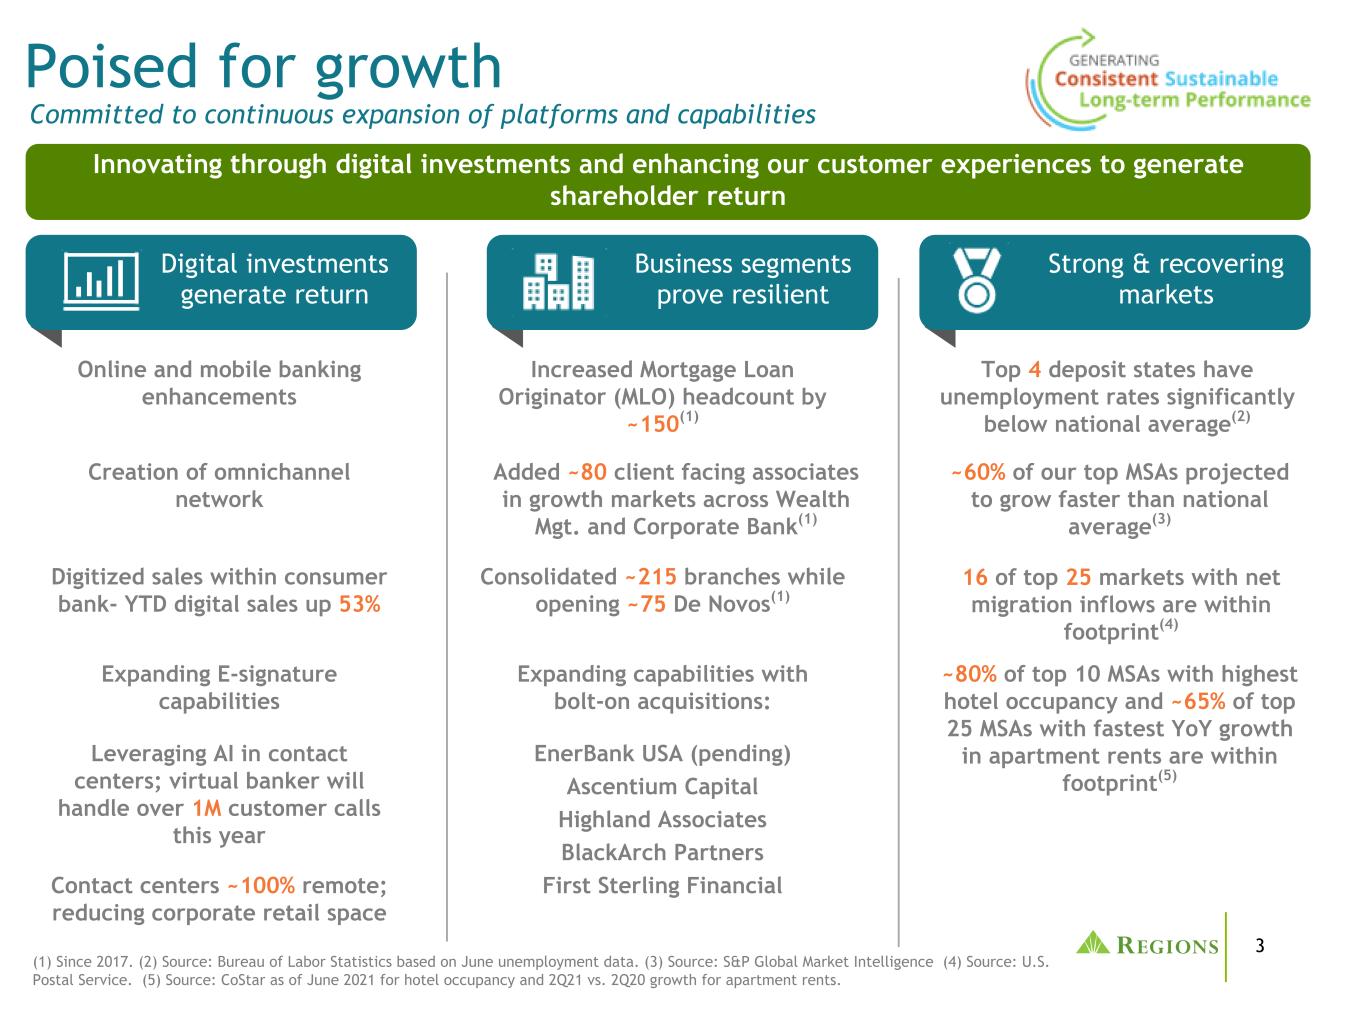
3 Poised for growth Innovating through digital investments and enhancing our customer experiences to generate shareholder return Online and mobile banking enhancements Creation of omnichannel network Digitized sales within consumer bank- YTD digital sales up 53% Expanding E-signature capabilities Committed to continuous expansion of platforms and capabilities Leveraging AI in contact centers; virtual banker will handle over 1M customer calls this year Digital investments generate return Increased Mortgage Loan Originator (MLO) headcount by ~150(1) Added ~80 client facing associates in growth markets across Wealth Mgt. and Corporate Bank(1) Consolidated ~215 branches while opening ~75 De Novos(1) Business segments prove resilient Strong & recovering markets Expanding capabilities with bolt-on acquisitions: Contact centers ~100% remote; reducing corporate retail space EnerBank USA (pending) Ascentium Capital Highland Associates BlackArch Partners First Sterling Financial (1) Since 2017. (2) Source: Bureau of Labor Statistics based on June unemployment data. (3) Source: S&P Global Market Intelligence (4) Source: U.S. Postal Service. (5) Source: CoStar as of June 2021 for hotel occupancy and 2Q21 vs. 2Q20 growth for apartment rents. Top 4 deposit states have unemployment rates significantly below national average(2) ~60% of our top MSAs projected to grow faster than national average(3) 16 of top 25 markets with net migration inflows are within footprint(4) ~80% of top 10 MSAs with highest hotel occupancy and ~65% of top 25 MSAs with fastest YoY growth in apartment rents are within footprint(5)
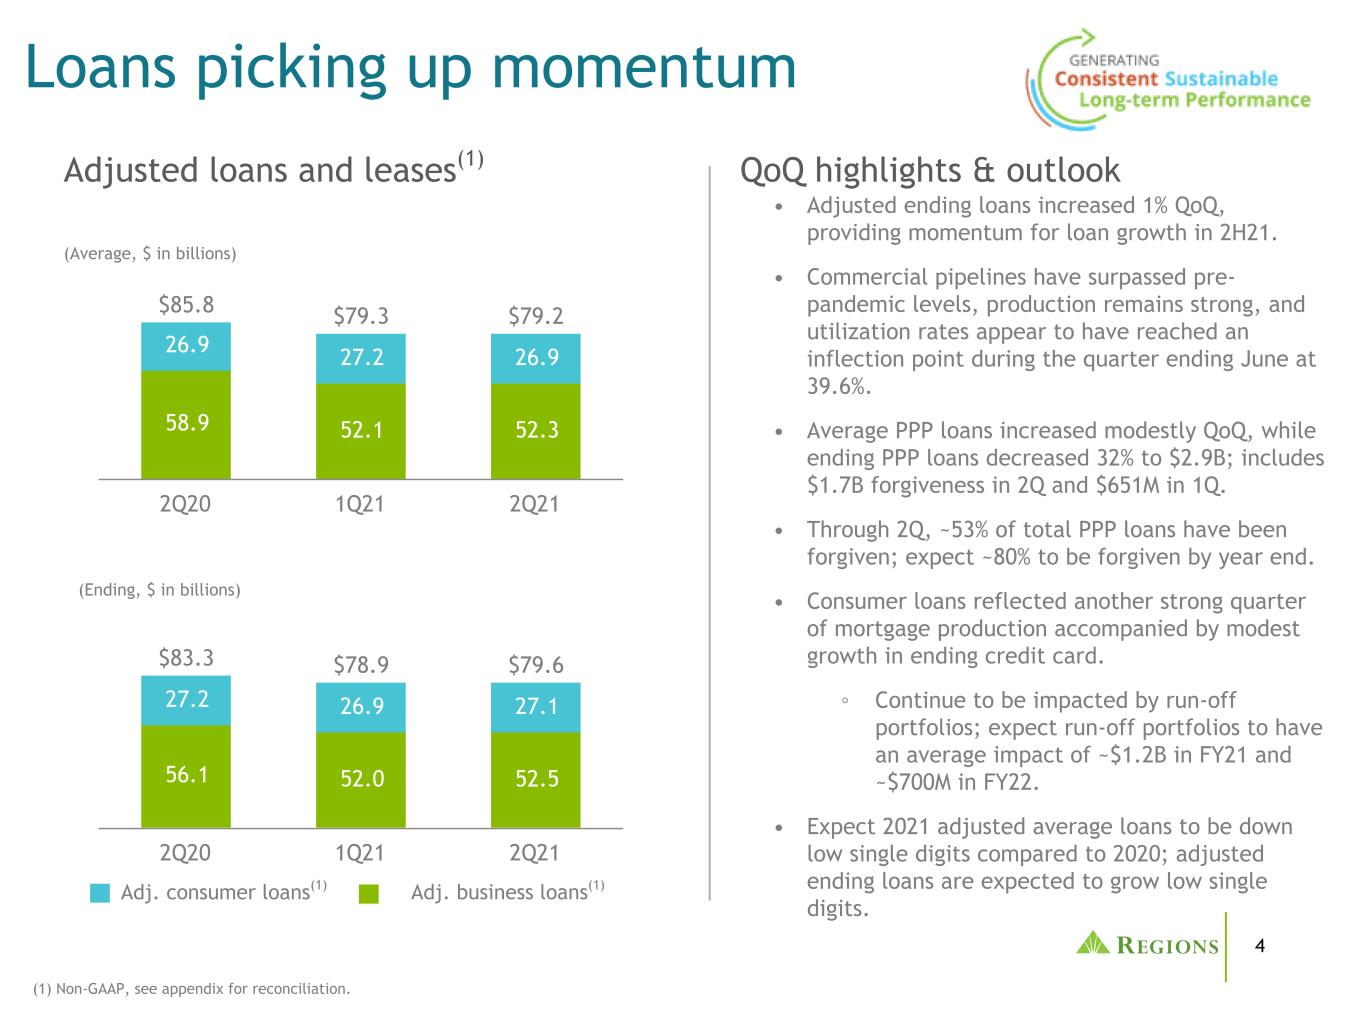
4 Loans picking up momentum (1) Non-GAAP, see appendix for reconciliation. $83.3 $78.9 $79.6 56.1 52.0 52.5 27.2 26.9 27.1 2Q20 1Q21 2Q21 (Ending, $ in billions) $85.8 $79.3 $79.2 58.9 52.1 52.3 26.9 27.2 26.9 2Q20 1Q21 2Q21 Adjusted loans and leases(1) (Average, $ in billions) Adj. business loans(1)Adj. consumer loans(1) • Adjusted ending loans increased 1% QoQ, providing momentum for loan growth in 2H21. • Commercial pipelines have surpassed pre- pandemic levels, production remains strong, and utilization rates appear to have reached an inflection point during the quarter ending June at 39.6%. • Average PPP loans increased modestly QoQ, while ending PPP loans decreased 32% to $2.9B; includes $1.7B forgiveness in 2Q and $651M in 1Q. • Through 2Q, ~53% of total PPP loans have been forgiven; expect ~80% to be forgiven by year end. • Consumer loans reflected another strong quarter of mortgage production accompanied by modest growth in ending credit card. ◦ Continue to be impacted by run-off portfolios; expect run-off portfolios to have an average impact of ~$1.2B in FY21 and ~$700M in FY22. • Expect 2021 adjusted average loans to be down low single digits compared to 2020; adjusted ending loans are expected to grow low single digits. QoQ highlights & outlook
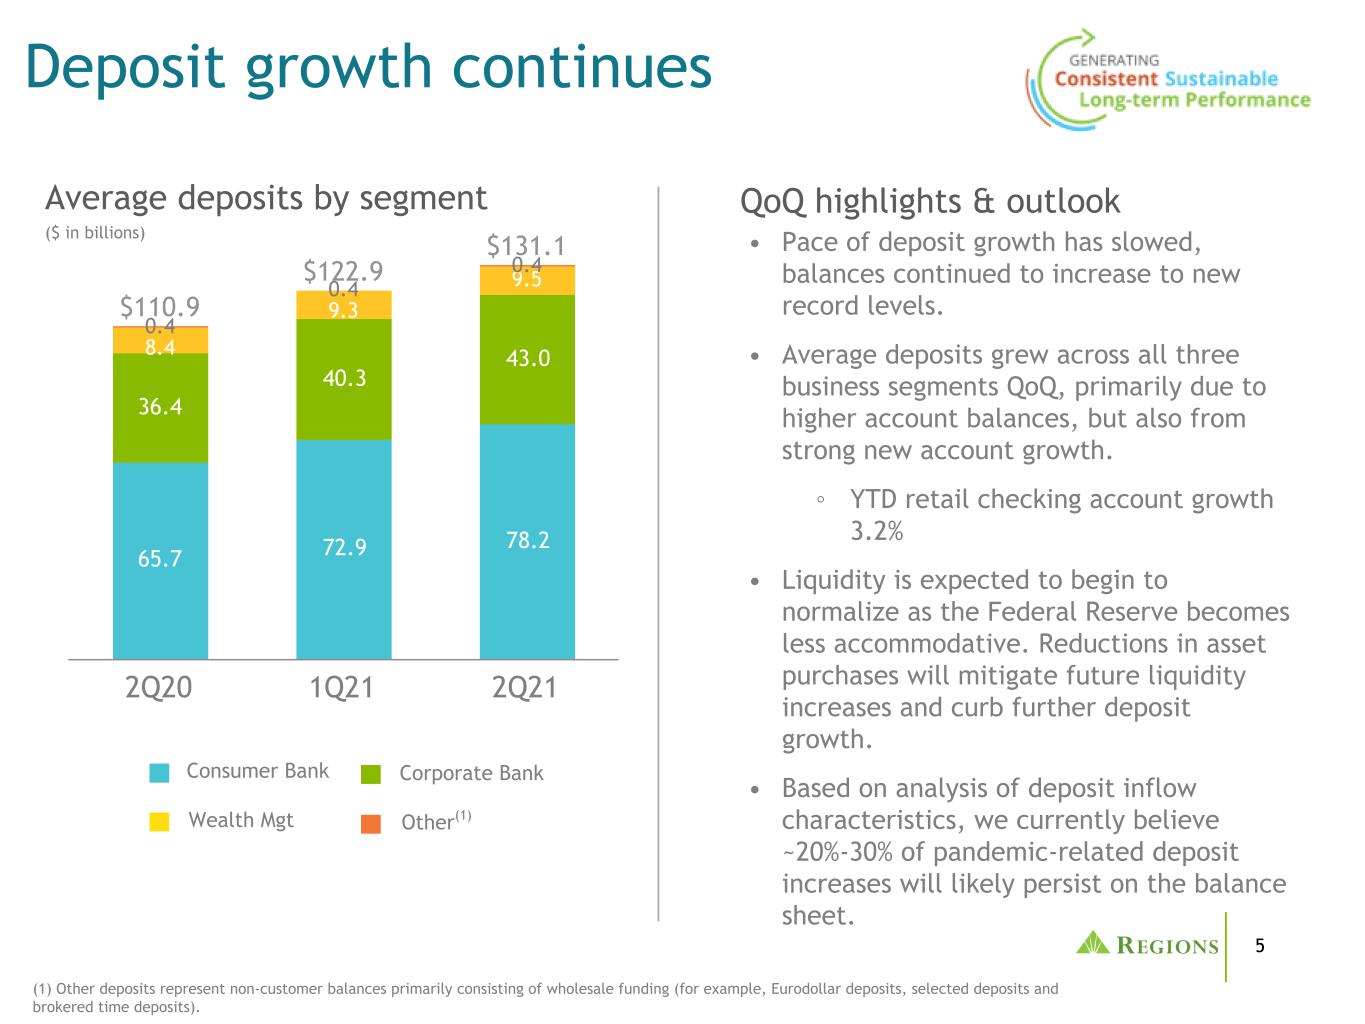
5 $110.9 $122.9 $131.1 65.7 72.9 78.2 36.4 40.3 43.08.4 9.3 9.5 0.4 0.4 0.4 2Q20 1Q21 2Q21 Deposit growth continues (1) Other deposits represent non-customer balances primarily consisting of wholesale funding (for example, Eurodollar deposits, selected deposits and brokered time deposits). Average deposits by segment ($ in billions) Wealth Mgt Other(1) Consumer Bank Corporate Bank • Pace of deposit growth has slowed, balances continued to increase to new record levels. • Average deposits grew across all three business segments QoQ, primarily due to higher account balances, but also from strong new account growth. ◦ YTD retail checking account growth 3.2% • Liquidity is expected to begin to normalize as the Federal Reserve becomes less accommodative. Reductions in asset purchases will mitigate future liquidity increases and curb further deposit growth. • Based on analysis of deposit inflow characteristics, we currently believe ~20%-30% of pandemic-related deposit increases will likely persist on the balance sheet. QoQ highlights & outlook

6 $985 $978 $975 3.19% 3.02% 2.81% 3.36% 3.40% 3.31% 2Q20 1Q21 2Q21 NII(1) Net interest income and net interest margin - liquidity impacts NII(1) and NIM ($ in millions) (1) Net interest income (NII) on a fully taxable-equivalent basis. (2) Non-GAAP; see appendix for reconciliation. NIM • In 2Q, deposit and cash balances remained elevated given stimulus / liquidity in the system. • PPP and cash account for -50 bps NIM and +$46M NII within the quarter (-12bps / +$4M QoQ) ◦ PPP loans account for +5 bps NIM and +$43M NII within the quarter (+1bps / +$3M QoQ) ◦ Excess cash accounts for -55 bps NIM and +$3M NII (-13bps / +$1M QoQ) • Total of ~$15B active balance sheet management since pandemic began, balancing risk and return including $2B cash which was deployed into securities in 2Q21. ◦ -10bps cumulative impact to adjusted NIM(2) from $5B post-pandemic securities additions. NIM excl. PPP/Cash(2)
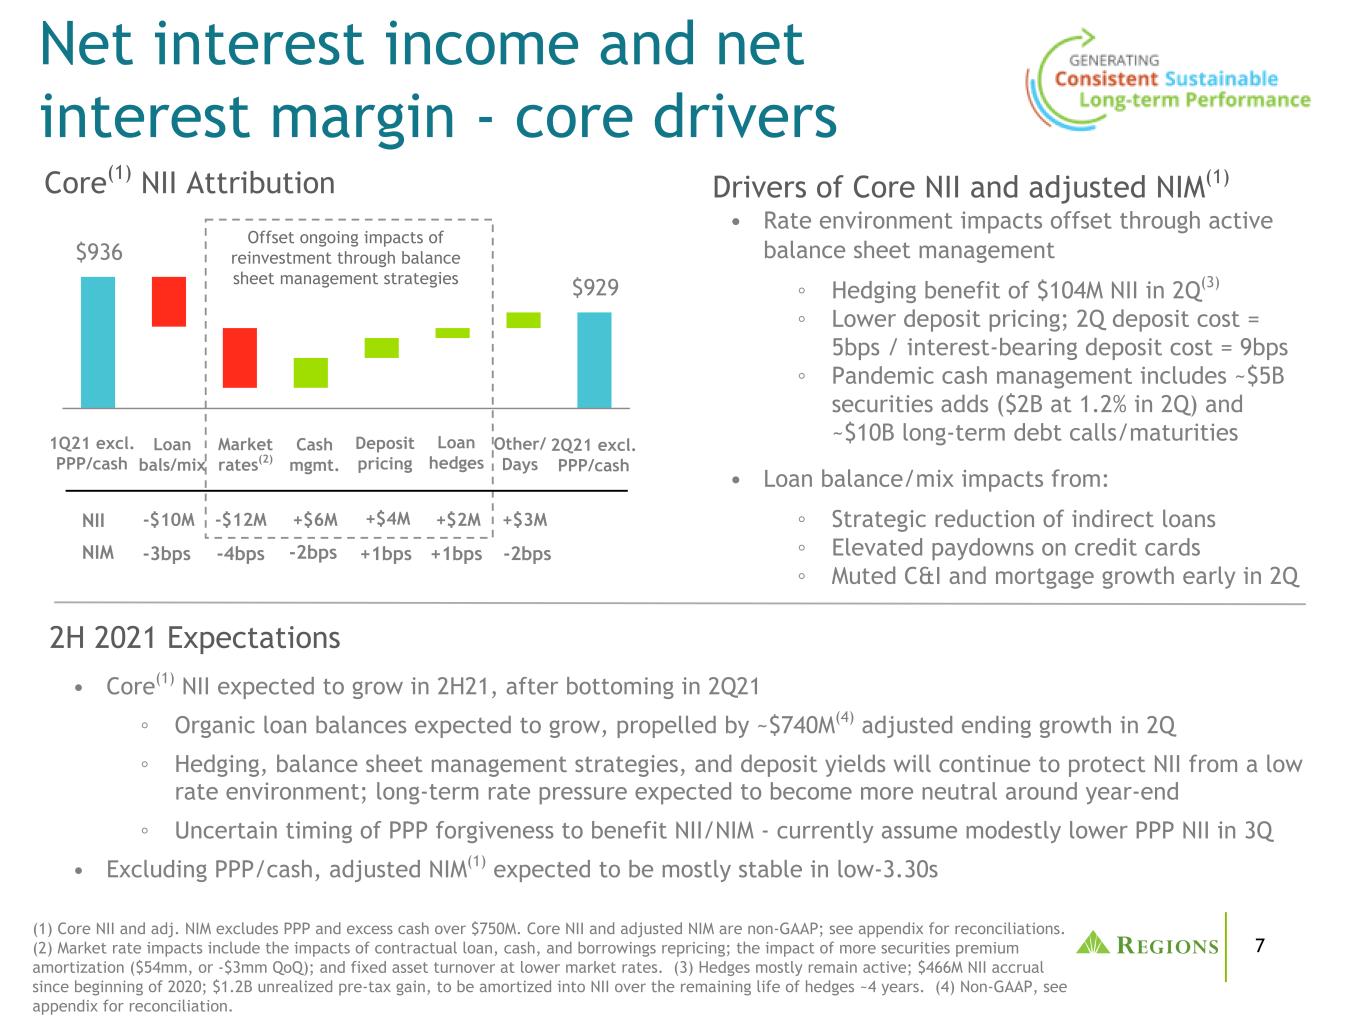
7 • Rate environment impacts offset through active balance sheet management ◦ Hedging benefit of $104M NII in 2Q(3) ◦ Lower deposit pricing; 2Q deposit cost = 5bps / interest-bearing deposit cost = 9bps ◦ Pandemic cash management includes ~$5B securities adds ($2B at 1.2% in 2Q) and ~$10B long-term debt calls/maturities • Loan balance/mix impacts from: ◦ Strategic reduction of indirect loans ◦ Elevated paydowns on credit cards ◦ Muted C&I and mortgage growth early in 2Q (1) Core NII and adj. NIM excludes PPP and excess cash over $750M. Core NII and adjusted NIM are non-GAAP; see appendix for reconciliations. (2) Market rate impacts include the impacts of contractual loan, cash, and borrowings repricing; the impact of more securities premium amortization ($54mm, or -$3mm QoQ); and fixed asset turnover at lower market rates. (3) Hedges mostly remain active; $466M NII accrual since beginning of 2020; $1.2B unrealized pre-tax gain, to be amortized into NII over the remaining life of hedges ~4 years. (4) Non-GAAP, see appendix for reconciliation. $936 $929 Net interest income and net interest margin - core drivers Core(1) NII Attribution Drivers of Core NII and adjusted NIM(1) 2Q21 excl. PPP/cash 1Q21 excl. PPP/cash -3bps -2bps +1bps +1bps-4bps -$10M +$6M +$4M +$2M-$12M +$3M • Core(1) NII expected to grow in 2H21, after bottoming in 2Q21 ◦ Organic loan balances expected to grow, propelled by ~$740M(4) adjusted ending growth in 2Q ◦ Hedging, balance sheet management strategies, and deposit yields will continue to protect NII from a low rate environment; long-term rate pressure expected to become more neutral around year-end ◦ Uncertain timing of PPP forgiveness to benefit NII/NIM - currently assume modestly lower PPP NII in 3Q • Excluding PPP/cash, adjusted NIM(1) expected to be mostly stable in low-3.30s 2H 2021 Expectations NII NIM Other/ Days -2bps Loan bals/mix Cash mgmt. Market rates(2) Deposit pricing Offset ongoing impacts of reinvestment through balance sheet management strategies Loan hedges
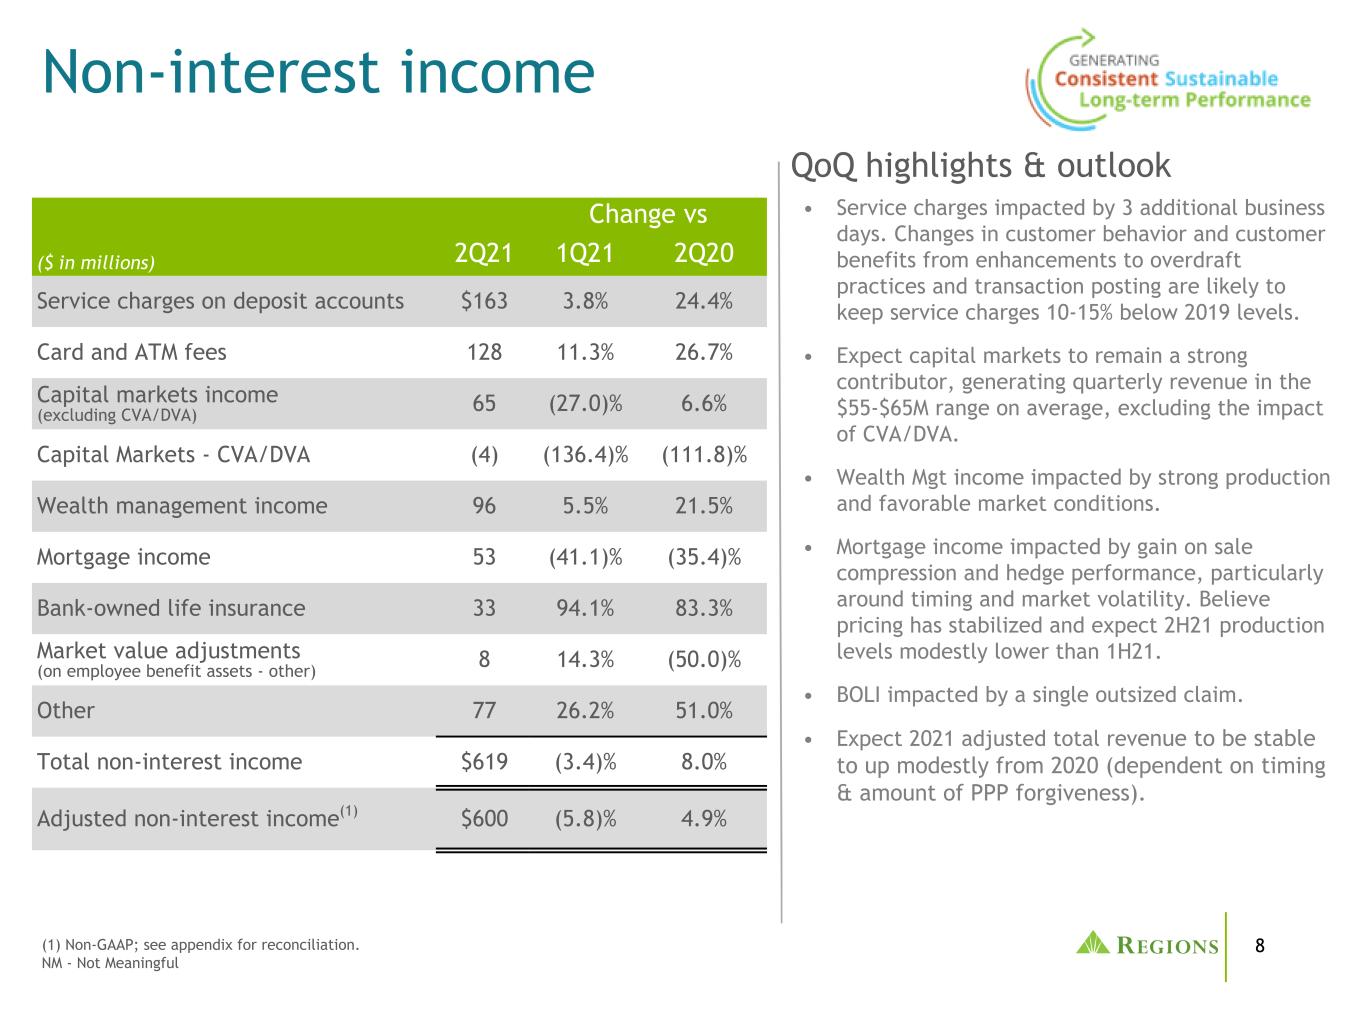
8 • Service charges impacted by 3 additional business days. Changes in customer behavior and customer benefits from enhancements to overdraft practices and transaction posting are likely to keep service charges 10-15% below 2019 levels. • Expect capital markets to remain a strong contributor, generating quarterly revenue in the $55-$65M range on average, excluding the impact of CVA/DVA. • Wealth Mgt income impacted by strong production and favorable market conditions. • Mortgage income impacted by gain on sale compression and hedge performance, particularly around timing and market volatility. Believe pricing has stabilized and expect 2H21 production levels modestly lower than 1H21. • BOLI impacted by a single outsized claim. • Expect 2021 adjusted total revenue to be stable to up modestly from 2020 (dependent on timing & amount of PPP forgiveness). Change vs ($ in millions) 2Q21 1Q21 2Q20 Service charges on deposit accounts $163 3.8% 24.4% Card and ATM fees 128 11.3% 26.7% Capital markets income (excluding CVA/DVA) 65 (27.0)% 6.6% Capital Markets - CVA/DVA (4) (136.4)% (111.8)% Wealth management income 96 5.5% 21.5% Mortgage income 53 (41.1)% (35.4)% Bank-owned life insurance 33 94.1% 83.3% Market value adjustments (on employee benefit assets - other) 8 14.3% (50.0)% Other 77 26.2% 51.0% Total non-interest income $619 (3.4)% 8.0% Adjusted non-interest income(1) $600 (5.8)% 4.9% Non-interest income (1) Non-GAAP; see appendix for reconciliation. NM - Not Meaningful QoQ highlights & outlook
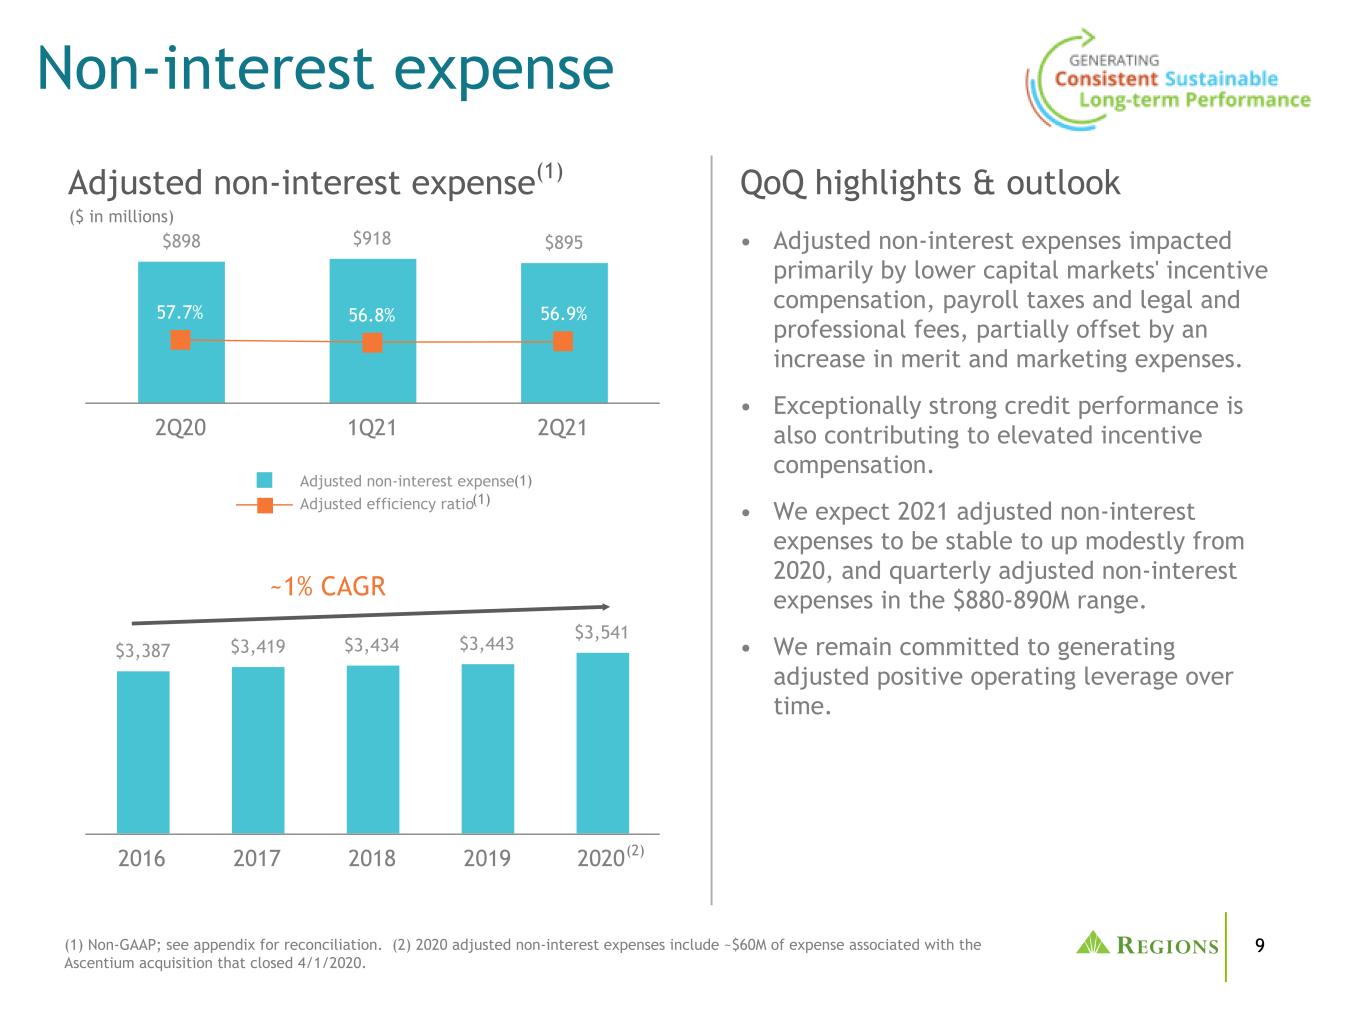
9(1) Non-GAAP; see appendix for reconciliation. (2) 2020 adjusted non-interest expenses include ~$60M of expense associated with the Ascentium acquisition that closed 4/1/2020. • Adjusted non-interest expenses impacted primarily by lower capital markets' incentive compensation, payroll taxes and legal and professional fees, partially offset by an increase in merit and marketing expenses. • Exceptionally strong credit performance is also contributing to elevated incentive compensation. • We expect 2021 adjusted non-interest expenses to be stable to up modestly from 2020, and quarterly adjusted non-interest expenses in the $880-890M range. • We remain committed to generating adjusted positive operating leverage over time. $3,387 $3,419 $3,434 $3,443 $3,541 2016 2017 2018 2019 2020 Non-interest expense QoQ highlights & outlookAdjusted non-interest expense(1) ($ in millions) $898 $918 $895 57.7% 56.8% 56.9% Adjusted non-interest expense Adjusted efficiency ratio 2Q20 1Q21 2Q21 ~1% CAGR (1) (1) (2)
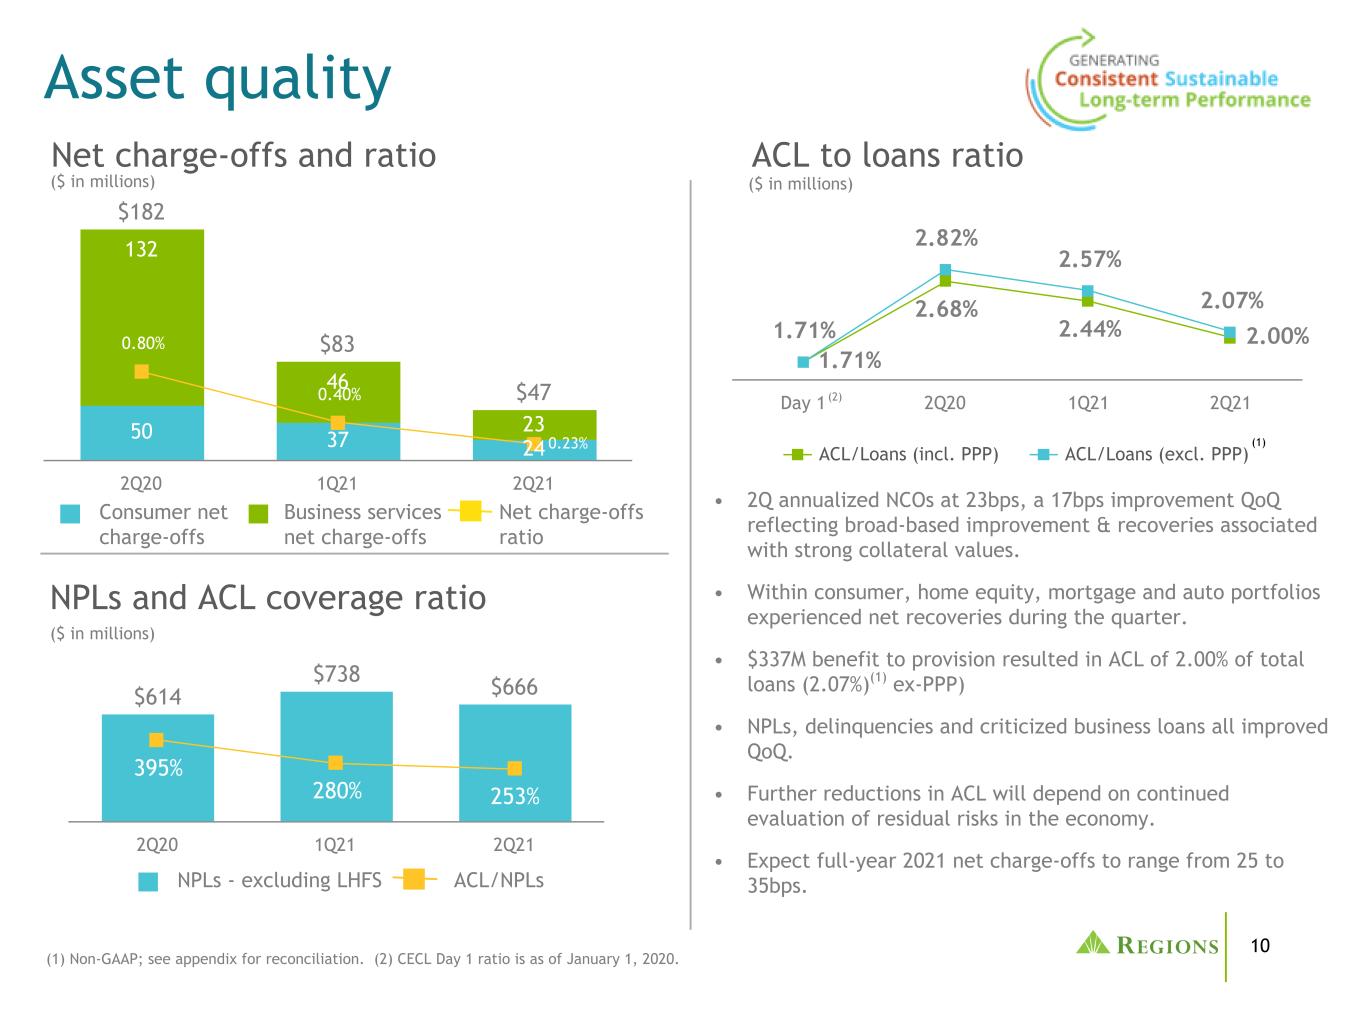
10 1.71% 2.68% 2.44% 2.00%1.71% 2.82% 2.57% 2.07% ACL/Loans (incl. PPP) ACL/Loans (excl. PPP) Day 1 2Q20 1Q21 2Q21 $182 $83 $47 50 37 24 132 46 23 0.80% 0.40% 0.23% 2Q20 1Q21 2Q21 $614 $738 $666 395% 280% 253% 2Q20 1Q21 2Q21 NPLs and ACL coverage ratio Asset quality ($ in millions) ($ in millions) ($ in millions) Net charge-offs and ratio NPLs - excluding LHFS ACL/NPLs Consumer net charge-offs Business services net charge-offs Net charge-offs ratio (1) Non-GAAP; see appendix for reconciliation. (2) CECL Day 1 ratio is as of January 1, 2020. • 2Q annualized NCOs at 23bps, a 17bps improvement QoQ reflecting broad-based improvement & recoveries associated with strong collateral values. • Within consumer, home equity, mortgage and auto portfolios experienced net recoveries during the quarter. • $337M benefit to provision resulted in ACL of 2.00% of total loans (2.07%)(1) ex-PPP) • NPLs, delinquencies and criticized business loans all improved QoQ. • Further reductions in ACL will depend on continued evaluation of residual risks in the economy. • Expect full-year 2021 net charge-offs to range from 25 to 35bps. ACL to loans ratio (2) (1)
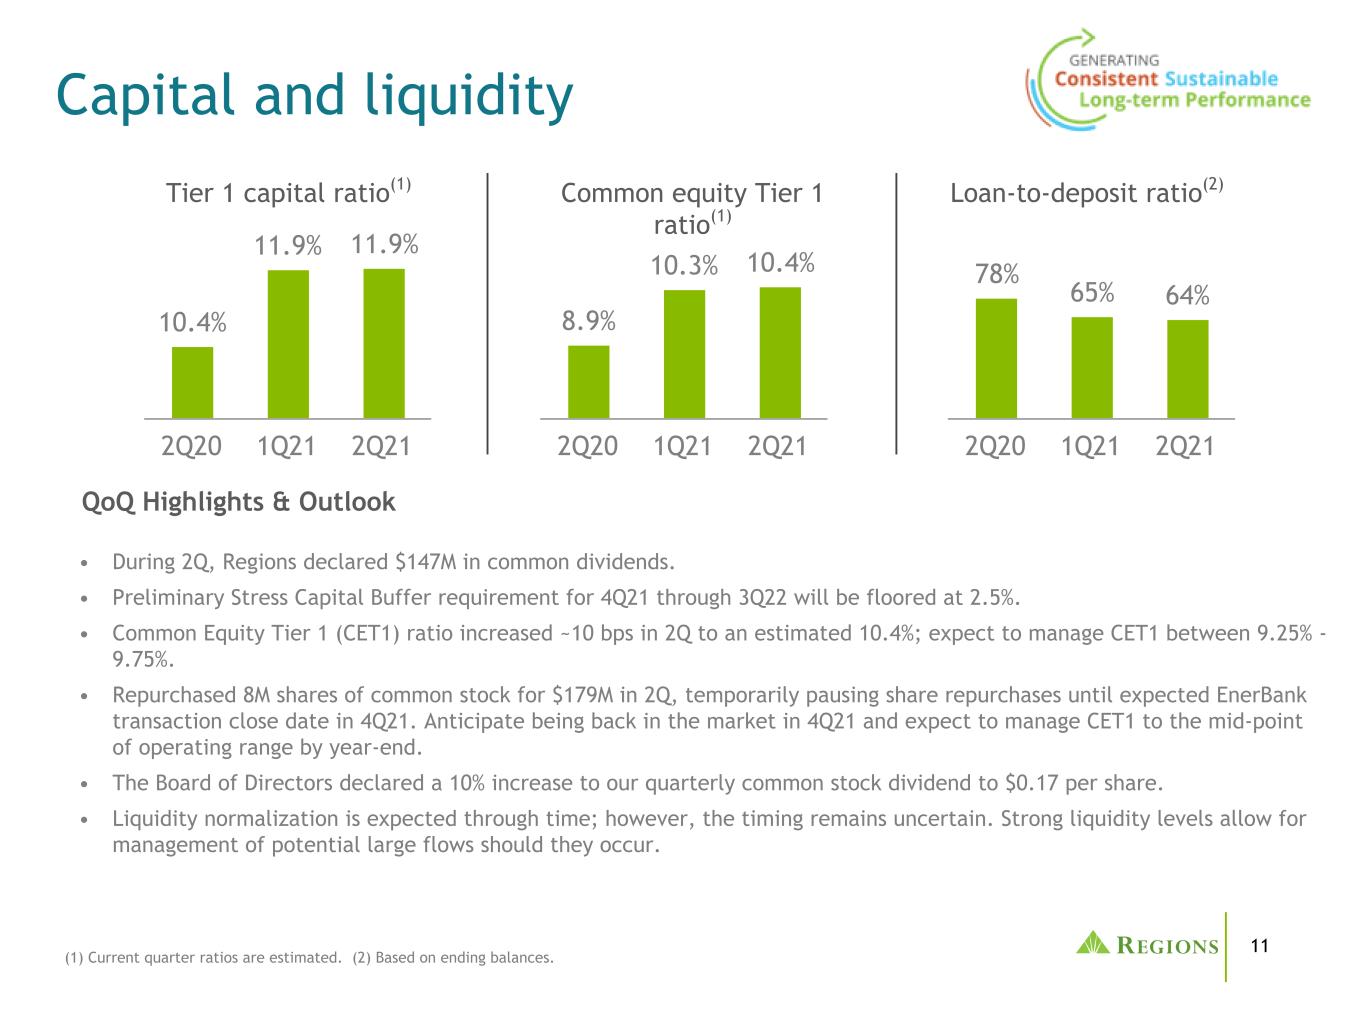
11 Capital and liquidity (1) Current quarter ratios are estimated. (2) Based on ending balances. • During 2Q, Regions declared $147M in common dividends. • Preliminary Stress Capital Buffer requirement for 4Q21 through 3Q22 will be floored at 2.5%. • Common Equity Tier 1 (CET1) ratio increased ~10 bps in 2Q to an estimated 10.4%; expect to manage CET1 between 9.25% - 9.75%. • Repurchased 8M shares of common stock for $179M in 2Q, temporarily pausing share repurchases until expected EnerBank transaction close date in 4Q21. Anticipate being back in the market in 4Q21 and expect to manage CET1 to the mid-point of operating range by year-end. • The Board of Directors declared a 10% increase to our quarterly common stock dividend to $0.17 per share. • Liquidity normalization is expected through time; however, the timing remains uncertain. Strong liquidity levels allow for management of potential large flows should they occur. Common equity Tier 1 ratio(1) 8.9% 10.3% 10.4% 2Q20 1Q21 2Q21 10.4% 11.9% 11.9% 2Q20 1Q21 2Q21 Tier 1 capital ratio(1) Loan-to-deposit ratio(2) 78% 65% 64% 2Q20 1Q21 2Q21 QoQ Highlights & Outlook
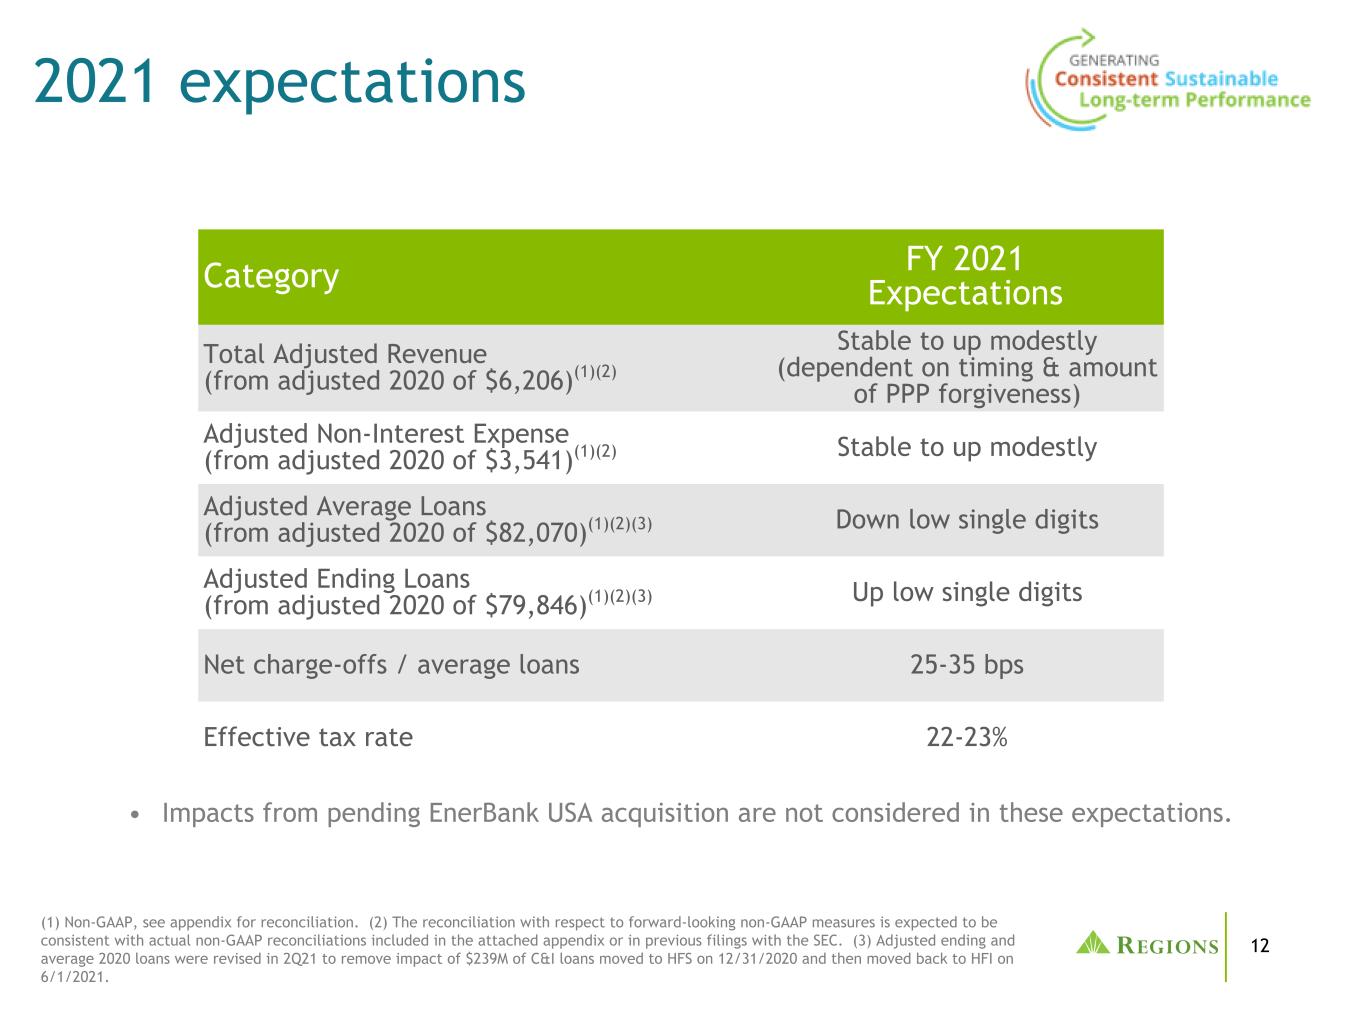
12 2021 expectations (1) Non-GAAP, see appendix for reconciliation. (2) The reconciliation with respect to forward-looking non-GAAP measures is expected to be consistent with actual non-GAAP reconciliations included in the attached appendix or in previous filings with the SEC. (3) Adjusted ending and average 2020 loans were revised in 2Q21 to remove impact of $239M of C&I loans moved to HFS on 12/31/2020 and then moved back to HFI on 6/1/2021. Category FY 2021 Expectations Total Adjusted Revenue (from adjusted 2020 of $6,206)(1)(2) Stable to up modestly (dependent on timing & amount of PPP forgiveness) Adjusted Non-Interest Expense (from adjusted 2020 of $3,541)(1)(2) Stable to up modestly Adjusted Average Loans (from adjusted 2020 of $82,070)(1)(2)(3) Down low single digits Adjusted Ending Loans (from adjusted 2020 of $79,846)(1)(2)(3) Up low single digits Net charge-offs / average loans 25-35 bps Effective tax rate 22-23% • Impacts from pending EnerBank USA acquisition are not considered in these expectations.

13 Appendix
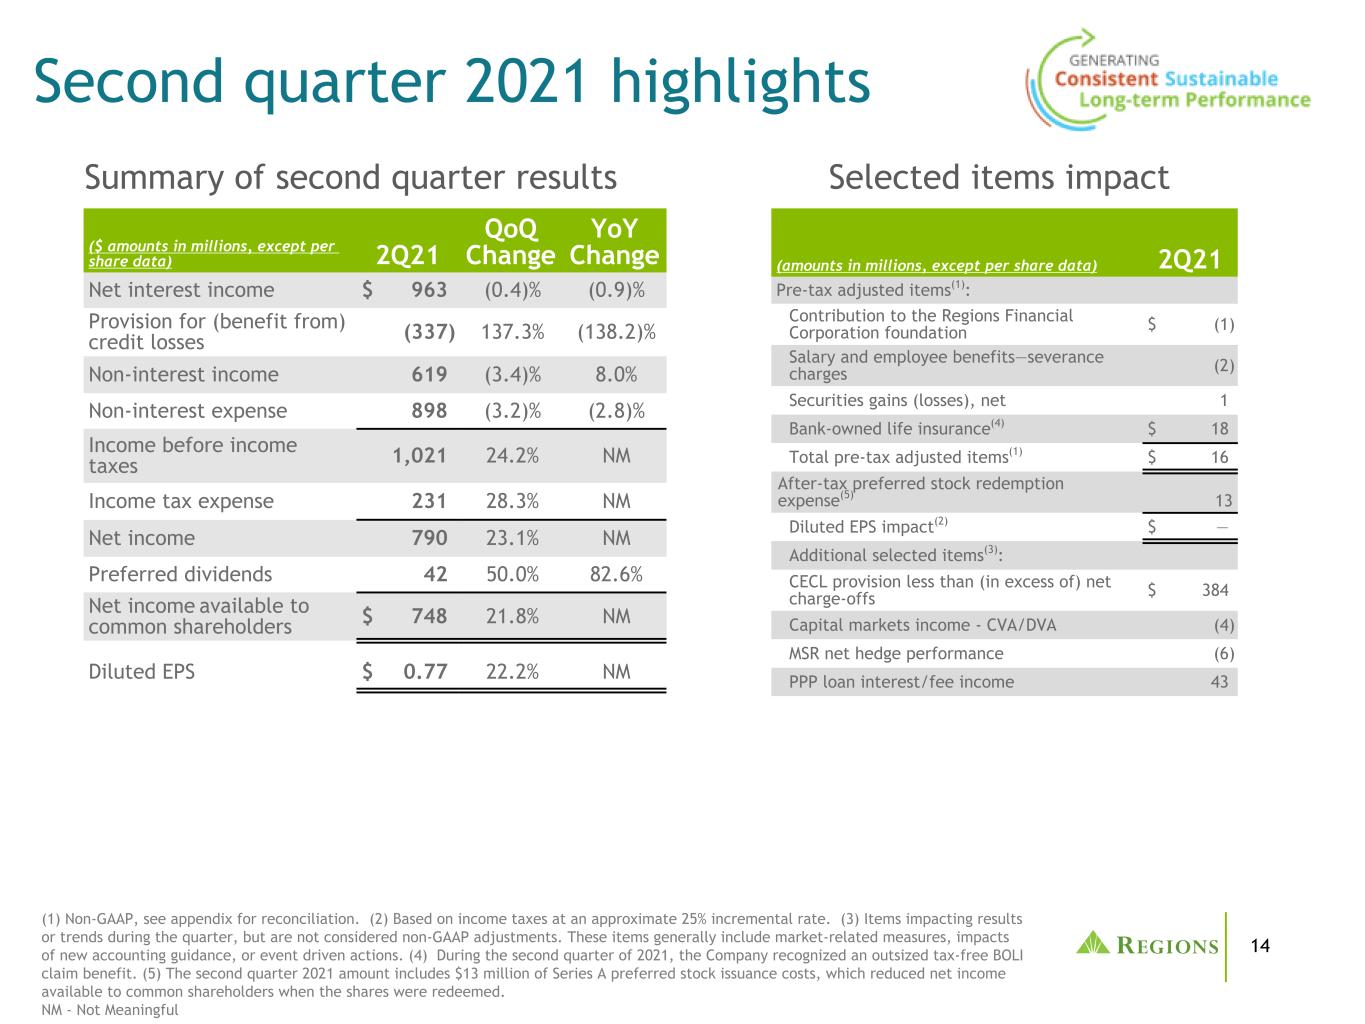
14 Selected items impact Second quarter 2021 highlights (1) Non-GAAP, see appendix for reconciliation. (2) Based on income taxes at an approximate 25% incremental rate. (3) Items impacting results or trends during the quarter, but are not considered non-GAAP adjustments. These items generally include market-related measures, impacts of new accounting guidance, or event driven actions. (4) During the second quarter of 2021, the Company recognized an outsized tax-free BOLI claim benefit. (5) The second quarter 2021 amount includes $13 million of Series A preferred stock issuance costs, which reduced net income available to common shareholders when the shares were redeemed. NM - Not Meaningful ($ amounts in millions, except per share data) 2Q21 QoQ Change YoY Change Net interest income $ 963 (0.4)% (0.9)% Provision for (benefit from) credit losses (337) 137.3% (138.2)% Non-interest income 619 (3.4)% 8.0% Non-interest expense 898 (3.2)% (2.8)% Income before income taxes 1,021 24.2% NM Income tax expense 231 28.3% NM Net income 790 23.1% NM Preferred dividends 42 50.0% 82.6% Net income available to common shareholders $ 748 21.8% NM Diluted EPS $ 0.77 22.2% NM Summary of second quarter results (amounts in millions, except per share data) 2Q21 Pre-tax adjusted items(1): Contribution to the Regions Financial Corporation foundation $ (1) Salary and employee benefits—severance charges (2) Securities gains (losses), net 1 Bank-owned life insurance(4) $ 18 Total pre-tax adjusted items(1) $ 16 After-tax preferred stock redemption expense(5) 13 Diluted EPS impact(2) $ — Additional selected items(3): CECL provision less than (in excess of) net charge-offs $ 384 Capital markets income - CVA/DVA (4) MSR net hedge performance (6) PPP loan interest/fee income 43
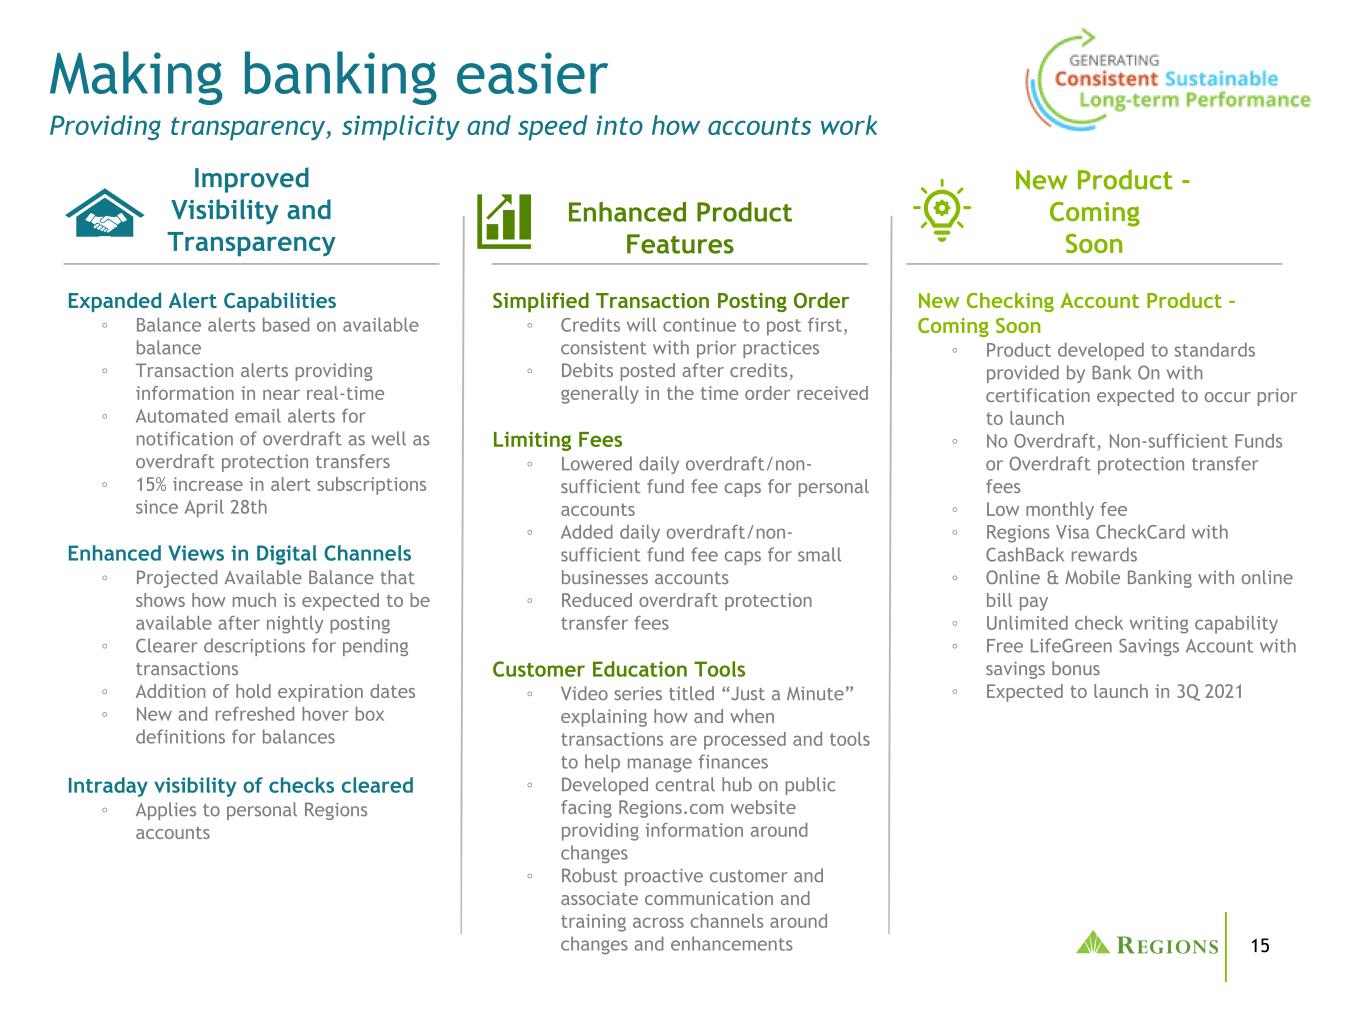
15 Providing transparency, simplicity and speed into how accounts work Making banking easier Improved Visibility and Transparency Expanded Alert Capabilities ◦ Balance alerts based on available balance ◦ Transaction alerts providing information in near real-time ◦ Automated email alerts for notification of overdraft as well as overdraft protection transfers ◦ 15% increase in alert subscriptions since April 28th Enhanced Views in Digital Channels ◦ Projected Available Balance that shows how much is expected to be available after nightly posting ◦ Clearer descriptions for pending transactions ◦ Addition of hold expiration dates ◦ New and refreshed hover box definitions for balances Intraday visibility of checks cleared ◦ Applies to personal Regions accounts Enhanced Product Features New Product - Coming Soon Simplified Transaction Posting Order ◦ Credits will continue to post first, consistent with prior practices ◦ Debits posted after credits, generally in the time order received Limiting Fees ◦ Lowered daily overdraft/non- sufficient fund fee caps for personal accounts ◦ Added daily overdraft/non- sufficient fund fee caps for small businesses accounts ◦ Reduced overdraft protection transfer fees Customer Education Tools ◦ Video series titled “Just a Minute” explaining how and when transactions are processed and tools to help manage finances ◦ Developed central hub on public facing Regions.com website providing information around changes ◦ Robust proactive customer and associate communication and training across channels around changes and enhancements New Checking Account Product – Coming Soon ◦ Product developed to standards provided by Bank On with certification expected to occur prior to launch ◦ No Overdraft, Non-sufficient Funds or Overdraft protection transfer fees ◦ Low monthly fee ◦ Regions Visa CheckCard with CashBack rewards ◦ Online & Mobile Banking with online bill pay ◦ Unlimited check writing capability ◦ Free LifeGreen Savings Account with savings bonus ◦ Expected to launch in 3Q 2021
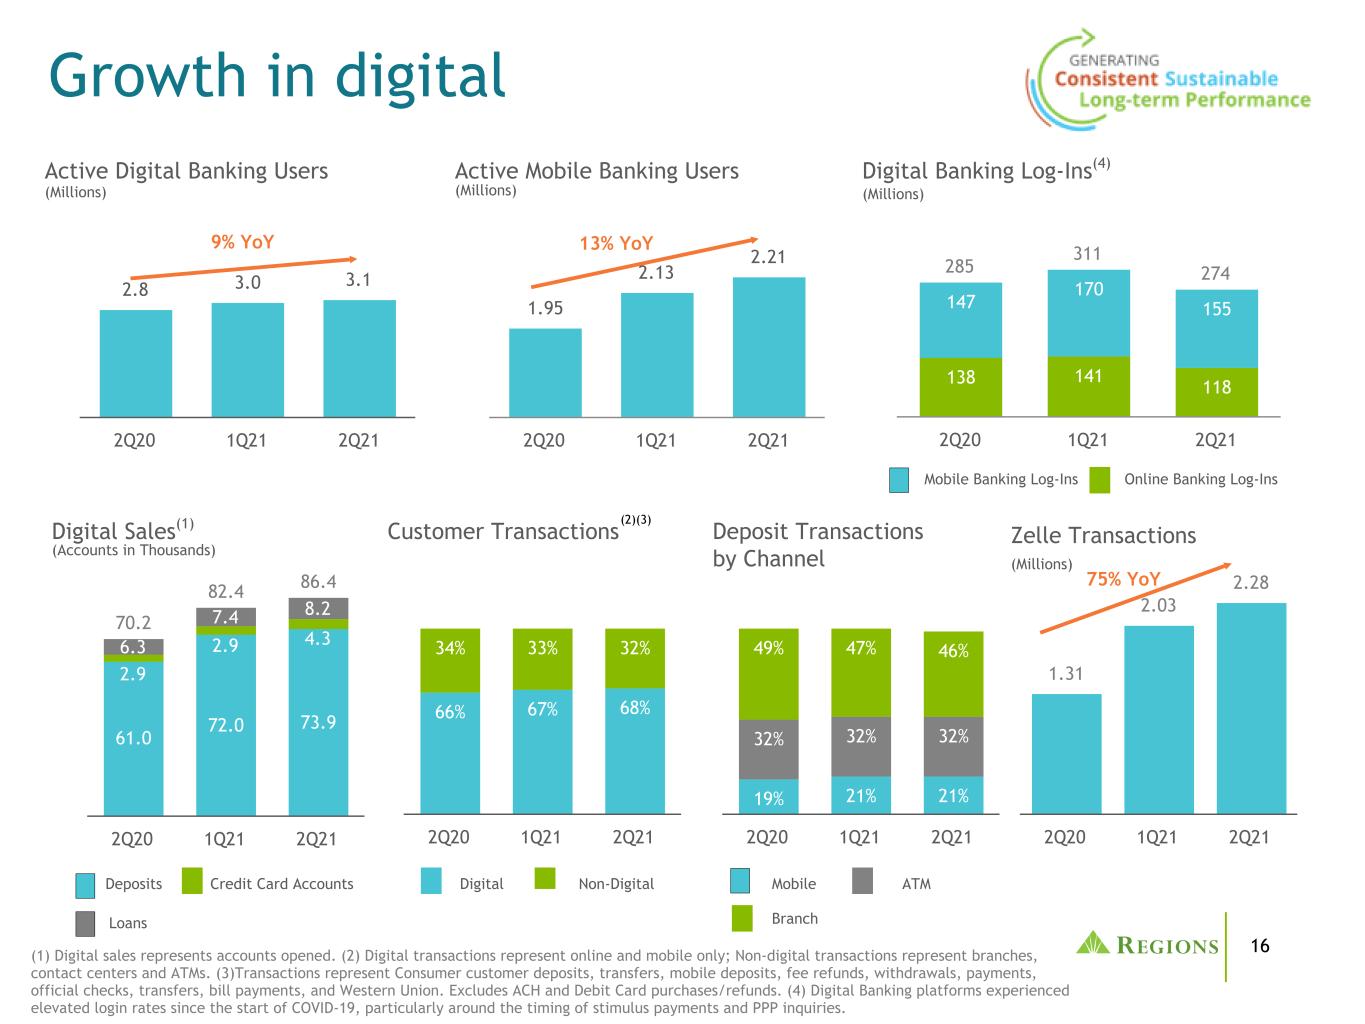
16 1.31 2.03 2.28 2Q20 1Q21 2Q21 285 311 274 138 141 118 147 170 155 2Q20 1Q21 2Q21 2.8 3.0 3.1 2Q20 1Q21 2Q21 Mobile Banking Log-Ins 1.95 2.13 2.21 2Q20 1Q21 2Q21 19% 21% 21% 32% 32% 32% 49% 47% 46% 2Q20 1Q21 2Q21 70.2 82.4 86.4 61.0 72.0 73.9 2.9 2.9 4.36.3 7.4 8.2 2Q20 1Q21 2Q21 66% 67% 68% 34% 33% 32% 2Q20 1Q21 2Q21 Growth in digital Digital Banking Log-Ins(4) Customer Transactions Deposit Transactions by Channel 9% YoY (Millions) (Millions) Active Digital Banking Users Active Mobile Banking Users (Millions) 13% YoY Online Banking Log-Ins Loans Digital Sales(1) (Accounts in Thousands) Deposits Credit Card Accounts Digital Non-Digital Mobile ATM Branch (1) Digital sales represents accounts opened. (2) Digital transactions represent online and mobile only; Non-digital transactions represent branches, contact centers and ATMs. (3)Transactions represent Consumer customer deposits, transfers, mobile deposits, fee refunds, withdrawals, payments, official checks, transfers, bill payments, and Western Union. Excludes ACH and Debit Card purchases/refunds. (4) Digital Banking platforms experienced elevated login rates since the start of COVID-19, particularly around the timing of stimulus payments and PPP inquiries. (2)(3) Zelle Transactions (Millions) 75% YoY

17 1 2 3 4 5 6 • Recent terminations and resulting maturity profile well positioned for rising short-term rates in 2023 and beyond ◦ Notional reductions(2) - intended to ensure balanced rate risk position as higher rates become possible ◦ Securities offset(3) - $1.25B of swaps unwound to offset a portion of the asset duration added through $2B 2Q securities additions • Gains on terminated hedges deferred and amortized over the life of the initial contract, locking in the benefit to NII in future periods • LIBOR cessation is not expected to materially influence hedge effectiveness or future income recognition • Resulting NII profile able to: ◦ benefit from steepening yield curve, eventual rising short-term rates, and other potential tailwinds (e.g. loan growth/credit) ◦ limit downside and ensure NII stability in an environment where the Fed maintains its zero rate policy and loan growth does not manifest Long-term NII Sensitivity Profile to RatesHedge Notional Maturity Profile +1% to 1.5% 2021 2022 2023 2024 2025 2026 Hedge Notional $20.5B $20.5B $14.2B $11.3B $5.7B $1.3B 1mo. LIBOR 0.11% 0.22% 0.66% 1.14% 1.37% 1.55% 1mo. LIBOR Hedge Notional Forward Rates (3) (1,2,3) 1Q notional reductions - scenarios assume no loan growth in any scenario and no benefit from surge deposits under rising rates - includes cumulative benefits from asset reinvestment at higher rates (4) Forwards +50bps Cumulative NII growth (2021-2024) Flat rates Current Hedges No Hedges(5) +2.5% to 3% +3% to 3.5% 0% to -0.5% +1% to 1.5% -1.7% to -2.3% 2Q notional reductions 2Q unwinds offset by securities adds (1) Includes all active swaps/floors entered into prior to 6/30/2021. (2) Includes total hedge repositioning during 1Q21 and 2Q21 of $6.3B, reducing average annual notional by -$5.3B in 2023 and -$4.0B in 2024. (3) Includes $1.25B of swap unwinds to offset Securities additions in 2Q21 (4) 6/30/2021 market implied forwards, annual average. (5) "No hedges" scenario includes the unwind of all cash-flow hedges today; current gain is deferred and amortized over the life of the contracts, locking in the NII benefit and adding interest rate exposure Hedging strategy update
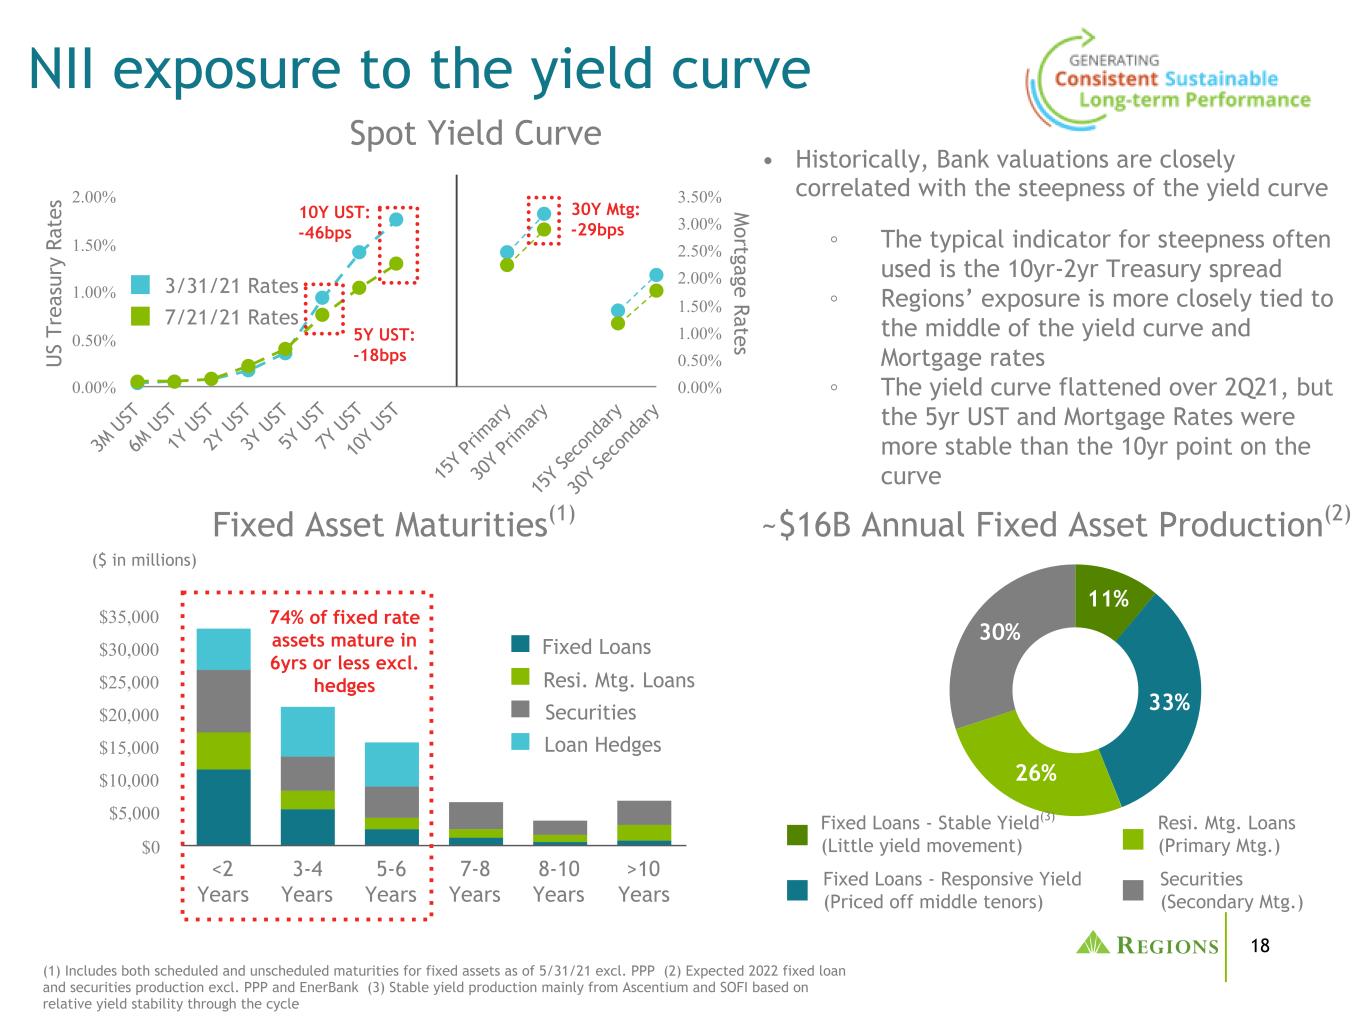
18 3M U ST 6M U ST 1Y U ST 2Y U ST 3Y U ST 5Y U ST 7Y U ST 10 Y UST 15 Y Pr im ar y 30 Y Pr im ar y 15 Y Se co nd ar y 30 Y Se co nd ar y 0.00% 0.50% 1.00% 1.50% 2.00% 0.00% 0.50% 1.00% 1.50% 2.00% 2.50% 3.00% 3.50% (1) Includes both scheduled and unscheduled maturities for fixed assets as of 5/31/21 excl. PPP (2) Expected 2022 fixed loan and securities production excl. PPP and EnerBank (3) Stable yield production mainly from Ascentium and SOFI based on relative yield stability through the cycle Spot Yield Curve NII exposure to the yield curve • Historically, Bank valuations are closely correlated with the steepness of the yield curve ◦ The typical indicator for steepness often used is the 10yr-2yr Treasury spread ◦ Regions’ exposure is more closely tied to the middle of the yield curve and Mortgage rates ◦ The yield curve flattened over 2Q21, but the 5yr UST and Mortgage Rates were more stable than the 10yr point on the curve <2 Years 3-4 Years 5-6 Years 7-8 Years 8-10 Years >10 Years $0 $5,000 $10,000 $15,000 $20,000 $25,000 $30,000 $35,000 11% 33% 26% 30% Fixed Asset Maturities(1) ~$16B Annual Fixed Asset Production(2) Fixed Loans - Stable Yield(3) (Little yield movement) Fixed Loans - Responsive Yield (Priced off middle tenors) Resi. Mtg. Loans (Primary Mtg.) Securities (Secondary Mtg.) Fixed Loans Loan Hedges Resi. Mtg. Loans Securities 3/31/21 Rates 7/21/21 Rates 5Y UST: -18bps 74% of fixed rate assets mature in 6yrs or less excl. hedges 10Y UST: -46bps 30Y Mtg: -29bps M ortgage Rates U S Tr ea su ry R at es ($ in millions)
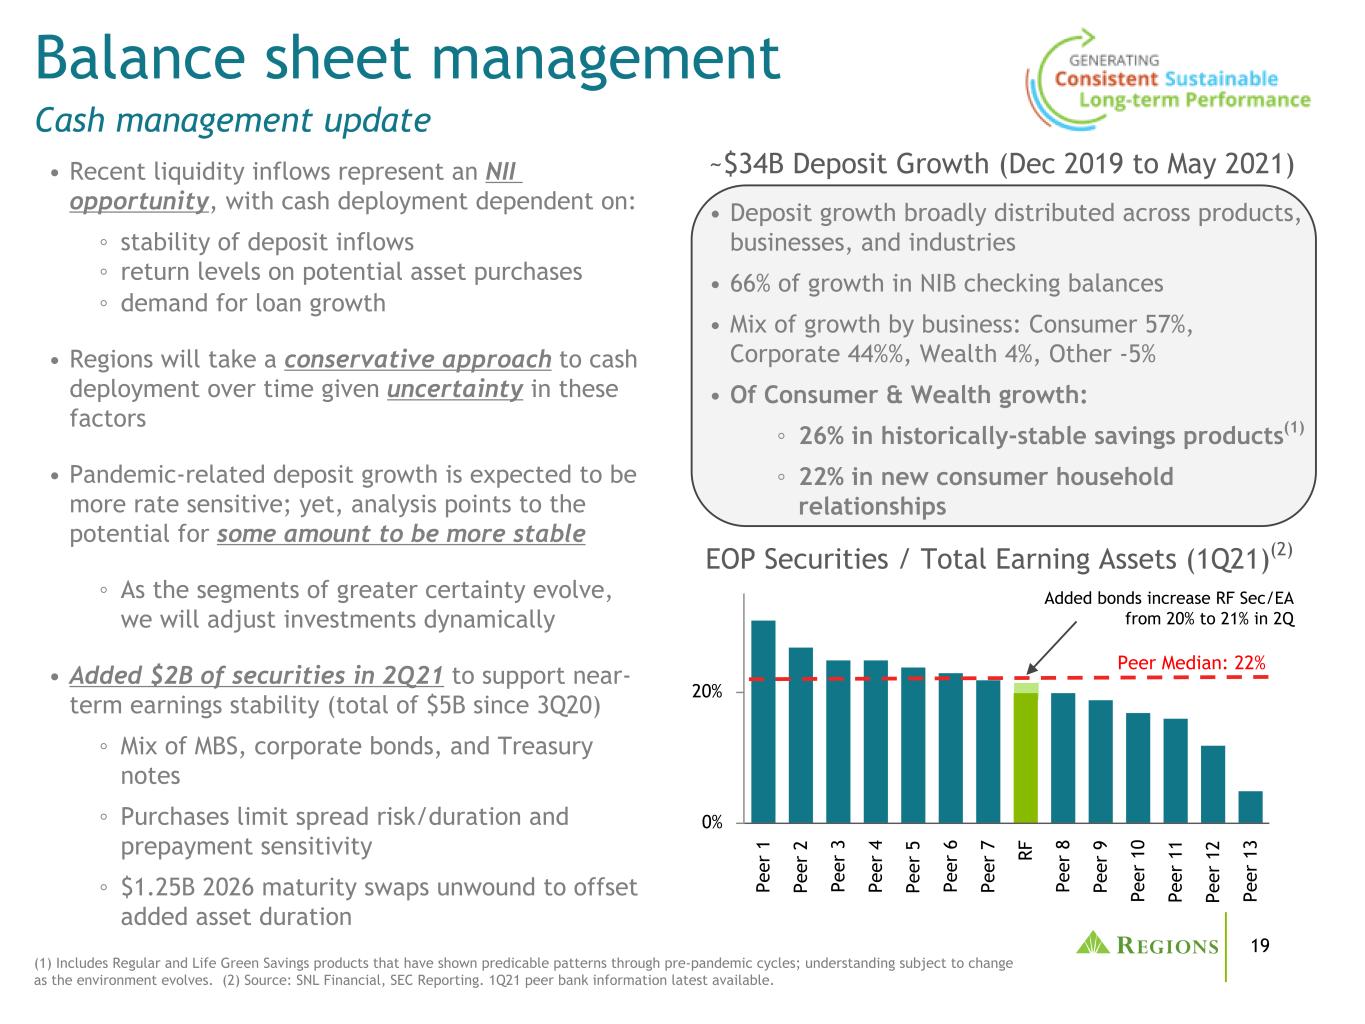
19 Pe er 1 Pe er 2 Pe er 3 Pe er 4 Pe er 5 Pe er 6 Pe er 7 RF Pe er 8 Pe er 9 Pe er 1 0 Pe er 1 1 Pe er 1 2 Pe er 1 3 0% 20% Added bonds increase RF Sec/EA from 20% to 21% in 2Q Peer Median: 22% EOP Securities / Total Earning Assets (1Q21)(2) • Recent liquidity inflows represent an NII opportunity, with cash deployment dependent on: ◦ stability of deposit inflows ◦ return levels on potential asset purchases ◦ demand for loan growth • Regions will take a conservative approach to cash deployment over time given uncertainty in these factors • Pandemic-related deposit growth is expected to be more rate sensitive; yet, analysis points to the potential for some amount to be more stable ◦ As the segments of greater certainty evolve, we will adjust investments dynamically • Added $2B of securities in 2Q21 to support near- term earnings stability (total of $5B since 3Q20) ◦ Mix of MBS, corporate bonds, and Treasury notes ◦ Purchases limit spread risk/duration and prepayment sensitivity ◦ $1.25B 2026 maturity swaps unwound to offset added asset duration (1) Includes Regular and Life Green Savings products that have shown predicable patterns through pre-pandemic cycles; understanding subject to change as the environment evolves. (2) Source: SNL Financial, SEC Reporting. 1Q21 peer bank information latest available. ~$34B Deposit Growth (Dec 2019 to May 2021) • Deposit growth broadly distributed across products, businesses, and industries • 66% of growth in NIB checking balances • Mix of growth by business: Consumer 57%, Corporate 44%%, Wealth 4%, Other -5% • Of Consumer & Wealth growth: ◦ 26% in historically-stable savings products(1) ◦ 22% in new consumer household relationships Balance sheet management Cash management update

20 ($ in millions) 2Q20 3Q20 4Q20 1Q21 2Q21 Round 1-average $ 3,213 $ 4,558 $ 4,143 $ 3,171 $ 2,401 Round 2-average — — — 627 1,500 Total-average $ 3,213 $ 4,558 $ 4,143 $ 3,798 $ 3,901 NII(1) $ 18 $ 31 $ 54 $ 40 $ 43 Round 1-ending $ 4,498 $ 4,594 $ 3,624 $ 2,974 $ 1,438 Round 2-ending — — — 1,343 1,510 Total-ending $ 4,498 $ 4,594 $ 3,624 $ 4,317 $ 2,948 Balance forgiven $ — $ — $ 970 $ 651 $ 1,655 PPP loan details • Through 2Q21, approximately 62% of total estimated program fees have been recognized (~$91 in remaining unamortized fees) • Expect ~80% of total $6.2B PPP loans to be forgiven by year-end 2021. (1) NII recognized during the period includes contractual loan yields and amortization of loan fees (including accelerated forgiveness).
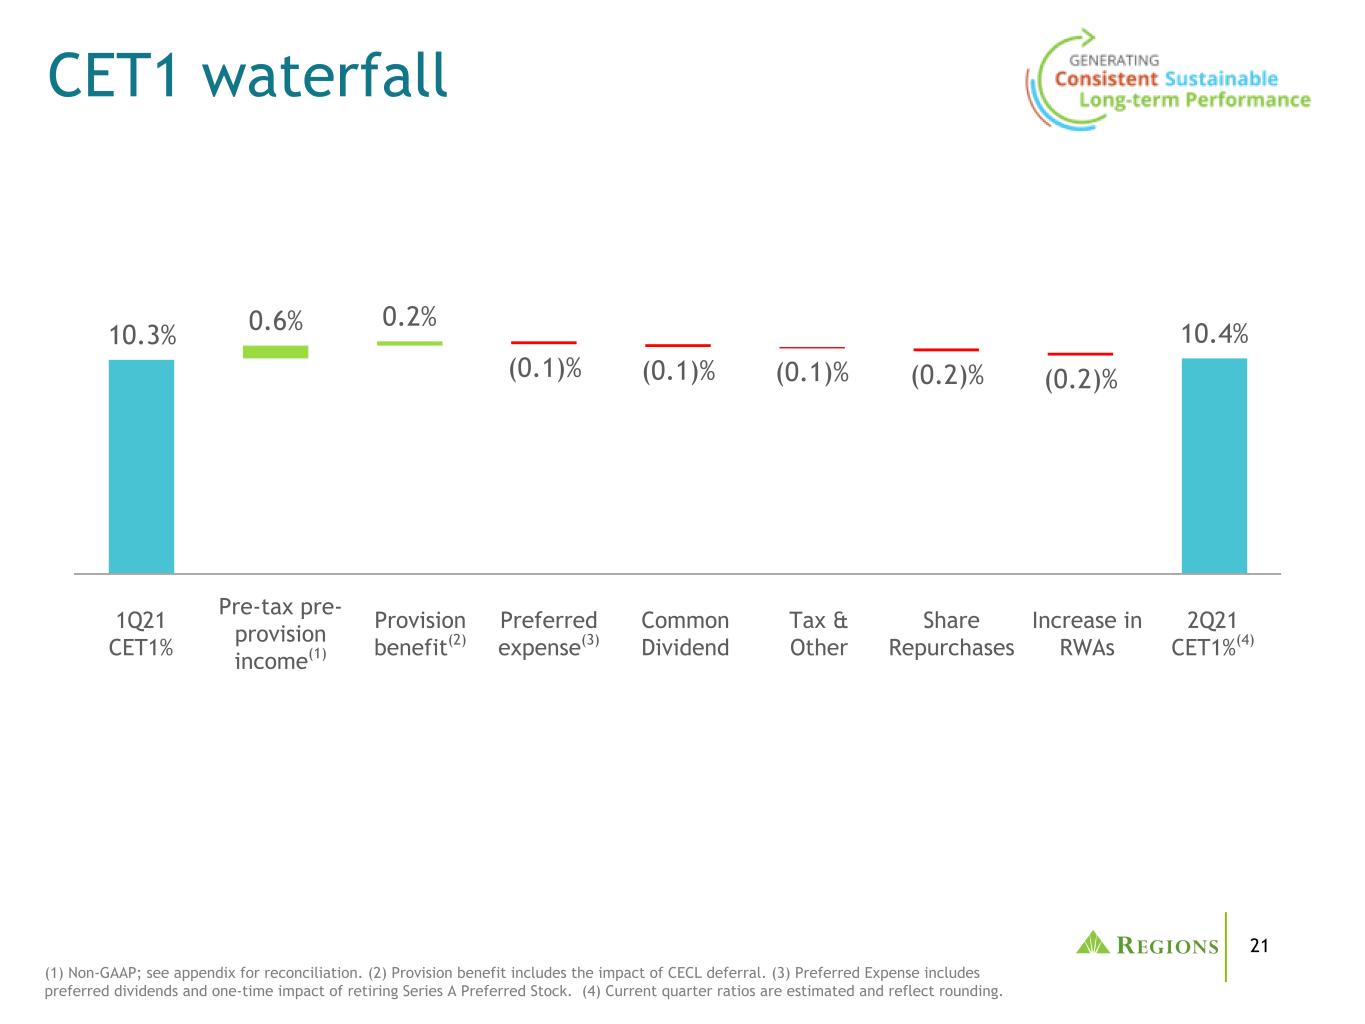
21 10.3% 0.6% 0.2% (0.1)% (0.1)% (0.1)% (0.2)% (0.2)% 10.4% CET1 waterfall (1) Non-GAAP; see appendix for reconciliation. (2) Provision benefit includes the impact of CECL deferral. (3) Preferred Expense includes preferred dividends and one-time impact of retiring Series A Preferred Stock. (4) Current quarter ratios are estimated and reflect rounding. 1Q21 CET1% Pre-tax pre- provision income(1) Common Dividend 2Q21 CET1%(4) Provision benefit(2) Tax & Other Preferred expense(3) Share Repurchases Increase in RWAs
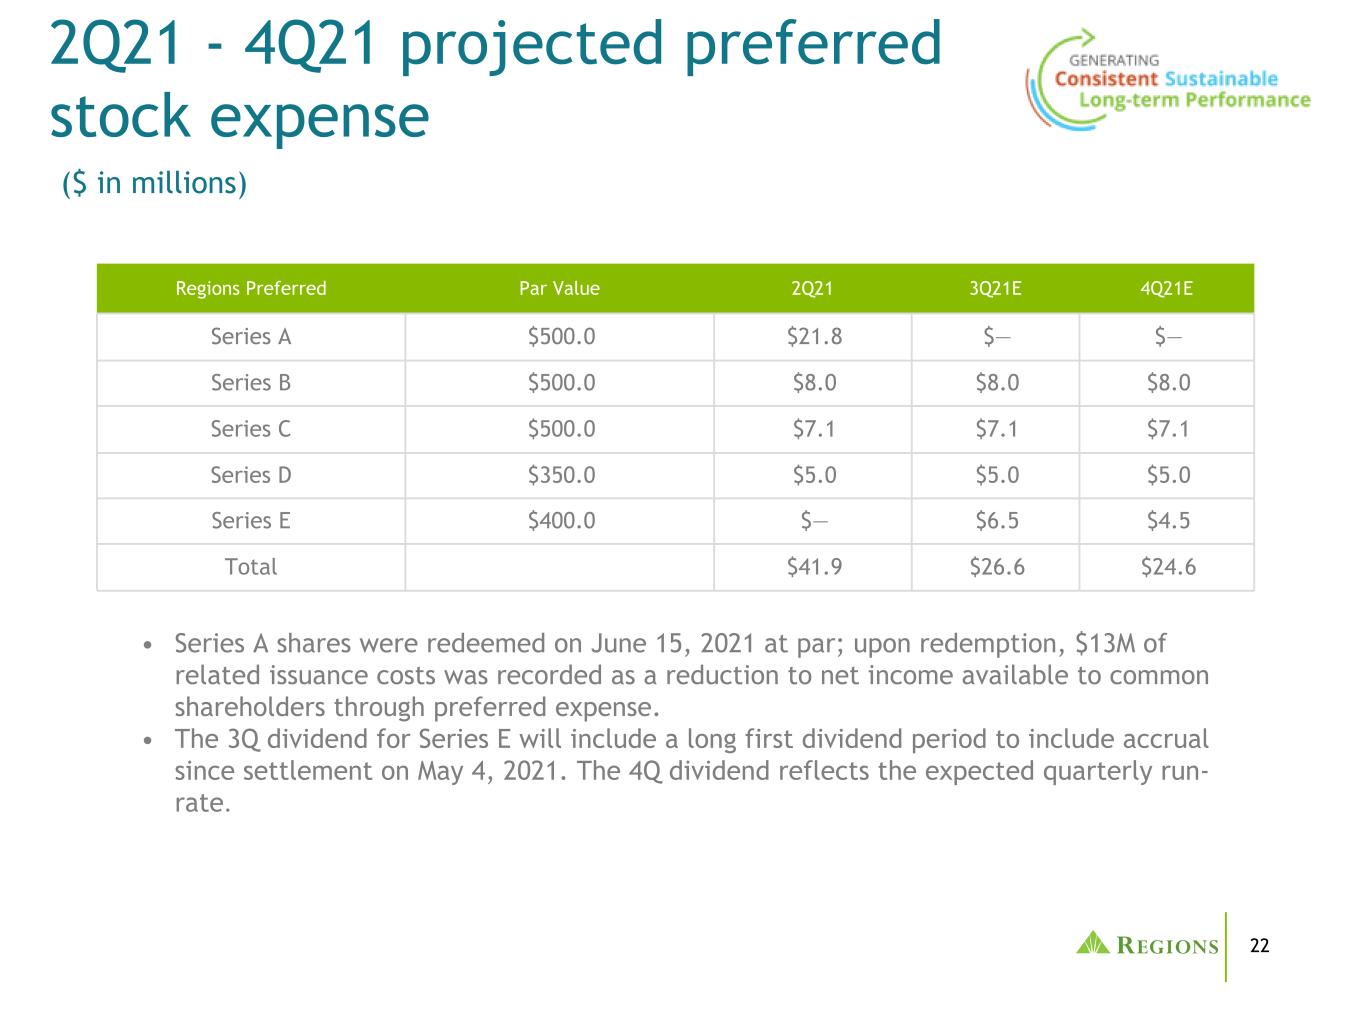
22 Regions Preferred Par Value 2Q21 3Q21E 4Q21E Series A $500.0 $21.8 $— $— Series B $500.0 $8.0 $8.0 $8.0 Series C $500.0 $7.1 $7.1 $7.1 Series D $350.0 $5.0 $5.0 $5.0 Series E $400.0 $— $6.5 $4.5 Total $41.9 $26.6 $24.6 2Q21 - 4Q21 projected preferred stock expense ($ in millions) • Series A shares were redeemed on June 15, 2021 at par; upon redemption, $13M of related issuance costs was recorded as a reduction to net income available to common shareholders through preferred expense. • The 3Q dividend for Series E will include a long first dividend period to include accrual since settlement on May 4, 2021. The 4Q dividend reflects the expected quarterly run- rate.
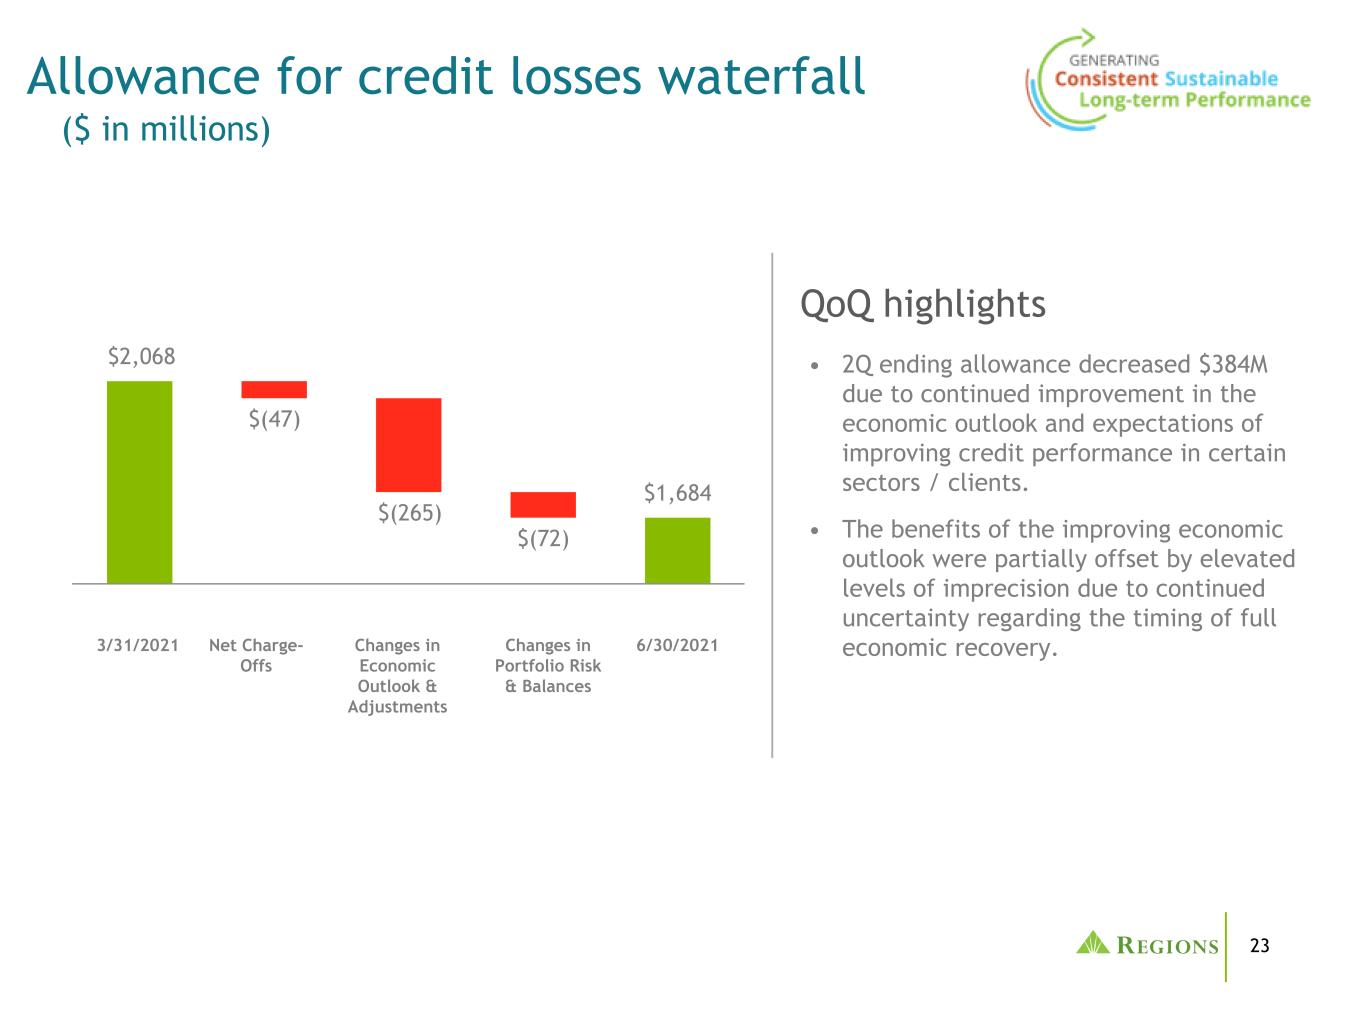
23 Changes in Portfolio Risk & Balances $2,068 $(47) $(265) $(72) $1,684 Allowance for credit losses waterfall Changes in Economic Outlook & Adjustments Net Charge- Offs 6/30/2021 • 2Q ending allowance decreased $384M due to continued improvement in the economic outlook and expectations of improving credit performance in certain sectors / clients. • The benefits of the improving economic outlook were partially offset by elevated levels of imprecision due to continued uncertainty regarding the timing of full economic recovery. QoQ highlights ($ in millions) 3/31/2021

24 Pre-R&S period 2Q2021 3Q2021 4Q2021 1Q2022 2Q2022 3Q2022 4Q2022 1Q2023 2Q2023 Real GDP, annualized % change 6.8 % 6.1 % 6.2 % 5.1 % 3.4 % 3.0 % 2.3 % 2.3 % 2.1 % Unemployment rate 5.8 % 5.2 % 4.9 % 4.6 % 4.4 % 4.2 % 4.0 % 3.9 % 3.8 % HPI, year-over-year % change 13.6 % 12.6 % 9.7 % 6.9 % 3.7 % 2.8 % 3.1 % 3.3 % 3.4 % S&P 500 4,171 4,230 4,247 4,273 4,303 4,329 4,349 4,381 4,411 Base R&S economic outlook (as of June 2021) • Economic forecasts represent Regions’ internal outlook for the economy over the reasonable & supportable forecast period. • Given improvements in the economic outlook, management considered alternative analytics to support qualitative additions to the modeled results to reflect continued risk and uncertainty in certain portfolios.
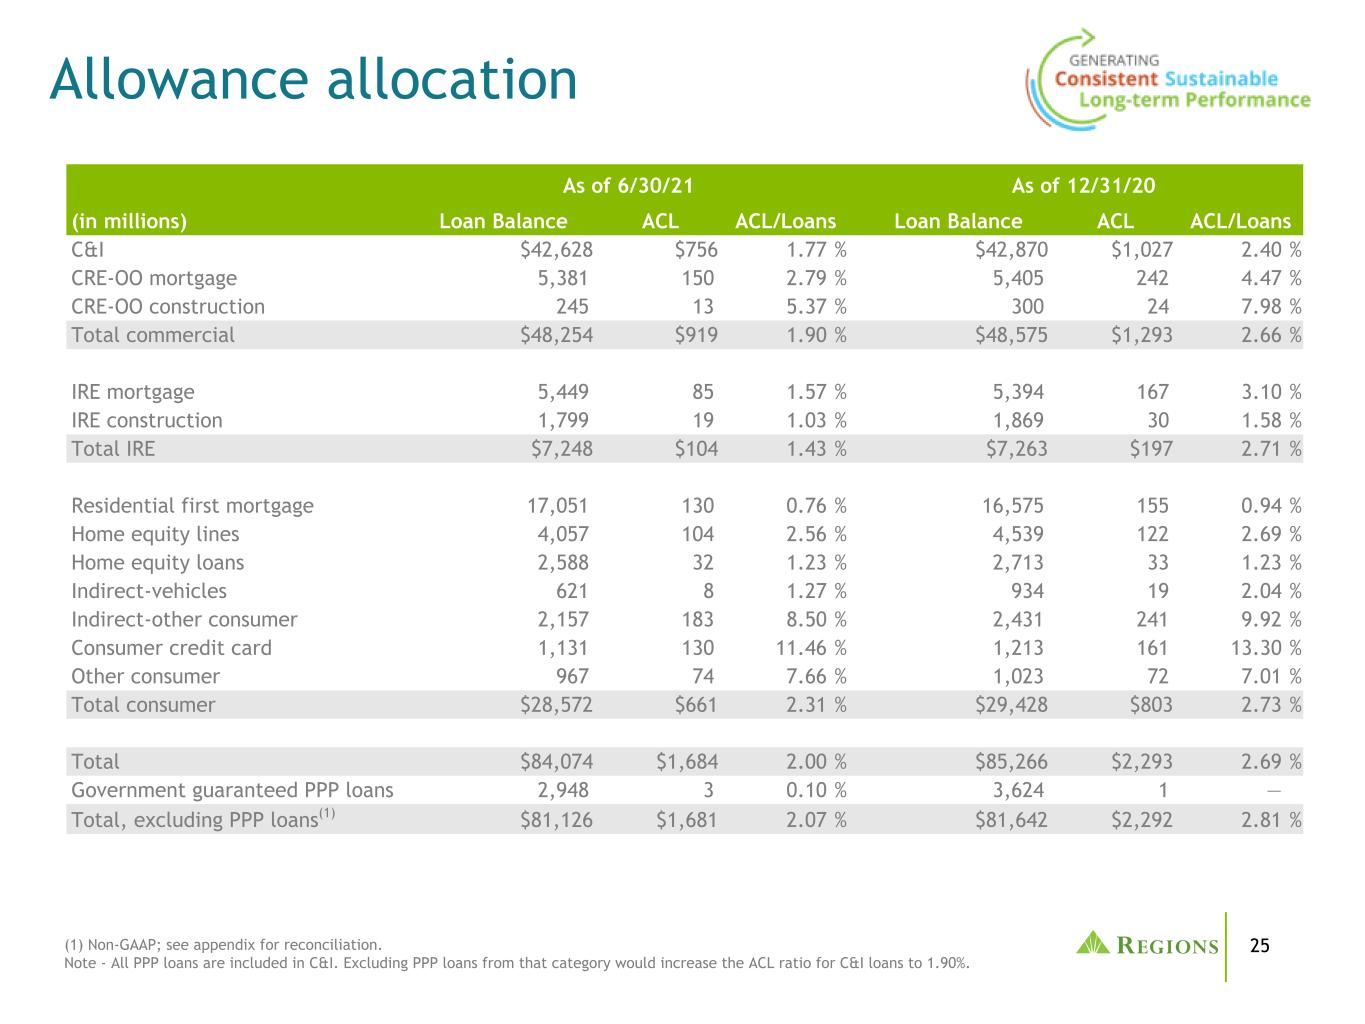
25 As of 6/30/21 As of 12/31/20 (in millions) Loan Balance ACL ACL/Loans Loan Balance ACL ACL/Loans C&I $42,628 $756 1.77 % $42,870 $1,027 2.40 % CRE-OO mortgage 5,381 150 2.79 % 5,405 242 4.47 % CRE-OO construction 245 13 5.37 % 300 24 7.98 % Total commercial $48,254 $919 1.90 % $48,575 $1,293 2.66 % IRE mortgage 5,449 85 1.57 % 5,394 167 3.10 % IRE construction 1,799 19 1.03 % 1,869 30 1.58 % Total IRE $7,248 $104 1.43 % $7,263 $197 2.71 % Residential first mortgage 17,051 130 0.76 % 16,575 155 0.94 % Home equity lines 4,057 104 2.56 % 4,539 122 2.69 % Home equity loans 2,588 32 1.23 % 2,713 33 1.23 % Indirect-vehicles 621 8 1.27 % 934 19 2.04 % Indirect-other consumer 2,157 183 8.50 % 2,431 241 9.92 % Consumer credit card 1,131 130 11.46 % 1,213 161 13.30 % Other consumer 967 74 7.66 % 1,023 72 7.01 % Total consumer $28,572 $661 2.31 % $29,428 $803 2.73 % Total $84,074 $1,684 2.00 % $85,266 $2,293 2.69 % Government guaranteed PPP loans 2,948 3 0.10 % 3,624 1 — Total, excluding PPP loans(1) $81,126 $1,681 2.07 % $81,642 $2,292 2.81 % Allowance allocation (1) Non-GAAP; see appendix for reconciliation. Note - All PPP loans are included in C&I. Excluding PPP loans from that category would increase the ACL ratio for C&I loans to 1.90%.
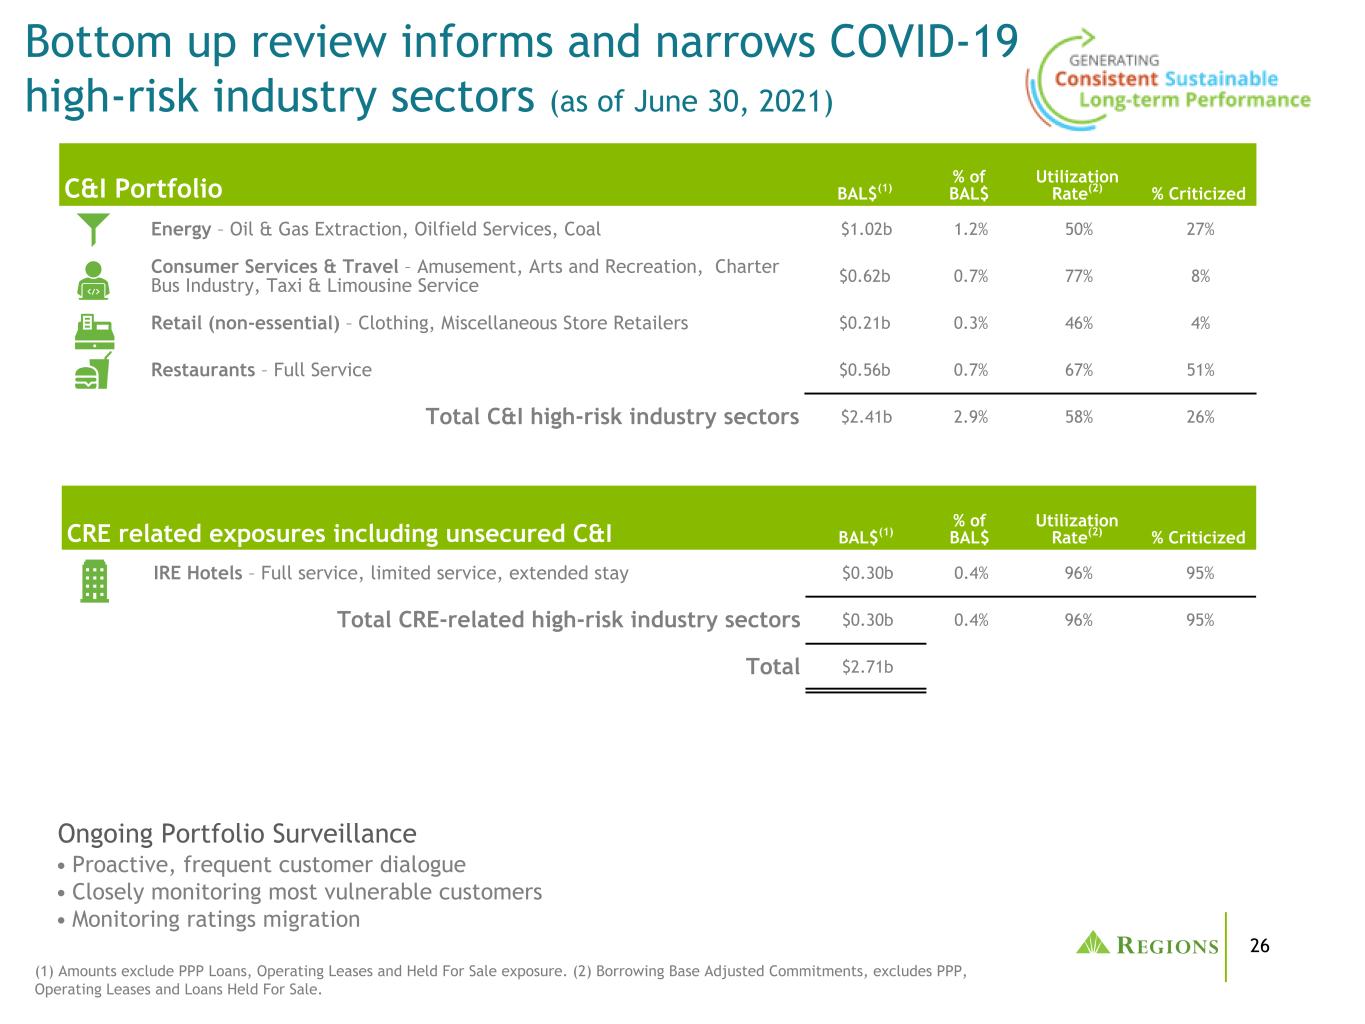
26 • Proactive, frequent customer dialogue • Closely monitoring most vulnerable customers • Monitoring ratings migration Bottom up review informs and narrows COVID-19 high-risk industry sectors (as of June 30, 2021) C&I Portfolio BAL$(1) % of BAL$ Utilization Rate(2) % Criticized Energy – Oil & Gas Extraction, Oilfield Services, Coal $1.02b 1.2% 50% 27% Consumer Services & Travel – Amusement, Arts and Recreation, Charter Bus Industry, Taxi & Limousine Service $0.62b 0.7% 77% 8% Retail (non-essential) – Clothing, Miscellaneous Store Retailers $0.21b 0.3% 46% 4% Restaurants – Full Service $0.56b 0.7% 67% 51% Total C&I high-risk industry sectors $2.41b 2.9% 58% 26% CRE related exposures including unsecured C&I BAL$(1) % of BAL$ Utilization Rate(2) % Criticized IRE Hotels – Full service, limited service, extended stay $0.30b 0.4% 96% 95% Total CRE-related high-risk industry sectors $0.30b 0.4% 96% 95% Total $2.71b (1) Amounts exclude PPP Loans, Operating Leases and Held For Sale exposure. (2) Borrowing Base Adjusted Commitments, excludes PPP, Operating Leases and Loans Held For Sale. Ongoing Portfolio Surveillance

27 $3.36 $0.22 $(0.20) $(0.22) $(0.45) $2.71 COVID-19 high-risk industry sectors waterfall ($ in billions) Removal of Specifically Identified Assets • COVID high-risk industries are continuously refined to those exhibiting higher levels of stress due to COVID impact • Previous specifically identified at-risk assets were removed from the methodology • Several sub-sectors were removed, including but not limited to: ◦ Offices of Physicians in Healthcare ◦ Personal Care Services in Consumer Services & Travel • Several sub-sectors were added, including but not limited to: ◦ Miscellaneous Store Retailers in C&I Retail (non-essential) ◦ Coal in Energy ◦ Taxi & Limousine Service in Consumer Services & Travel QoQ highlights 3/31/2021 High-Risk Balances Other Activity(1) 6/30/2021 High-Risk Balances (1) Other activity includes payments, charge-offs, new loans, moves to held for sale and NAICs changes. Sector Deletions Sector Additions
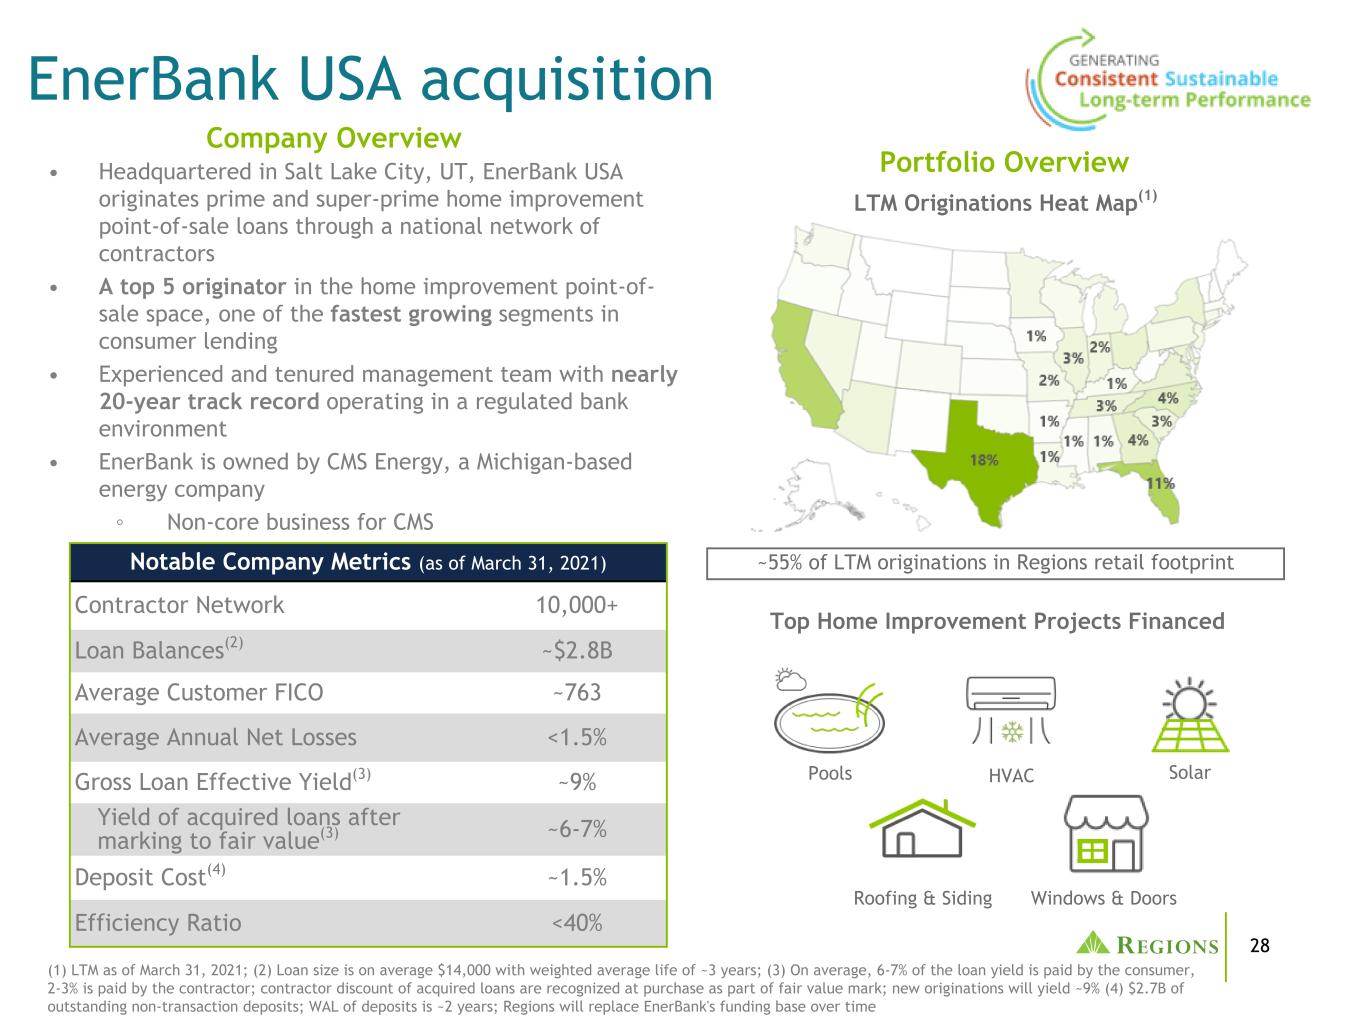
28 • Headquartered in Salt Lake City, UT, EnerBank USA originates prime and super-prime home improvement point-of-sale loans through a national network of contractors • A top 5 originator in the home improvement point-of- sale space, one of the fastest growing segments in consumer lending • Experienced and tenured management team with nearly 20-year track record operating in a regulated bank environment • EnerBank is owned by CMS Energy, a Michigan-based energy company ◦ Non-core business for CMS Company Overview EnerBank USA acquisition Top Home Improvement Projects Financed Portfolio Overview Roofing & Siding Windows & Doors Notable Company Metrics (as of March 31, 2021) Contractor Network 10,000+ Loan Balances(2) ~$2.8B Average Customer FICO ~763 Average Annual Net Losses <1.5% Gross Loan Effective Yield(3) ~9% Yield of acquired loans after marking to fair value(3) ~6-7% Deposit Cost(4) ~1.5% Efficiency Ratio <40% (1) LTM as of March 31, 2021; (2) Loan size is on average $14,000 with weighted average life of ~3 years; (3) On average, 6-7% of the loan yield is paid by the consumer, 2-3% is paid by the contractor; contractor discount of acquired loans are recognized at purchase as part of fair value mark; new originations will yield ~9% (4) $2.7B of outstanding non-transaction deposits; WAL of deposits is ~2 years; Regions will replace EnerBank's funding base over time Pools HVAC LTM Originations Heat Map(1) ~55% of LTM originations in Regions retail footprint Solar
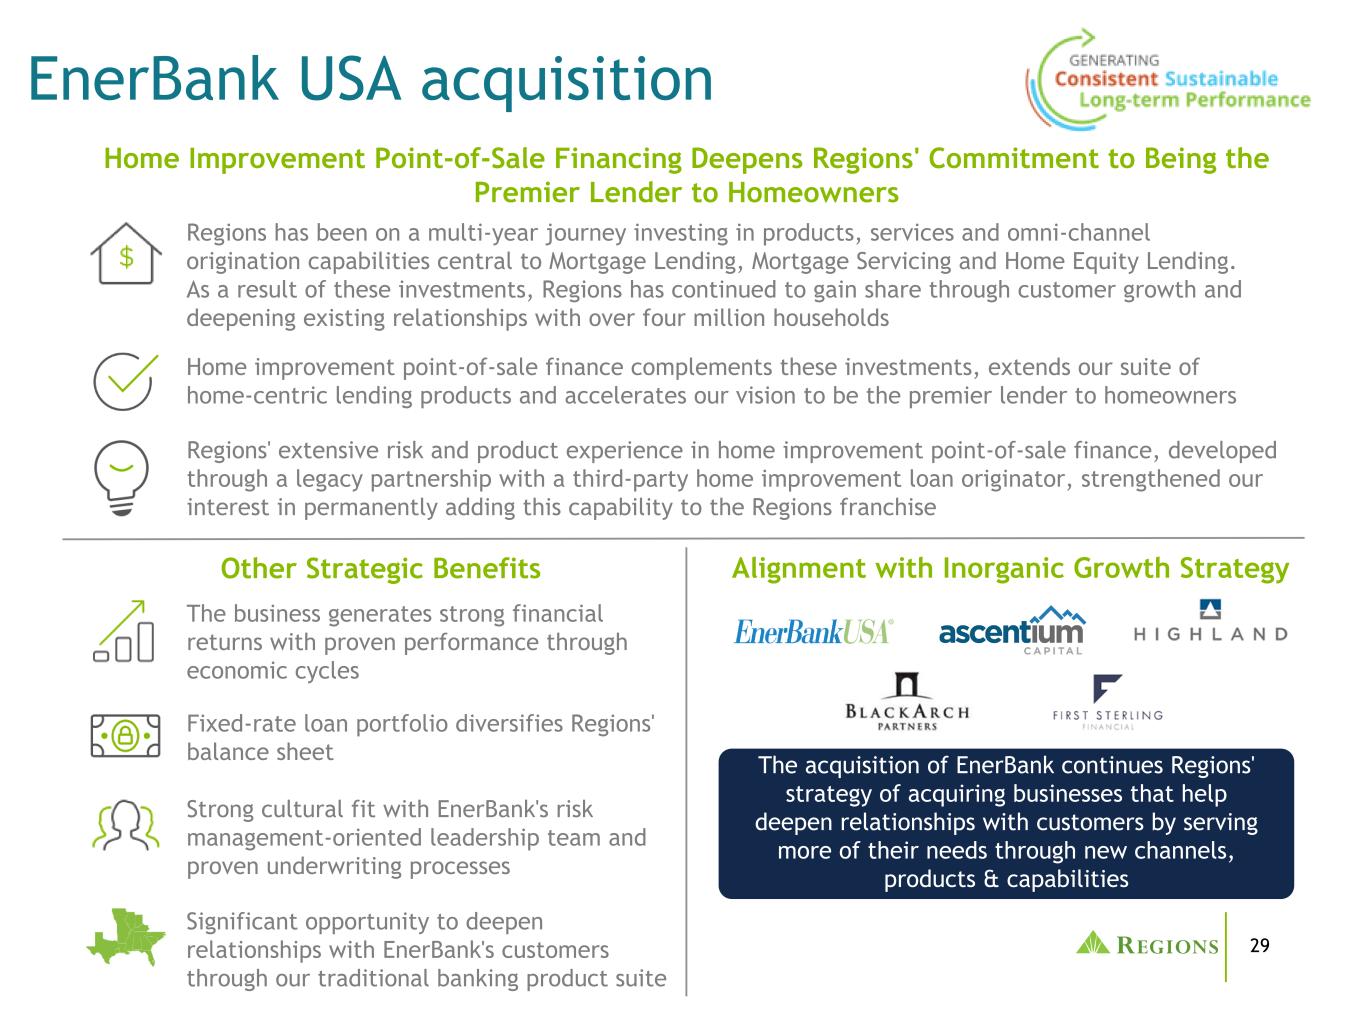
29 Home improvement point-of-sale finance complements these investments, extends our suite of home-centric lending products and accelerates our vision to be the premier lender to homeowners EnerBank USA acquisition Home Improvement Point-of-Sale Financing Deepens Regions' Commitment to Being the Premier Lender to Homeowners Regions' extensive risk and product experience in home improvement point-of-sale finance, developed through a legacy partnership with a third-party home improvement loan originator, strengthened our interest in permanently adding this capability to the Regions franchise Regions has been on a multi-year journey investing in products, services and omni-channel origination capabilities central to Mortgage Lending, Mortgage Servicing and Home Equity Lending. As a result of these investments, Regions has continued to gain share through customer growth and deepening existing relationships with over four million households Fixed-rate loan portfolio diversifies Regions' balance sheet Significant opportunity to deepen relationships with EnerBank's customers through our traditional banking product suite Strong cultural fit with EnerBank's risk management-oriented leadership team and proven underwriting processes Other Strategic Benefits The business generates strong financial returns with proven performance through economic cycles Alignment with Inorganic Growth Strategy The acquisition of EnerBank continues Regions' strategy of acquiring businesses that help deepen relationships with customers by serving more of their needs through new channels, products & capabilities
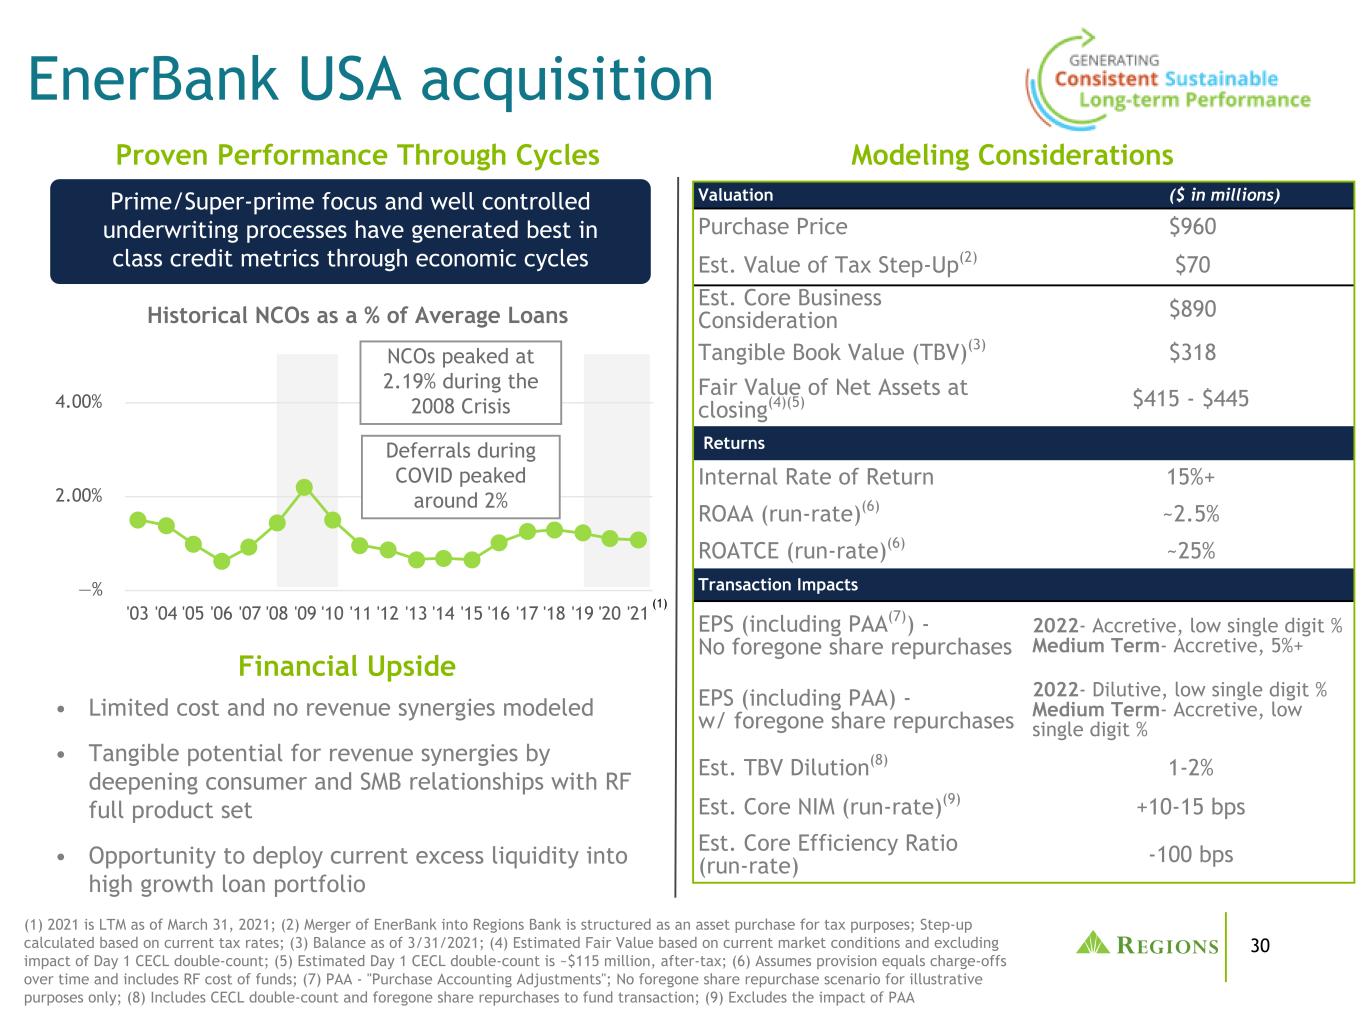
30 '03 '04 '05 '06 '07 '08 '09 '10 '11 '12 '13 '14 '15 '16 '17 '18 '19 '20 '21 —% 2.00% 4.00% EnerBank USA acquisition Proven Performance Through Cycles Historical NCOs as a % of Average Loans NCOs peaked at 2.19% during the 2008 Crisis Deferrals during COVID peaked around 2% (1) (1) 2021 is LTM as of March 31, 2021; (2) Merger of EnerBank into Regions Bank is structured as an asset purchase for tax purposes; Step-up calculated based on current tax rates; (3) Balance as of 3/31/2021; (4) Estimated Fair Value based on current market conditions and excluding impact of Day 1 CECL double-count; (5) Estimated Day 1 CECL double-count is ~$115 million, after-tax; (6) Assumes provision equals charge-offs over time and includes RF cost of funds; (7) PAA - "Purchase Accounting Adjustments"; No foregone share repurchase scenario for illustrative purposes only; (8) Includes CECL double-count and foregone share repurchases to fund transaction; (9) Excludes the impact of PAA Modeling Considerations Valuation ($ in millions) Purchase Price $960 Est. Value of Tax Step-Up(2) $70 Est. Core Business Consideration $890 Tangible Book Value (TBV)(3) $318 Fair Value of Net Assets at closing(4)(5) $415 - $445 Returns Internal Rate of Return 15%+ ROAA (run-rate)(6) ~2.5% ROATCE (run-rate)(6) ~25% Transaction Impacts EPS (including PAA(7)) - No foregone share repurchases 2022- Accretive, low single digit % Medium Term- Accretive, 5%+ EPS (including PAA) - w/ foregone share repurchases 2022- Dilutive, low single digit % Medium Term- Accretive, low single digit % Est. TBV Dilution(8) 1-2% Est. Core NIM (run-rate)(9) +10-15 bps Est. Core Efficiency Ratio (run-rate) -100 bps Prime/Super-prime focus and well controlled underwriting processes have generated best in class credit metrics through economic cycles Financial Upside • Limited cost and no revenue synergies modeled • Tangible potential for revenue synergies by deepening consumer and SMB relationships with RF full product set • Opportunity to deploy current excess liquidity into high growth loan portfolio

31 • Balance growth will continue at robust levels due to increases in annual originations in recent years as well as reductions in the amount of loans sold to third parties • If EnerBank continues on current path, the portfolio will double within five years • Material room to run in the market based on current market share EnerBank USA acquisition Home Improvement Finance Market Opportunity(1) Loan Balances(3) • Industry and product are not yet mature - Highly fragmented industry with EnerBank well-positioned for growth • Industry is growing in size - Top line industry growth and mix shift away from cash and credit cards is expanding the pie • Lending economics are strong - Attractive risk- adjusted yields and returns on capital Professional Market(2): $156B Home Improvement Expenditures: $506B 8.1% Annual growth from 2018 - 2021 Top 5 Lenders (including EnerBank): $14B Originations ~9% Share (1) Source: American Housing Survey, Bankrate, EnerBank, John Burns Real Estate Consulting. (2) The Professional Market is defined as non-DIY home improvement expenditures, including materials and labor. (3) Source: gross loans per bank Call Reports. Home improvement financing at the point-of-sale is an attractive business with compelling long-term prospects $0.5 $0.7 $0.9 $1.2 $1.3 $1.4 $1.9 $2.5 $3.0 '12 '13 '14 '15 '16 '17 '18 '19 '20 Sustained Growth (in billions) Regions estimates balances to grow at low double digit growth rates for the next several years
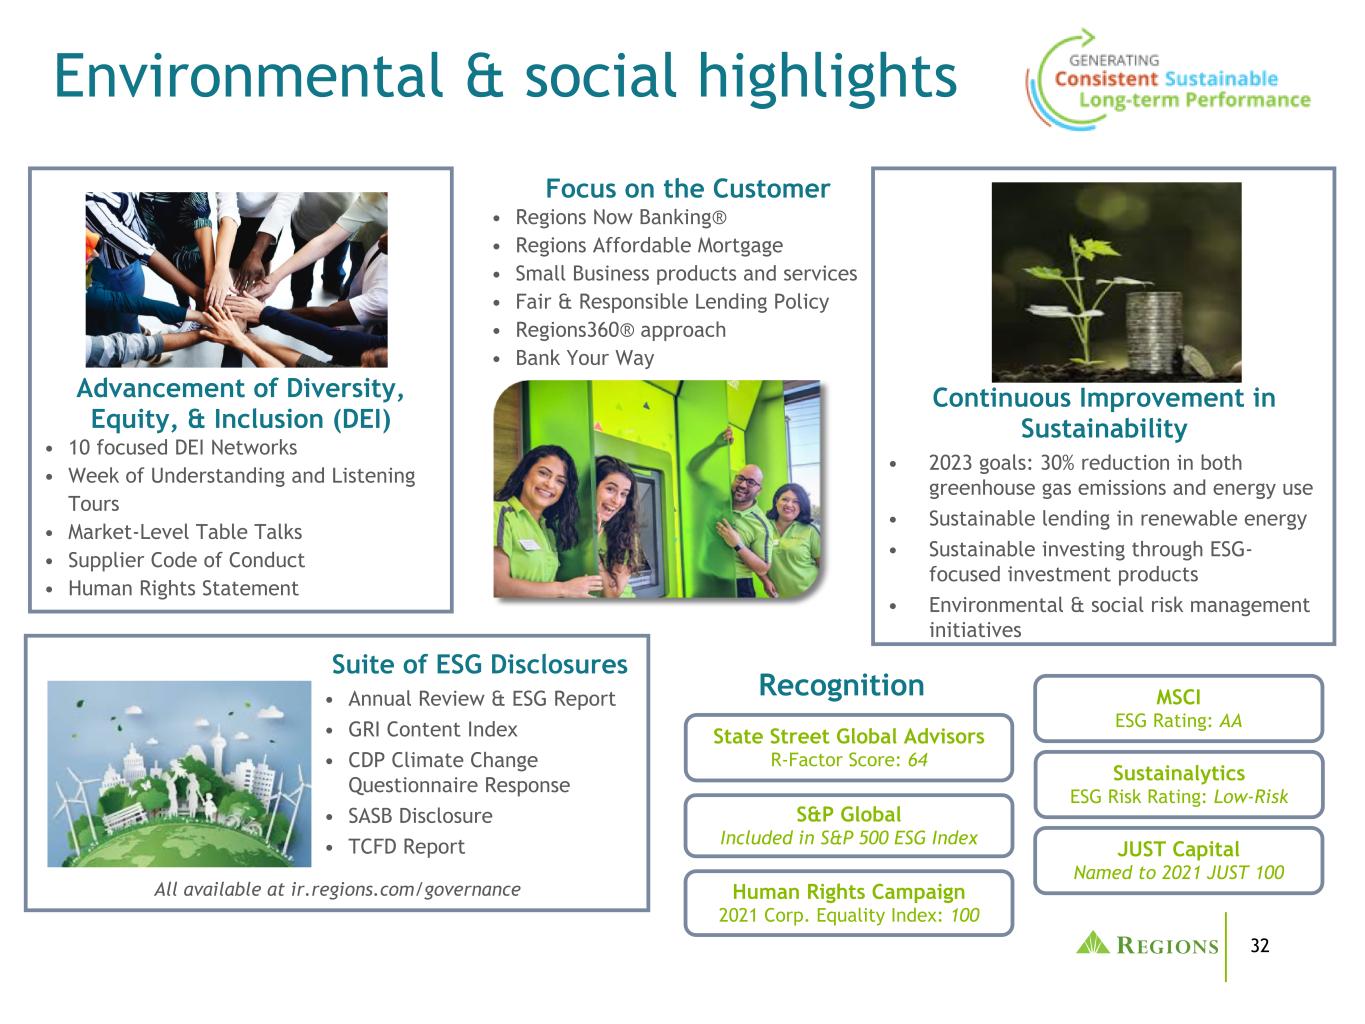
32 Environmental & social highlights Continuous Improvement in Sustainability • 2023 goals: 30% reduction in both greenhouse gas emissions and energy use • Sustainable lending in renewable energy • Sustainable investing through ESG- focused investment products • Environmental & social risk management initiatives Focus on the Customer • Regions Now Banking® • Regions Affordable Mortgage • Small Business products and services • Fair & Responsible Lending Policy • Regions360® approach • Bank Your Way Advancement of Diversity, Equity, & Inclusion (DEI) • 10 focused DEI Networks • Week of Understanding and Listening Tours • Market-Level Table Talks • Supplier Code of Conduct • Human Rights Statement Suite of ESG Disclosures • Annual Review & ESG Report • GRI Content Index • CDP Climate Change Questionnaire Response • SASB Disclosure • TCFD Report Recognition Sustainalytics ESG Risk Rating: Low-Risk State Street Global Advisors R-Factor Score: 64 MSCI ESG Rating: AA Human Rights Campaign 2021 Corp. Equality Index: 100 JUST Capital Named to 2021 JUST 100 All available at ir.regions.com/governance S&P Global Included in S&P 500 ESG Index

33 Management uses pre-tax pre-provision income (non-GAAP) and adjusted pre-tax pre-provision income (non-GAAP), as well as the adjusted efficiency ratio (non-GAAP) and the adjusted fee income ratio (non-GAAP) to monitor performance and believes these measures provide meaningful information to investors. Non-interest expense (GAAP) is presented excluding certain adjustments to arrive at adjusted non-interest expense (non-GAAP), which is the numerator for the efficiency ratio. Non-interest income (GAAP) is presented excluding certain adjustments to arrive at adjusted non-interest income (non-GAAP), which is the numerator for the fee income ratio. Adjusted non-interest income (non-GAAP) and adjusted non-interest expense (non- GAAP) are used to determine adjusted pre-tax pre-provision income (non-GAAP). Net interest income (GAAP) on a taxable-equivalent basis and non-interest income are added together to arrive at total revenue on a taxable-equivalent basis. Adjustments are made to arrive at adjusted total revenue on a taxable-equivalent basis (non-GAAP), which is the denominator for the fee income and efficiency ratios. Regions believes that the exclusion of these adjustments provides a meaningful base for period-to-period comparisons, which management believes will assist investors in analyzing the operating results of the Company and predicting future performance. These non-GAAP financial measures are also used by management to assess the performance of Regions’ business. It is possible that the activities related to the adjustments may recur; however, management does not consider the activities related to the adjustments to be indications of ongoing operations. Regions believes that presentation of these non-GAAP financial measures will permit investors to assess the performance of the Company on the same basis as that applied by management. The allowance for credit losses (ACL) as a percentage of total loans is an important ratio, especially during periods of economic stress. Management believes this ratio provides investors with meaningful additional information about credit loss allowance levels when the impact of SBA's Paycheck Protection Program loans, which are fully backed by the U.S. government, and any related allowance are excluded from total loans and total allowance which are the denominator and numerator, respectively, used in the ACL ratio. This adjusted ACL ratio represents a non-GAAP financial measure. Tangible common stockholders’ equity ratios have become a focus of some investors and management believes they may assist investors in analyzing the capital position of the Company absent the effects of intangible assets and preferred stock. Analysts and banking regulators have assessed Regions’ capital adequacy using the tangible common stockholders’ equity measure. Because tangible common stockholders’ equity is not formally defined by GAAP or prescribed in any amount by federal banking regulations it is currently considered to be a non- GAAP financial measure and other entities may calculate it differently than Regions’ disclosed calculations. Since analysts and banking regulators may assess Regions’ capital adequacy using tangible common stockholders’ equity, management believes that it is useful to provide investors the ability to assess Regions’ capital adequacy on this same basis. Non-GAAP financial measures have inherent limitations, are not required to be uniformly applied and are not audited. Although these non-GAAP financial measures are frequently used by stakeholders in the evaluation of a company, they have limitations as analytical tools, and should not be considered in isolation, or as a substitute for analyses of results as reported under GAAP. In particular, a measure of earnings that excludes selected items does not represent the amount that effectively accrues directly to stockholders. Management and the Board of Directors utilize non-GAAP measures as follows: • Preparation of Regions' operating budgets • Monthly financial performance reporting • Monthly close-out reporting of consolidated results (management only) • Presentation to investors of company performance • Metrics for incentive compensation Non-GAAP information
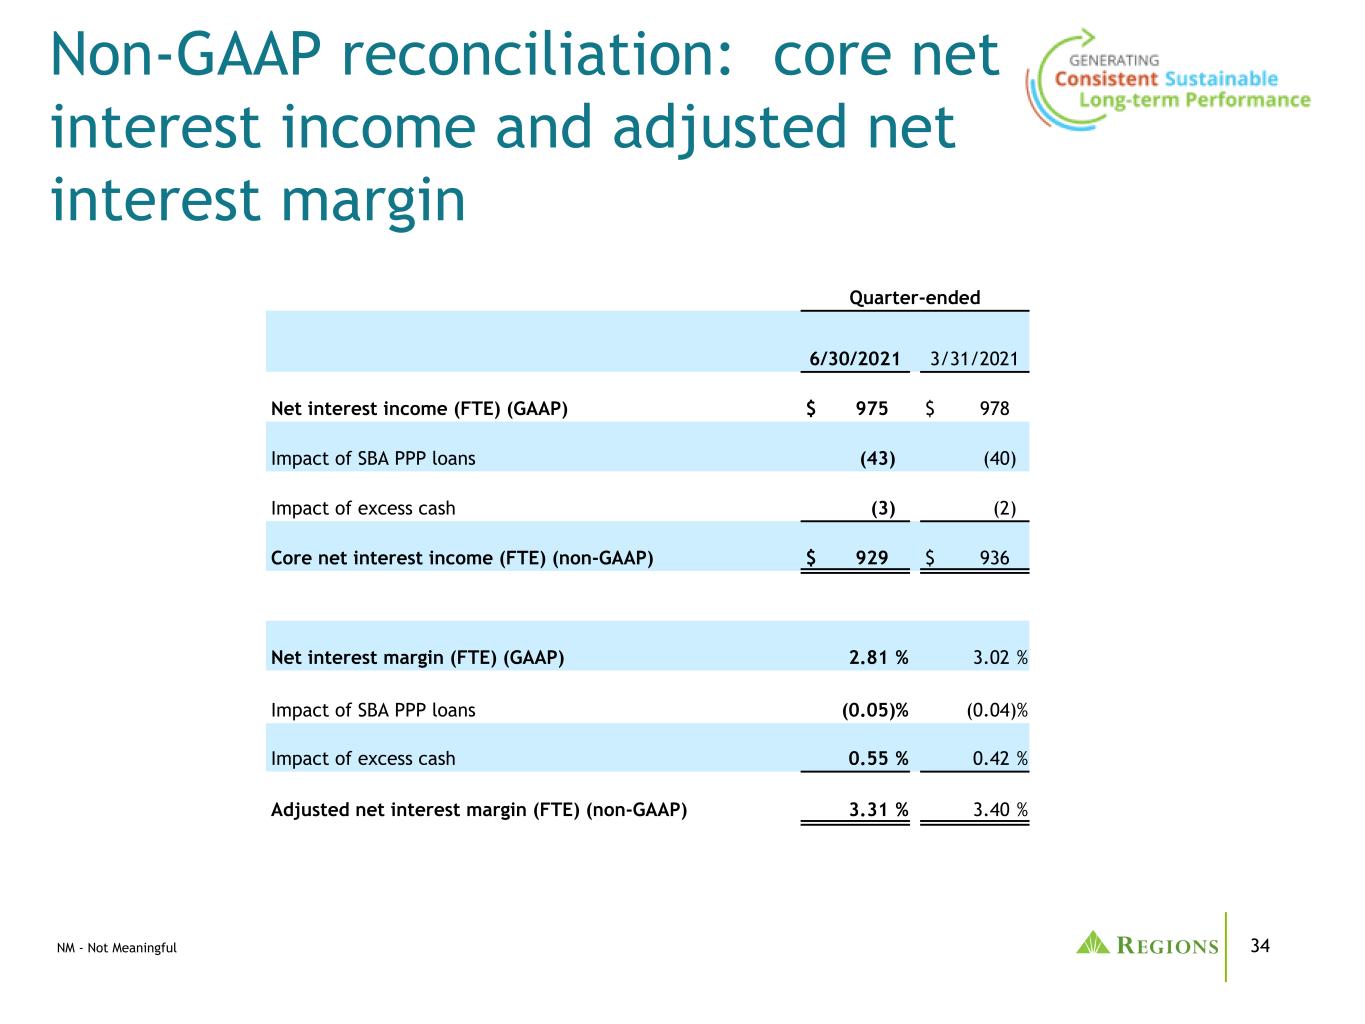
34 Non-GAAP reconciliation: core net interest income and adjusted net interest margin Quarter-ended 6/30/2021 3/31/2021 Net interest income (FTE) (GAAP) $ 975 $ 978 Impact of SBA PPP loans (43) (40) Impact of excess cash (3) (2) Core net interest income (FTE) (non-GAAP) $ 929 $ 936 Net interest margin (FTE) (GAAP) 2.81 % 3.02 % Impact of SBA PPP loans (0.05) % (0.04) % Impact of excess cash 0.55 % 0.42 % Adjusted net interest margin (FTE) (non-GAAP) 3.31 % 3.40 % NM - Not Meaningful
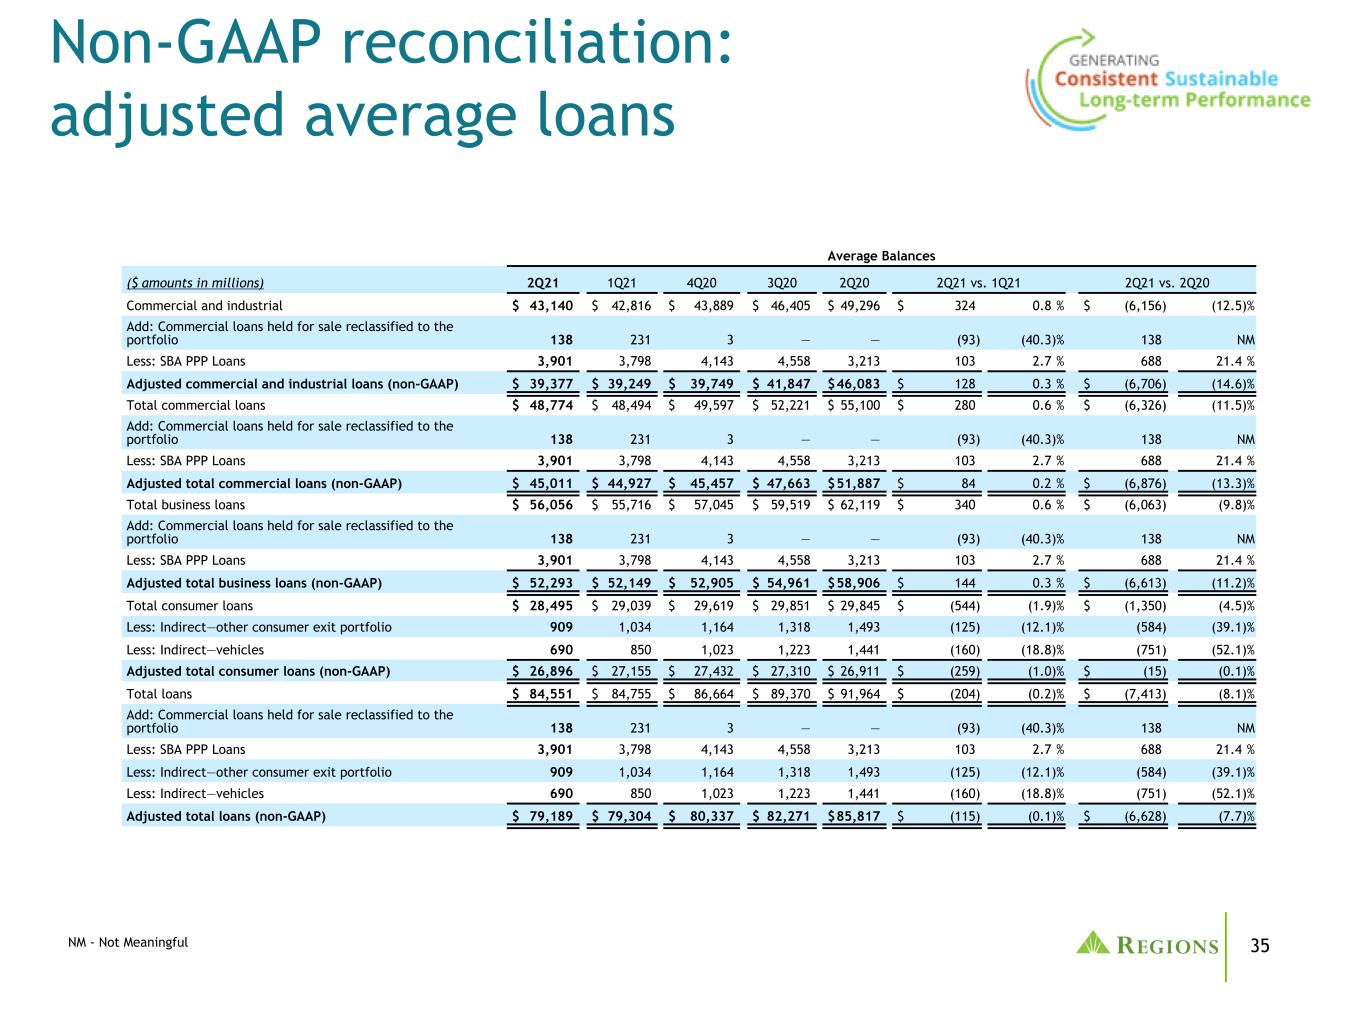
35 Non-GAAP reconciliation: adjusted average loans Average Balances ($ amounts in millions) 2Q21 1Q21 4Q20 3Q20 2Q20 2Q21 vs. 1Q21 2Q21 vs. 2Q20 Commercial and industrial $ 43,140 $ 42,816 $ 43,889 $ 46,405 $ 49,296 $ 324 0.8 % $ (6,156) (12.5) % Add: Commercial loans held for sale reclassified to the portfolio 138 231 3 — — (93) (40.3) % 138 NM Less: SBA PPP Loans 3,901 3,798 4,143 4,558 3,213 103 2.7 % 688 21.4 % Adjusted commercial and industrial loans (non-GAAP) $ 39,377 $ 39,249 $ 39,749 $ 41,847 $ 46,083 $ 128 0.3 % $ (6,706) (14.6) % Total commercial loans $ 48,774 $ 48,494 $ 49,597 $ 52,221 $ 55,100 $ 280 0.6 % $ (6,326) (11.5) % Add: Commercial loans held for sale reclassified to the portfolio 138 231 3 — — (93) (40.3) % 138 NM Less: SBA PPP Loans 3,901 3,798 4,143 4,558 3,213 103 2.7 % 688 21.4 % Adjusted total commercial loans (non-GAAP) $ 45,011 $ 44,927 $ 45,457 $ 47,663 $ 51,887 $ 84 0.2 % $ (6,876) (13.3) % Total business loans $ 56,056 $ 55,716 $ 57,045 $ 59,519 $ 62,119 $ 340 0.6 % $ (6,063) (9.8) % Add: Commercial loans held for sale reclassified to the portfolio 138 231 3 — — (93) (40.3) % 138 NM Less: SBA PPP Loans 3,901 3,798 4,143 4,558 3,213 103 2.7 % 688 21.4 % Adjusted total business loans (non-GAAP) $ 52,293 $ 52,149 $ 52,905 $ 54,961 $ 58,906 $ 144 0.3 % $ (6,613) (11.2) % Total consumer loans $ 28,495 $ 29,039 $ 29,619 $ 29,851 $ 29,845 $ (544) (1.9) % $ (1,350) (4.5) % Less: Indirect—other consumer exit portfolio 909 1,034 1,164 1,318 1,493 (125) (12.1) % (584) (39.1) % Less: Indirect—vehicles 690 850 1,023 1,223 1,441 (160) (18.8) % (751) (52.1) % Adjusted total consumer loans (non-GAAP) $ 26,896 $ 27,155 $ 27,432 $ 27,310 $ 26,911 $ (259) (1.0) % $ (15) (0.1) % Total loans $ 84,551 $ 84,755 $ 86,664 $ 89,370 $ 91,964 $ (204) (0.2) % $ (7,413) (8.1) % Add: Commercial loans held for sale reclassified to the portfolio 138 231 3 — — (93) (40.3) % 138 NM Less: SBA PPP Loans 3,901 3,798 4,143 4,558 3,213 103 2.7 % 688 21.4 % Less: Indirect—other consumer exit portfolio 909 1,034 1,164 1,318 1,493 (125) (12.1) % (584) (39.1) % Less: Indirect—vehicles 690 850 1,023 1,223 1,441 (160) (18.8) % (751) (52.1) % Adjusted total loans (non-GAAP) $ 79,189 $ 79,304 $ 80,337 $ 82,271 $ 85,817 $ (115) (0.1) % $ (6,628) (7.7) % NM - Not Meaningful
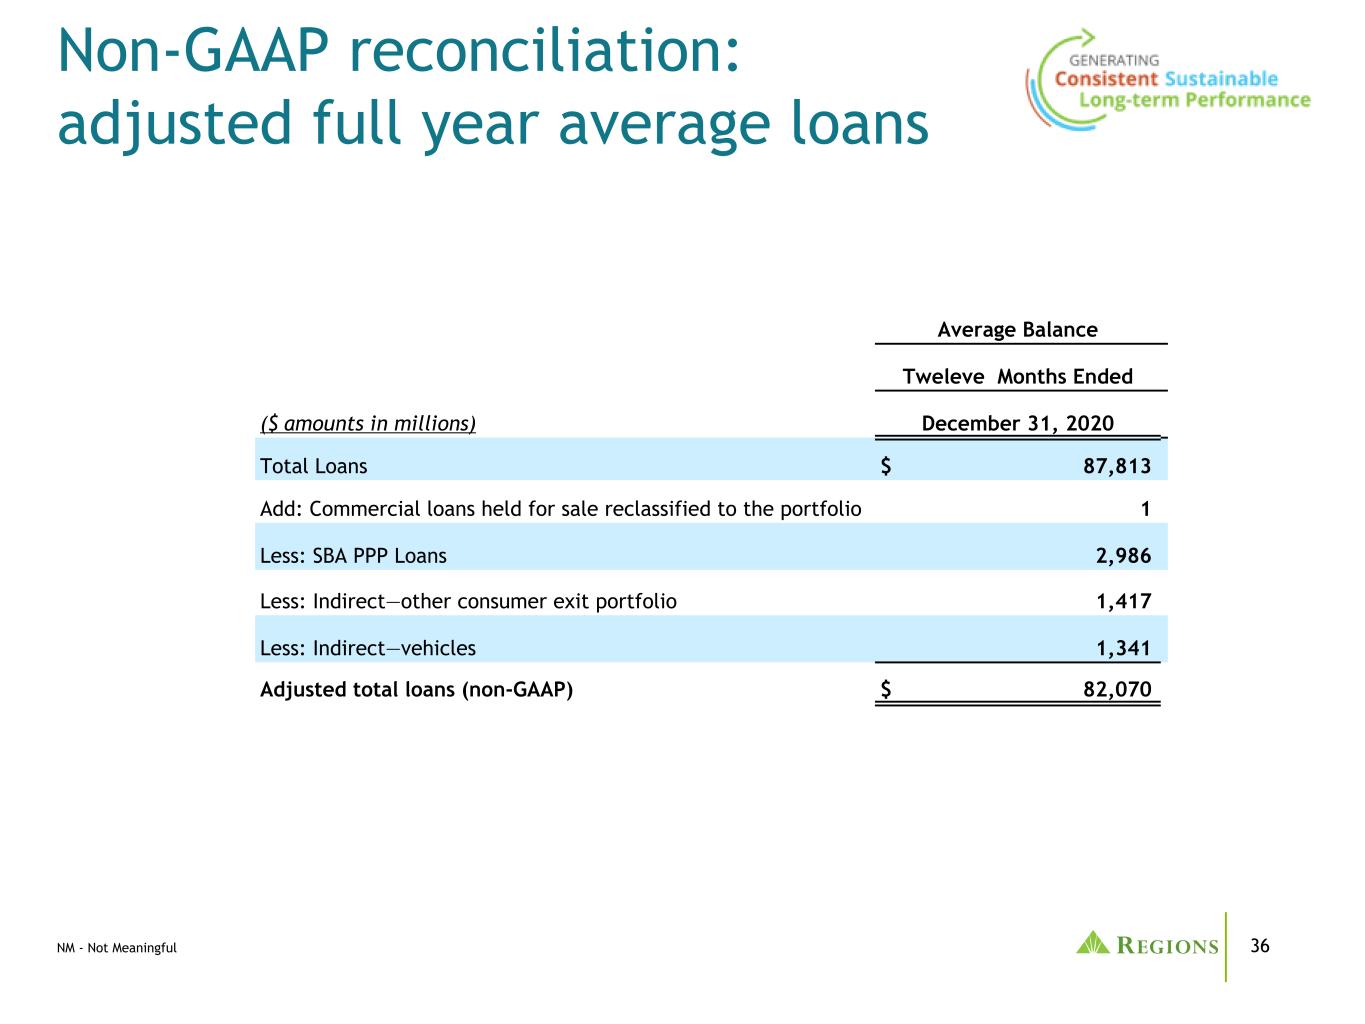
36 Non-GAAP reconciliation: adjusted full year average loans Average Balance Tweleve Months Ended ($ amounts in millions) December 31, 2020 Total Loans $ 87,813 Add: Commercial loans held for sale reclassified to the portfolio 1 Less: SBA PPP Loans 2,986 Less: Indirect—other consumer exit portfolio 1,417 Less: Indirect—vehicles 1,341 Adjusted total loans (non-GAAP) $ 82,070 NM - Not Meaningful
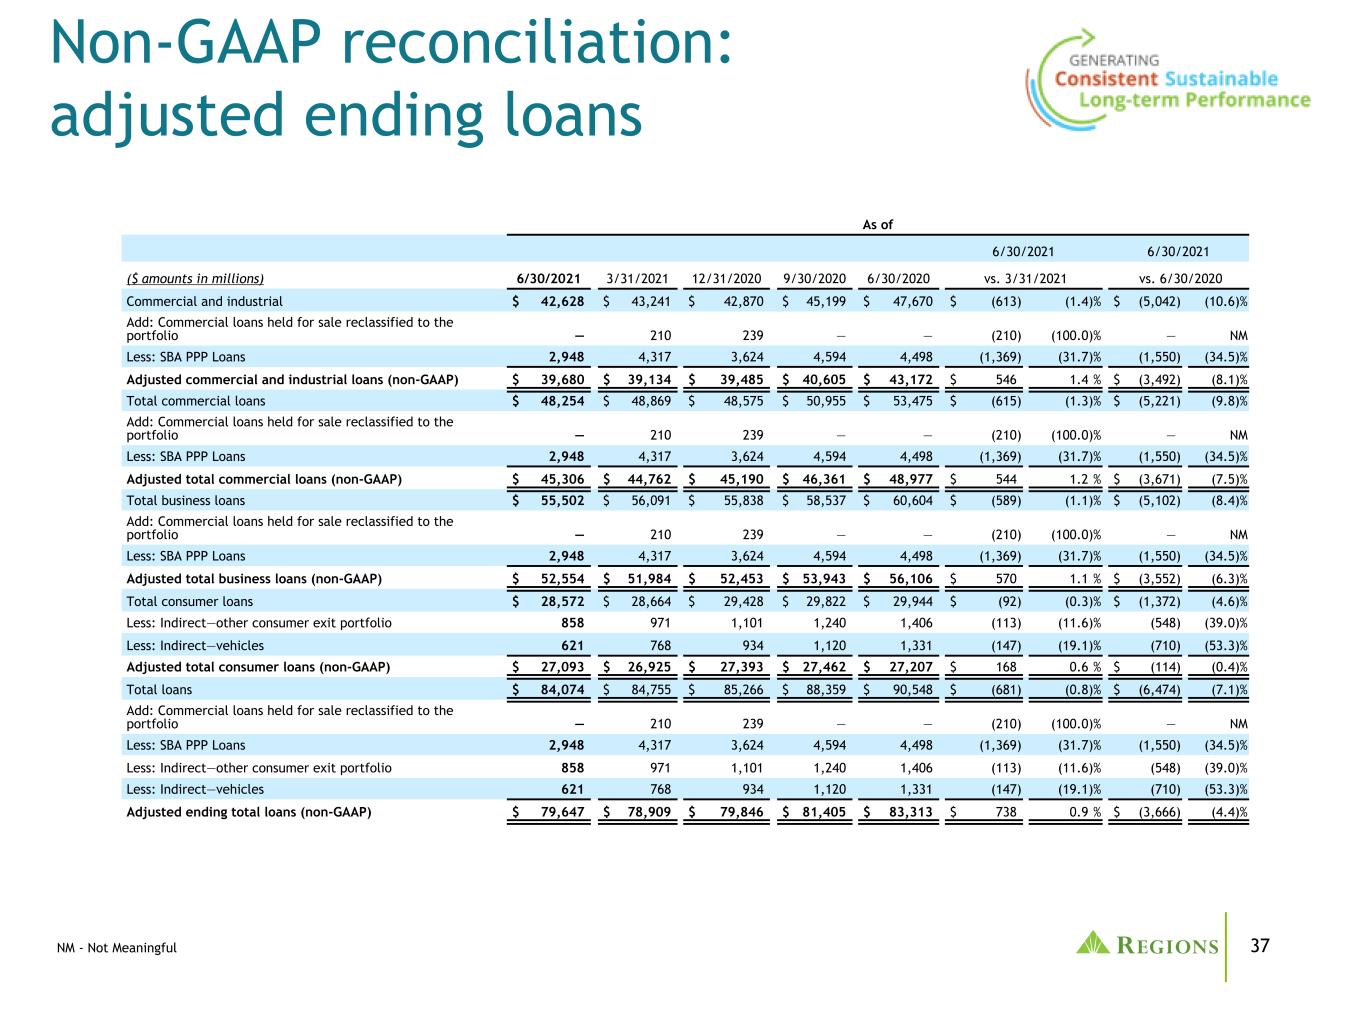
37 Non-GAAP reconciliation: adjusted ending loans As of 6/30/2021 6/30/2021 ($ amounts in millions) 6/30/2021 3/31/2021 12/31/2020 9/30/2020 6/30/2020 vs. 3/31/2021 vs. 6/30/2020 Commercial and industrial $ 42,628 $ 43,241 $ 42,870 $ 45,199 $ 47,670 $ (613) (1.4) % $ (5,042) (10.6) % Add: Commercial loans held for sale reclassified to the portfolio — 210 239 — — (210) (100.0) % — NM Less: SBA PPP Loans 2,948 4,317 3,624 4,594 4,498 (1,369) (31.7) % (1,550) (34.5) % Adjusted commercial and industrial loans (non-GAAP) $ 39,680 $ 39,134 $ 39,485 $ 40,605 $ 43,172 $ 546 1.4 % $ (3,492) (8.1) % Total commercial loans $ 48,254 $ 48,869 $ 48,575 $ 50,955 $ 53,475 $ (615) (1.3) % $ (5,221) (9.8) % Add: Commercial loans held for sale reclassified to the portfolio — 210 239 — — (210) (100.0) % — NM Less: SBA PPP Loans 2,948 4,317 3,624 4,594 4,498 (1,369) (31.7) % (1,550) (34.5) % Adjusted total commercial loans (non-GAAP) $ 45,306 $ 44,762 $ 45,190 $ 46,361 $ 48,977 $ 544 1.2 % $ (3,671) (7.5) % Total business loans $ 55,502 $ 56,091 $ 55,838 $ 58,537 $ 60,604 $ (589) (1.1) % $ (5,102) (8.4) % Add: Commercial loans held for sale reclassified to the portfolio — 210 239 — — (210) (100.0) % — NM Less: SBA PPP Loans 2,948 4,317 3,624 4,594 4,498 (1,369) (31.7) % (1,550) (34.5) % Adjusted total business loans (non-GAAP) $ 52,554 $ 51,984 $ 52,453 $ 53,943 $ 56,106 $ 570 1.1 % $ (3,552) (6.3) % Total consumer loans $ 28,572 $ 28,664 $ 29,428 $ 29,822 $ 29,944 $ (92) (0.3) % $ (1,372) (4.6) % Less: Indirect—other consumer exit portfolio 858 971 1,101 1,240 1,406 (113) (11.6) % (548) (39.0) % Less: Indirect—vehicles 621 768 934 1,120 1,331 (147) (19.1) % (710) (53.3) % Adjusted total consumer loans (non-GAAP) $ 27,093 $ 26,925 $ 27,393 $ 27,462 $ 27,207 $ 168 0.6 % $ (114) (0.4) % Total loans $ 84,074 $ 84,755 $ 85,266 $ 88,359 $ 90,548 $ (681) (0.8) % $ (6,474) (7.1) % Add: Commercial loans held for sale reclassified to the portfolio — 210 239 — — (210) (100.0) % — NM Less: SBA PPP Loans 2,948 4,317 3,624 4,594 4,498 (1,369) (31.7) % (1,550) (34.5) % Less: Indirect—other consumer exit portfolio 858 971 1,101 1,240 1,406 (113) (11.6) % (548) (39.0) % Less: Indirect—vehicles 621 768 934 1,120 1,331 (147) (19.1) % (710) (53.3) % Adjusted ending total loans (non-GAAP) $ 79,647 $ 78,909 $ 79,846 $ 81,405 $ 83,313 $ 738 0.9 % $ (3,666) (4.4) % NM - Not Meaningful

38 Non-GAAP reconciliation: non-interest expense Year Ended December 31 ($ amounts in millions) 2020 2019 2018 2017 2016 Non-interest expense (GAAP) $ 3,643 $ 3,489 $ 3,570 $ 3,491 $ 3,483 Adjustments: Contribution to Regions Financial Corporation foundation (10) — (60) (40) — Professional, legal and regulatory expenses (7) — — — (3) Branch consolidation, property and equipment charges (31) (25) (11) (22) (58) Expenses associated with residential mortgage loan sale — — (4) — — Loss on early extinguishment of debt (22) (16) — — (14) Salary and employee benefits—severance charges (31) (5) (61) (10) (21) Acquisition Expense (1) — — — — Adjusted non-interest expense (non-GAAP) $ 3,541 $ 3,443 $ 3,434 $ 3,419 $ 3,387

39 Non-GAAP reconciliation: ACL/Loans excluding PPP As of ($ amounts in millions) 6/30/2021 3/31/2021 12/31/2020 9/30/2020 6/30/2020 Total Loans $ 84,074 $ 84,755 $ 85,266 $ 88,359 $ 90,548 Less: SBA PPP Loans 2,948 4,317 3,624 4,594 4,498 Loans excluding PPP, net (non- GAAP) $ 81,126 $ 80,438 $ 81,642 $ 83,765 $ 86,050 ACL at period end $ 1,684 $ 2,068 $ 2,293 $ 2,425 $ 2,425 Less: SBA PPP Loans' ACL $ 3 $ 3 $ 1 $ — $ — ACL excluding PPP Loans' ACL (non-GAAP) $ 1,681 $ 2,065 $ 2,292 $ 2,425 $ 2,425 ACL/Loans excluding PPP, net (non-GAAP) 2.07 % 2.57 % 2.81 % 2.90 % 2.82 %

40 Non-GAAP reconciliation: Pre-tax pre-provision income (PPI) Quarter Ended ($ amounts in millions) 6/30/2021 3/31/2021 12/31/2020 9/30/2020 6/30/2020 2Q21 vs. 1Q21 2Q21 vs. 2Q20 Net income (loss) available to common shareholders (GAAP) $ 748 $ 614 $ 588 $ 501 $ (237) $ 134 21.8 % $ 985 415.6 % Preferred dividends and other (GAAP)(1) 42 28 28 29 23 14 50.0 % 19 82.6 % Income tax expense (benefit) (GAAP) 231 180 121 104 (47) 51 28.3 % 278 NM Income (loss) before income taxes (GAAP) 1,021 822 737 634 (261) 199 24.2 % 1,282 491.2 % Provision for (benefit from) credit losses (GAAP) (337) (142) (38) 113 882 (195) (137.3) % (1,219) (138.2) % Pre-tax pre-provision income (non-GAAP) 684 680 699 747 621 4 0.6 % 63 10.1 % Other adjustments: Securities (gains) losses, net (1) (1) — (3) (1) — — % — — % Gains on equity investment — (3) (6) (44) — 3 100.0 % — NM Bank-owned life insurance (18) — (25) — — (18) NM (18) NM Salaries and employee benefits—severance charges 2 3 26 2 2 (1) (33.3) % — — % Branch consolidation, property and equipment charges — 5 7 3 10 (5) (100.0) % (10) (100.0) % Contribution to the Regions Financial Corporation foundation 1 2 10 — — (1) (50.0) % 1 NM Loss on early extinguishment of debt — — 14 2 6 — NM (6) (100.0) % Professional, legal and regulatory expenses — — — — 7 — NM (7) (100.0) % Acquisition expenses — — — — 1 — NM (1) (100.0) % Total other adjustments (16) 6 26 (40) 25 (22) (366.7) % (41) (164.0) % Adjusted pre-tax pre-provision income (non-GAAP) $ 668 $ 686 $ 725 $ 707 $ 646 $ (18) (2.6) % $ 22 3.4 % NM - Not Meaningful NM - Not Meaningful (1) The second quarter 2021 amount includes $13 million of Series A preferred stock issuance costs, which reduced net income available to common shareholders when the shares were redeemed during the second quarter of 2021. Management does not consider this $13 million to be indicative of the company's performance and believes excluding it will assist investors in analyzing its results and in predicting future performance.
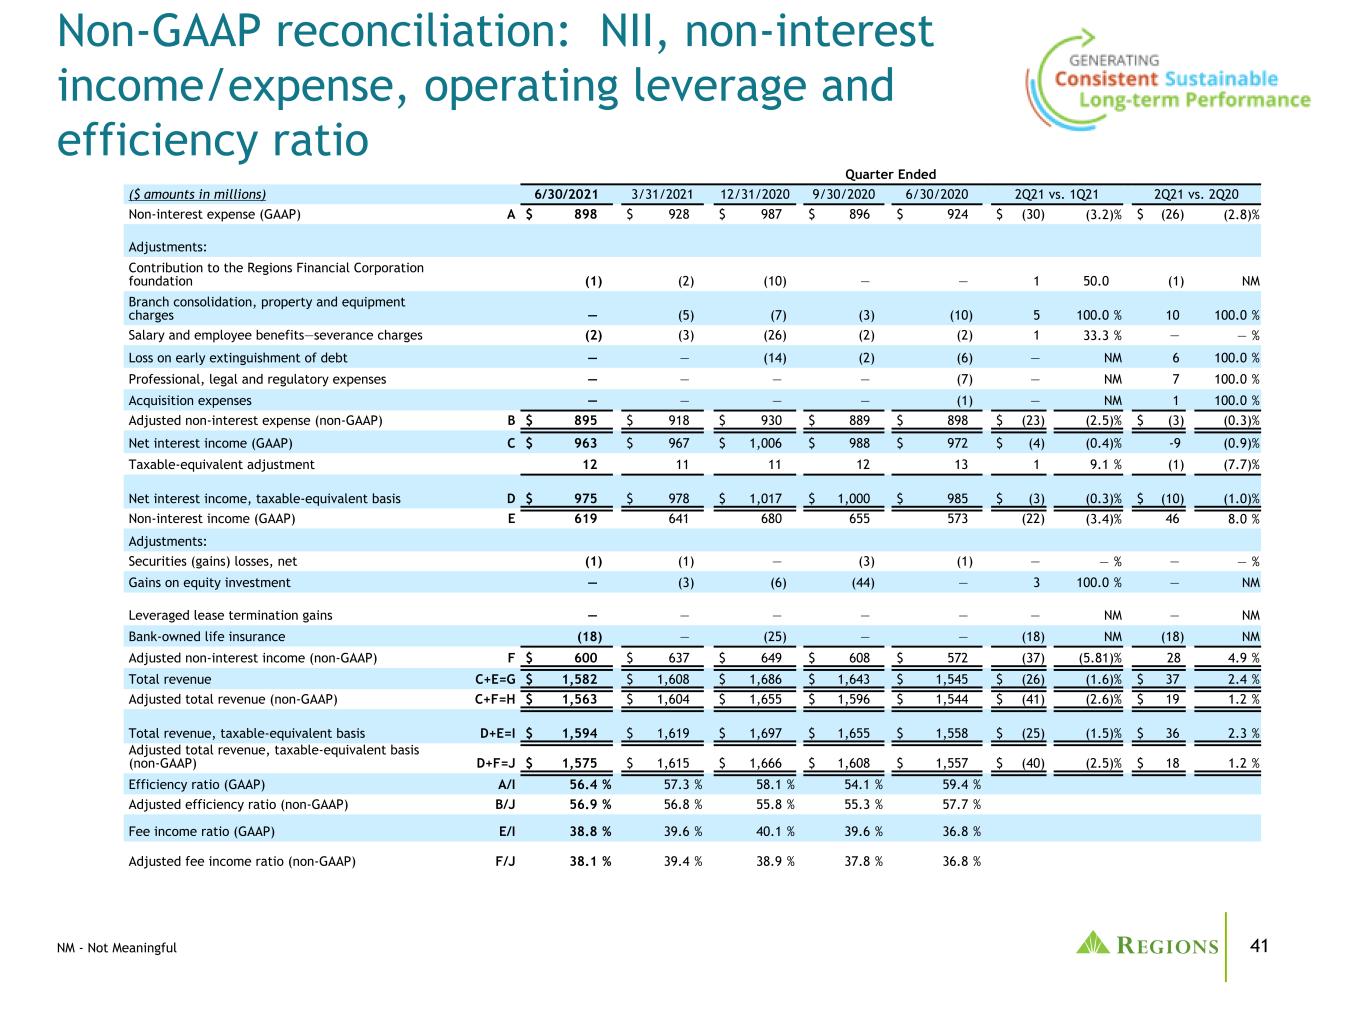
41 Non-GAAP reconciliation: NII, non-interest income/expense, operating leverage and efficiency ratio NM - Not Meaningful Quarter Ended ($ amounts in millions) 6/30/2021 3/31/2021 12/31/2020 9/30/2020 6/30/2020 2Q21 vs. 1Q21 2Q21 vs. 2Q20 Non-interest expense (GAAP) A $ 898 $ 928 $ 987 $ 896 $ 924 $ (30) (3.2) % $ (26) (2.8) % Adjustments: Contribution to the Regions Financial Corporation foundation (1) (2) (10) — — 1 50.0 (1) NM Branch consolidation, property and equipment charges — (5) (7) (3) (10) 5 100.0 % 10 100.0 % Salary and employee benefits—severance charges (2) (3) (26) (2) (2) 1 33.3 % — — % Loss on early extinguishment of debt — — (14) (2) (6) — NM 6 100.0 % Professional, legal and regulatory expenses — — — — (7) — NM 7 100.0 % Acquisition expenses — — — — (1) — NM 1 100.0 % Adjusted non-interest expense (non-GAAP) B $ 895 $ 918 $ 930 $ 889 $ 898 $ (23) (2.5) % $ (3) (0.3) % Net interest income (GAAP) C $ 963 $ 967 $ 1,006 $ 988 $ 972 $ (4) (0.4) % -9 (0.9) % Taxable-equivalent adjustment 12 11 11 12 13 1 9.1 % (1) (7.7) % Net interest income, taxable-equivalent basis D $ 975 $ 978 $ 1,017 $ 1,000 $ 985 $ (3) (0.3) % $ (10) (1.0) % Non-interest income (GAAP) E 619 641 680 655 573 (22) (3.4) % 46 8.0 % Adjustments: Securities (gains) losses, net (1) (1) — (3) (1) — — % — — % Gains on equity investment — (3) (6) (44) — 3 100.0 % — NM Leveraged lease termination gains — — — — — — NM — NM Bank-owned life insurance (18) — (25) — — (18) NM (18) NM Adjusted non-interest income (non-GAAP) F $ 600 $ 637 $ 649 $ 608 $ 572 (37) (5.81) % 28 4.9 % Total revenue C+E=G $ 1,582 $ 1,608 $ 1,686 $ 1,643 $ 1,545 $ (26) (1.6) % $ 37 2.4 % Adjusted total revenue (non-GAAP) C+F=H $ 1,563 $ 1,604 $ 1,655 $ 1,596 $ 1,544 $ (41) (2.6) % $ 19 1.2 % Total revenue, taxable-equivalent basis D+E=I $ 1,594 $ 1,619 $ 1,697 $ 1,655 $ 1,558 $ (25) (1.5) % $ 36 2.3 % Adjusted total revenue, taxable-equivalent basis (non-GAAP) D+F=J $ 1,575 $ 1,615 $ 1,666 $ 1,608 $ 1,557 $ (40) (2.5) % $ 18 1.2 % Efficiency ratio (GAAP) A/I 56.4 % 57.3 % 58.1 % 54.1 % 59.4 % Adjusted efficiency ratio (non-GAAP) B/J 56.9 % 56.8 % 55.8 % 55.3 % 57.7 % Fee income ratio (GAAP) E/I 38.8 % 39.6 % 40.1 % 39.6 % 36.8 % Adjusted fee income ratio (non-GAAP) F/J 38.1 % 39.4 % 38.9 % 37.8 % 36.8 %
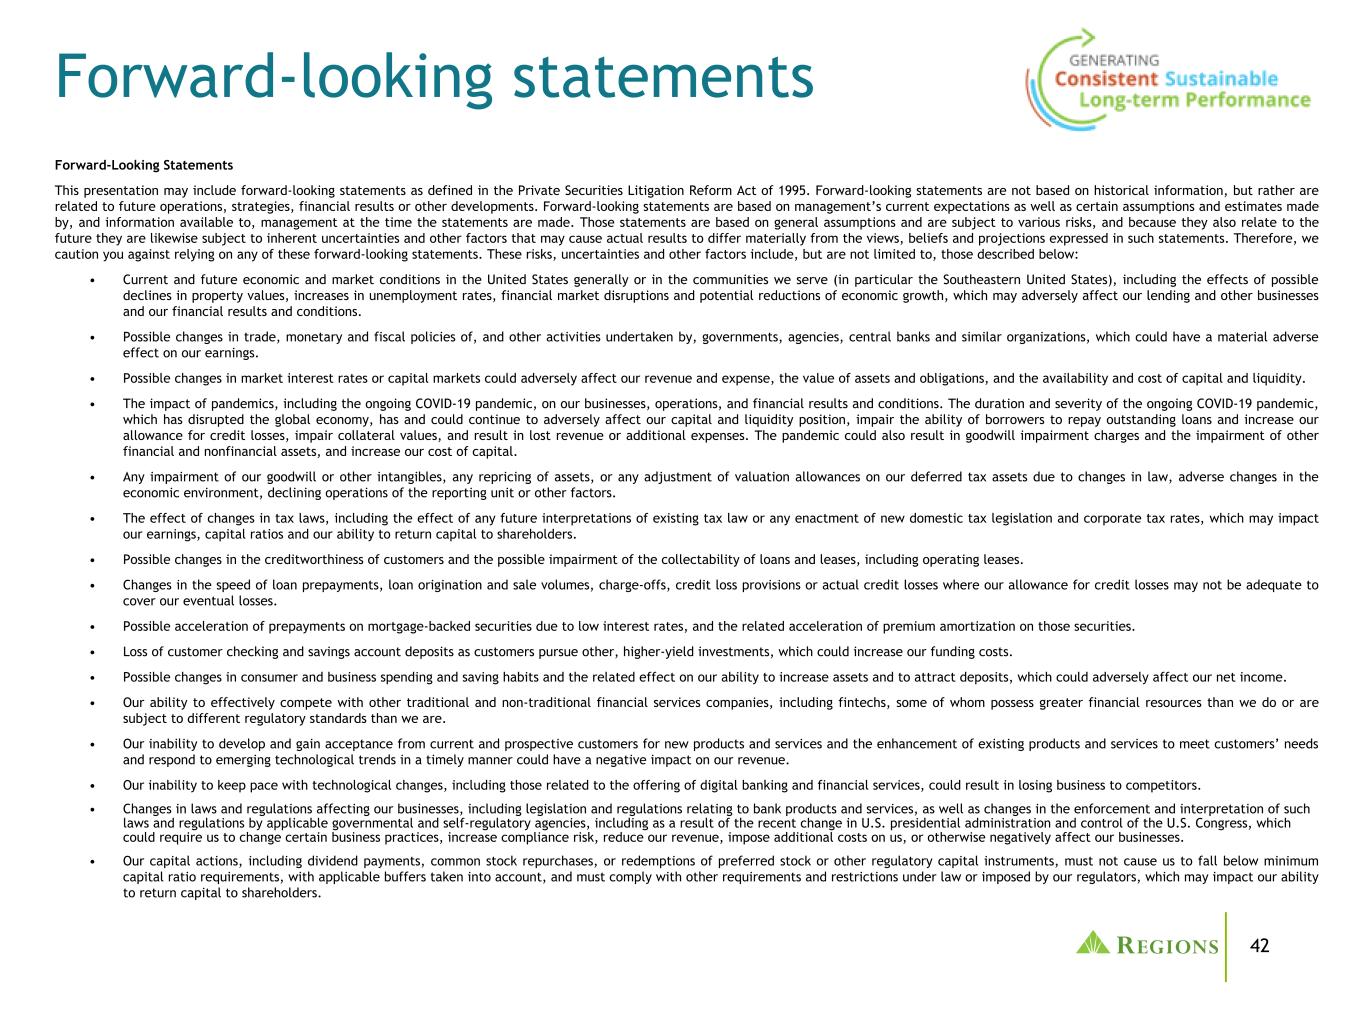
42 Forward-Looking Statements This presentation may include forward-looking statements as defined in the Private Securities Litigation Reform Act of 1995. Forward-looking statements are not based on historical information, but rather are related to future operations, strategies, financial results or other developments. Forward-looking statements are based on management’s current expectations as well as certain assumptions and estimates made by, and information available to, management at the time the statements are made. Those statements are based on general assumptions and are subject to various risks, and because they also relate to the future they are likewise subject to inherent uncertainties and other factors that may cause actual results to differ materially from the views, beliefs and projections expressed in such statements. Therefore, we caution you against relying on any of these forward-looking statements. These risks, uncertainties and other factors include, but are not limited to, those described below: • Current and future economic and market conditions in the United States generally or in the communities we serve (in particular the Southeastern United States), including the effects of possible declines in property values, increases in unemployment rates, financial market disruptions and potential reductions of economic growth, which may adversely affect our lending and other businesses and our financial results and conditions. • Possible changes in trade, monetary and fiscal policies of, and other activities undertaken by, governments, agencies, central banks and similar organizations, which could have a material adverse effect on our earnings. • Possible changes in market interest rates or capital markets could adversely affect our revenue and expense, the value of assets and obligations, and the availability and cost of capital and liquidity. • The impact of pandemics, including the ongoing COVID-19 pandemic, on our businesses, operations, and financial results and conditions. The duration and severity of the ongoing COVID-19 pandemic, which has disrupted the global economy, has and could continue to adversely affect our capital and liquidity position, impair the ability of borrowers to repay outstanding loans and increase our allowance for credit losses, impair collateral values, and result in lost revenue or additional expenses. The pandemic could also result in goodwill impairment charges and the impairment of other financial and nonfinancial assets, and increase our cost of capital. • Any impairment of our goodwill or other intangibles, any repricing of assets, or any adjustment of valuation allowances on our deferred tax assets due to changes in law, adverse changes in the economic environment, declining operations of the reporting unit or other factors. • The effect of changes in tax laws, including the effect of any future interpretations of existing tax law or any enactment of new domestic tax legislation and corporate tax rates, which may impact our earnings, capital ratios and our ability to return capital to shareholders. • Possible changes in the creditworthiness of customers and the possible impairment of the collectability of loans and leases, including operating leases. • Changes in the speed of loan prepayments, loan origination and sale volumes, charge-offs, credit loss provisions or actual credit losses where our allowance for credit losses may not be adequate to cover our eventual losses. • Possible acceleration of prepayments on mortgage-backed securities due to low interest rates, and the related acceleration of premium amortization on those securities. • Loss of customer checking and savings account deposits as customers pursue other, higher-yield investments, which could increase our funding costs. • Possible changes in consumer and business spending and saving habits and the related effect on our ability to increase assets and to attract deposits, which could adversely affect our net income. • Our ability to effectively compete with other traditional and non-traditional financial services companies, including fintechs, some of whom possess greater financial resources than we do or are subject to different regulatory standards than we are. • Our inability to develop and gain acceptance from current and prospective customers for new products and services and the enhancement of existing products and services to meet customers’ needs and respond to emerging technological trends in a timely manner could have a negative impact on our revenue. • Our inability to keep pace with technological changes, including those related to the offering of digital banking and financial services, could result in losing business to competitors. • Changes in laws and regulations affecting our businesses, including legislation and regulations relating to bank products and services, as well as changes in the enforcement and interpretation of such laws and regulations by applicable governmental and self-regulatory agencies, including as a result of the recent change in U.S. presidential administration and control of the U.S. Congress, which could require us to change certain business practices, increase compliance risk, reduce our revenue, impose additional costs on us, or otherwise negatively affect our businesses. • Our capital actions, including dividend payments, common stock repurchases, or redemptions of preferred stock or other regulatory capital instruments, must not cause us to fall below minimum capital ratio requirements, with applicable buffers taken into account, and must comply with other requirements and restrictions under law or imposed by our regulators, which may impact our ability to return capital to shareholders. Forward-looking statements
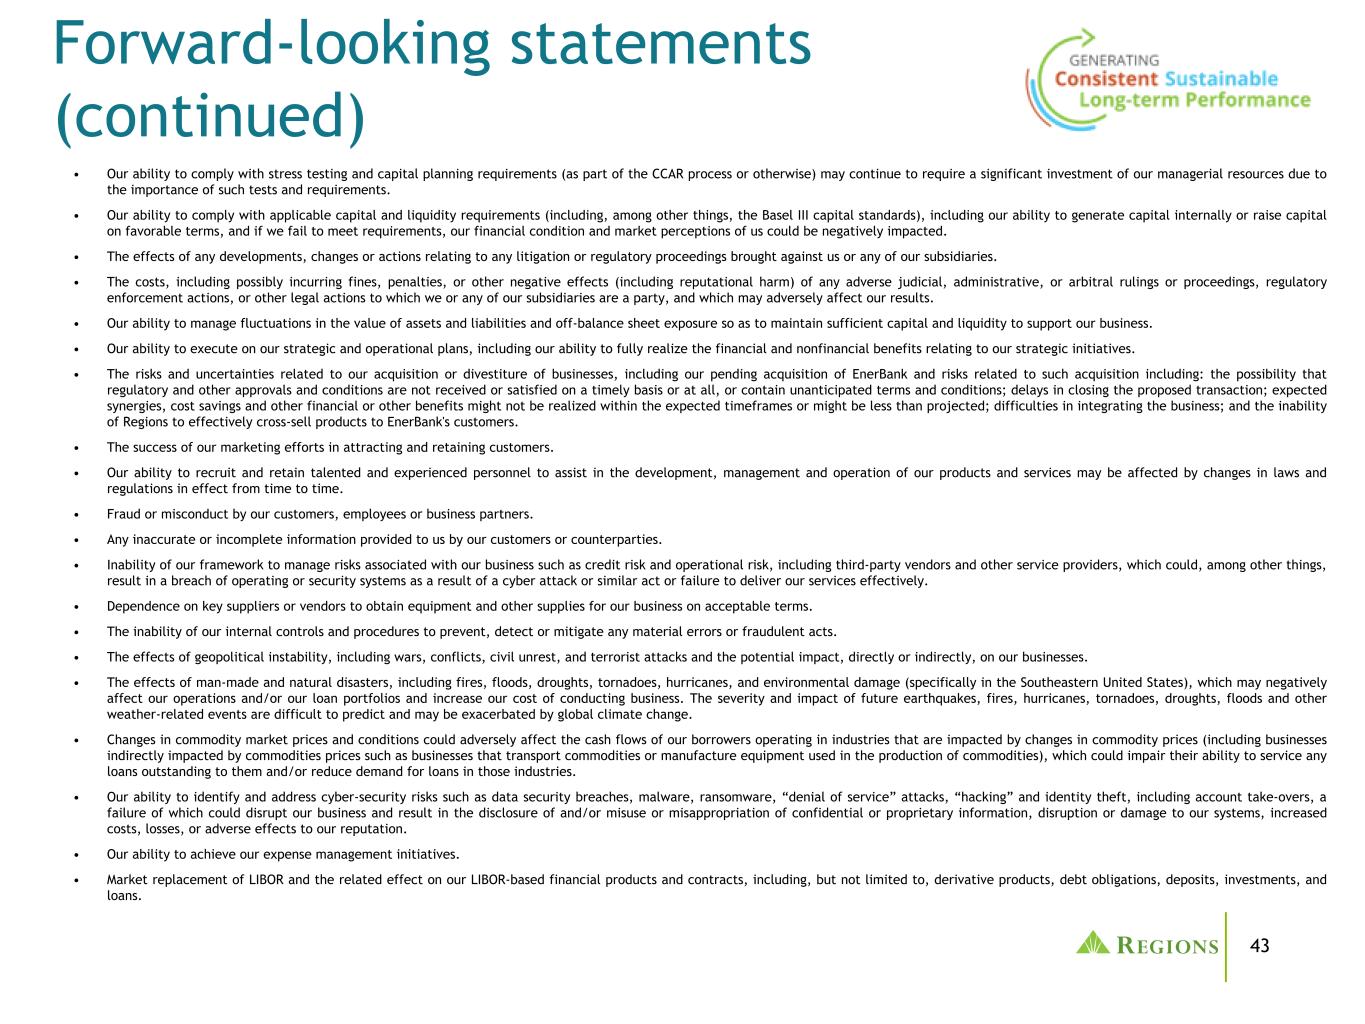
43 • Our ability to comply with stress testing and capital planning requirements (as part of the CCAR process or otherwise) may continue to require a significant investment of our managerial resources due to the importance of such tests and requirements. • Our ability to comply with applicable capital and liquidity requirements (including, among other things, the Basel III capital standards), including our ability to generate capital internally or raise capital on favorable terms, and if we fail to meet requirements, our financial condition and market perceptions of us could be negatively impacted. • The effects of any developments, changes or actions relating to any litigation or regulatory proceedings brought against us or any of our subsidiaries. • The costs, including possibly incurring fines, penalties, or other negative effects (including reputational harm) of any adverse judicial, administrative, or arbitral rulings or proceedings, regulatory enforcement actions, or other legal actions to which we or any of our subsidiaries are a party, and which may adversely affect our results. • Our ability to manage fluctuations in the value of assets and liabilities and off-balance sheet exposure so as to maintain sufficient capital and liquidity to support our business. • Our ability to execute on our strategic and operational plans, including our ability to fully realize the financial and nonfinancial benefits relating to our strategic initiatives. • The risks and uncertainties related to our acquisition or divestiture of businesses, including our pending acquisition of EnerBank and risks related to such acquisition including: the possibility that regulatory and other approvals and conditions are not received or satisfied on a timely basis or at all, or contain unanticipated terms and conditions; delays in closing the proposed transaction; expected synergies, cost savings and other financial or other benefits might not be realized within the expected timeframes or might be less than projected; difficulties in integrating the business; and the inability of Regions to effectively cross-sell products to EnerBank's customers. • The success of our marketing efforts in attracting and retaining customers. • Our ability to recruit and retain talented and experienced personnel to assist in the development, management and operation of our products and services may be affected by changes in laws and regulations in effect from time to time. • Fraud or misconduct by our customers, employees or business partners. • Any inaccurate or incomplete information provided to us by our customers or counterparties. • Inability of our framework to manage risks associated with our business such as credit risk and operational risk, including third-party vendors and other service providers, which could, among other things, result in a breach of operating or security systems as a result of a cyber attack or similar act or failure to deliver our services effectively. • Dependence on key suppliers or vendors to obtain equipment and other supplies for our business on acceptable terms. • The inability of our internal controls and procedures to prevent, detect or mitigate any material errors or fraudulent acts. • The effects of geopolitical instability, including wars, conflicts, civil unrest, and terrorist attacks and the potential impact, directly or indirectly, on our businesses. • The effects of man-made and natural disasters, including fires, floods, droughts, tornadoes, hurricanes, and environmental damage (specifically in the Southeastern United States), which may negatively affect our operations and/or our loan portfolios and increase our cost of conducting business. The severity and impact of future earthquakes, fires, hurricanes, tornadoes, droughts, floods and other weather-related events are difficult to predict and may be exacerbated by global climate change. • Changes in commodity market prices and conditions could adversely affect the cash flows of our borrowers operating in industries that are impacted by changes in commodity prices (including businesses indirectly impacted by commodities prices such as businesses that transport commodities or manufacture equipment used in the production of commodities), which could impair their ability to service any loans outstanding to them and/or reduce demand for loans in those industries. • Our ability to identify and address cyber-security risks such as data security breaches, malware, ransomware, “denial of service” attacks, “hacking” and identity theft, including account take-overs, a failure of which could disrupt our business and result in the disclosure of and/or misuse or misappropriation of confidential or proprietary information, disruption or damage to our systems, increased costs, losses, or adverse effects to our reputation. • Our ability to achieve our expense management initiatives. • Market replacement of LIBOR and the related effect on our LIBOR-based financial products and contracts, including, but not limited to, derivative products, debt obligations, deposits, investments, and loans. Forward-looking statements (continued)

44 • Possible downgrades in our credit ratings or outlook could, among other negative impacts, increase the costs of funding from capital markets. • The effects of a possible downgrade in the U.S. government’s sovereign credit rating or outlook, which could result in risks to us and general economic conditions that we are not able to predict. • The effects of problems encountered by other financial institutions that adversely affect us or the banking industry generally could require us to change certain business practices, reduce our revenue, impose additional costs on us, or otherwise negatively affect our businesses. • The effects of the failure of any component of our business infrastructure provided by a third party could disrupt our businesses, result in the disclosure of and/or misuse of confidential information or proprietary information, increase our costs, negatively affect our reputation, and cause losses. • Our ability to receive dividends from our subsidiaries, in particular Regions Bank, could affect our liquidity and ability to pay dividends to shareholders. • Changes in accounting policies or procedures as may be required by the FASB or other regulatory agencies could materially affect our financial statements and how we report those results, and expectations and preliminary analyses relating to how such changes will affect our financial results could prove incorrect. • Other risks identified from time to time in reports that we file with the SEC. • Fluctuations in the price of our common stock and inability to complete stock repurchases in the time frame and/or on the terms anticipated. • The effects of any damage to our reputation resulting from developments related to any of the items identified above. The foregoing list of factors is not exhaustive. For discussion of these and other factors that may cause actual results to differ from expectations, look under the captions “Forward-Looking Statements” and “Risk Factors” of Regions’ Annual Report on Form 10-K for the year ended December 31, 2020 and the "Risk Factors" of Regions' Quarterly Report on Form 10-Q for the quarter ended March 31, 2021 as filed with the SEC. Further, statements about the potential effects of the COVID-19 pandemic on our businesses, operations, and financial results and conditions may constitute forward-looking statements and are subject to the risk that the actual effects may differ, possibly materially, from what is reflected in those forward-looking statements due to factors and future developments that are uncertain, unpredictable and in many cases beyond our control, including the scope and duration of the COVID-19 pandemic (including any resurgences), actions taken by governmental authorities in response to the COVID-19 pandemic and their success, the effectiveness and degree of acceptance of any vaccines, and the direct and indirect impact of the COVID-19 pandemic on our customers, third parties and us. The words "future," “anticipates,” "assumes," “intends,” “plans,” “seeks,” “believes,” "predicts," "potential," "objectives," “estimates,” “expects,” “targets,” “projects,” “outlook,” “forecast,” "would," “will,” “may,” “might,” “could,” “should,” “can,” and similar terms and expressions often signify forward-looking statements. You should not place undue reliance on any forward-looking statements, which speak only as of the date made. Factors or events that could cause our actual results to differ may emerge from time to time, and it is not possible to predict all of them. We assume no obligation and do not intend to update or revise any forward-looking statements that are made from time to time, either as a result of future developments, new information or otherwise, except as may be required by law. Regions’ Investor Relations contact is Dana Nolan at (205) 264-7040; Regions’ Media contact is Jeremy King at (205) 264-4551. Forward-looking statements (continued)

45 ®


