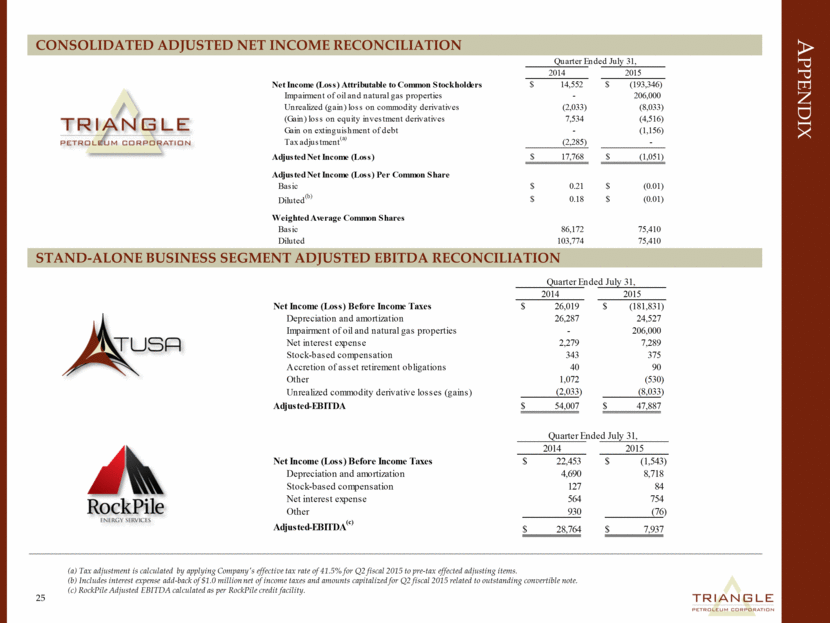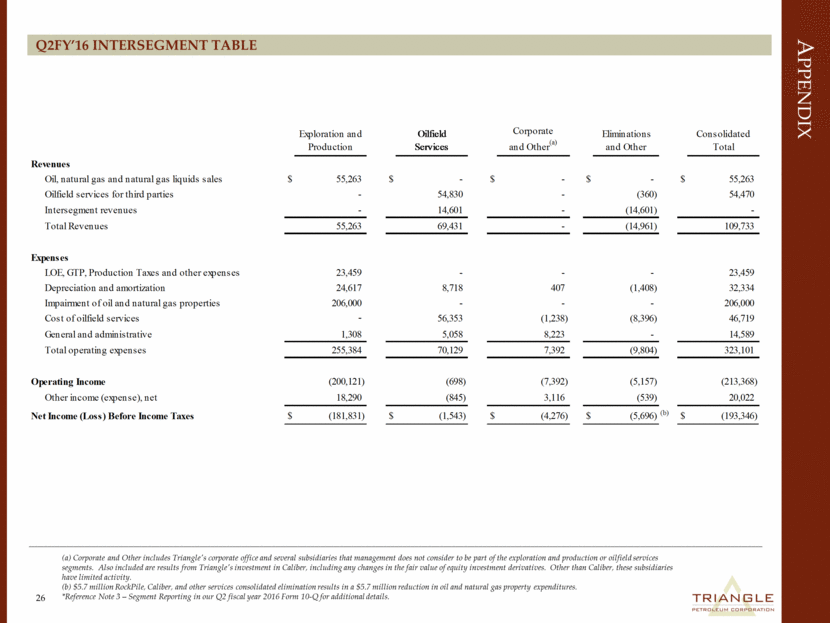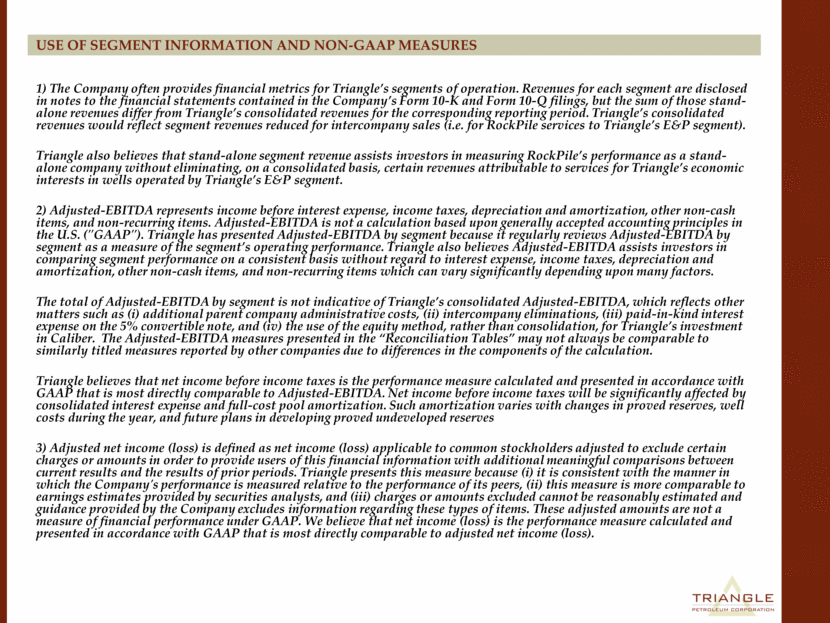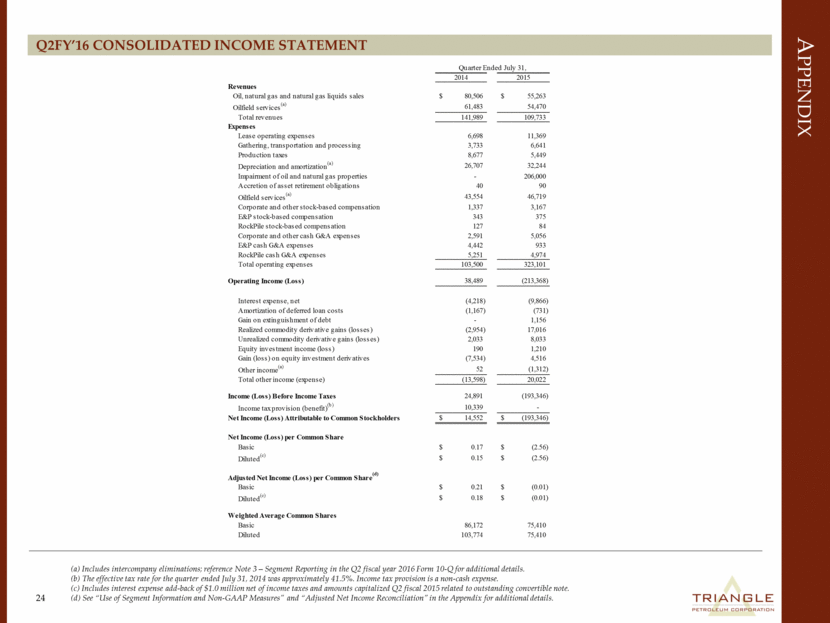
| Appendix Q2FY’16 Consolidated Income Statement 24 (a) Includes intercompany eliminations; reference Note 3 – Segment Reporting in the Q2 fiscal year 2016 Form 10-Q for additional details. (b) The effective tax rate for the quarter ended July 31, 2014 was approximately 41.5%. Income tax provision is a non-cash expense. (c) Includes interest expense add-back of $1.0 million net of income taxes and amounts capitalized Q2 fiscal 2015 related to outstanding convertible note. (d) See “Use of Segment Information and Non-GAAP Measures” and “Adjusted Net Income Reconciliation” in the Appendix for additional details. Quarter Ended July 31, Quarter Ended April 30, 2014 2015 Revenues Oil, natural gas and natural gas liquids sales 80,506 $ 55,263 $ Oilfield services (a) 61,483 54,470 Total revenues 141,989 109,733 Expenses Lease operating expenses 6,698 11,369 Gathering, transportation and processing 3,733 6,641 Production taxes 8,677 5,449 Depreciation and amortization (a) 26,707 32,244 Impairment of oil and natural gas properties - 206,000 Accretion of asset retirement obligations 40 90 Oilfield services (a) 43,554 46,719 Corporate and other stock-based compensation 1,337 3,167 E&P stock-based compensation 343 375 RockPile stock-based compensation 127 84 Corporate and other cash G&A expenses 2,591 5,056 E&P cash G&A expenses 4,442 933 RockPile cash G&A expenses 5,251 4,974 Total operating expenses 103,500 323,101 Operating Income (Loss) 38,489 (213,368) Interest expense, net (4,218) (9,866) Amortization of deferred loan costs (1,167) (731) Gain on extinguishment of debt - 1,156 Realized commodity derivative gains (losses) (2,954) 17,016 Unrealized commodity derivative gains (losses) 2,033 8,033 Equity investment income (loss) 190 1,210 Gain (loss) on equity investment derivatives (7,534) 4,516 Other income (a) 52 (1,312) Total other income (expense) (13,598) 20,022 Income (Loss) Before Income Taxes 24,891 (193,346) Income tax provision (benefit) (b) 10,339 - Net Income (Loss) Attributable to Common Stockholders 14,552 $ (193,346) $ Net Income (Loss) per Common Share Basic 0.17 $ (2.56) $ Diluted (c) 0.15 $ (2.56) $ Adjusted Net Income (Loss) per Common Share (d) Basic 0.21 $ (0.01) $ Diluted (c) 0.18 $ (0.01) $ Weighted Average Common Shares Basic 86,172 75,410 Diluted 103,774 75,410 |

