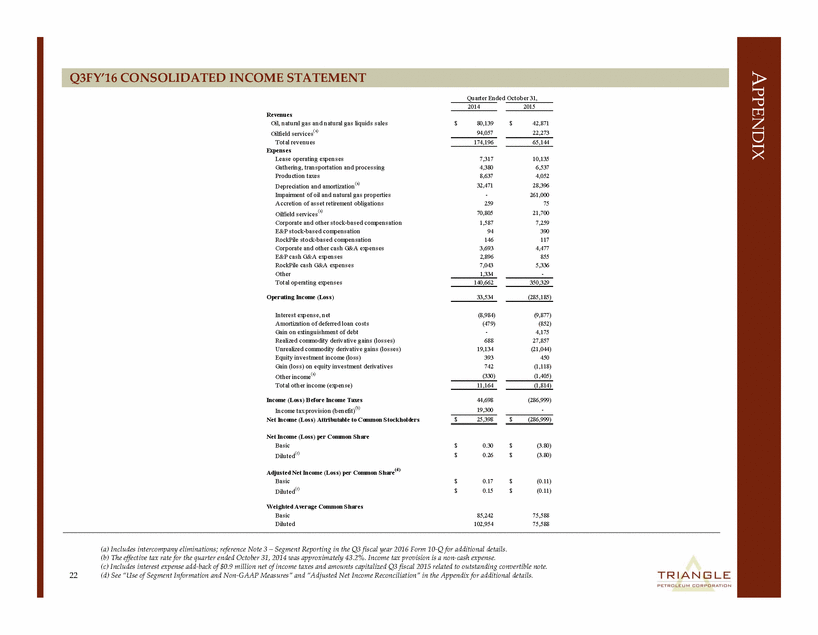
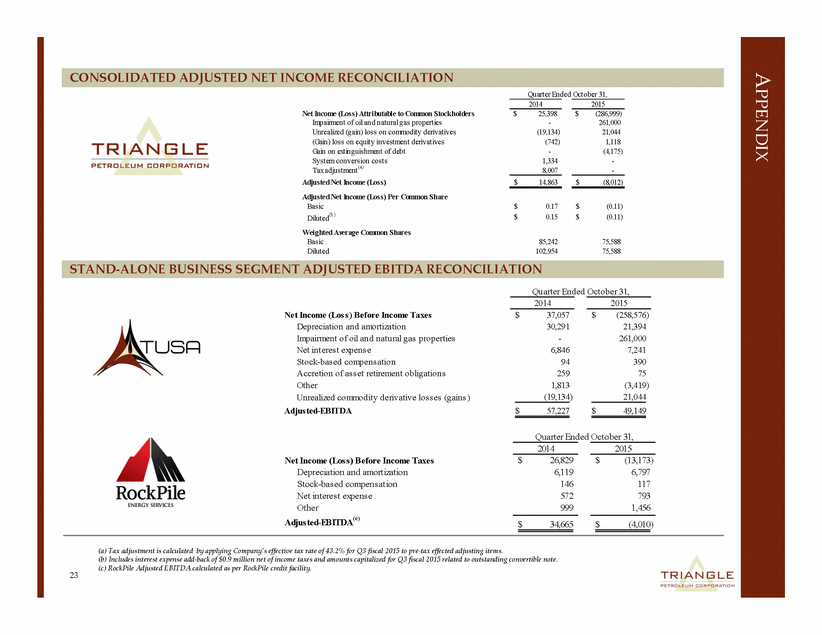
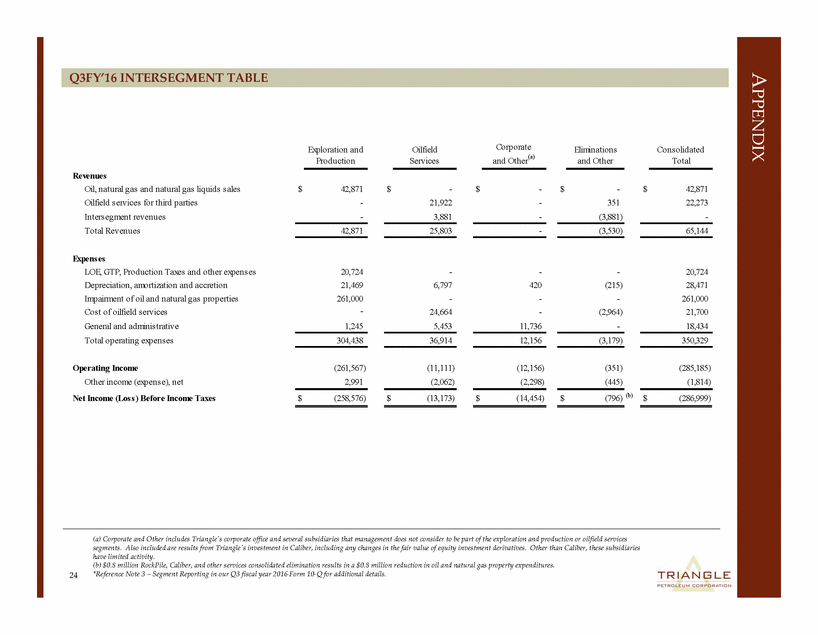
Quarter Ended October 31, 2014 2015 Revenues Oil, natural gas and natural gas liquids s ales Oilfield s ervices (a) Total revenues Expens es Leas e operating expens es Gathering, trans portation and proces s ing Production taxes Depreciation and amortization(a) Impairment of oil and natural gas properties Accretion of as s et retirement obligations Oilfield s ervices (a) Corporate and other s tock-bas ed compens ation E&P stock-based compensation RockPile s tock-bas ed compens ation Corporate and other cas h G&A expens es E&P cas h G&A expens es RockPile cas h G&A expens es Other Total operating expens es $ 80,139 94,057 $ 42,871 22,273 174,196 65,144 7,317 4,380 8,637 32,471 - 259 70,805 1,587 94 146 3,693 2,896 7,043 1,334 10,135 6,537 4,052 28,396 261,000 75 21,700 7,259 390 117 4,477 855 5,336 - 140,662 350,329 Operating Income (Los s ) 33,534 (285,185) Interest expense, net Amortization of deferred loan cos ts Gain on extinguis hment of debt Realized commodity derivative gains (los s es ) Unrealized commodity derivative gains (los s es ) Equity inves tment income (los s ) Gain (los s ) on equity inves tment derivatives Other income(a) Total other income (expens e) (8,984) (479) - 688 19,134 393 742 (330) (9,877) (852) 4,175 27,857 (21,044) 450 (1,118) (1,405) 11,164 (1,814) Income (Los s ) Before Income Taxes Income tax provis ion (benefit)(b) Net Income (Los s ) Attributable to Common Stock holders 44,698 19,300 (286,999) - $ 25,398 $ (286,999) Net Income (Los s ) per Common Share Bas ic Diluted(c) Adjus ted Net Income (Los s ) per Common S hare(d) Bas ic Diluted(c) Weighted Average Common S hares Bas ic Diluted $ $ 0.30 0.26 $ $ (3.80) (3.80) $ $ 0.17 0.15 $ $ (0.11) (0.11) 85,242 102,954 75,588 75,588 (a) Includes intercompany eliminations; reference Note 3 – Segment Reporting in the Q3 fiscal year 2016 Form 10‐Q for additional details. (b) The effective tax rate for the quarter ended October 31, 2014 was approximately 43.2%. Income tax provision is a non‐cash expense. (c) Includes interest expense add‐back of $0.9 million net of income taxes and amounts capitalized Q3 fiscal 2015 related to outstanding convertible note. (d) See “Use of Segment Information and Non‐GAAP Measures” and “Adjusted Net Income Reconciliation” in the Appendix for additional details. 22 APPENDIX Q3FY’16 CONSOLIDATED INCOME STATEMENT
