UNITED STATES
SECURITIES AND EXCHANGE COMMISSION
Washington, D.C. 20549
FORM 10-Q
(Mark One)
x QUARTERLY REPORT PURSUANT TO SECTION 13 OR 15(d) OF THE SECURITIES EXCHANGE ACT OF 1934
For the Quarterly Period Ended July 31, 2008
¨ TRANSITION REPORT PURSUANT TO SECTION 13 OR 15(d) OF THE SECURITIES EXCHANGE ACT OF 1934
For the Transition Period from _________ to _________
Commission file number: 000-51321
TRIANGLE PETROLEUM CORPORATION
(Exact name of registrant as specified in its charter)
Nevada | | 98-0430762 |
(State or other jurisdiction of incorporation or organization) | | (IRS Employer Identification No.) |
Suite 1250, 521 - 3 Avenue SW
Calgary, Alberta
Canada T2P 3T3
(Address of Principal Executive Offices)
(403) 262-4471
(Registrant’s telephone number, including area code)
(Former name, former address and former fiscal year, if changed since last report)
Indicate by check mark whether the registrant: (1) has filed all reports required to be filed by Section 13 or 15(d) of the Securities Exchange Act of 1934 during the preceding 12 months (or for such shorter period that the registrant was required to file such reports), and (2) has been subject to such filing requirements for the past 90 days. Yes x No ¨
Indicate by check mark whether the registrant is a large accelerated filer, an accelerated filer, a non-accelerated filer, or a small reporting company. See definitions of “large accelerated filer,” “accelerated filed,” and “smaller reporting company” in Rule 12b-2 of the Exchange Act. (Check one):
Large accelerated filer o | Accelerated filer o |
Non-accelerated filer o | Smaller reporting company x |
| (Do not check if a smaller reporting company) | |
Indicate by check mark whether the registrant is a shell company (as defined in Rule 12b-2 of the Exchange Act). Yes ¨ No x
As of September 2, 2008, there were 67,426,043 shares of registrant’s common stock outstanding.
TRIANGLE PETROLEUM CORPORATION AND SUBSIDIARIES
INDEX |
| | | | |
| PART I. | FINANCIAL INFORMATION | |
| | | | |
| | ITEM 1. | Financial Statements | 3 |
| | | | |
| | | Consolidated balance sheets at July 31, 2008 and January 31, 2008 (unaudited) | 3 |
| | | | |
| | | Consolidated statements of operations for the three and six months ended July 31, 2008 and 2007 (unaudited) | 4 |
| | | | |
| | | Consolidated statements of stockholder's equity for the six months ended July 31, 2008 and 2007 (unaudited) | 5 |
| | | | |
| | | Consolidated statements of cash flows for the three and six months ended July 31, 2008 and 2007 (unaudited) | 6 |
| | | | |
| | | Notes to unaudited consolidated financial statements | 7 – 13 |
| | | | |
| | ITEM 2. | Management’s Discussion and Analysis of Financial Condition and Results of Operations | 14-24 |
| | | | |
| | ITEM 3. | Quantitative and Qualitative Disclosures About Market Risk | 25 |
| | | | |
| | ITEM 4T. | Controls and Procedures | 25 |
| | | | |
| PART II. | OTHER INFORMATION | |
| | | | |
| | ITEM 1 | Legal proceedings | 27 |
| | ITEM 1A | Risk factors | 27 |
| | ITEM 2 | Unregistered sales of equity securities and use of proceeds | 27 |
| | ITEM 3 | Defaults upon senior securities | 27 |
| | ITEM 4 | Submission of matters to a vote of security holders | 27 |
| | ITEM 5 | Other information | 27 |
| | ITEM 6 | Exhibits | 27 |
| | | | |
| | SIGNATURES | 28 |
Triangle Petroleum Corporation
Consolidated Balance Sheets
(Expressed in U.S. dollars)
| | | July 31, 2008 $ (Unaudited) | | January 31, 2008 $ | |
| | | | | | |
| ASSETS | | | | | | | |
| | | | | | | | |
| Current Assets | | | | | | | |
| | | | | | | | |
| Cash and cash equivalents | | | 23,493,562 | | | 4,581,589 | |
| Prepaid expenses | | | 488,063 | | | 797,307 | |
| Other receivables | | | 488,971 | | | 1,689,391 | |
| | | | | | | | |
| Total Current Assets | | | 24,470,596 | | | 7,068,287 | |
| | | | | | | | |
| Debt Issue Costs, net | | | - | | | 465,833 | |
| | | | | | | | |
| Property and Equipment | | | 50,315 | | | 66,121 | |
| | | | | | | | |
| Oil and Gas Properties (Note 4) | | | 22,773,219 | | | 24,978,949 | |
| | | | | | | | |
| Total Assets | | | 47,294,130 | | | 32,579,190 | |
| | | | | | | | |
| LIABILITIES AND STOCKHOLDERS’ EQUITY | | | | | | | |
| | | | | | | | |
| Current Liabilities | | | | | | | |
| | | | | | | | |
| Accounts payable | | | 3,549,024 | | | 3,533,833 | |
| Accrued interest on convertible debentures | | | 1,917,122 | | | 2,751,096 | |
| Accrued liabilities | | | 419,206 | | | 420,384 | |
| Derivative liabilities (Note 7) | | | - | | | 3,262,846 | |
| Convertible debentures less unamortized discount of $2,037,931 and $1,321,869, respectively (Note 6) | | | 7,962,069 | | | 4,778,271 | |
| | | | | | | | |
| Total Current Liabilities | | | 13,847,421 | | | 14,746,430 | |
| | | | | | | | |
| Asset Retirement Obligations (Note 5) | | | 582,276 | | | 1,003,353 | |
| | | | | | | | |
| Convertible Debentures, less unamortized discount of $nil and $3,229,279, respectively (Note 6) | | | - | | | 6,770,721 | |
| | | | | | | | |
| Total Liabilities | | | 14,429,697 | | | 22,520,504 | |
| | | | | | | | |
| Going Concern (Note 2) | | | | | | | |
| Contingency (Note 8) | | | | | | | |
| | | | | | | | |
| Stockholders’ Equity | | | | | | | |
| | | | | | | | |
| Common Stock (Note 8) | | | | | | | |
| Authorized: 100,000,000 shares, par value $0.00001 Issued: 67,426,043 shares (2008 – 46,794,530 shares) | | | 674 | | | 468 | |
| | | | | | | | |
| Additional Paid-In Capital (Note 8) | | | 80,633,966 | | | 57,852,277 | |
| | | | | | | | |
| Warrants (Note 9) | | | 4,237,100 | | | - | |
| | | | | | | | |
| Deficit | | | (52,007,307 | ) | | (47,794,059 | ) |
| | | | | | | | |
| Total Stockholders’ Equity | | | 32,864,433 | | | 10,058,686 | |
| | | | | | | | |
| Total Liabilities and Stockholders’ Equity | | | 47,294,130 | | | 32,579,190 | |
The accompanying notes are an integral part of these consolidated financial statements
Triangle Petroleum Corporation
Consolidated Statements of Operations
(Expressed in U.S. dollars)
(Unaudited)
| | | Three Months Ended July 31, | | Three Months Ended July 31, | | Six Months Ended July 31, | | Six Months Ended July 31, | |
| | | 2008 | | 2007 | | 2008 | | 2007 | |
| | $ | | $ | | $ | | $ | |
| | | | | | | | | | |
| Revenue, net of royalties | | | 107,831 | | | 124,636 | | | 259,950 | | | 193,226 | |
| | | | | | | | | | | | | | |
| Operating Expenses | | | | | | | | | | | | | |
| | | | | | | | | | | | | | |
| Oil and gas production | | | 4,154 | | | 71,493 | | | 63,381 | | | 73,802 | |
| Depletion, depreciation and accretion | | | 23,268 | | | 135,721 | | | 93,567 | | | 211,189 | |
| Depreciation – property and equipment | | | 9,988 | | | 14,834 | | | 19,747 | | | 21,614 | |
| General and administrative | | | 1,142,684 | | | 1,331,407 | | | 2,343,402 | | | 3,563,901 | |
| Impairment of oil and gas properties | | | - | | | 3,891,403 | | | - | | | 3,891,403 | |
| Gain on sale of assets | | | (10,705 | ) | | - | | | (10,705 | ) | | - | |
| Foreign exchange loss | | | 28,595 | | | 163,752 | | | 24,589 | | | 159,746 | |
| | | | | | | | | | | | | | |
| | | | 1,197,984 | | | 5,608,610 | | | 2,533,981 | | | 7,921,655 | |
| | | | | | | | | | | | | | |
| Loss from Operations | | | (1,090,153 | ) | | (5,483,974 | ) | | (2,274,031 | ) | | (7,728,429 | ) |
| | | | | | | | | | | | | | |
| Other Income (Expenses) | | | | | | | | | | | | | |
| | | | | | | | | | | | | | |
| Accretion of discounts on convertible debentures | | | (791,042 | ) | | (2,267,808 | ) | | (2,006,400 | ) | | (4,608,534 | ) |
| Amortization of debt issue costs | | | (73,056 | ) | | (113,645 | ) | | (182,640 | ) | | (231,353 | ) |
| Loss on debt extinguishment | | | (160,662 | ) | | - | | | (160,662 | ) | | - | |
| Interest expense | | | (211,353 | ) | | (306,397 | ) | | (465,333 | ) | | (688,748 | ) |
| Interest income | | | 65,014 | | | 203,243 | | | 82,229 | | | 395,666 | |
| Unrealized gain (loss) on fair value of derivatives | | | (125,741 | ) | | 2,087,874 | | | 793,589 | | | 3,555,414 | |
| | | | | | | | | | | | | | |
| Total Other Expenses | | | (1,296,840 | ) | | (396,733 | ) | | (1,939,217 | ) | | (1,577,555 | ) |
| | | | | | | | | | | | | | |
| Net Loss for the Period | | | (2,386,993 | ) | | (5,880,707 | ) | | (4,213,248 | ) | | (9,305,984 | ) |
| | | | | | | | | | | | | | |
| Net Loss Per Share – Basic and Diluted | | | (0.04 | ) | | (0.16 | ) | | (0.08 | ) | | (0.28 | ) |
| | | | | | | | | | | | | | |
| Weighted Average Number of Shares Outstanding – Basic and Diluted | | | 60,673,000 | | | 36,019,000 | | | 54,126,000 | | | 33,344,000 | |
The accompanying notes are an integral part of these consolidated financial statements
Triangle Petroleum Corporation
Statement of Stockholders’ Equity
Period from January 31, 2008 to July 31, 2008
(Expressed in U.S. dollars)
(Unaudited)
| | | | | Additional | | | | | | | |
| | | Common Stock | | Paid-in | | | | | | | |
| | | Shares | | Amount | | Capital | | Warrants | | Deficit | | Total | |
| | | # | | $ | | $ | | $ | | $ | | $ | |
| | | | | | | | | | | | | | |
| Balance – January 31, 2008 | | | 46,794,530 | | | 468 | | | 57,852,277 | | | - | | | (47,794,059 | ) | | 10,058,686 | |
| | | | | | | | | | | | | | | | | | | | |
| Issuance of common stock for cash pursuant to private placement at $1.40 per unit in June 2008 | | | 18,257,500 | | | 183 | | | 21,323,217 | | | 4,237,100 | | | - | | | 25,560,500 | |
| | | | | | | | | | | | | | | | | | | | |
| Share issuance costs | | | - | | | - | | | (2,022,587 | ) | | - | | | - | | | (2,022,587 | ) |
| | | | | | | | | | | | | | | | | | | | |
| Issuance of common stock on conversion of convertible debentures at a weighted average price of $0.88 per share | | | 2,374,013 | | | 23 | | | 2,100,117 | | | - | | | - | | | 2,100,140 | |
| | | | | | | | | | | | | | | | | | | | |
| Fair value of conversion features of convertible debentures converted | | | - | | | - | | | 1,039,906 | | | - | | | - | | | 1,039,906 | |
| | | | | | | | | | | | | | | | | | | | |
| Stock based compensation | | | - | | | - | | | 341,036 | | | - | | | - | | | 341,036 | |
| | | | | | | | | | | | | | | | | | | | |
| Net loss for the period | | | - | | | - | | | - | | | - | | | (4,213,248 | ) | | (4,213,248 | ) |
| | | | | | | | | | | | | | | | | | | | |
| Balance – July 31, 2008 | | | 67,426,043 | | | 674 | | | 80,633,966 | | | 4,237,100 | | | (52,007,307 | ) | | 32,864,433 | |
Triangle Petroleum Corporation
Statement of Stockholders’ Equity
Period from January 31, 2007 to July 31, 2007
(Expressed in U.S. dollars)
(Unaudited)
| | | | | | | Additional | | | | | |
| | | Common Stock | | Paid-in | | | | | |
| | | Shares | | Amount | | Capital | | Deficit | | Total | |
| | | # | | $ | | $ | | $ | | $ | |
| | | | | | | | | | | | |
| Balance – January 31, 2007 | | | 22,475,866 | | | 225 | | | 13,088,795 | | | (18,193,312 | ) | | (5,104,292 | ) |
| | | | | | | | | | | | | | | | | |
| Issuance of common stock for cash pursuant to private placement at $1.40 per unit in June 2008 | | | 10,412,000 | | | 104 | | | 20,823,896 | | | - | | | 20,824,000 | |
| | | | | | | | | | | | | | | | | |
| Share issuance costs | | | - | | | - | | | (1,515,994 | ) | | - | | | (1,515,994 | ) |
| | | | | | | | | | | | | | | | | |
| Issuance of common stock on conversion of convertible debentures at a weighted average price of $1.31 per share | | | 4,175,736 | | | 41 | | | 5,499,959 | | | - | | | 5,500,000 | |
| | | | | | | | | | | | | | | | | |
| Fair value of conversion features of convertible debentures converted | | | - | | | - | | | 1,490,181 | | | - | | | 1,490,181 | |
| | | | | | | | | | | | | | | | | |
| Investor relation services | | | 50,000 | | | 1 | | | 108,499 | | | - | | | 108,500 | |
| | | | | | | | | | | | | | | | | |
| Stock based compensation | | | - | | | - | | | 2,045,114 | | | - | | | 2,045,114 | |
| | | | | | | | | | | | | | | | | |
| Net loss for the period | | | - | | | - | | | - | | | (9,305,984 | ) | | (9,305,984 | ) |
| | | | | | | | | | | | | | | | | |
| Balance – July 31, 2007 | | | 37,113,602 | | | 371 | | | 41,540,450 | | | (27,499,296 | ) | | 14,041,525 | |
The accompanying notes are an integral part of these consolidated financial statements
Triangle Petroleum Corporation
Consolidated Statements of Cash Flows
(Expressed in U.S. dollars)
(Unaudited)
| | | Three Months Ended July 31, | | Three Months Ended July 31, | | Six Months Ended July 31, | | Six Months Ended July 31, | |
| | | 2008 | | 2007 | | 2008 | | 2007 | |
| | $ | | $ | | $ | | $ | |
| Operating Activities | | | | | | | | | | | | | |
| Net loss | | | (2,386,993 | ) | | (5,880,707 | ) | | (4,213,248 | ) | | (9,305,984 | ) |
| | | | | | | | | | | | | | |
| Adjustments to reconcile net loss to net cash provided by (used in) operating activities: | | | | | | | | | | | | | |
| | | | | | | | | | | | | | |
| Accretion of discounts on convertible debentures | | | 791,042 | | | 2,267,808 | | | 2,006,400 | | | 4,608,534 | |
| Amortization of debt issue costs | | | 73,056 | | | 113,645 | | | 182,640 | | | 231,353 | |
| Depletion, depreciation and accretion | | | 23,268 | | | 135,721 | | | 93,567 | | | 211,189 | |
| Depreciation – property and equipment | | | 9,988 | | | 14,834 | | | 19,747 | | | 21,614 | |
| Impairment of oil and gas properties | | | - | | | 3,891,403 | | | - | | | 3,891,403 | |
| Stock-based compensation | | | 227,756 | | | 528,078 | | | 341,036 | | | 2,153,614 | |
| Gain on sale of assets | | | (10,705 | ) | | - | | | (10,705 | ) | | - | |
| Loss on debt extinguishment | | | 160,662 | | | - | | | 160,662 | | | - | |
Unrealized loss (gain) on fair value of derivatives | | | 125,741 | | | (2,087,874 | ) | | (793,589 | ) | | (3,555,414 | ) |
| | | | | | | | | | | | | | |
| Asset retirement costs | | | (200,937 | ) | | - | | | (371,637 | ) | | - | |
| | | | | | | | | | | | | | |
| Changes in operating assets and liabilities | | | | | | | | | | | | | |
| | | | | | | | | | | | | | |
| Prepaid expenses | | | 102,925 | | | (1,793,853 | ) | | 54,639 | | | (49,853 | ) |
| Other receivables | | | 1,221,540 | | | 553,078 | | | 1,130,437 | | | (45,633 | ) |
| Accounts payable | | | (502,391 | ) | | 2,348,267 | | | (297,740 | ) | | 209,412 | |
| Accrued interest on convertible debentures | | | (1,087,957 | ) | | (321,663 | ) | | (833,977 | ) | | 60,688 | |
| Accrued liabilities | | | (77,896 | ) | | 690,346 | | | (30,404 | ) | | 224,234 | |
| | | | | | | | | | | | | | |
| Cash Provided by (Used in) Operating Activities | | | (1,530,901 | ) | | 459,083 | | | (2,562,172 | ) | | (1,344,843 | ) |
| | | | | | | | | | | | | | |
| Investing Activities | | | | | | | | | | | | | |
| Purchase of property and equipment | | | (2,216 | ) | | (23,021 | ) | | (3,941 | ) | | (31,676 | ) |
| Oil and gas property expenditures | | | (1,382,851 | ) | | (4,791,854 | ) | | (3,735,909 | ) | | (7,426,729 | ) |
| Cash advances from partners, net | | | 2,567,084 | | | - | | | 2,567,084 | | | - | |
| Proceeds received from sale of oil and pas properties | | | 3,908,998 | | | 983,902 | | | 3,908,998 | | | 983,902 | |
| | | | | | | | | | | | | | |
| Cash Provided by (Used in) Investing Activities | | | 5,091,015 | | | (3,830,973 | ) | | 2,736,232 | | | (6,474,503 | ) |
| | | | | | | | | | | | | | |
| Financing Activities | | | | | | | | | | | | | |
Proceeds from issuance of common stock | | | 25,560,500 | | | - | | | 25,560,500 | | | 20,824,000 | |
| Share issuance costs | | | (2,022,587 | ) | | - | | | (2,022,587 | ) | | (1,515,994 | ) |
| Convertible debenture repayment | | | (4,800,000 | ) | | - | | | (4,800,000 | ) | | - | |
| | | | | | | | | | | | | | |
| Cash Provided by Financing Activities | | | 18,737,913 | | | - | | | 18,737,913 | | | 19,308,006 | |
| | | | | | | | | | | | | | |
| Increase (Decrease) in Cash and Cash Equivalents | | | 22,298,027 | | | (3,371,890 | ) | | 18,911,973 | | | 11,488,660 | |
| | | | | | | | | | | | | | |
| Cash and Cash Equivalents – Beginning of Period | | | 1,195,535 | | | 20,659,532 | | | 4,581,589 | | | 5,798,982 | |
| | | | | | | | | | | | | | |
| Cash and Cash Equivalents – End of Period | | | 23,493,562 | | | 17,287,642 | | | 23,493,562 | | | 17,287,642 | |
| | | | | | | | | | | | | | |
| Cash | | | | | | | | | 110,315 | | | 505,157 | |
| Cash equivalents | | | | | | | | | 23,383,247 | | | 16,782,485 | |
| Non-cash Investing and Financing Activities | | | | | | | | | | | | | |
| | | | | | | | | | | | | | |
| Common stock issued for conversion of debentures | | | 625,000 | | | 3,600,000 | | | 2,100,140 | | | 5,500,000 | |
The accompanying notes are an integral part of these consolidated financial statements
Triangle Petroleum Corporation
Notes to the Consolidated Financial Statements
(Expressed in U.S. dollars, except as noted)
(Unaudited)
Triangle Petroleum Corporation, together with its consolidated subsidiaries (“Triangle” or the “Company”), is an independent oil and gas company focused primarily on the acquisition, exploration and development of resource properties consisting mainly of shale gas reserves. Our primary exploration and development acreage is located in the Horton Bluff formation of the Maritimes Basin in Canada and in the Fayetteville Shale of the Arkoma Basin in the United States. We have producing properties in the Fort Worth Basin and in the Alberta Deep Basin.
The accompanying consolidated financial statements of Triangle have been prepared in accordance with generally accepted accounting principals ("GAAP") in the U.S. In the opinion of management, the accompanying financial statements reflect all adjustments necessary to present fairly our financial position at July 31, 2008 and our operations and cash flows for the three and six month periods ended July 31, 2008 and 2007. In preparing the accompanying financial statements, management has made certain estimates and assumptions that affect reported amounts in the financial statements and disclosures of contingencies. Actual results may differ from those estimates. Certain amounts presented in prior period financial statements have been reclassified for consistency with current period presentation. The results for interim periods are not necessarily indicative of annual results.
Certain disclosures have been condensed or omitted from these financial statements. Accordingly, they should be read along with the consolidated financial statements and notes thereto included in our Annual Report on Form 10-K for the year ended January 31, 2008. In the prior year, the Company was accounted for as an exploration stage entity. Starting in the fourth quarter of fiscal 2008, the Company was no longer accounted for as an exploration stage entity.
Certain reclassifications have been made to the prior period’s financial statements to conform to the current period’s presentation.
The Company is primarily engaged in the acquisition, exploration and development of oil and gas resource properties. The Company will have to raise additional funds through equity or debt offerings, dispositions of assets or other means to finance the repayment of the convertible debentures (if the holders do not elect to convert), to finance commitments to continue to earn lands related to farm-out agreements, to fund general and administrative expenses and to complete the exploration and development phase of its programs. While the Company has been successful in raising funds in the past, there can be no assurance that it will be able to do so in the future. The continuation of the Company as a going concern is dependent upon its ability to obtain necessary additional funds to continue operations and to determine the existence, discovery and successful exploitation of economically recoverable reserves in its resource properties, confirmation of the Company’s interests in the underlying properties, and the attainment of profitable operations.
Failure to obtain additional financing will result in the going concern assumption being inappropriate and adjustments would be required to the carrying values of assets and liabilities, the reported revenues and expenses, and the balance sheet classifications used.
(a) Recently Adopted Accounting Pronouncements
In September 2006, the Financial Accounting Standards Board (“FASB”) issued Statement of Financial Accounting Standards ("SFAS") No. 157, "Fair Value Measurements” ("SFAS 157"). SFAS 157 defines fair value, establishes a framework for measuring fair value in generally accepted accounting principles, and expands disclosures about fair value measurements. On February 12, 2008, the FASB issued Staff Position No. FAS 157-2 ("FSP 157-2") which proposed a one year deferral for the implementation of SFAS 157 for non-financial assets and liabilities that are recognized or disclosed at fair value on a nonrecurring basis (less frequent than annually).
On February 1, 2008 Triangle elected to implement SFAS 157 with the one-year deferral for certain non-financial assets and liabilities. Beginning February 1, 2009, the Company will adopt the provisions for non-financial assets and non-financial liabilities that are not required or permitted to be measured at fair value on a recurring basis. We are in the process of evaluating this portion of the standard and have not yet determined the impact that it will have on our financial statements upon adoption in 2009.
SFAS 157 (as amended), defines fair value, establishes a framework for measuring fair value, outlines a fair value hierarchy based on inputs used to measure fair value and enhances disclosure requirements for fair value measurements. Fair value is defined as the price at which an asset could be exchanged in a current transaction between knowledgeable, willing parties. A liability’s fair value is defined as the amount that would be paid to transfer the liability to a new obligor, not the amount that would be paid to settle the liability with the creditor. Where available, fair value is based on observable market prices or parameters or derived from such prices or parameters. Where observable prices or inputs are not available, use of unobservable prices or inputs are used to estimate the current fair value, often using an internal valuation model. These valuation techniques involve some level of management estimation and judgment, the degree of which is dependent on the item being valued.
Triangle Petroleum Corporation
Notes to the Consolidated Financial Statements
(Expressed in U.S. dollars, except as noted)
(Unaudited)
| 3. | Accounting Policies (continued) |
Beginning February 1, 2008, assets and liabilities recorded at fair value in the consolidated balance sheets are categorized based upon the level of judgment associated with the inputs used to measure their fair value. Hierarchical levels—defined by SFAS 157 and directly related to the amount of subjectivity associated with the inputs to fair valuation of these assets and liabilities—are as follows:
| | Level I—Inputs are unadjusted, quoted prices in active markets for identical assets or liabilities at the measurement date. |
| | Level II—Inputs (other than quoted prices included in Level I) are either directly or indirectly observable for the asset or liability through correlation with market data at the measurement date and for the duration of the instrument’s anticipated life. |
| | Level III—Inputs reflect management’s best estimate of what market participants would use in pricing the asset or liability at the measurement date. Consideration is given to the risk inherent in the valuation technique and the risk inherent in the inputs to the model. |
The fair value of the Company’s derivative liabilities were measured using Level III inputs. The significant unobservable inputs to the fair value measurement include estimates of volatility of the share price and term of the contract. The inputs are calculated based on historical data as well as current estimated costs. See Note 7.
The estimated fair values of derivative liabilities, being the conversion feature of the December 8, 2005 convertible debenture, included in the consolidated balance sheets at July 31, 2008 and January 31, 2008 are summarized below. The decrease in the derivative liability from January 31, 2008 to July 31, 2008 is primarily attributable to the settlement of derivatives as a result of the repayment of the underlying debentures.
| | | July 31, 2008 $ | | January 31, 2008 $ | |
| | | Significant Unobservable Inputs (Level III) | | Significant Unobservable Inputs (Level III) | |
| | | | | | |
| Derivative liability – conversion feature | | | - | | | 3,262,846 | |
In February 2007, the FASB issued SFAS No. 159, “The Fair Value Option for Financial Assets and Financial Liabilities – Including an Amendment of FASB Statement No. 115”. This statement permits entities to choose to measure many financial instruments and certain other items at fair value. Most of the provisions of SFAS No. 159 apply only to entities that elect the fair value option. However, the amendment to SFAS No. 115 “Accounting for Certain Investments in Debt and Equity Securities” applies to all entities with available-for-sale and trading securities. Effective February 1, 2008, the Company adopted SFAS No. 159. The adoption of this statement did not have a material effect on the Company's current financial statements.
(b) Recently Issued Accounting Pronouncements
In December 2007, the Financial Accounting Standard Board (FASB) revised the Statement of Financial Accounting Standard (SFAS) No. 141, “Business Combinations”. SFAS No. 141R requires an acquirer to be identified for all business combinations and applies the same method of accounting for business combinations – the acquisition method – to all transactions. In addition, transaction costs associated with acquisitions are required to be expensed. The revised statement is effective to business combinations in years beginning on or after December 31, 2008. The adoption of this statement will impact business combinations, if any, after the effective date.
In December 2007, the FASB issued SFAS No. 160, “Non-controlling Interests in Consolidated Financial Statements”. SFAS no. 160 requires the Company to report non-controlling interest in subsidiaries as equity in the consolidated financial statements; and all transactions between equity and non controlling interests as equity. SFAS No. 160 is effective for the Company commencing on February 1, 2009 and it will not impact the Company's current financial statements.
Triangle Petroleum Corporation
Notes to the Consolidated Financial Statements
(Expressed in U.S. dollars, except as noted)
(Unaudited)
| 3. | Accounting Policies (continued) |
In March 2008, the FASB has issued SFAS No. 161, “Disclosures about Derivative Instruments and Hedging Activities”, which requires disclosures about how and why an entity uses derivative instruments, how derivative instruments and related hedged items are accounted for under SFAS No. 133, and how derivative instruments and related hedged items affect an entity’s financial position, financial performance and cash flows. SFAS No. 161 is effective on February 1, 2009 and is not anticipated to significantly effect the Company's financial statements.
In May 2008, the FASB issued SFAS No. 162, “The Hierarchy of Generally Accepted Accounting Principles. SFAS No. 162 identifies the sources of accounting principles and the framework for selecting the principles to be used in the preparation of financial statements of nongovernmental entities that are presented in conformity with GAAP. SFAS No. 162 directs the GAAP hierarchy to the entity, not the independent auditors, as the entity is responsible for selecting accounting principles for financial statements that are presented in conformity with GAAP. SFAS No. 162 is effective 60 days following the SEC’s approval of the Public Company Accounting Oversight Board amendments to remove the GAAP hierarchy from the auditing standards. SFAS No. 162 is not expected to have a material impact on the Company’s financial statements.
In May 2008, the FASB directed the FASB Staff to issue FSP APB 14-1, Accounting for Convertible Debt Instruments That May Be Settled in Cash upon Conversion (Including Partial Cash Settlement) (FSP APB 14-1). FSP APB 14-1 applies to convertible debt instruments that, by their stated terms, may be settled in cash (or other assets) upon conversion, including partial cash settlement of the conversion option. FSP APB 14-1 requires bifurcation of the instrument into a debt component that is initially recorded at fair value and an equity component. The difference between the fair value of the debt component and the initial proceeds from issuance of the instrument is recorded as a component of equity. The liability component of the debt instrument is accreted to par using the effective yield method; accretion is reported as a component of interest expense. The equity component is not subsequently re-valued as long as it continues to qualify for equity treatment. FSP APB 14-1 is effective for the Company on February 1, 2009. Early adoption is not permitted. The Company is evaluating the impact of adopting FSP APB 14-1 on the Company’s financial statements.
The Company follows the full cost method of accounting for oil and gas operations whereby all costs of exploring for and developing oil and gas reserves are initially capitalized on a country-by-country (cost center) basis. Capitalized costs, less estimated salvage value, are depleted using the units-of-production method whereby historical costs and future development costs are amortized over the total estimated proved reserves. Costs of acquiring and evaluating unproven properties and major development projects are initially excluded from the depletion and depreciation calculation until it is determined whether or not proved reserves can be assigned to such properties. These costs are assessed periodically to ascertain whether impairment has occurred (i.e., "impairment tests”). There were no impairment charges in either the first or second quarter of fiscal 2009. All of the Company’s oil and gas properties are located in the United States and Canada. The following table summarizes information regarding the Company's oil and gas acquisition, exploration and development activities:
| | | Costs | | Accumulated Depletion | | Net Book | |
| | | Opening | | Additions | | Dispositions | | Closing | | Opening | | Depletion | | Loss (Gain) | | Closing | | Value | |
| | | $ | | $ | | $ | | $ | | $ | | $ | | | | $ | | $ | |
| | | | | | | | | | | | | | | | | | | | |
Proved Properties | | | 12,886,510 | | | 51,625 | | | (164,985 | ) | | 12,773,150 | | | 12,472,601 | | | 51,028 | | | (40,710 | ) | | 12,482,919 | | | 290,231 | |
| Unproven Properties | | | 34,397,768 | | | 1,691,966 | | | (3,744,013 | ) | | 32,345,721 | | | 9,832,728 | | | - | | | 30,005 | | | 9,862,733 | | | 22,482,988 | |
| | | | | | | | | | | | | | | | | | | | | | | | | | | | | |
| Total | | | 47,284,278 | | | 1,743,591 | | | (3,908,998 | ) | | 45,118,871 | | | 22,305,329 | | | 51,028 | | | (10,705 | ) | | 22,345,652 | | | 22,773,219 | |
Proved Properties
The Company's proved acquisition and exploration costs were distributed in the following geographic areas:
| | | July 31, 2008 $ | | January 31, 2008 $ | |
| | | | | | |
| Alberta – Canada | | | 290,231 | | | 324,162 | |
| Barnett Shale (Texas) – United States | | | - | | | 89,747 | |
| Total proved acquisition and exploration costs | | | 290,231 | | | 413,909 | |
In Canada, depletion and depreciation expense for the three and six month periods ended July 31, 2008 was $18,200 and $45,106 (2007 - $47,224 and $59,753), respectively.
Triangle Petroleum Corporation
Notes to the Consolidated Financial Statements
(Expressed in U.S. dollars, except as noted)
(Unaudited)
| 4. | Oil and Gas Properties (Continued) |
In the U.S., depletion and depreciation expense for the three and six month periods ended July 31, 2008 was $nil and $5,922 (2007 - $89,822 and $151,435), respectively. In June 2008, the Company sold its interests in two Barnett shale wells for gross proceeds of $164,985. The net book value of the US proven property costs at the time of the sale was $131,820 and the related properties had an asset retirement obligation of $7,545. As such the Company recorded a gain on the sale of assets of $40,710.
Unproven Properties
All of the Company’s unproven properties are not subject to depletion. The Company's unproven acquisition and exploration costs were distributed in the following geographic areas:
| | | July 31, 2008 $ | | January 31, 2008 $ | |
| | | | | | |
| Windsor Block of Maritimes Basin (Nova Scotia) | | | 14,083,421 | | | 15,441,144 | |
| Beech Hill Block of Maritimes Basin (New Brunswick) | | | 63,309 | | | 21,975 | |
| Western Canadian Shale (Alberta and B.C.) | | | 25,387 | | | - | |
| Canada | | | 14,172,117 | | | 15,463,119 | |
| | | | | | | | |
| Fayetteville Shale (Arkansas) | | | 8,310,871 | | | 8,289,901 | |
| Rocky Mountains (Colorado, Montana, Wyoming) | | | - | | | 812,020 | |
| United States | | | 8,310,871 | | | 9,101,921 | |
| | | | | | | | |
| Total unproven acquisition and exploration costs | | | 22,482,988 | | | 24,565,040 | |
| | o | In Canada, $14,172,117 of unproven property costs were excluded from costs subject to depletion which relate to Canadian shale gas exploration costs mainly in the Windsor Block of the Maritimes Basin. The Company anticipates that these costs will be subject to depletion in fiscal 2011, when the Company anticipates having pipelines built and commissioned to market potential gas from the Windsor Block. |
| | o | In July 2008, the Company received cash of $2,943,510 for a partner’s share of its 30% working interest in exploration costs associated with the Windsor Block of Nova Scotia. Also, the related properties had an asset retirement obligation that was reduced by $129,884 for the partners share of its 30% working interest. |
| | o | In the U.S., $8,310,871 of unproven property costs were excluded from costs subject to depletion which relate to Fayetteville Shale gas acquisition costs. The Company anticipates selling its acreage position related to these costs in fiscal 2009. |
| | o | In June 2008, the company sold its 25% working interest in 9,692 acres in the Phat City area of Montana (Rocky Mountains project) for cash of $800,503. The net book value of the Rocky Mountains project at the time of the sale was $830,508, which related to U.S. Rocky Mountain leasehold acquisition costs. As such the Company recorded a loss on the sale of assets of $30,005. |
| 5. | Asset Retirement Obligations |
The estimated fair value of the future costs associated with dismantlement, abandonment and restoration of oil and natural gas properties is recorded when a liability is incurred, generally through a lease construction or acquisition or completion of a well. The current estimated costs are escalated at an inflation rate and discounted to present value at a credit adjusted risk-free rate over the estimated economic life of the properties. Such costs are capitalized as part of the basis of the related asset and are depleted as part of the applicable full cost pool. The associated liability is recorded initially as a long-term liability. Subsequent adjustments to the initial asset and liability are recorded to reflect revisions to estimated future cash flow requirements. In addition, the liability is adjusted to reflect accretion expense as well as settlements during the period.
A reconciliation of the changes in the asset retirement obligations is as follows:
| | | Six Months July 31, 2008 $ | | Six Months July 31, 2007 $ | |
| | | | | | |
| Balance, beginning of period | | | 1,003,353 | | | 90,913 | |
| Liabilities incurred | | | 45,450 | | | 153,264 | |
| Liabilities settled as part of dispositions | | | (137,429 | ) | | - | |
| Liabilities settled in cash | | | (371,637 | ) | | - | |
| Accretion | | | 42,539 | | | 30,837 | |
| | | | | | | | |
| Balance, end of period | | | 582,276 | | | 275,014 | |
Triangle Petroleum Corporation
Notes to the Consolidated Financial Statements
(Expressed in U.S. dollars, except as noted)
(Unaudited)
| Agreement Date | | December 8, 2005 $ | | December 28, 2005 $ | | Total $ | |
| | | | | | | | |
| Balance, January 31, 2008 | | | 4,778,271 | | | 6,770,721 | | | 11,548,992 | |
| Converted | | | (2,100,140 | ) | | - | | | (2,100,140 | ) |
| Repaid | | | (4,000,000 | ) | | - | | | (4,000,000 | ) |
| Accretion - expensed | | | 815,052 | | | 1,191,348 | | | 2,006,400 | |
| Accretion - settled | | | 506,817 | | | - | | | 506,817 | |
| Balance, July 31, 2008 | | | - | | | 7,962,069 | | | 7,962,069 | |
| Amount classified as current | | | - | | | 7,962,069 | | | 7,962,069 | |
| Face value at July 31, 2008 | | | - | | | 10,000,000 | | | 10,000,000 | |
| Interest rate | | | 5.0 | % | | 7.5 | % | | | |
On June 5, 2008, the Company repaid $4,000,000 of convertible debentures that were due to mature on December 8, 2008 plus an early redemption fee of $800,000 and accrued interest of $1,299,860. The carrying value of the debentures at the time of repayment, including the conversion feature of the debenture that was accounted for as a derivative, was $4,639,338, which is equal to the face value of $4,000,000, less unamortized discounts of $506,817 and deferred financing costs of $283,196, plus the derivative liability of $1,429,351. The Company paid $4,800,000 on settlement ($4,000,000 face value plus a 20% early redemption fee of $800,000); therefore a $160,662 loss was recorded on the extinguishment of the debenture.
The Company was required to bifurcate and separately account for the embedded conversion feature contained in the December 8, 2005 convertible debenture as a derivative. The Company was required to record the derivative at the estimated fair value on each balance sheet date with changes in fair values reflected in the statement of operations.
| | | Conversion Feature Fair Value | |
| | | $ | |
| | | | |
| January 31, 2008 | | | 3,262,846 | |
| Conversion features settled on conversion | | | (1,039,906 | ) |
| Change in fair value | | | (793,589 | ) |
| Conversion features settled on repayment | | | (1,429,351 | ) |
| July 31, 2008 | | | - | |
The Company used the Black-Scholes valuation model to calculate the fair value of derivative liabilities. The following table shows the assumptions used in the calculation of the conversion feature in the December 8, 2005 convertible debenture.
| | | Strike Price | | Volatility | | Risk Free Rate | | Dividend Yield | | Term in Years | |
| | | | | | | | | | | | |
| Weighted Average Assumptions at: June 3, 2008 (repayment date) | | $ | 1.34 | | | 110.50 | % | | 1.99 | % | | – | | | 0.51 | |
| | | Shares | | Common Stock | | Additional Paid- In Capital | |
| | | | | $ | | $ | |
| January 31, 2008 | | | 46,794,530 | | | 468 | | | 57,852,277 | |
| Private Placement, net of share issuance costs of $2,022,587 | | | 18,257,500 | | | 183 | | | 19,300,630 | |
| Conversion of debentures | | | 2,374,013 | | | 23 | | | 3,140,023 | |
| Stock based compensation | | | | | | | | | 341,036 | |
| July 31, 2008 | | | 67,426,043 | | | 674 | | | 80,633,966 | |
Triangle Petroleum Corporation
Notes to the Consolidated Financial Statements
(Expressed in U.S. dollars, except as noted)
(Unaudited)
| 8. | Common Stock (Continued) |
During the six month period ended July 31, 2008, 2,374,013 shares were issued upon the conversion of convertible debentures in the amount of $2,100,140. The fair value of the conversion feature related to the converted debentures was $1,039,906, which was transferred from the derivative liability to additional paid-in capital upon conversion.
On June 3, 2008, 18,257,500 units were issued in a private placement for gross proceeds of $25,560,500. The net proceeds after deducting expenses was $23,537,913. The Company paid the placement agents of the offering a cash fee of 7% of the gross proceeds of the offering. Each unit was priced at $1.40 per unit and consists of one common stock (relative fair value of $19,300,630 or $1.168 per share) and one-half share purchase warrant (relative fair value of $4,237,100 or $0.232 per unit – see Note 9). One full warrant can be exercised into one share of common stock for a period of two years at a price of $2.25 per share. Pursuant to the terms of the sale, the Company was required, on a best efforts basis, to file a registration statement with the SEC, and to cause such registration statement to be declared effective by the SEC, within 150 days after closing, to permit the public resale of the shares underlying the warrants. The registration statement was declared effective by the SEC on July 14, 2008. Also, pursuant to the terms of the sale, the Company is required, on a best efforts basis, to list the Company’s shares on the Toronto Stock Exchange (which includes the TSX Venture Exchange) on or before December 31, 2008. Failure to list the shares for trading by such date results in a payment by the Company, pro rata to the purchasers, of a penalty equal to 2% of the gross proceeds of the offering for each month or partial month until the shares are listed for trading on the Toronto Stock Exchange (which includes the TSX Venture Exchange), not to exceed 10% in the aggregate.
As at July 31, 2008, the Company had 9,128,750 warrants outstanding that can be exercised into 4,564,375 of common stock at a price of $2.25 per share, which expire on June 3, 2010. The warrants were granted on June 3, 2008, at which time they had a relative fair value compared to the common stock issued of $4,237,100.
The weighted average grant date fair value of stock options granted during the three and six month periods ended July 31, 2008 was $0.4618 and $0.7018, respectively. No stock options were exercised during the three and six month periods ended July 31, 2008. During the three and six month periods ended July 31, 2008, the Company recorded stock-based compensation of $227,756 and $341,036, respectively, as general and administrative expense.
A summary of the Company’s stock option activity is as follows:
| | | Number of Options | | Weighted Average Exercise Price $ | | Aggregate Intrinsic Value $ | |
| | | | | | | | |
| Outstanding, January 31, 2008 | | | 2,580,000 | | | 2.54 | | | | |
| | | | | | | | | | | |
| Granted | | | 1,225,000 | | | 1.55 | | | | |
| Forfeited | | | (220,000 | ) | | 3.33 | | | | |
| Outstanding, July 31, 2008 | | | 3,585,000 | | | 2.15 | | | | |
| Exercisable, July 31, 2008 | | | 1,725,000 | | | 2.56 | | | | |
The weighted average remaining contractual life of stock options outstanding as of July 31, 2008 was 3.89 years.
The fair value of the options granted during the quarter was estimated on the date of grant using the Black-Scholes option pricing model with the following weighted average assumptions:
| | | Three Months Ended July 31, 2008 | | Six Months Ended July 31, 2008 | |
| | | | | | |
| Expected dividend yield | | | 0 | % | | 0 | % |
| Expected volatility | | | 80 | % | | 79 | % |
| Expected life (in years) | | | 3.5 | | | 3.5 | |
| Risk-free interest rate | | | 2.87 | % | | 2.71 | % |
| Estimated Forfeiture rate | | | 30 | % | | 30 | % |
As at July 31, 2008, there was $1,363,008 of total unrecognized compensation costs related to non-vested share-based compensation arrangements which are expected to be recognized over a weighted-average period of 18 months.
Triangle Petroleum Corporation
Notes to the Consolidated Financial Statements
(Expressed in U.S. dollars, except as noted)
(Unaudited)
| 10. | Stock Options (Continued) |
A summary of the status of the Company’s non-vested share options as of July 31, 2008, and changes during the six month period ended July 31, 2008, is presented below:
| Non-vested share options | | Number of Options | | Weighted-Average Grant-Date Fair Value $ | |
| | | | | | |
| Non-vested at January 31, 2008 | | | 1,250,000 | | | 0.93 | |
| Granted | | | 1,225,000 | | | 0.70 | |
| Vested | | | (615,000 | ) | | 1.08 | |
| Non-vested at July 31, 2008 | | | 1,860,000 | | | 0.73 | |
ITEM 2. MANAGEMENT'S DISCUSSION AND ANALYSIS OF FINANCIAL CONDITION AND RESULTS OF OPERATIONS
This Management's Discussion and Analysis of Financial Condition and Results of Operations includes a number of forward-looking statements that reflect Management's current views with respect to future events and financial performance. You can identify these statements by forward-looking words such as “may,” “will,” “expect,” “anticipate,” “believe,” “estimate” and “continue,” or similar words. Those statements include statements regarding the intent, belief or current expectations of us and members of our management team as well as the assumptions on which such statements are based. Prospective investors are cautioned that any such forward-looking statements are not guarantees of future performance and involve risk and uncertainties, and that actual results may differ materially from those contemplated by such forward-looking statements.
Readers are urged to carefully review and consider the various disclosures made by us in this report and in our other reports filed with the Securities and Exchange Commission. The following Management’s Discussion and Analysis of Financial Condition and Results of Operations of the Company should be read in conjunction with the Consolidated Financial Statements and notes related thereto included in this Quarterly Report on Form 10-Q. Important factors currently known to Management could cause actual results to differ materially from those in forward-looking statements. We undertake no obligation to update or revise forward-looking statements to reflect changed assumptions, the occurrence of unanticipated events or changes in the future operating results over time. We believe that our assumptions are based upon reasonable data derived from and known about our business and operations. No assurances are made that actual results of operations or the results of our future activities will not differ materially from our assumptions. Factors that could cause differences include, but are not limited to, expected market demand for our products, fluctuations in pricing for materials, and competition.
Overview
Prior to May 2005, we were known as Peloton Resources Inc., a mining exploration company. Peloton was actively searching for ore bodies containing gold in British Columbia. A consultant was hired to assess the economic viability of exploring for and developing gold reserves on Peloton’s properties. Based upon his report, Peloton decided to abandon all mining activities and to commence shifting towards an oil and gas exploration company. In connection with the shift in operational focus, we changed our name to Triangle Petroleum Corporation.
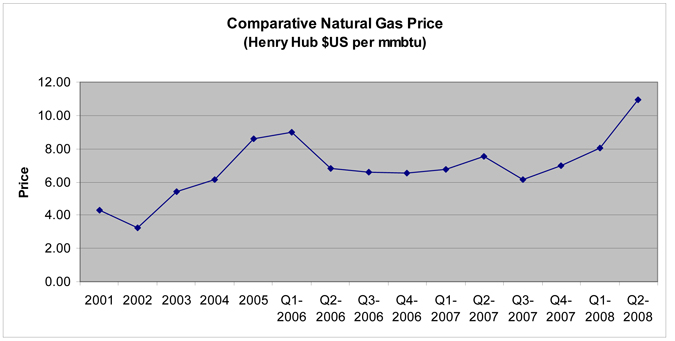
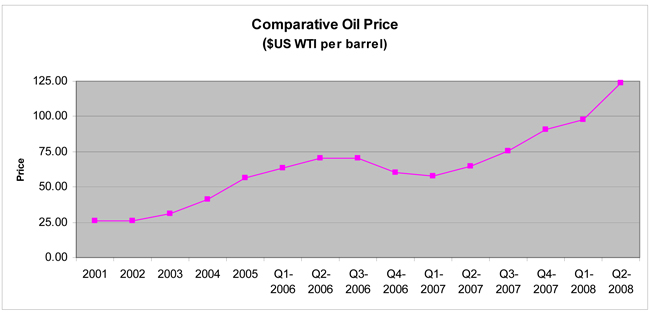
The changeover from a mining to an oil and gas exploration company has taken place over the past three years, during one of the strongest markets for oil and natural gas. The average monthly price for West Texas Intermediate (WTI) crude oil and natural gas (Henry Hub Nymex), currently, as compared to the past, is as follows:
Although these strong commodity prices have resulted in extremely competitive conditions for the supply of products and services for exploration companies, our outlook remains positive. Despite these strong fundamentals, it should be noted that significant short term fluctuations in North American natural gas prices have occurred based upon seasonal weather patterns and gas storage levels.
Plan of Operations
Our corporate strategy is to utilize our US shale gas experience to secure early stage shale gas projects in Canada. In conjunction with this strategy, we have screened and participated in various projects in North America with numerous potential joint venture partners. Based on activity to date, we have carefully selected and designated one project as core from our portfolio of projects based on our belief that it provides the best prospect for exploring for commercial quantities of gas. This core project is focused on a shale gas opportunity located in the Maritimes Basin of Eastern Canada. We intend to execute our operating plan in order to realize the full value of the land base that has been established in the Maritimes Basin. We are also in the process of evaluating a secondary shale gas project in Western Canada. Our remaining four project areas (Fayetteville Shale, Rocky Mountain Program, Barnett Shale and Alberta Deep Basin) are currently designated as non-core due to our desire to focus our limited manpower resources on one core and one secondary project.
Maritimes Basin – Eastern Canadian Shale Gas Project
During fiscal 2007 and early fiscal 2008, a multi-disciplined geoscience team screened prospective basins in Eastern Canada. The screening process included an assessment of the geological history for a given area, estimates of pressure and temperature profiles and a determination of the ability to fracture stimulate a prospective shale package. As a direct result of implementing this strategy, we executed two farm-in agreements with a Canadian company to pursue two shale gas opportunities in the Maritimes Basin in March and May of 2007.
Beech Hill Block (operated)
The first farm-in agreement was entered into in March 2007 and covers approximately 68,000 gross acres in the Moncton Sub-Basin of the Maritimes Basin located in the province of New Brunswick, Canada. We are entitled to earn a 70% working interest in the block subsequent to the acquisition and evaluation of a minimum $250,000 seismic program and then electing no later than December 31, 2008 to drill a test well by mid-2009. In June 2008, we entered into a partnership with Zodiac Exploration Corp. (“Zodiac”), a private Calgary-based exploration company. Zodiac agreed to incur the first $250,000 of costs for the seismic program for the option to earn a 25% working interest in the Beech Hill Block after paying 50% of the test well costs. Based upon Zodiac participating in the test well, we would retain a 45% working interest and would continue as operator.
During June and July 2008, approximately $280,000 gross ($30,000 net) expenditures were incurred to complete the acquisition phase of approximately 30 kilometers (18 miles) of 2-D seismic on the Beech Hill Block. We now have until the end of this year to interpret this data and decide whether or not to drill a well by mid-2009 in order to earn our 70% working interest (net 45% should Zodiac elect to participate). Zodiac has paid $250,000 towards the seismic program, thereby earning the option to participate in the drilling of the first potential well. The Beech Hill Block is covered by leases and licenses to search for oil and natural gas with the New Brunswick government which expire between February 2009 and June 2011.
Windsor Block (operated)
The second farm-in agreement was entered into in May 2007 and covers approximately 516,000 gross acres in the Windsor Sub-Basin of the Maritimes Basin located in the province of Nova Scotia, Canada. During fiscal 2008, we earned a 70% working interest in the block by drilling and completing a test well. In July 2008, our partner, Contact Exploration Inc. (“Contact”), elected to maintain their 30% working interest instead of converting to a 5% gross overriding royalty. Also in July 2008, we entered into a partnership with Zodiac to drill as many as six new delineation wells on the Windsor Block. The joint venture provides for an initial commitment by Zodiac to pay 50% of drilling costs, up to $7.5 million ($15 million gross), to earn a 12.5% working interest in the entire Windsor Block. Within thirty days of fulfilling this expenditure commitment, Zodiac has the option to commit another $7.5 million ($15 million gross) for an additional 12.5% working interest. Based upon Zodiac spending the entire $15 million, we would retain a 45% working interest and would continue as operator, and Zodiac would earn a 25% working interest in the Windsor Block.
From May 2007 to June 2008, we spent approximately gross $17.5 million (net $14.6 million) on the first stage of the Windsor Block exploration program, consisting of drilling and completing two vertical test wells (Kennetcook #1 and Kennetcook #2), a 2D and 3D seismic program and geological studies. Both of the vertical test wells, the seismic and geological studies have provided us with sufficient valuable technical information for us to believe that this is a significant shale gas resource project. In conjunction with Contact electing to maintain their 30% working interest instead of converting to a gross over-riding royalty in July 2008, Contact paid us 30% of the costs ($2.9 million) for the second well and seismic program that was expended in this first stage of the drilling program that was not a part of the earning parameter.
The Windsor Block is covered by an exploration agreement originally issued in 1999 with the Nova Scotia government which was due to expire on September 15, 2008. We are working with the Nova Scotia government to convert the exploration agreement into a production agreement. We submitted a development plan application in mid June 2008 which triggered an automatic six month extension of the exploration agreement while the Nova Scotia government reviews the application. If a production agreement is not granted, our right to explore for and develop oil and gas on this block would be forfeited.
In July 2008, we started the second stage of our Windsor Block program. We have contracted for Nabors rig #4, which has a depth rating of 3,600 meters (12,000 feet), for the balance of 2008 to drill the second stage wells that are expected to test the gas content and productivity of the Horton Bluff shales in various locations across the Windsor Block, and also to evaluate potential overlying conventional oil and gas reservoirs. The first vertical exploration well of this second stage, N-14-A, spud in mid July 2008. N-14-A is located approximately 5 miles north of our two original vertical test wells, Kennetcook #1 and Kennetcook #2. N-14-A has been drilled to a depth of 8,500 feet (2,600 meters). The well encountered Horton Bluff shale at a depth of 3,600 feet (1,100 meters), and drilled through a total of 4,900 feet (1,500 meters) of shale and interbedded sands before drilling was terminated in the lower Horton Bluff. An extensive suite of open hole logs has been obtained over the entire shale interval. Core was taken in the shale over a 60 foot (18 meter) interval at a depth of 5,800 feet (1,700 meters), and cuttings samples were retrieved throughout the drilling operation. Log and lab analyses are currently underway in Calgary and Houston. The highest gas response was observed while drilling the interval between 4,200 and 8,200 feet (1,300 to 2,500 meters). Preliminary analysis of the shales below 8,200 feet (2,500 meters) indicate higher thermal maturity and diminished gas response, so the decision was made to suspend drilling at 8,500 feet (2,600 meters) and to set 7-inch intermediate casing. By setting the large intermediate casing, we retain the option to either deepen or drill out horizontally, depending on formation evaluation and completion results in the vertical well.
Our second vertical exploration well in 2008, O-61-C, was spudded in late August 2008. This well is located approximately 14 miles (22 kilometers) west of N-14-A, and is located in a separate fault block from N-14-A, extending the trend from the two Kennetcook test wells we drilled in 2007. Planned total depth is 9,900 feet (3,000 meters). This well has been positioned using seismic to test the Horton Bluff shales and to evaluate potential conventional reservoirs in the uphole Windsor group.
Western Canadian Shale Program
We continue to actively evaluate various shale packages in Alberta and British Columbia. Our objective is to potentially secure an initial land position and to commence an exploration program next year. To date, we have participated in a multi-company geological study of the West Canadian Sedimentary Basin, reviewed this study, identified our own key technical indicators, correlated these key indicators back to the study and identified prospective shale areas. This follows the corporate strategy in the Maritimes Basin of utilizing our US shale gas experience to secure early stage shale gas projects in Canada.
Arkoma Basin Arkansas - Fayetteville Shale Program (non-core non-operated project)
Based upon escalating land prices in this basin and due to the lack of progress in accelerating the exploration program, we decided in late March 2008 to sell our 10,400 non-operated net acres. We are planning to sell this acreage in the most effective manner by assessing new industry activity and overall direct acreage sales. In June 2008, we and the operator of the lands entered into agreements with Tristone Capital to market the lands. The sale of this acreage is expected to be concluded before the end of 2008.
States of Colorado, Montana and Wyoming - Rocky Mountain Program (non-core non-operated project)
We drilled initial test wells in Colorado and Wyoming in 2006 and 2007 that were not successful in the primary targets. In June 2008, we sold our third prospect in this project, located in Northern Montana, consisting of 9,692 net acres of land, for proceeds of approximately $800,000.
Greater Fort Worth Basin Texas - Barnett Shale Program (non-core non-operated project)
In fiscal 2009, there is no exploration activity planned on this project. At the beginning of the year, we had six low working interest shale gas wells pipeline connected (5.75%-15% working interest), of which four were producing. The operator of two of the six wells commenced voluntary bankruptcy proceedings in the prior year. During 2008, through the trustee, we sold our interest in the two wells in an auction of the operator’s assets for proceeds of approximately $165,000. As such, we currently have four low working interest shale gas wells pipeline connected (11%-15% working interest), of which one well is currently producing.
Alberta Deep Basin - Western Canadian Conventional Program (non-core project)
In fiscal 2009, there is no exploration activity planned on this project. We are producing from two wells. The first well is located in the Kakwa Area and we have an 18% interest before payout (12% after payout). The second well is located in the Wapiti Area and we have an approximate 35% working interest.
Results of operations for the three and six months ended July 31, 2008 compared to the three and six months ended July 31, 2007
Daily Sales Volumes, Working Interest before royalties
| | | | | Three Months Ended July 31, 2008 | | Three Months Ended July 31 2007 | | Six Months Ended July 31, 2008 | | Six Months Ended July 31, 2007 | |
| Barnett Shale in Texas, USA | | | Mcfpd | | | 35 | | | 148 | | | 70 | | | 130 | |
| Deep Basin in Alberta, Canada | | | Mcfpd | | | 100 | | | 136 | | | 122 | | | 86 | |
| Total Company | | | Mcfpd | | | 135 | | | 284 | | | 192 | | | 216 | |
| Total Company | | | Boepd* | | | 23 | | | 47 | | | 32 | | | 36 | |
* Mcf converted into BOE on a basis of 6:1
Net Operating Results
| | | | | Three Months Ended July 31, 2008 | | Three Months Ended July 31, 2007 | | Six Months Ended July 31, 2008 | | Six Months Ended July 31, 2007 | |
| Volumes | | | Mcf | | | 12,250 | | | 26,025 | | | 34,905 | | | 39,090 | |
| Price | | | | | | 10.53 | | | 5.54 | | | 9.05 | | | 6.16 | |
| Revenue | | | | | $ | 128,939 | | $ | 144,297 | | $ | 315,962 | | $ | 240,941 | |
| Royalties | | | | | | 21,108 | | | 19,661 | | | 56,012 | | | 47,715 | |
| Revenue, net of royalties | | | | | | 107,831 | | | 124,636 | | | 259,950 | | | 193,226 | |
| Production expenses | | | | | | 4,154 | | | 71,493 | | | 63,381 | | | 73,802 | |
| Net | | | | | $ | 103,677 | | $ | 53,143 | | $ | 196,569 | | $ | 119,424 | |
For the three and six month periods ended July 31, 2008, we realized $128,939 and $315,962, respectively, in revenue from sales of natural gas and natural gas liquids, as compared to $144,297 and $240,941 in the same periods in 2007. Revenue increased mainly due to higher prices, offset by reduced production volumes since we sold two Barnett Shale wells. Royalties related to this revenue totaled $21,108 and $56,012 (16% and 18% of revenue) for the three month and six month periods ended July 31, 2008, respectively, compared to 14% and 20% in the same periods in 2007. Production expenses related to this revenue totaled $4,154 and $63,381 ($2.03/Boe and $10.89/Boe) for the three and six month periods ended July 31, 2008, respectively, compared to $16.48 and $11.32 in the same periods in 2007.
Depletion, Depreciation and Accretion (“DD&A”)
| | | Three Months Ended July 31, 2008 | | Three Months Ended July 31, 2007 | | Six Months Ended July 31, 2008 | | Six Months Ended July 31, 2007 | |
| Depletion – oil and gas properties | | $ | 13,557 | | $ | 107,678 | | $ | 51,028 | | $ | 181,822 | |
| Accretion | | | 9,711 | | | 28,043 | | | 42,539 | | | 29,367 | |
| Depletion and Accretion | | | 23,268 | | | 135,721 | | | 93,567 | | | 211,189 | |
| Depreciation – property and equipment | | | 9,988 | | | 14,834 | | | 19,747 | | | 21,614 | |
| Total | | $ | 33,256 | | $ | 150,555 | | $ | 113,314 | | $ | 232,803 | |
| Depletion per BOE | | $ | 6.64 | | $ | 24.82 | | $ | 8.77 | | $ | 27.91 | |
Unproven property costs of $22,482,988 were excluded from costs subject to depletion at July 31, 2008. Depletion expense related to oil and as properties decreased in the three and six months periods ended July 31, 2008 compared to the same periods in 2007 primarily as a result of the U.S. properties having no depletion starting in the second quarter of fiscal 2009 as proved property costs were nil.
General and Administrative (“G&A”)
| | | Three Months Ended July 31, 2008 | | Three Months Ended July 31, 2007 | | Six Months Ended July 31, 2008 | | Six Months Ended July 31, 2007 | |
| Salaries, wages and consulting fees | | $ | 548,143 | | $ | 349,417 | | | 941,005 | | $ | 623,242 | |
| Other, travel and office expense | | | 366,785 | | | 453,912 | | | 1,061,361 | | | 787,045 | |
| Stock-based compensation | | | 227,756 | | | 528,078 | | | 341,036 | | | 2,153,614 | |
| G&A | | $ | 1,142,684 | | $ | 1,331,407 | | | 2,343,402 | | $ | 3,563,901 | |
General and administrative expenses have decreased in the three and six month periods ended July 31, 2008 compared to the same periods in 2007 primarily due to decreased stock-based compensation expense mainly as a result of shares issued to our executives that have now been fully expensed. Salaries, wages and consulting fees increased in the three and six month periods ended July 31, 2008 compared to the same periods in 2007 due to increased staff and the payment of bonuses to employees in July 2008. Other, travel and office expenses increased in the six month period ended July 31, 2008 compared to the same period in 2007 due to increased year-end audit and reserve evaluation fees, increased audit and accounting fees for the restatements of the 10-K’s and 10-Q’s, increased office rent and increased investor relations expenses. Other, travel and office expenses decreased in the three month period ended July 31, 2008 compared to the same period in 2007 due to professional fees associated with year-end costs that were paid in the first quarter in fiscal 2009 compared the second quarter of fiscal 2008.
Accretion of Discounts on Convertible Debentures
| Agreement Date | | Three Months Ended July 31, 2008 | | Three Months Ended July 31, 2007 | | Six Months Ended July 31, 2008 | | Six Months Ended July 31, 2007 | |
| June 14, 2005 | | $ | - | | $ | 115,626 | | $ | - | | $ | 515,626 | |
| December 8, 2005 | | | 186,764 | | | 1,311,999 | | | 813,337 | | | 2,439,940 | |
| December 28, 2005 | | | 604,278 | | | 840,183 | | | 1,193,063 | | | 1,652,968 | |
| Total accretion of discounts | | $ | 791,042 | | $ | 2,267,808 | | $ | 2,006,400 | | $ | 4,608,534 | |
Accretion of discounts on convertible debentures decreased in the three and six month periods ended July 31, 2008 compared to the same periods in 2007 due primarily to the June 14, 2005 debenture discounts being realized prior to fiscal 2009, the conversion of December 8, 2005 debentures throughout fiscal 2008 and fiscal 2009 which reduced the accretion base, the repayment of the December 8, 2005 debentures on June 5, 2008, and the reduction of the December 28, 2005 accretion since the maturity date was extended.
Interest Expense
Agreement Date | | Three Months Ended July 31, 2008 | | Three Months Ended July 31, 2007 | | Six Months Ended July 31, 2008 | | Six Months Ended July 31, 2007 | |
| June 14, 2005 | | $ | - | | $ | (23,878 | ) | $ | - | | $ | 18,919 | |
| December 8, 2005 | | | 22,312 | | | 141,234 | | | 91,360 | | | 297,911 | |
| December 28, 2005 | | | 189,041 | | | 189,041 | | | 373,973 | | | 371,918 | |
| Total interest expense | | $ | 211,353 | | $ | 306,397 | | $ | 465,333 | | $ | 688,748 | |
Interest expense decreased for the three and six month periods ended July 31, 2008 compared to the same periods in 2007 due primarily to the conversion and repayment of the December 8, 2005 convertible debentures.
Oil and Gas Properties
| | | Net Book Value January 31, 2008 | | Additions | | Depletion | | Disposition | | Gain (Loss) | | Net Book Value July 31, 2008 | |
| | | | | | | | | | | | | | |
Unproven | | | | | | | | | | | | | | | | | | | |
| Windsor Block Maritimes Shale – Nova Scotia, Canada | | $ | 15,441,144 | | $ | 1,585,787 | | $ | - | | $ | (2,943,510 | ) | $ | - | | $ | 14,083,421 | |
| Beech Hill Block Maritimes Shale – New Brunswick, Canada | | | 21,975 | | | 41,334 | | | - | | | - | | | - | | | 63,309 | |
| Western Canadian Shale – Alberta and B.C., Canada | | | - | | | 25,387 | | | - | | | - | | | - | | | 25,387 | |
| Arkoma Basin, Arkansas – Fayetteville Shale | | | 8,289,901 | | | 20,970 | | | - | | | - | | | - | | | 8,310,871 | |
| U.S. Rocky Mountains – Colorado, Montana, Wyoming | | | 812,020 | | | 18,488 | | | - | | | (800,503 | ) | | (30,005 | ) | | - | |
| | | | | | | | | | | | | | | | | | | | |
Proved | | | | | | | | | | | | | | | | | | | |
| Alberta Deep Basin – Western Canada | | | 324,162 | | | 11,175 | | | (45,106 | ) | | - | | | - | | | 290,231 | |
| Greater Fort Worth Basin, Texas – Barnett Shale | | | 89,747 | | | 40,450 | | | (5,922 | ) | | (164,985 | ) | | 40,710 | | | - | |
| Net | | $ | 24,978,949 | | $ | 1,743,591 | | $ | (51,028 | ) | $ | (3,908,998 | ) | $ | 10,705 | | $ | 22,773,219 | |
During the six month period ended July 31, 2008, we spent $1,585,787 on the Windsor Block mainly for testing of Kennetcook #1 and #2 ($616,000), installation of an electric submersible pump at Kennetcook #2 ($456,000) and drilling costs for first well of the second phase of the project that spud in mid-July and was drilling over quarter-end ($387,000).
In July 2008, we received $2,943,510 in cash for a partner’s share of its 30% working interest in exploration costs associated with the Windsor Block of Nova Scotia.
In June 2008, we sold our 25% working interest in 9,692 acres in the Phat City area of Montana (Rocky Mountains project) for gross cash proceeds of $800,503. The net book value of the Rocky Mountains project at the time of the sale was $830,508, which related to U.S. Rocky Mountain leasehold acquisition costs. As such we recorded a loss on the sale of assets of $30,005.
In June 2008, we sold our interest in two Barnett shale wells for gross proceeds of $164,985. The net book value of the U.S. proved property costs at the time of the sale was $131,820 and the related properties had an asset retirement obligation on the books of $7,545. As such we recorded a gain on the sale of assets of $40,710.
Net Cash Oil and Gas Additions:
| | | Six Months Ended July 31, 2008 | |
| Net additions, per above table | | $ | 1,743,591 | |
| Non-cash ARO additions | | | (45,450 | ) |
| Non-cash ARO dispositions | | | 137,429 | |
| Changes in investing working capital | | | 1,900,339 | |
| Net oil and gas additions, per Statement of Cash Flows | | $ | 3,735,909 | |
Liquidity and Capital Resources
To date, we have generated minimal revenues and have incurred operating losses in every quarter. We are an early stage production company, have not generated significant revenues from operations and have incurred significant losses since inception. These factors among others raise substantial doubt about our ability to continue as a going concern.
As at July 31, 2008, we had working capital of $10,623,175, resulting primarily from our cash and cash equivalents of $23,493,562 offset by payables of $3,549,024, $7,962,069 of convertible debentures and $1,917,122 of associated accrued interest. We have a cash equivalents balance of $23,383,247 at July 31, 2008, which are held on deposit at a Schedule “1” Canadian Chartered Bank in U.S. term deposits and non-redeemable Guaranteed Investment Certificates (“GIC”) that mature in less than 90 days. For the six month period ended July 31, 2008, we had net cash outflow from operating activities of $2,562,172, mainly related to cash general and administrative expenses.
| | | July 31, 2008 | | January 31, 2008 | |
Agreement Date | | Face Value | | Discount | | Carrying Value | | Face Value | | Discount | | Carrying Value | |
| December 8, 2005 | | $ | - | | $ | - | | $ | - | | $ | 6,100,140 | | $ | 1,321,869 | | $ | 4,778,271 | |
| December 28, 2005 | | | 10,000,000 | | | 2,037,931 | | | 7,962,069 | | | 10,000,000 | | | 3,229,279 | | | 6,770,721 | |
| Total convertible debentures | | $ | 10,000,000 | | $ | 2,037,931 | | $ | 7,962,069 | | $ | 16,100,140 | | $ | 4,551,148 | | $ | 11,548,992 | |
We have $10,000,000 of convertible debentures outstanding as at July 31, 2008. The December 8, 2005 debentures were convertible at the lower of (i) $5.00 or (ii) 90% of the average of the three lowest daily volume weighted average prices of our common stock of the 10 trading days immediately preceding the date of conversion. During the six month period ended July 31, 2008, $2,100,140 of convertible debentures were converted into 2,374,013 shares of common stock and the remaining $4,000,000 of these convertible debentures were repaid, subject to a 20% early redemption fee ($800,000). The December 28, 2005 debentures mature on June 1, 2009, whereby $10,000,000 plus accrued interest is payable or convertible at $4.00. Based on the current share price, conversion is not likely and we will either be required to repay or refinance these debentures.
We were committed to pay 66% of the drilling and completion costs for one well in our Fayetteville project to earn a 50% working interest. The operator had to spud this well before July 31, 2008 or we automatically earn our 50%. The operator did not spud this well; therefore, we earned our 50% working interest. We were also committed to pay 33% of the costs to drill one well in our Rocky Mountains project to earn 25%. On June 30, 2008, we sold our Montana acreage position along with this commitment.
We expect significant capital expenditures during the next 12 months for drilling programs on our Canadian shale program, overhead and working capital purposes. To partially fund these expenditures, we closed a private placement on June 3, 2008 for aggregate gross proceeds of $25,560,500. Also, to fund the remaining expenditures, we entered into a joint venture partnership in June 2008, whereby the Zodiac Exploration Corp. may pay 50% of the next $30,000,000 in gross costs for the next 6 wells in the Windsor Block of Nova Scotia to earn up to 25% in the Block. We will have to raise additional funds to complete the exploration and development phase of our programs and, while we have been successful in doing so in the past, there can be no assurance that we will be able to do so in the future. Our continuation as a going concern for a period longer than the current fiscal year is dependent upon our ability to obtain necessary additional funds to continue operations and to determine the existence, discovery and successful exploitation of economically recoverable reserves in our resource properties, earning of our interests in the underlying properties, and the attainment of profitable operations.
By adjusting our operations to the level of capitalization, we believe we have sufficient capital resources to meet projected cash flow deficits in the near term. However, if during that period, or thereafter, we are not successful in generating sufficient liquidity from operations or in raising sufficient capital resources, on terms acceptable to us, this could have a material adverse effect on our business, results of operations, liquidity and financial condition.
We presently do not have any available credit, bank financing or other external sources of liquidity. Due to our brief history and historical operating losses, our operations have not been a source of liquidity. We will need to obtain additional capital in order to expand operations and become profitable. In order to obtain capital, we may need to sell additional shares of our common stock or borrow funds from private lenders. There can be no assurance that we will be successful in obtaining additional funding.
We will still need additional capital in order to continue operations until we are able to achieve positive operating cash flow. Additional capital is being sought, but we cannot guarantee that we will be able to obtain such investments. Financing transactions may include the issuance of equity or debt securities, obtaining credit facilities, or other financing mechanisms. However, the trading price of our common stock and a downturn in the U.S. stock and debt markets could make it more difficult to obtain financing through the issuance of equity or debt securities. Even if we are able to raise the funds required, it is possible that we could incur unexpected costs and expenses, fail to collect significant amounts owed to us, or experience unexpected cash requirements that would force us to seek alternative financing. Furthermore, if we issue additional equity or debt securities, stockholders may experience additional dilution or the new equity securities may have rights, preferences or privileges senior to those of existing holders of our common stock. If additional financing is not available or is not available on acceptable terms, we will have to curtail our operations.
June 2008 Private Placement
On June 3, 2008, we sold an aggregate of 18,257,500 units in a private placement transaction for gross proceeds of $25,560,500. The net proceeds after deducting expenses were $23,641,913. Each unit was priced at $1.40 per unit and consists of one share of common stock and one-half of a warrant. One full warrant can be exercised into one share of common stock for a period of two years at a price of $2.25 per share. Pursuant to the terms of the sale, we were required, on a best efforts basis, to file a registration statement with the SEC, and to cause such registration statement to be declared effective by the SEC, within 150 days after closing, to permit the public resale of the shares underlying the warrants. The registration statement was declared effective by the SEC on July 14, 2008. Also, pursuant to the terms of the sale, we are required, on a best efforts basis, to list our shares of common stock on the Toronto Stock Exchange (which includes the TSX Venture Exchange) on or before December 31, 2008. Failure to list the shares for trading by such date shall result in us paying, pro rata to the purchasers, of a penalty equal to 2% of the gross proceeds of the offering for each month or partial month until the shares are listed for trading on the Toronto Stock Exchange (which includes the TSX Venture Exchange), not to exceed 10% in the aggregate. We paid the placement agents of the offering a cash fee of 7% of the gross proceeds of the offering.
Critical Accounting Policies
Use of Estimates
The preparation of financial statements in conformity with U.S. generally accepted accounting principles requires us to make estimates and assumptions that affect the reported amounts of assets and liabilities and disclosure of contingent assets and liabilities at the date of the financial statements and the reported amounts of revenues and expenses during the reporting period. Actual results could differ from those estimates. We base our estimates and assumptions on current facts, historical experience and various other factors that we believe to be reasonable under the circumstances, the results of which form the basis for making judgments about the carrying values of assets and liabilities and the accrual of costs and expenses that are not readily apparent from other sources. The actual results experienced by us may differ materially and adversely from our estimates. To the extent there are material differences between the estimates and the actual results, future results of operations will be affected.
Investment in Oil and Gas Properties
We utilize the full cost method to account for our investment in oil and gas properties. Accordingly, all costs associated with acquisition and exploration of oil and gas reserves, including such costs as leasehold acquisition costs, interest costs relating to unproven properties, geological expenditures and direct internal costs are capitalized into the full cost pool. We had two countries with proved reserves. For our proved oil and gas reserves, capitalized costs, including estimated future costs to develop the reserves and estimated abandonment costs, net of salvage, will be depleted on the units-of-production method using estimates of proved reserves. Investments in unproven properties and major development projects including capitalized interest, if any, are not amortized until proved reserves associated with the projects can be determined. If the future exploration of unproven properties is determined uneconomical, the amounts of such properties are added to the capitalized cost to be amortized. The capitalized costs included in the full cost pool are subject to a ceiling test.
Asset Retirement Obligations
We recognize a liability for future retirement obligations associated with our oil and gas properties. The estimated fair value of the asset retirement obligation is based on the current estimated cost escalated at an inflation rate and discounted at a credit adjusted risk-free rate. This liability is capitalized as part of the cost of the related asset and amortized over its useful life. The liability accretes until we settle the obligation. The costs are estimated by management based on its knowledge of industry practices, current laws and past experiences. The costs could increase significantly from management’s current estimate.
Stock-Based Compensation
We record compensation expense in the consolidated financial statements for stock options granted to employees, consultants and directors using the fair value method. Fair values are determined using the Black Scholes option pricing model, which is sensitive to the estimate of the Company’s stock price volatility and the options expected life. Compensation costs are recognized over the vesting period.
Derivative Liabilities
We record derivatives at their fair values on the date that they meet the requirements of a derivative instrument and at each subsequent balance sheet date. Fair values are determined using the Black Scholes option pricing model, which requires and is very sensitive to an estimate of the Company’s stock price volatility and term. Any change in fair value will be recorded as non-operating, non-cash income or expense at each reporting date.
Recently Issued Accounting Pronouncements
In December 2007, the Financial Accounting Standard Board (FASB) revised the Statement of Financial Accounting Standard (SFAS) No. 141, “Business Combinations”. SFAS No. 141R requires an acquirer to be identified for all business combinations and applies the same method of accounting for business combinations - the acquisition method - to all transactions. In addition, transaction costs associated with acquisitions are required to be expensed. The revised statement is effective to business combinations in years beginning on or after December 31, 2008. The adoption of this statement will impact business combinations, if any, after the effective date.
In December 2007, the FASB issued SFAS No. 160, “Non-controlling Interests in Consolidated Financial Statements”. SFAS no. 160 requires the Company to report non-controlling interest in subsidiaries as equity in the consolidated financial statements; and all transactions between equity and non controlling interests as equity. SFAS No. 160 is effective for us commencing on February 1, 2009 and it will not impact our current financial statements.
In March 2008, the FASB has issued SFAS No. 161, “Disclosures about Derivative Instruments and Hedging Activities”, which requires disclosures about how and why an entity uses derivative instruments, how derivative instruments and related hedged items are accounted for under SFAS No. 133, and how derivative instruments and related hedged items affect an entity’s financial position, financial performance and cash flows. SFAS No. 161 is effective on February 1, 2009 and is not anticipated to significantly affect our financial statements.
In May 2008, the FASB issued SFAS No. 162, “The Hierarchy of Generally Accepted Accounting Principles. SFAS No. 162 identifies the sources of accounting principles and the framework for selecting the principles to be used in the preparation of financial statements of nongovernmental entities that are presented in conformity with GAAP. SFAS No. 162 directs the GAAP hierarchy to the entity, not the independent auditors, as the entity is responsible for selecting accounting principles for financial statements that are presented in conformity with GAAP. SFAS No. 162 is effective 60 days following the SEC’s approval of the Public Company Accounting Oversight Board amendments to remove the GAAP hierarchy from the auditing standards. SFAS No. 162 is not expected to have a material impact on our financial statements.
In May 2008, the FASB directed the FASB Staff to issue FSP APB 14-1, Accounting for Convertible Debt Instruments That May Be Settled in Cash upon Conversion (Including Partial Cash Settlement) (FSP APB 14-1). FSP APB 14-1 applies to convertible debt instruments that, by their stated terms, may be settled in cash (or other assets) upon conversion, including partial cash settlement of the conversion option. FSP APB 14-1 requires bifurcation of the instrument into a debt component that is initially recorded at fair value and an equity component. The difference between the fair value of the debt component and the initial proceeds from issuance of the instrument is recorded as a component of equity. The liability component of the debt instrument is accreted to par using the effective yield method; accretion is reported as a component of interest expense. The equity component is not subsequently re-valued as long as it continues to qualify for equity treatment. FSP APB 14-1 is effective for the Company on February 1, 2009. Early adoption is not permitted. We are evaluating the impact of adopting FSP APB 14-1 will have on our financial statements.
ITEM 3 – QUANTITATIVE AND QUALITATIVE DISCLOSURES ABOUT MARKET RISK
Not required under Regulation S-K for “smaller reporting companies.”
ITEM 4T - CONTROLS AND PROCEDURES
(a) Evaluation of disclosure controls and procedures.
Our management, with the participation of our Chief Executive Officer and Chief Financial Officer, evaluated the effectiveness of our disclosure controls and procedures pursuant to Rule 13a-15 under the Securities Exchange Act of 1934 as of July 31, 2008. In designing and evaluating the disclosure controls and procedures, management recognizes that any controls and procedures, no matter how well designed and operated, can provide only reasonable assurance of achieving the desired control objectives. In addition, the design of disclosure controls and procedures must reflect the fact that there are resource constraints and that management is required to apply its judgment in evaluating the benefits of possible controls and procedures relative to their costs.
Based on our evaluation, our Chief Executive Officer and Chief Financial Officer concluded that, as a result of the material weaknesses described below, our disclosure controls and procedures are not designed at a reasonable assurance level and are ineffective to provide reasonable assurance that information we are required to disclose in reports that we file or submit under the Exchange Act is recorded, processed, summarized and reported within the time periods specified in Securities and Exchange Commission rules and forms, and that such information is not accumulated nor communicated to our management, including our Chief Executive Officer and Chief Financial Officer, as appropriate, to allow timely decisions regarding required disclosure. The material weaknesses, which relate to internal control over financial reporting, that were identified are:
| | a) | We did not have sufficient personnel in our accounting and financial reporting functions. As a result, we were not able to achieve adequate segregation of duties and were not able to provide for adequate reviewing of the financial statements. This control deficiency, which is pervasive in nature, results in a reasonable possibility that material misstatements of the financial statements will not be prevented or detected on a timely basis; and |
| | b) | We did not maintain sufficient personnel with an appropriate level of technical accounting knowledge, experience, and training in the application of US GAAP commensurate with our complexity and our financial accounting and reporting requirements. This control deficiency is pervasive in nature and specifically resulted in us restating previously filed annual and quarterly financial statements as a result of errors in the accounting for convertible debentures and warrants. Further, there is a reasonable possibility that material misstatements of the consolidated financial statements including disclosures will not be prevented or detected on a timely basis as a result. |
We are committed to improving our financial organization. As part of this commitment, we will create a segregation of duties consistent with control objectives and will look to increase our personnel resources and technical accounting expertise within the accounting function by the end of fiscal 2010 to resolve non-routine or complex accounting matters. In addition, when funds are available to the Company, which we expect to occur by the end of fiscal 2010, we will take the following action to enhance our internal controls: Hiring additional knowledgeable personnel with technical accounting expertise to further support the current accounting personnel at the Company, which management estimates will cost approximately $100,000 per annum. In January 2008, the Company engaged an outside consultant that specializes in the accounting for derivative instruments that are embedded within the Company's financing transactions. The Company will continue to engage consultants in the future as necessary in order to ensure proper treatment.
Management believes that hiring additional knowledgeable personnel with technical accounting expertise will remedy the following material weaknesses: (A) lack of sufficient personnel in our accounting and financial reporting functions to achieve adequate segregation of duties; and (B) insufficient personnel with an appropriate level of technical accounting knowledge, experience, and training in the application of US GAAP commensurate with our complexity and our financial accounting and reporting requirements.
Management believes that the hiring of additional personnel who have the technical expertise and knowledge with the non-routine or technical issues we have encountered in the past will result in both proper recording of these transactions and a much more knowledgeable finance department as a whole. Due to the fact that our accounting staff consists of a Chief Financial Officer, accounting manager and accounting clerk, additional personnel will also ensure the proper segregation of duties and provide more checks and balances within the department. Additional personnel will also provide the cross training needed to support us if personnel turn over issues within the department occur. We believe this will greatly decrease any control and procedure issues we may encounter in the future.
We will continue to monitor and evaluate the effectiveness of our disclosure controls and procedures and our internal controls over financial reporting on an ongoing basis and are committed to taking further action and implementing additional enhancements or improvements, as necessary and as funds allow.
(b) Changes in internal control over financial reporting.
We regularly review our system of internal control over financial reporting and make changes to our processes and systems to improve controls and increase efficiency, while ensuring that we maintain an effective internal control environment. Changes may include such activities as implementing new, more efficient systems, consolidating activities, and migrating processes.
There were no changes in our internal control over financial reporting that occurred during the period covered by this Quarterly Report on Form 10-Q that have materially affected, or are reasonably likely to materially affect, our internal control over financial reporting.
PART II - OTHER INFORMATION
Item 1. Legal Proceedings.
From time to time, we may become involved in various lawsuits and legal proceedings which arise in the ordinary course of business. However, litigation is subject to inherent uncertainties, and an adverse result in these or other matters may arise from time to time that may harm our business. We are currently not aware of any such legal proceedings or claims that we believe will have, individually or in the aggregate, a material adverse affect on our business, financial condition or operating results.
Item 1A. Risk Factors.
Not required under Regulation S-K for “smaller reporting companies.”
Item 2. Unregistered Sales of Equity Securities and Use of Proceeds.
On June 3, 2008, we sold an aggregate of 18,257,500 units to 31 accredited investors for aggregate proceeds of $25,560,500. Each unit consists of one share of our common stock and one-half of a warrant, each whole warrant entitling the holder to purchase one share of our common stock exercisable at a price of $2.25 for a period of two years. The securities were issued in a private placement transaction pursuant to Section 4(2) under the Securities Act of 1933.
Item 3. Defaults Upon Senior Securities.
None.
Item 4. Submission of Matters to a Vote of Security Holders.
None.
Item 5. Other Information.
None.
Item 6. Exhibits
| 31.1 | Certification of Chief Executive Officer pursuant to Rule 13a-14 and Rule 15d-14(a), promulgated under the Securities and Exchange Act of 1934, as amended |
| 31.2 | Certification of Chief Financial Officer pursuant to Rule 13a-14 and Rule 15d 14(a), promulgated under the Securities and Exchange Act of 1934, as amended |
| 32.1 | Certification pursuant to 18 U.S.C. Section 1350, as adopted pursuant to Section 906 of the Sarbanes-Oxley Act of 2002 (Chief Executive Officer) |
| 32.2 | Certification pursuant to 18 U.S.C. Section 1350, as adopted pursuant to Section 906 of the Sarbanes-Oxley Act of 2002 (Chief Financial Officer) |
SIGNATURES
In accordance with requirements of the Exchange Act, the registrant caused this report to be signed on its behalf by the undersigned, thereunto duly authorized.
| | TRIANGLE PETROLEUM CORPORATION |
| | | |
| Date: September 3, 2008 | By: | /s/ MARK GUSTAFSON |
| | Mark Gustafson |
| | Chief Executive Officer (Principal Executive Officer) |
| | | |
| Date: September 3, 2008 | By: | /s/ SHAUN TOKER |
| | Shaun Toker |
| | Chief Financial Officer (Principal Financial Officer and Principal Accounting Officer) |