UNITED STATES
SECURITIES AND EXCHANGE COMMISSION
Washington, D.C. 20549
Form N-CSR
CERTIFIED SHAREHOLDER REPORT OF REGISTERED
MANAGEMENT INVESTMENT COMPANIES
Investment Company Act File Number: 811-21519
Eaton Vance Tax-Advantaged Global Dividend Opportunities Fund
(Exact Name of Registrant as Specified in Charter)
Two International Place, Boston, Massachusetts 02110
(Address of Principal Executive Offices)
Deidre E. Walsh
Two International Place, Boston, Massachusetts 02110
(Name and Address of Agent for Services)
(617) 482-8260
(Registrant’s Telephone Number)
October 31
Date of Fiscal Year End
April 30, 2022
Date of Reporting Period
Item 1. Reports to Stockholders
Eaton Vance
Tax-Advantaged Global Dividend Opportunities Fund (ETO)
Semiannual Report
April 30, 2022
Commodity Futures Trading Commission Registration. The Commodity Futures Trading Commission (“CFTC”) has adopted regulations that subject registered investment companies and advisers to regulation by the CFTC if a fund invests more than a prescribed level of its assets in certain CFTC-regulated instruments (including futures, certain options and swap agreements) or markets itself as providing investment exposure to such instruments. The investment adviser has claimed an exclusion from the definition of “commodity pool operator” under the Commodity Exchange Act with respect to its management of the Fund. Accordingly, neither the Fund nor the adviser with respect to the operation of the Fund is subject to CFTC regulation. Because of its management of other strategies, the Fund’s adviser is registered with the CFTC as a commodity pool operator. The adviser is also registered as a commodity trading advisor.
Managed Distribution Plan. Pursuant to an exemptive order issued by the Securities and Exchange Commission (Order), the Fund is authorized to distribute long-term capital gains to shareholders more frequently than once per year. Pursuant to the Order, the Fund’s Board of Trustees approved a Managed Distribution Plan (MDP) pursuant to which the Fund makes monthly cash distributions to common shareholders, stated in terms of a fixed amount per common share.
The Fund currently distributes monthly cash distributions equal to $0.1792 per share in accordance with the MDP. You should not draw any conclusions about the Fund’s investment performance from the amount of these distributions or from the terms of the MDP. The MDP will be subject to regular periodic review by the Fund’s Board of Trustees and the Board may amend or terminate the MDP at any time without prior notice to Fund shareholders. However, at this time there are no reasonably foreseeable circumstances that might cause the termination of the MDP.
The Fund may distribute more than its net investment income and net realized capital gains and, therefore, a distribution may include a return of capital. A return of capital distribution does not necessarily reflect the Fund’s investment performance and should not be confused with “yield” or “income.” With each distribution, the Fund will issue a notice to shareholders and a press release containing information about the amount and sources of the distribution and other related information. The amounts and sources of distributions contained in the notice and press release are only estimates and are not provided for tax purposes. The amounts and sources of the Fund’s distributions for tax purposes will be reported to shareholders on Form 1099-DIV for each calendar year.
Fund shares are not insured by the FDIC and are not deposits or other obligations of, or guaranteed by, any depository institution. Shares are subject to investment risks, including possible loss of principal invested.
Semiannual Report April 30, 2022
Eaton Vance
Tax-Advantaged Global Dividend Opportunities Fund
Eaton Vance
Tax-Advantaged Global Dividend Opportunities Fund
April 30, 2022
Performance
Portfolio Manager(s) John H. Croft, CFA and Derek J.V. DiGregorio of Eaton Vance Management; Christopher M. Dyer, CFA of Eaton Vance Advisers International Ltd.
| % Average Annual Total Returns1,2 | Inception Date | Six Months | One Year | Five Years | Ten Years |
| Fund at NAV | 04/30/2004 | (15.47)% | (7.30)% | 10.48% | 11.13% |
| Fund at Market Price | — | (21.08) | (8.65) | 9.50 | 12.17 |
|
| MSCI World Index | — | (11.30)% | (3.52)% | 10.16% | 10.05% |
| ICE BofA Fixed Rate Preferred Securities Index | — | (11.70) | (10.10) | 2.39 | 4.53 |
| Blended Index | — | (11.36) | (4.80) | 8.68 | 9.03 |
| % Premium/Discount to NAV3 | |
| | (3.76)% |
| Distributions 4 | |
| Total Distributions per share for the period | $1.075 |
| Distribution Rate at NAV | 8.42% |
| Distribution Rate at Market Price | 8.75 |
| % Total Leverage5 | |
| Borrowings | 19.76% |
See Endnotes and Additional Disclosures in this report.
Past performance is no guarantee of future results. Returns are historical and are calculated net of management fees and other expenses by determining the percentage change in net asset value (NAV) or market price (as applicable) with all distributions reinvested in accordance with the Fund’s Dividend Reinvestment Plan. Furthermore, returns do not reflect the deduction of taxes that shareholders may have to pay on Fund distributions or upon the sale of Fund shares. Performance at market price will differ from performance at NAV due to variations in the Fund’s market price versus NAV, which may reflect factors such as fluctuations in supply and demand for Fund shares, changes in Fund distributions, shifting market expectations for the Fund’s future returns and distribution rates, and other considerations affecting the trading prices of closed-end funds. Investment return and principal value will fluctuate so that shares, when sold, may be worth more or less than their original cost. Performance for periods less than or equal to one year is cumulative. Performance is for the stated time period only; due to market volatility, current Fund performance may be lower or higher than the quoted return. For performance as of the most recent month-end, please refer to eatonvance.com.
Eaton Vance
Tax-Advantaged Global Dividend Opportunities Fund
April 30, 2022
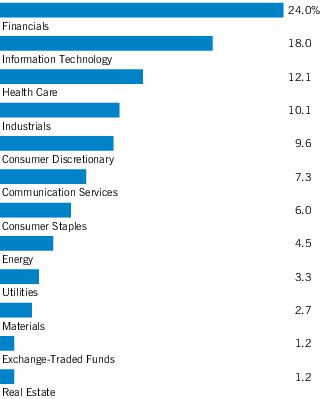
| Sector Allocation (% of total investments)* |
| * | Excludes cash and cash equivalents. |
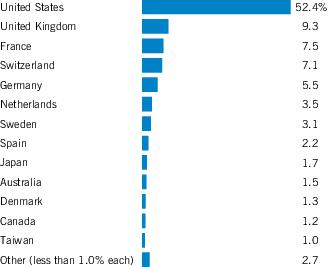
| Country Allocation (% of total investments) |
| Top 10 Holdings (% of total investments)* |
| Alphabet, Inc., Class C | 4.0% |
| Microsoft Corp. | 3.9 |
| Apple, Inc. | 2.5 |
| Amazon.com, Inc. | 2.3 |
| Coca-Cola Co. (The) | 1.8 |
| ASML Holding NV | 1.6 |
| Nestle S.A. | 1.5 |
| Eli Lilly & Co. | 1.4 |
| EOG Resources, Inc. | 1.3 |
| Novo Nordisk A/S, Class B | 1.3 |
| Total | 21.6% |
| * | Excludes cash and cash equivalents. |
Eaton Vance
Tax-Advantaged Global Dividend Opportunities Fund
April 30, 2022
Endnotes and Additional Disclosures
| 1 | MSCI World Index is an unmanaged index of equity securities in the developed markets. MSCI indexes are net of foreign withholding taxes. Source: MSCI. MSCI data may not be reproduced or used for any other purpose. MSCI provides no warranties, has not prepared or approved this report, and has no liability hereunder. ICE BofA Fixed Rate Preferred Securities Index is an unmanaged index of fixed-rate, preferred securities issued in the U.S. ICE® BofA® indices are not for redistribution or other uses; provided “as is”, without warranties, and with no liability. Eaton Vance has prepared this report and ICE Data Indices, LLC does not endorse it, or guarantee, review, or endorse Eaton Vance’s products. BofA® is a licensed registered trademark of Bank of America Corporation in the United States and other countries. The Blended Index consists of 80% MSCI World Index and 20% ICE BofA Fixed Rate Preferred Securities Index, rebalanced monthly. Unless otherwise stated, index returns do not reflect the effect of any applicable sales charges, commissions, expenses, taxes or leverage, as applicable. It is not possible to invest directly in an index. |
| 2 | Performance results reflect the effects of leverage. |
| 3 | The shares of the Fund often trade at a discount or premium to their net asset value. The discount or premium may vary over time and may be higher or lower than what is quoted in this report. For up-to-date premium/discount information, please refer to https://funds.eatonvance.com/closed-end-fund-prices.php. |
| 4 | The Distribution Rate is based on the Fund’s last regular distribution per share in the period (annualized) divided by the Fund’s NAV or market price at the end of the period. The Fund’s distributions may be comprised of amounts characterized for federal income tax purposes as qualified and non-qualified ordinary dividends, capital gains and nondividend distributions, also known as return of capital. For additional information about nondividend distributions, please refer to Eaton Vance Closed-End Fund Distribution Notices (19a) posted on our website, eatonvance.com. The Fund will determine the federal income tax character of distributions paid to a shareholder after the end of the calendar year. This is reported on the IRS form 1099-DIV and provided to the shareholder shortly after each year-end. For information about the tax character of distributions made in prior calendar years, please refer to Performance-Tax Character of Distributions on the Fund’s webpage available at eatonvance. com. The Fund’s distributions are determined by the investment adviser based on its current assessment of the Fund’s long-term return potential. Fund distributions may be affected by numerous factors including changes in Fund performance, the cost of financing for leverage, portfolio holdings, realized and projected returns, and other factors. As portfolio and market conditions change, the rate of distributions paid by the Fund could change. |
| 5 | Total leverage is shown as a percentage of the Fund’s aggregate net assets plus borrowings outstanding. The Fund employs leverage through borrowings. Use of leverage creates an opportunity for income, but creates risks including greater price volatility. The cost of borrowings rises and falls with changes in short-term interest rates. The Fund may be required to maintain prescribed asset coverage for its leverage and may be required to reduce its leverage at an inopportune time. |
| | Fund profile subject to change due to active management. |
Eaton Vance
Tax-Advantaged Global Dividend Opportunities Fund
April 30, 2022
Portfolio of Investments (Unaudited)
| Security | Shares | Value |
| Aerospace & Defense — 0.9% |
| Safran S.A. | | 36,543 | $ 3,924,662 |
| | | | $ 3,924,662 |
| Air Freight & Logistics — 0.8% |
| GXO Logistics, Inc.(1) | | 59,545 | $ 3,524,469 |
| | | | $ 3,524,469 |
| Automobiles — 2.2% |
| Bayerische Motoren Werke AG | | 31,196 | $ 2,547,645 |
| Mercedes-Benz Group AG | | 50,111 | 3,497,806 |
| Stellantis NV | | 247,622 | 3,324,486 |
| | | | $ 9,369,937 |
| Banks — 9.9% |
| Banco Santander S.A. | | 1,055,353 | $ 3,084,109 |
| Bank of New York Mellon Corp. (The) | | 65,185 | 2,741,681 |
| Citigroup, Inc. | | 59,989 | 2,892,070 |
| Credit Agricole S.A. | | 265,833 | 2,870,481 |
| DNB Bank ASA | | 93,958 | 1,820,653 |
| HDFC Bank, Ltd. | | 156,891 | 2,807,433 |
| ING Groep NV | | 414,724 | 3,929,182 |
| M&T Bank Corp. | | 28,807 | 4,800,399 |
| Skandinaviska Enskilda Banken AB, Class A | | 140,767 | 1,578,575 |
| Standard Chartered PLC | | 179,167 | 1,224,843 |
| Svenska Handelsbanken AB, Class A | | 387,580 | 3,909,255 |
| Swedbank AB, Class A | | 60,628 | 959,089 |
| Toronto-Dominion Bank (The) | | 60,197 | 4,348,017 |
| Wells Fargo & Co.(2) | | 105,796 | 4,615,879 |
| | | | $ 41,581,666 |
| Beverages — 3.6% |
| Coca-Cola Co. (The)(2) | | 142,390 | $ 9,199,818 |
| Diageo PLC | | 121,215 | 6,047,277 |
| | | | $ 15,247,095 |
| Biotechnology — 0.8% |
| CSL, Ltd. | | 16,973 | $ 3,239,299 |
| | | | $ 3,239,299 |
| Building Products — 1.4% |
| Assa Abloy AB, Class B | | 131,217 | $ 3,316,133 |
| Security | Shares | Value |
| Building Products (continued) |
| Kingspan Group PLC | | 25,141 | $ 2,340,302 |
| | | | $ 5,656,435 |
| Capital Markets — 0.5% |
| State Street Corp. | | 31,176 | $ 2,087,857 |
| | | | $ 2,087,857 |
| Chemicals — 1.4% |
| BASF SE | | 48,709 | $ 2,565,161 |
| Covestro AG(3) | | 72,167 | 3,107,188 |
| Sika AG | | 410 | 125,238 |
| | | | $ 5,797,587 |
| Construction & Engineering — 0.9% |
| Bouygues S.A. | | 77,836 | $ 2,676,254 |
| Skanska AB, Class B | | 61,460 | 1,174,021 |
| | | | $ 3,850,275 |
| Construction Materials — 0.2% |
| Holcim AG | | 20,421 | $ 998,495 |
| | | | $ 998,495 |
| Diversified Telecommunication Services — 1.2% |
| Elisa Oyj | | 24,907 | $ 1,460,083 |
| Swisscom AG | | 2,346 | 1,387,192 |
| Telefonica Deutschland Holding AG | | 709,041 | 2,132,461 |
| | | | $ 4,979,736 |
| Electric Utilities — 1.7% |
| Iberdrola S.A. | | 321,830 | $ 3,698,085 |
| NextEra Energy, Inc. | | 44,926 | 3,190,645 |
| | | | $ 6,888,730 |
| Electrical Equipment — 2.5% |
| AMETEK, Inc. | | 38,890 | $ 4,910,252 |
| Schneider Electric SE | | 39,317 | 5,640,775 |
| | | | $ 10,551,027 |
| Electronic Equipment, Instruments & Components — 4.0% |
| CDW Corp. | | 25,076 | $ 4,091,902 |
| Halma PLC | | 117,906 | 3,619,187 |
| Keyence Corp. | | 5,180 | 2,082,381 |
5
See Notes to Financial Statements.
Eaton Vance
Tax-Advantaged Global Dividend Opportunities Fund
April 30, 2022
Portfolio of Investments (Unaudited) — continued
| Security | Shares | Value |
| Electronic Equipment, Instruments & Components (continued) |
| TE Connectivity, Ltd. | | 29,340 | $ 3,661,045 |
| Zebra Technologies Corp., Class A(1) | | 8,333 | 3,080,377 |
| | | | $ 16,534,892 |
| Entertainment — 1.2% |
| Walt Disney Co. (The)(1)(2) | | 45,462 | $ 5,074,923 |
| | | | $ 5,074,923 |
| Equity Real Estate Investment Trusts (REITs) — 0.7% |
| American Tower Corp. | | 5,635 | $ 1,358,148 |
| Equity Residential | | 5,932 | 483,458 |
| Healthpeak Properties, Inc. | | 38,671 | 1,268,795 |
| | | | $ 3,110,401 |
| Food Products — 3.2% |
| Mondelez International, Inc., Class A | | 88,589 | $ 5,712,219 |
| Nestle S.A. | | 58,721 | 7,580,533 |
| | | | $ 13,292,752 |
| Health Care Equipment & Supplies — 3.8% |
| Alcon, Inc. | | 29,370 | $ 2,097,042 |
| Boston Scientific Corp.(1)(2) | | 153,851 | 6,478,666 |
| Intuitive Surgical, Inc.(1) | | 17,145 | 4,102,798 |
| Straumann Holding AG | | 27,050 | 3,188,967 |
| | | | $ 15,867,473 |
| Health Care Providers & Services — 1.4% |
| Anthem, Inc. | | 11,647 | $ 5,845,979 |
| | | | $ 5,845,979 |
| Hotels, Restaurants & Leisure — 1.7% |
| Compass Group PLC | | 231,566 | $ 4,886,468 |
| InterContinental Hotels Group PLC | | 37,627 | 2,402,097 |
| | | | $ 7,288,565 |
| Industrial Conglomerates — 0.8% |
| Siemens AG | | 28,692 | $ 3,527,824 |
| | | | $ 3,527,824 |
| Insurance — 4.3% |
| AIA Group, Ltd. | | 199,424 | $ 1,959,093 |
| Allianz SE | | 9,347 | 2,109,002 |
| Allstate Corp. (The) | | 22,180 | 2,806,657 |
| Arch Capital Group, Ltd.(1)(2) | | 30,678 | 1,401,064 |
| Aviva PLC | | 392,461 | 2,105,602 |
| Security | Shares | Value |
| Insurance (continued) |
| AXA S.A. | | 18,577 | $ 491,455 |
| SCOR SE | | 79,501 | 2,247,797 |
| Swiss Re AG | | 34,125 | 2,798,483 |
| Zurich Insurance Group AG | | 4,115 | 1,873,434 |
| | | | $ 17,792,587 |
| Interactive Media & Services — 5.3% |
| Alphabet, Inc., Class C(1)(2) | | 9,041 | $ 20,788,243 |
| Meta Platforms, Inc., Class A(1) | | 6,985 | 1,400,283 |
| | | | $ 22,188,526 |
| Internet & Direct Marketing Retail — 2.9% |
| Amazon.com, Inc.(1)(2) | | 4,816 | $ 11,970,794 |
| | | | $ 11,970,794 |
| IT Services — 3.3% |
| Amadeus IT Group S.A.(1) | | 45,562 | $ 2,855,048 |
| Fidelity National Information Services, Inc.(2) | | 36,286 | 3,597,757 |
| Global Payments, Inc. | | 13,890 | 1,902,652 |
| Visa, Inc., Class A | | 25,008 | 5,329,955 |
| | | | $ 13,685,412 |
| Leisure Products — 0.4% |
| Yamaha Corp. | | 46,570 | $ 1,779,299 |
| | | | $ 1,779,299 |
| Life Sciences Tools & Services — 0.6% |
| Lonza Group AG | | 4,240 | $ 2,500,047 |
| | | | $ 2,500,047 |
| Machinery — 2.1% |
| Graco, Inc. | | 31,772 | $ 1,970,499 |
| Ingersoll Rand, Inc. | | 70,776 | 3,111,313 |
| SMC Corp. | | 4,689 | 2,270,508 |
| Volvo AB, Class B | | 101,977 | 1,626,883 |
| | | | $ 8,979,203 |
| Metals & Mining — 1.7% |
| Anglo American PLC | | 86,639 | $ 3,837,326 |
| Rio Tinto, Ltd. | | 42,111 | 3,331,143 |
| | | | $ 7,168,469 |
6
See Notes to Financial Statements.
Eaton Vance
Tax-Advantaged Global Dividend Opportunities Fund
April 30, 2022
Portfolio of Investments (Unaudited) — continued
| Security | Shares | Value |
| Multi-Utilities — 0.5% |
| CMS Energy Corp. | | 28,128 | $ 1,932,112 |
| | | | $ 1,932,112 |
| Oil, Gas & Consumable Fuels — 3.3% |
| ConocoPhillips | | 41,007 | $ 3,916,988 |
| EOG Resources, Inc.(2) | | 59,897 | 6,993,574 |
| Pioneer Natural Resources Co.(2) | | 12,966 | 3,014,206 |
| | | | $ 13,924,768 |
| Pharmaceuticals — 8.5% |
| AstraZeneca PLC | | 34,370 | $ 4,586,377 |
| Eli Lilly & Co. | | 25,444 | 7,432,956 |
| Novo Nordisk A/S, Class B | | 57,955 | 6,619,981 |
| Roche Holding AG PC | | 14,431 | 5,351,213 |
| Sanofi | | 60,083 | 6,350,465 |
| Zoetis, Inc. | | 28,216 | 5,001,286 |
| | | | $ 35,342,278 |
| Professional Services — 2.6% |
| Recruit Holdings Co., Ltd. | | 73,009 | $ 2,648,883 |
| RELX PLC | | 178,205 | 5,308,812 |
| Verisk Analytics, Inc. | | 13,721 | 2,799,770 |
| | | | $ 10,757,465 |
| Semiconductors & Semiconductor Equipment — 5.3% |
| ASML Holding NV | | 14,481 | $ 8,218,525 |
| Infineon Technologies AG | | 145,473 | 4,128,991 |
| Micron Technology, Inc. | | 69,446 | 4,735,523 |
| Taiwan Semiconductor Manufacturing Co., Ltd. ADR | | 54,763 | 5,089,125 |
| | | | $ 22,172,164 |
| Software — 6.7% |
| Dassault Systemes SE | | 100,340 | $ 4,437,471 |
| Intuit, Inc. | | 8,121 | 3,400,669 |
| Microsoft Corp.(2) | | 73,375 | 20,363,030 |
| | | | $ 28,201,170 |
| Specialty Retail — 2.3% |
| Lowe's Cos., Inc. | | 24,544 | $ 4,853,085 |
| TJX Cos., Inc. (The) | | 74,239 | 4,549,366 |
| | | | $ 9,402,451 |
| Security | Shares | Value |
| Technology Hardware, Storage & Peripherals — 3.1% |
| Apple, Inc.(2) | | 81,885 | $ 12,909,170 |
| | | | $ 12,909,170 |
| Textiles, Apparel & Luxury Goods — 2.4% |
| adidas AG | | 17,929 | $ 3,615,547 |
| LVMH Moet Hennessy Louis Vuitton SE | | 9,720 | 6,290,153 |
| | | | $ 9,905,700 |
| Trading Companies & Distributors — 0.5% |
| Ashtead Group PLC | | 39,032 | $ 2,018,237 |
| | | | $ 2,018,237 |
| Wireless Telecommunication Services — 1.2% |
| Tele2 AB, Class B | | 249,493 | $ 3,306,851 |
| Vodafone Group PLC | | 1,201,361 | 1,818,811 |
| | | | $ 5,125,662 |
Total Common Stocks
(identified cost $326,563,086) | | | $ 425,995,593 |
| Corporate Bonds — 16.1% |
| Security | Principal
Amount
(000's omitted)* | Value |
| Banks — 10.2% |
| Banco Bilbao Vizcaya Argentaria S.A., 6.125% to 11/16/27(4)(5) | | 1,400 | $ 1,303,750 |
| Banco Mercantil del Norte S.A./Grand Cayman: | | | |
| 7.50% to 6/27/29(3)(4)(5) | | 1,480 | 1,421,429 |
| 7.625% to 1/10/28(3)(4)(5) | | 380 | 376,897 |
| Bank of America Corp.: | | | |
| Series AA, 6.10% to 3/17/25(4)(5) | | 1,445 | 1,461,256 |
| Series RR, 4.375% to 1/27/27(4)(5) | | 2,075 | 1,841,563 |
| Barclays PLC, 7.75% to 9/15/23(4)(5) | | 2,105 | 2,128,681 |
| BNP Paribas S.A., 4.625% to 2/25/31(3)(4)(5) | | 2,537 | 2,143,638 |
| Citigroup, Inc., Series M, 6.30% to 5/15/24(4)(5) | | 2,800 | 2,779,000 |
| Comerica, Inc., 5.625% to 7/1/25(4)(5) | | 801 | 817,360 |
| Credit Suisse Group AG: | | | |
| 5.10% to 1/24/30(3)(4)(5) | | 1,000 | 867,500 |
| 7.50% to 7/17/23(3)(4)(5) | | 1,838 | 1,824,766 |
| Deutsche Bank AG, 7.125% to 4/30/26(4)(5)(6) | GBP | 1,000 | 1,228,864 |
| HSBC Holdings PLC: | | | |
| 4.60% to 12/17/30(4)(5) | | 1,485 | 1,262,250 |
| 6.00% to 5/22/27(4)(5) | | 600 | 577,500 |
| ING Groep NV, 6.50% to 4/16/25(4)(5) | | 2,945 | 2,944,411 |
7
See Notes to Financial Statements.
Eaton Vance
Tax-Advantaged Global Dividend Opportunities Fund
April 30, 2022
Portfolio of Investments (Unaudited) — continued
| Security | Principal
Amount
(000's omitted)* | Value |
| Banks (continued) |
| JPMorgan Chase & Co.: | | | |
| Series KK, 3.65% to 6/1/26(4)(5) | | 2,204 | $ 1,983,600 |
| Series X, 6.10% to 10/1/24(4)(5) | | 960 | 962,616 |
| Lloyds Banking Group PLC, 7.50% to 6/27/24(4)(5) | | 2,447 | 2,500,516 |
| Natwest Group PLC: | | | |
| 4.60% to 6/28/31(4)(5) | | 371 | 311,724 |
| 8.00% to 8/10/25(4)(5) | | 1,880 | 1,982,159 |
| Regions Financial Corp., Series D, 5.75% to 6/15/25(4)(5) | | 1,240 | 1,267,900 |
| Societe Generale S.A.: | | | |
| 4.75% to 5/26/26(3)(4)(5) | | 1,189 | 1,058,667 |
| 5.375% to 11/18/30(3)(4)(5) | | 1,201 | 1,057,481 |
| Standard Chartered PLC, 4.75% to 1/14/31(3)(4)(5) | | 2,304 | 1,977,120 |
| SVB Financial Group., Series C, 4.00% to 5/15/26(4)(5) | | 2,007 | 1,747,997 |
| Truist Financial Corp., Series Q, 5.10% to 3/1/30(4)(5) | | 621 | 621,776 |
| Unicaja Banco S.A., 4.875% to 11/18/26(4)(5)(6) | EUR | 400 | 367,460 |
| UniCredit SpA, 7.296% to 4/2/29, 4/2/34(3)(5) | | 1,385 | 1,400,676 |
| Wells Fargo & Co., Series BB, 3.90% to 3/15/26(4)(5) | | 530 | 483,930 |
| Zions Bancorp NA, 5.80% to 6/15/23(4)(5) | | 2,020 | 1,990,230 |
| | | | $ 42,692,717 |
| Capital Markets — 1.3% |
| AerCap Holdings NV, 5.875% to 10/10/24, 10/10/79(5) | | 965 | $ 906,096 |
| Charles Schwab Corp. (The), Series I, 4.00% to 6/1/26(4)(5) | | 2,237 | 2,031,196 |
| UBS Group AG, 6.875% to 8/7/25(4)(5)(6) | | 2,421 | 2,459,155 |
| | | | $ 5,396,447 |
| Diversified Financial Services — 0.7% |
| American AgCredit Corp., Series QIB, 5.25% to 6/15/26(3)(4)(5) | | 1,301 | $ 1,188,789 |
| Discover Financial Services, Series D, 6.125% to 6/23/25(4)(5) | | 1,118 | 1,140,360 |
| Goldman Sachs Group, Inc. (The), Series V, 4.125% to 11/10/26(4)(5) | | 373 | 334,980 |
| | | | $ 2,664,129 |
| Electric Utilities — 0.8% |
| Dominion Energy, Inc., Series C, 4.35% to 1/15/27(4)(5) | | 700 | $ 642,810 |
| Edison International, Series B, 5.00% to 12/15/26(4)(5) | | 168 | 152,481 |
| Emera, Inc., Series 16-A, 6.75% to 6/15/26, 6/15/76(5) | | 970 | 986,975 |
| Southern California Edison Co., Series E, 5.485%, (3 mo. USD LIBOR + 4.199%), 6/6/22(7) | | 720 | 712,800 |
| Southern Co. (The), Series B, 4.00% to 10/15/25, 1/15/51(5) | | 990 | 943,133 |
| | | | $ 3,438,199 |
| Security | Principal
Amount
(000's omitted)* | Value |
| Food Products — 0.5% |
| Land O' Lakes, Inc., 8.00%(3)(4) | | 2,085 | $ 2,197,121 |
| | | | $ 2,197,121 |
| Independent Power and Renewable Electricity Producers — 0.2% |
| Algonquin Power & Utilities Corp., 4.75% to 1/18/27, 1/18/82(5) | | 1,039 | $ 951,662 |
| | | | $ 951,662 |
| Insurance — 0.6% |
| Liberty Mutual Group, Inc., 4.125% to 12/15/26, 12/15/51(3)(5) | | 785 | $ 713,600 |
| Prudential Financial, Inc., 5.125% to 11/28/31, 3/1/52(5) | | 546 | 531,834 |
| QBE Insurance Group, Ltd., 5.875% to 5/12/25(3)(4)(5) | | 1,253 | 1,262,398 |
| | | | $ 2,507,832 |
| Multi-Utilities — 0.5% |
| Centerpoint Energy, Inc., Series A, 6.125% to 9/1/23(4)(5) | | 2,330 | $ 2,243,429 |
| | | | $ 2,243,429 |
| Oil, Gas & Consumable Fuels — 1.1% |
| DCP Midstream, L.P., Series A, 7.375% to 12/15/22(4)(5) | | 980 | $ 933,450 |
| EnLink Midstream Partners, L.P., Series C, 6.00% to 12/15/22(4)(5) | | 1,727 | 1,281,261 |
| Odebrecht Oil & Gas Finance, Ltd., 0.00%(3)(4) | | 1,757 | 7,468 |
| Plains All American Pipeline, L.P., Series B, 6.125% to 11/15/22(4)(5) | | 2,595 | 2,186,288 |
| | | | $ 4,408,467 |
| Pipelines — 0.2% |
| Energy Transfer, L.P., Series A, 6.25% to 2/15/23(4)(5) | | 1,064 | $ 905,730 |
| | | | $ 905,730 |
Total Corporate Bonds
(identified cost $72,852,508) | | | $ 67,405,733 |
| Exchange-Traded Funds — 1.5% |
| Security | Shares | Value |
| Equity Funds — 1.5% |
| Global X U.S. Preferred ETF | | 144,775 | $ 3,145,961 |
| iShares Preferred & Income Securities ETF | | 94,700 | 3,215,065 |
Total Exchange-Traded Funds
(identified cost $7,332,281) | | | $ 6,361,026 |
8
See Notes to Financial Statements.
Eaton Vance
Tax-Advantaged Global Dividend Opportunities Fund
April 30, 2022
Portfolio of Investments (Unaudited) — continued
| Security | Shares | Value |
| Banks — 1.4% |
| AgriBank FCB, 6.875% to 1/1/24(5) | | 16,581 | $ 1,745,150 |
| CoBank ACB, Series F, 6.25% to 10/1/22(5) | | 16,600 | 1,676,600 |
| Farm Credit Bank of Texas, 6.75% to 9/15/23(3)(5) | | 2,500 | 259,375 |
| First Republic Bank, Series M, 4.00% | | 51,368 | 898,940 |
| JPMorgan Chase & Co., Series LL, 4.625% | | 20,500 | 397,290 |
| Wells Fargo & Co., Series L, 7.50% (Convertible) | | 889 | 1,077,015 |
| | | | $ 6,054,370 |
| Capital Markets — 0.5% |
| Affiliated Managers Group, Inc., 4.75% | | 18,675 | $ 367,897 |
| Stifel Financial Corp., Series D, 4.50% | | 88,925 | 1,678,015 |
| | | | $ 2,045,912 |
| Electric Utilities — 0.4% |
| SCE Trust III, Series H, 5.75% to 3/15/24(5) | | 35,476 | $ 831,557 |
| SCE Trust IV, Series J, 5.375% to 9/15/25(5) | | 14,476 | 315,577 |
| SCE Trust V, Series K, 5.45% to 3/15/26(5) | | 27,041 | 645,469 |
| | | | $ 1,792,603 |
| Equity Real Estate Investment Trusts (REITs) — 0.3% |
| SITE Centers Corp., Series A, 6.375% | | 49,475 | $ 1,219,559 |
| | | | $ 1,219,559 |
| Food Products — 0.1% |
| Ocean Spray Cranberries, Inc., Series A, 6.25%(3) | | 6,085 | $ 535,480 |
| | | | $ 535,480 |
| Insurance — 0.5% |
| American Equity Investment Life Holding Co., Series B, 6.625% to 9/1/25(5) | | 45,133 | $ 1,168,493 |
| Athene Holding, Ltd., Series C, 6.375% to 6/30/25(5) | | 29,083 | 767,210 |
| | | | $ 1,935,703 |
| Oil, Gas & Consumable Fuels — 0.6% |
| NuStar Energy, L.P., Series B, 7.625% to 6/15/22(5) | | 114,848 | $ 2,464,638 |
| | | | $ 2,464,638 |
| Pipelines — 0.4% |
| Energy Transfer, L.P.: | | | |
| Series C, 7.375% to 5/15/23(5) | | 44,000 | $ 1,045,880 |
| Series E, 7.60% to 5/15/24(5) | | 19,280 | 466,576 |
| | | | $ 1,512,456 |
| Security | Shares | Value |
| Real Estate Management & Development — 0.5% |
| Brookfield Property Partners, L.P.: | | | |
| Series A, 5.75% | | 5,394 | $ 106,531 |
| Series A-1, 6.50% | | 52,225 | 1,145,816 |
| Series A2, 6.375% | | 34,695 | 731,718 |
| | | | $ 1,984,065 |
| Telecommunications — 0.2% |
| United States Cellular Corp., 5.50% | | 32,000 | $ 642,560 |
| | | | $ 642,560 |
Total Preferred Stocks
(identified cost $22,203,538) | | | $ 20,187,346 |
| Short-Term Investments — 0.0%(8) |
| Security | Shares | Value |
| Morgan Stanley Institutional Liquidity Funds - Government Portfolio, Institutional Class, 0.30%(9) | | 161,332 | $ 161,332 |
Total Short-Term Investments
(identified cost $161,332) | | | $ 161,332 |
Total Investments — 124.3%(10)
(identified cost $429,112,745) | | | $ 520,111,030 |
| Other Assets, Less Liabilities — (24.3)% | | | $ (101,740,357) |
| Net Assets — 100.0% | | | $ 418,370,673 |
| The percentage shown for each investment category in the Portfolio of Investments is based on net assets. |
| * | In U.S. dollars unless otherwise indicated. |
| (1) | Non-income producing security. |
| (2) | All or a portion of this security was on loan at April 30, 2022 pursuant to the Liquidity Agreement (see Note 7). The aggregate market value of securities on loan at April 30, 2022 was $81,152,390. |
| (3) | Security exempt from registration under Rule 144A of the Securities Act of 1933, as amended. These securities may be sold in certain transactions in reliance on an exemption from registration (normally to qualified institutional buyers). At April 30, 2022, the aggregate value of these securities is $21,399,593 or 5.1% of the Fund's net assets. |
| (4) | Perpetual security with no stated maturity date but may be subject to calls by the issuer. |
| (5) | Security converts to variable rate after the indicated fixed-rate coupon period. |
9
See Notes to Financial Statements.
Eaton Vance
Tax-Advantaged Global Dividend Opportunities Fund
April 30, 2022
Portfolio of Investments (Unaudited) — continued
| (6) | Security exempt from registration under Regulation S of the Securities Act of 1933, as amended, which exempts from registration securities offered and sold outside the United States. Security may not be offered or sold in the United States except pursuant to an exemption from, or in a transaction not subject to, the registration requirements of the Securities Act of 1933, as amended. At April 30, 2022, the aggregate value of these securities is $4,055,479 or 1.0% of the Fund's net assets. |
| (7) | Variable rate security. The stated interest rate represents the rate in effect at April 30, 2022. |
| (8) | Amount is less than 0.05%. |
| (9) | May be deemed to be an affiliated investment company. The rate shown is the annualized seven-day yield as of April 30, 2022. |
| (10) | The Fund has granted a security interest in all the Fund's investments, unless otherwise pledged, in connection with the Liquidity Agreement (see Note 7). |
| Country Concentration of Portfolio |
| Country | Percentage of
Total Investments | Value |
| United States | 51.2% | $266,086,455 |
| United Kingdom | 9.3 | 48,594,987 |
| France | 7.5 | 39,189,299 |
| Switzerland | 7.1 | 36,713,110 |
| Germany | 5.5 | 28,460,489 |
| Netherlands | 3.5 | 18,416,604 |
| Sweden | 3.1 | 15,870,807 |
| Spain | 2.2 | 11,308,452 |
| Japan | 1.7 | 8,781,071 |
| Australia | 1.5 | 7,832,840 |
| Denmark | 1.3 | 6,619,981 |
| Canada | 1.2 | 6,286,654 |
| Taiwan | 1.0 | 5,089,125 |
| Ireland | 0.6 | 3,246,398 |
| India | 0.5 | 2,807,433 |
| Hong Kong | 0.4 | 1,959,093 |
| Norway | 0.3 | 1,820,653 |
| Mexico | 0.3 | 1,798,326 |
| Finland | 0.3 | 1,460,083 |
| Italy | 0.3 | 1,400,676 |
| Brazil | 0.0 (1) | 7,468 |
| Exchange-Traded Funds | 1.2 | 6,361,026 |
| Total Investments | 100.0% | $520,111,030 |
| (1) | Amount is less than 0.05%. |
10
See Notes to Financial Statements.
Eaton Vance
Tax-Advantaged Global Dividend Opportunities Fund
April 30, 2022
Portfolio of Investments (Unaudited) — continued
| Forward Foreign Currency Exchange Contracts (OTC) |
| Currency Purchased | Currency Sold | Counterparty | Settlement
Date | Unrealized
Appreciation | Unrealized
(Depreciation) |
| USD | 112,365 | EUR | 100,000 | Bank of America, N.A. | 5/31/22 | $ 6,745 | $ — |
| USD | 112,336 | EUR | 100,000 | Bank of America, N.A. | 5/31/22 | 6,717 | — |
| USD | 101,072 | EUR | 90,000 | Bank of America, N.A. | 5/31/22 | 6,015 | — |
| USD | 64,099 | EUR | 57,033 | State Street Bank and Trust Company | 5/31/22 | 3,861 | — |
| USD | 56,149 | EUR | 50,000 | State Street Bank and Trust Company | 5/31/22 | 3,340 | — |
| USD | 1,494,875 | GBP | 1,117,863 | State Street Bank and Trust Company | 5/31/22 | 89,245 | — |
| | | | | | | $115,923 | $ — |
| Futures Contracts |
| Description | Number of
Contracts | Position | Expiration
Date | Notional
Amount | Value/Unrealized
Appreciation
(Depreciation) |
| Equity Futures | | | | | |
| E-Mini S&P 500 Index | 89 | Long | 6/17/22 | $ 18,367,375 | $ (307,490) |
| STOXX Europe 600 Index | (446) | Short | 6/17/22 | (10,487,619) | (365,938) |
| STOXX Europe 600 Insurance Index | (499) | Short | 6/17/22 | (8,120,031) | 211,508 |
| | | | | | $ (461,920) |
| Abbreviations: |
| ADR | – American Depositary Receipt |
| LIBOR | – London Interbank Offered Rate |
| OTC | – Over-the-counter |
| PC | – Participation Certificate |
| Currency Abbreviations: |
| EUR | – Euro |
| GBP | – British Pound Sterling |
| USD | – United States Dollar |
11
See Notes to Financial Statements.
Eaton Vance
Tax-Advantaged Global Dividend Opportunities Fund
April 30, 2022
Statement of Assets and Liabilities (Unaudited)
| | April 30, 2022 |
| Assets | |
| Unaffiliated investments, at value (identified cost $428,951,413) — including $81,152,390 of securities on loan | $ 519,949,698 |
| Affiliated investment, at value (identified cost $161,332) | 161,332 |
| Cash | 145,554 |
| Foreign currency, at value (identified cost $235,519) | 236,111 |
| Dividends and interest receivable | 2,267,845 |
| Dividends receivable from affiliated investment | 98 |
| Receivable for investments sold | 179,470 |
| Receivable for open forward foreign currency exchange contracts | 115,923 |
| Tax reclaims receivable | 597,574 |
| Total assets | $523,653,605 |
| Liabilities | |
| Liquidity Agreement borrowings | $ 103,000,000 |
| Payable for investments purchased | 786,625 |
| Payable for variation margin on open futures contracts | 810,210 |
| Payable to affiliates: | |
| Investment adviser fee | 386,074 |
| Trustees' fees | 2,615 |
| Accrued foreign capital gains taxes | 70,609 |
| Accrued expenses | 226,799 |
| Total liabilities | $105,282,932 |
| Net Assets | $418,370,673 |
| Sources of Net Assets | |
| Common shares, $0.01 par value, unlimited number of shares authorized | $ 163,715 |
| Additional paid-in capital | 326,028,240 |
| Distributable earnings | 92,178,718 |
| Net Assets | $418,370,673 |
| Common Shares Issued and Outstanding | 16,371,459 |
| Net Asset Value Per Common Share | |
| Net assets ÷ common shares issued and outstanding | $ 25.55 |
12
See Notes to Financial Statements.
Eaton Vance
Tax-Advantaged Global Dividend Opportunities Fund
April 30, 2022
Statement of Operations (Unaudited)
| | Six Months Ended |
| | April 30, 2022 |
| Investment Income | |
| Dividend income (net of foreign taxes withheld of $721,653) | $ 7,248,428 |
| Dividend income from affiliated investment | 1,432 |
| Interest income | 1,793,573 |
| Other income | 283,053 |
| Total investment income | $ 9,326,486 |
| Expenses | |
| Investment adviser fee | $ 2,464,137 |
| Trustees’ fees and expenses | 15,684 |
| Custodian fee | 95,013 |
| Transfer and dividend disbursing agent fees | 9,124 |
| Legal and accounting services | 39,785 |
| Printing and postage | 82,705 |
| Interest expense and fees | 370,122 |
| Miscellaneous | 27,071 |
| Total expenses | $ 3,103,641 |
| Deduct: | |
| Waiver and/or reimbursement of expenses by affiliate | $ 45 |
| Total expense reductions | $ 45 |
| Net expenses | $ 3,103,596 |
| Net investment income | $ 6,222,890 |
| Realized and Unrealized Gain (Loss) | |
| Net realized gain (loss): | |
| Investment transactions | $ 10,644,069 |
| Investment transactions - affiliated investment | 863,570 |
| Proceeds from securities litigation settlements | 11,705 |
| Futures contracts | (569,025) |
| Foreign currency transactions | 5,080 |
| Net realized gain | $ 10,955,399 |
| Change in unrealized appreciation (depreciation): | |
| Investments (including net increase in accrued foreign capital gains taxes of $70,609) | $ (93,727,945) |
| Investments - affiliated investment | (554,211) |
| Futures contracts | (461,920) |
| Foreign currency | (55,965) |
| Forward foreign currency exchange contracts | 115,923 |
| Net change in unrealized appreciation (depreciation) | $(94,684,118) |
| Net realized and unrealized loss | $(83,728,719) |
| Net decrease in net assets from operations | $(77,505,829) |
13
See Notes to Financial Statements.
Eaton Vance
Tax-Advantaged Global Dividend Opportunities Fund
April 30, 2022
Statements of Changes in Net Assets
| | Six Months Ended
April 30, 2022
(Unaudited) | Year Ended
October 31, 2021 |
| Increase (Decrease) in Net Assets | | |
| From operations: | | |
| Net investment income | $ 6,222,890 | $ 7,405,992 |
| Net realized gain | 10,955,399 | 22,983,200 |
| Net change in unrealized appreciation (depreciation) | (94,684,118) | 138,609,052 |
| Net increase (decrease) in net assets from operations | $ (77,505,829) | $168,998,244 |
| Distributions to shareholders | $ (17,455,693) | $ (28,655,436) |
| Capital share transactions: | | |
| Proceeds from shelf offering, net of offering costs (see Note 5) | $ 9,121,556 | $ 12,092,982 |
| Reinvestment of distributions | 395,283 | 226,214 |
| Net increase in net assets from capital share transactions | $ 9,516,839 | $ 12,319,196 |
| Net increase (decrease) in net assets | $ (85,444,683) | $152,662,004 |
| Net Assets | | |
| At beginning of period | $ 503,815,356 | $ 351,153,352 |
| At end of period | $418,370,673 | $503,815,356 |
14
See Notes to Financial Statements.
Eaton Vance
Tax-Advantaged Global Dividend Opportunities Fund
April 30, 2022
Statement of Cash Flows (Unaudited)
| | Six Months Ended |
| | April 30, 2022 |
| Cash Flows From Operating Activities | |
| Net decrease in net assets from operations | $ (77,505,829) |
| Adjustments to reconcile net decrease in net assets from operations to net cash provided by operating activities: | |
| Investments purchased | (129,553,633) |
| Investments sold | 130,893,204 |
| Decrease in short-term investments, net | 2,058,591 |
| Net amortization/accretion of premium (discount) | 213,696 |
| Increase in dividends and interest receivable | (1,203,294) |
| Decrease in dividends receivable from affiliated investments | 81,235 |
| Increase in receivable for open forward foreign currency exchange contracts | (115,923) |
| Decrease in receivable from the transfer agent | 76,386 |
| Increase in tax reclaims receivable | (217,133) |
| Increase in payable for variation margin on open futures contracts | 810,210 |
| Decrease in payable to affiliate for investment adviser fee | (40,852) |
| Increase in payable to affiliate for Trustees' fees | 306 |
| Decrease in accrued expenses | (85,005) |
| Net change in unrealized (appreciation) depreciation from investments | 94,282,156 |
| Net realized gain from investments | (11,507,639) |
| Net cash provided by operating activities | $ 8,186,476 |
| Cash Flows From Financing Activities | |
| Cash distributions paid | $ (17,060,410) |
| Proceeds from shelf offering, net of offering costs | 9,251,186 |
| Net cash used in financing activities | $ (7,809,224) |
| Net increase in cash | $ 377,252 |
| Cash at beginning of period (including foreign currency) | $ 4,413 |
| Cash at end of period (including foreign currency) | $ 381,665 |
| Supplemental disclosure of cash flow information: | |
| Noncash financing activities not included herein consist of: | |
| Reinvestment of dividends and distributions | $ 395,283 |
| Cash paid for interest and fees on borrowings | 342,265 |
15
See Notes to Financial Statements.
Eaton Vance
Tax-Advantaged Global Dividend Opportunities Fund
April 30, 2022
| | Six Months Ended
April 30, 2022
(Unaudited) | Year Ended October 31, |
| | | 2021 | 2020 | 2019 | 2018 | 2017 |
| Net asset value — Beginning of period | $ 31.370 | $ 22.390 | $ 23.850 | $ 22.180 | $ 24.600 | $ 21.790 |
| Income (Loss) From Operations | | | | | | |
| Net investment income(1) | $ 0.384 | $ 0.471 | $ 0.361 | $ 0.441 | $ 0.447 | $ 0.490 |
| Net realized and unrealized gain (loss) | (5.144) | 10.303 | 0.098 | 3.389 | (0.724) | 4.480 |
| Total income (loss) from operations | $ (4.760) | $ 10.774 | $ 0.459 | $ 3.830 | $ (0.277) | $ 4.970 |
| Less Distributions | | | | | | |
| From net investment income | $ (1.075)* | $ (0.846) | $ (0.338) | $ (0.407) | $ (0.319) | $ (0.475) |
| From net realized gain | — | (0.974) | (1.597) | (1.753) | (1.841) | (1.685) |
| Total distributions | $ (1.075) | $ (1.820) | $ (1.935) | $ (2.160) | $ (2.160) | $ (2.160) |
| Premium from common shares sold through shelf offering (see Note 5)(1) | $ 0.015 | $ 0.026 | $ 0.016 | $ — | $ 0.017 | $ — |
| Net asset value — End of period | $ 25.550 | $ 31.370 | $ 22.390 | $ 23.850 | $ 22.180 | $ 24.600 |
| Market value — End of period | $ 24.590 | $ 32.340 | $ 19.740 | $ 26.290 | $ 21.690 | $ 24.850 |
| Total Investment Return on Net Asset Value(2) | (15.47)% (3) | 49.45% | 2.57% | 18.21% | (1.50)% | 23.92% |
| Total Investment Return on Market Value(2) | (21.08)% (3) | 74.75% | (17.96)% | 33.25% | (4.65)% | 31.96% |
| Ratios/Supplemental Data | | | | | | |
| Net assets, end of period (000’s omitted) | $418,371 | $503,815 | $351,153 | $359,796 | $333,771 | $357,756 |
| Ratios (as a percentage of average daily net assets): | | | | | | |
| Expenses excluding interest and fees | 1.15% (4)(5) | 1.15% | 1.24% | 1.28% | 1.27% | 1.30% |
| Interest and fee expense | 0.15% (4) | 0.14% | 0.50% | 1.06% | 0.82% | 0.61% |
| Total expenses | 1.30% (4)(5) | 1.29% | 1.74% | 2.34% | 2.09% | 1.91% |
| Net investment income | 2.61% (4) | 1.63% | 1.58% | 1.95% | 1.83% | 2.10% |
| Portfolio Turnover | 22% (3) | 29% | 60% | 48% | 56% | 60% |
| Senior Securities: | | | | | | |
| Total amount outstanding (in 000’s) | $103,000 | $103,000 | $103,000 | $118,000 | $118,000 | $118,000 |
| Asset coverage per $1,000(6) | $ 5,062 | $ 5,891 | $ 4,409 | $ 4,049 | $ 3,829 | $ 4,032 |
| (1) | Computed using average shares outstanding. |
| (2) | Returns are historical and are calculated by determining the percentage change in net asset value or market value with all distributions reinvested. Distributions are assumed to be reinvested at prices obtained under the Fund’s dividend reinvestment plan. |
| (3) | Not annualized. |
| (4) | Annualized. |
| (5) | The investment adviser reduced a portion of its adviser fee (equal to less than 0.005% of average daily net assets for the six months ended April 30, 2022). |
| (6) | Calculated by subtracting the Fund’s total liabilities (not including the borrowings payable/notes payable) from the Fund’s total assets, and dividing the result by the borrowings payable/notes payable balance in thousands. |
| * | A portion of the distributions may be deemed from net realized gain or a tax return of capital at year-end. |
16
See Notes to Financial Statements.
Eaton Vance
Tax-Advantaged Global Dividend Opportunities Fund
April 30, 2022
Notes to Financial Statements (Unaudited)
1 Significant Accounting Policies
Eaton Vance Tax-Advantaged Global Dividend Opportunities Fund (the Fund) is a Massachusetts business trust registered under the Investment Company Act of 1940, as amended (the 1940 Act), as a diversified, closed-end management investment company. The Fund’s investment objective is to provide a high level of after-tax total return consisting primarily of tax-advantaged dividend income and capital appreciation. The Fund pursues its objective by investing primarily in dividend-paying common and preferred stocks.
The following is a summary of significant accounting policies of the Fund. The policies are in conformity with accounting principles generally accepted in the United States of America (U.S. GAAP). The Fund is an investment company and follows accounting and reporting guidance in the Financial Accounting Standards Board (FASB) Accounting Standards Codification Topic 946.
A Investment Valuation—The following methodologies are used to determine the market value or fair value of investments.
Equity Securities. Equity securities listed on a U.S. securities exchange generally are valued at the last sale or closing price on the day of valuation or, if no sales took place on such date, at the mean between the closing bid and ask prices on the exchange where such securities are principally traded. Equity securities listed on the NASDAQ National Market System are valued at the NASDAQ official closing price. Unlisted or listed securities for which closing sales prices or closing quotations are not available are valued at the mean between the latest available bid and ask prices or, in the case of preferred equity securities that are not listed or traded in the over-the-counter market, by a third party pricing service that uses various techniques that consider factors including, but not limited to, prices or yields of securities with similar characteristics, benchmark yields, broker/dealer quotes, quotes of underlying common stock, issuer spreads, as well as industry and economic events.
Debt Obligations. Debt obligations are generally valued on the basis of valuations provided by third party pricing services, as derived from such services’ pricing models. Inputs to the models may include, but are not limited to, reported trades, executable bid and ask prices, broker/dealer quotations, prices or yields of securities with similar characteristics, interest rates, anticipated prepayments, benchmark curves or information pertaining to the issuer, as well as industry and economic events. The pricing services may use a matrix approach, which considers information regarding securities with similar characteristics to determine the valuation for a security. Short-term debt obligations purchased with a remaining maturity of sixty days or less for which a valuation from a third party pricing service is not readily available may be valued at amortized cost, which approximates fair value.
Derivatives. Futures contracts are valued at the closing settlement price established by the board of trade or exchange on which they are traded, with adjustments for fair valuation for certain foreign futures contracts as described below. Forward foreign currency exchange contracts are generally valued at the mean of the average bid and average ask prices that are reported by currency dealers to a third party pricing service at the valuation time. Such third party pricing service valuations are supplied for specific settlement periods and the Fund's forward foreign currency exchange contracts are valued at an interpolated rate between the closest preceding and subsequent settlement period reported by the third party pricing service.
Foreign Securities, Futures Contracts and Currencies. Foreign securities, futures contracts and currencies are valued in U.S. dollars, based on foreign currency exchange rate quotations supplied by a third party pricing service. The pricing service uses a proprietary model to determine the exchange rate. Inputs to the model include reported trades and implied bid/ask spreads. The daily valuation of exchange-traded foreign securities and certain exchange-traded foreign futures contracts generally is determined as of the close of trading on the principal exchange on which such securities and contracts trade. Events occurring after the close of trading on foreign exchanges may result in adjustments to the valuation of foreign securities and certain foreign futures contracts to more accurately reflect their fair value as of the close of regular trading on the New York Stock Exchange. When valuing foreign equity securities and foreign futures contracts that meet certain criteria, the Fund’s Trustees have approved the use of a fair value service that values such securities and foreign futures contracts to reflect market trading that occurs after the close of the applicable foreign markets of comparable securities or other instruments that have a strong correlation to the fair-valued securities and foreign futures contracts.
Other. Investments in management investment companies (including money market funds) that do not trade on an exchange are valued at the net asset value as of the close of each business day.
Fair Valuation. Investments for which valuations or market quotations are not readily available or are deemed unreliable are valued at fair value using methods determined in good faith by or at the direction of the Trustees of the Fund in a manner that most fairly reflects the security’s “fair value”, which is the amount that the Fund might reasonably expect to receive for the security upon its current sale in the ordinary course. Each such determination is based on a consideration of relevant factors, which are likely to vary from one pricing context to another. These factors may include, but are not limited to, the type of security, the existence of any contractual restrictions on the security’s disposition, the price and extent of public trading in similar securities of the issuer or of comparable companies or entities, quotations or relevant information obtained from broker/dealers or other market participants, information obtained from the issuer, analysts, and/or the appropriate stock exchange (for exchange-traded securities), an analysis of the company’s or entity’s financial statements, and an evaluation of the forces that influence the issuer and the market(s) in which the security is purchased and sold.
B Investment Transactions—Investment transactions for financial statement purposes are accounted for on a trade date basis. Realized gains and losses on investments sold are determined on the basis of identified cost.
C Income—Dividend income is recorded on the ex-dividend date for dividends received in cash and/or securities. However, if the ex-dividend date has passed, certain dividends from foreign securities are recorded as the Fund is informed of the ex-dividend date. Withholding taxes on foreign dividends, interest and capital gains have been provided for in accordance with the Fund's understanding of the applicable countries’ tax rules and rates. In
Eaton Vance
Tax-Advantaged Global Dividend Opportunities Fund
April 30, 2022
Notes to Financial Statements (Unaudited) — continued
consideration of recent decisions rendered by European courts, the Fund has filed additional tax reclaims for previously withheld taxes on dividends earned in certain European Union countries. These filings are subject to various administrative and judicial proceedings within these countries. During the six months ended April 30, 2022, the Fund received approximately $283,000 for previously withheld foreign taxes and interest thereon. Such amount is included in other income on the Statement of Operations. No other amounts for additional tax reclaims are reflected in the financial statements due to the uncertainty as to the ultimate resolution of proceedings, the likelihood of receipt of these reclaims, and the potential timing of payment. Interest income is recorded on the basis of interest accrued, adjusted for amortization of premium or accretion of discount. Distributions from investment companies are recorded as dividend income, capital gains or return of capital based on the nature of the distribution.
D Federal and Other Taxes—The Fund’s policy is to comply with the provisions of the Internal Revenue Code applicable to regulated investment companies and to distribute to shareholders each year substantially all of its net investment income, and all or substantially all of its net realized capital gains. Accordingly, no provision for federal income or excise tax is necessary.
In addition to the requirements of the Internal Revenue Code, the Fund may also be subject to local taxes on the recognition of capital gains in certain countries. In determining the daily net asset value, the Fund estimates the accrual for such taxes, if any, based on the unrealized appreciation on certain portfolio securities and the related tax rates. Taxes attributable to unrealized appreciation are included in the change in unrealized appreciation (depreciation) on investments. Capital gains taxes on securities sold are included in net realized gain (loss) on investments.
As of April 30, 2022, the Fund had no uncertain tax positions that would require financial statement recognition, de-recognition, or disclosure. The Fund files a U.S. federal income tax return annually after its fiscal year-end, which is subject to examination by the Internal Revenue Service for a period of three years from the date of filing.
E Foreign Currency Translation—Investment valuations, other assets, and liabilities initially expressed in foreign currencies are translated each business day into U.S. dollars based upon current exchange rates. Purchases and sales of foreign investment securities and income and expenses denominated in foreign currencies are translated into U.S. dollars based upon currency exchange rates in effect on the respective dates of such transactions. Recognized gains or losses on investment transactions attributable to changes in foreign currency exchange rates are recorded for financial statement purposes as net realized gains and losses on investments. That portion of unrealized gains and losses on investments that results from fluctuations in foreign currency exchange rates is not separately disclosed.
F Use of Estimates—The preparation of the financial statements in conformity with U.S. GAAP requires management to make estimates and assumptions that affect the reported amounts of assets and liabilities at the date of the financial statements and the reported amounts of income and expense during the reporting period. Actual results could differ from those estimates.
G Indemnifications—Under the Fund’s organizational documents, its officers and Trustees may be indemnified against certain liabilities and expenses arising out of the performance of their duties to the Fund. Under Massachusetts law, if certain conditions prevail, shareholders of a Massachusetts business trust (such as the Fund) could be deemed to have personal liability for the obligations of the Fund. However, the Fund’s Declaration of Trust contains an express disclaimer of liability on the part of Fund shareholders and the By-laws provide that the Fund shall assume, upon request by the shareholder, the defense on behalf of any Fund shareholders. Moreover, the By-laws also provide for indemnification out of Fund property of any shareholder held personally liable solely by reason of being or having been a shareholder for all loss or expense arising from such liability. Additionally, in the normal course of business, the Fund enters into agreements with service providers that may contain indemnification clauses. The Fund’s maximum exposure under these arrangements is unknown as this would involve future claims that may be made against the Fund that have not yet occurred.
H Futures Contracts—Upon entering into a futures contract, the Fund is required to deposit with the broker, either in cash or securities, an amount equal to a certain percentage of the contract amount (initial margin). Subsequent payments, known as variation margin, are made or received by the Fund each business day, depending on the daily fluctuations in the value of the underlying security or index, and are recorded as unrealized gains or losses by the Fund. Gains (losses) are realized upon the expiration or closing of the futures contracts. Should market conditions change unexpectedly, the Fund may not achieve the anticipated benefits of the futures contracts and may realize a loss. Futures contracts have minimal counterparty risk as they are exchange traded and the clearinghouse for the exchange is substituted as the counterparty, guaranteeing counterparty performance.
I Forward Foreign Currency Exchange Contracts—The Fund may enter into forward foreign currency exchange contracts for the purchase or sale of a specific foreign currency at a fixed price on a future date. The forward foreign currency exchange contracts are adjusted by the daily exchange rate of the underlying currency and any gains or losses are recorded as unrealized until such time as the contracts have been closed. Risks may arise upon entering these contracts from the potential inability of counterparties to meet the terms of their contracts and from movements in the value of a foreign currency relative to the U.S. dollar.
J Interim Financial Statements—The interim financial statements relating to April 30, 2022 and for the six months then ended have not been audited by an independent registered public accounting firm, but in the opinion of the Fund’s management, reflect all adjustments, consisting only of normal recurring adjustments, necessary for the fair presentation of the financial statements.
Eaton Vance
Tax-Advantaged Global Dividend Opportunities Fund
April 30, 2022
Notes to Financial Statements (Unaudited) — continued
2 Distributions to Shareholders and Income Tax Information
Subject to its Managed Distribution Plan, the Fund intends to make monthly distributions from its net investment income, net capital gain (which is the excess of net long-term capital gain over net short-term capital loss) and other sources. The Fund intends to distribute all or substantially all of its net realized capital gains. Distributions are recorded on the ex-dividend date. Distributions to shareholders are determined in accordance with income tax regulations, which may differ from U.S. GAAP. As required by U.S. GAAP, only distributions in excess of tax basis earnings and profits are reported in the financial statements as a return of capital. Permanent differences between book and tax accounting relating to distributions are reclassified to paid-in capital. For tax purposes, distributions from short-term capital gains are considered to be from ordinary income. Distributions in any year may include a return of capital component.
The cost and unrealized appreciation (depreciation) of investments, including open derivative contracts, of the Fund at April 30, 2022, as determined on a federal income tax basis, were as follows:
| Aggregate cost | $ 429,503,891 |
| Gross unrealized appreciation | $ 113,096,585 |
| Gross unrealized depreciation | (22,835,443) |
| Net unrealized appreciation | $ 90,261,142 |
3 Investment Adviser Fee and Other Transactions with Affiliates
The investment adviser fee is earned by Eaton Vance Management (EVM), an indirect, wholly-owned subsidiary of Morgan Stanley, as compensation for investment advisory services rendered to the Fund. The fee is computed at an annual rate of 0.85% of the Fund's average daily gross assets and is payable monthly. Gross assets, as defined in the Fund's investment advisory agreement, means total assets of the Fund, including any form of investment leverage, minus all accrued expenses incurred in the normal course of operations, but not excluding any liabilities or obligations attributable to investment leverage obtained through (i) indebtedness of any type (including, without limitation, borrowing through a credit facility or the issuance of debt securities), (ii) the issuance of preferred stock or other similar preference securities, (iii) the reinvestment of collateral received for securities loaned in accordance with the Fund's investment objectives and policies, and/or (iv) any other means. Accrued expenses includes other liabilities other than indebtedness attributable to leverage. For the six months ended April 30, 2022, the Fund's investment adviser fee amounted to $2,464,137. Effective April 26, 2022, the Fund may invest in a money market fund, the Institutional Class of the Morgan Stanley Institutional Liquidity Funds — Government Portfolio (the "Liquidity Fund"), an open-end management investment company managed by Morgan Stanley Investment Management Inc., a wholly-owned subsidiary of Morgan Stanley. The investment adviser fee paid by the Fund is reduced by an amount equal to its pro-rata share of the advisory and administration fees paid by the Fund due to its investment in the Liquidity Fund. For the six months ended April 30, 2022, the investment adviser fee paid was reduced by $45 relating to the Fund's investment in the Liquidity Fund. Prior to April 26, 2022, the Fund may have invested its cash in Eaton Vance Cash Reserves Fund (Cash Reserves Fund), an affiliated investment company managed by EVM. EVM did not receive a fee for advisory services provided to Cash Reserves Fund.
Pursuant to an investment sub-advisory agreement, EVM has delegated the investment management of the Fund to Eaton Vance Advisers International Ltd. (EVAIL), an affiliate of EVM and an indirect, wholly-owned subsidiary of Morgan Stanley. EVM pays EVAIL a portion of its investment adviser fee for sub-advisory services provided to the Fund. EVM also serves as administrator of the Fund, but receives no compensation.
Trustees and officers of the Fund who are members of EVM’s organization receive remuneration for their services to the Fund out of the investment adviser fee. Trustees of the Fund who are not affiliated with EVM may elect to defer receipt of all or a percentage of their annual fees in accordance with the terms of the Trustees Deferred Compensation Plan. For the six months ended April 30, 2022, no significant amounts have been deferred. Certain officers and Trustees of the Fund are officers of EVM.
4 Purchases and Sales of Investments
Purchases and sales of investments, other than short-term obligations, aggregated $130,340,258 and $129,100,242, respectively, for the six months ended April 30, 2022.
5 Common Shares of Beneficial Interest and Shelf Offering
Common shares issued by the Fund pursuant to its dividend reinvestment plan for the six months ended April 30, 2022 and the year ended October 31, 2021 were 13,258 and 7,334, respectively.
Eaton Vance
Tax-Advantaged Global Dividend Opportunities Fund
April 30, 2022
Notes to Financial Statements (Unaudited) — continued
In November 2013, the Board of Trustees initially approved a share repurchase program for the Fund. Pursuant to the reauthorization of the share repurchase program by the Board of Trustees in March 2019, the Fund is authorized to repurchase up to 10% of its common shares outstanding as of the last day of the prior calendar year at market prices when shares are trading at a discount to net asset value. The share repurchase program does not obligate the Fund to purchase a specific amount of shares. There were no repurchases of common shares by the Fund for the six months ended April 30, 2022 and the year ended October 31, 2021.
Pursuant to a registration statement filed with the SEC, the Fund is authorized to issue up to an additional 3,044,665 common shares through an equity shelf offering program (the “shelf offering”). Under the shelf offering, the Fund, subject to market conditions, may raise additional capital from time to time and in varying amounts and offering methods at a net price at or above the Fund’s net asset value per common share. During the six months ended April 30, 2022 and the year ended October 31, 2021, the Fund sold 295,798 and 373,843 common shares, respectively, and received proceeds (net of offering costs) of $9,121,556 and $12,092,982, respectively, through its shelf offering. The net proceeds in excess of the net asset value of the shares sold were $244,239 for the six months ended April 30, 2022 and $412,953 for the year ended October 31, 2021. Offering costs (other than the applicable sales commissions) incurred in connection with the shelf offering were borne directly by EVM. Eaton Vance Distributors, Inc. (EVD), an affiliate of EVM, is the distributor of the Fund’s shares and is entitled to receive a sales commission from the Fund of 1.00% of the gross sales price per share, a portion of which is re-allowed to sales agents. The Fund was informed that the sales commissions retained by EVD during the six months ended April 30, 2022 and the year ended October 31, 2021 were $18,427 and $24,430, respectively.
6 Financial Instruments
The Fund may trade in financial instruments with off-balance sheet risk in the normal course of its investing activities. These financial instruments may include forward foreign currency exchange contracts and futures contracts and may involve, to a varying degree, elements of risk in excess of the amounts recognized for financial statement purposes. The notional or contractual amounts of these instruments represent the investment the Fund has in particular classes of financial instruments and do not necessarily represent the amounts potentially subject to risk. The measurement of the risks associated with these instruments is meaningful only when all related and offsetting transactions are considered. A summary of obligations under these financial instruments at April 30, 2022 is included in the Portfolio of Investments. At April 30, 2022, the Fund had sufficient cash and/or securities to cover commitments under these contracts.
In the normal course of pursuing its investment objective, the Fund is subject to the following risks:
Equity Price Risk: The Fund enters into equity futures contracts on securities indices to gain or limit exposure to certain markets, particularly in connection with engaging in the dividend capture trading strategy.
Foreign Exchange Risk: The Fund engages in forward foreign currency exchange contracts to seek to hedge against fluctuations in currency exchange rates.
The Fund enters into forward foreign currency exchange contracts that may contain provisions whereby the counterparty may terminate the contract under certain conditions, including but not limited to a decline in the Fund's net assets below a certain level over a certain period of time, which would trigger a payment by the Fund for those derivatives in a liability position. At April 30, 2022, the Fund had no open derivatives with credit-related contingent features in a net liability position.
The over-the-counter (OTC) derivatives in which the Fund invests are subject to the risk that the counterparty to the contract fails to perform its obligations under the contract. To mitigate this risk, the Fund has entered into an International Swaps and Derivatives Association, Inc. Master Agreement (“ISDA Master Agreement”) or similar agreement with substantially all its derivative counterparties. An ISDA Master Agreement is a bilateral agreement between the Fund and a counterparty that governs certain OTC derivatives and typically contains, among other things, set-off provisions in the event of a default and/or termination event as defined under the relevant ISDA Master Agreement. Under an ISDA Master Agreement, the Fund may, under certain circumstances, offset with the counterparty certain derivative financial instruments’ payables and/or receivables with collateral held and/or posted and create one single net payment. The provisions of the ISDA Master Agreement typically permit a single net payment in the event of default including the bankruptcy or insolvency of the counterparty. However, bankruptcy or insolvency laws of a particular jurisdiction may impose restrictions on or prohibitions against the right of offset in bankruptcy or insolvency. Certain ISDA Master Agreements allow counterparties to OTC derivatives to terminate derivative contracts prior to maturity in the event the Fund’s net assets decline by a stated percentage or the Fund fails to meet the terms of its ISDA Master Agreements, which would cause the counterparty to accelerate payment by the Fund of any net liability owed to it.
The collateral requirements for derivatives traded under an ISDA Master Agreement are governed by a Credit Support Annex to the ISDA Master Agreement. Collateral requirements are determined at the close of business each day and are typically based on changes in market values for each transaction under an ISDA Master Agreement and netted into one amount for such agreement. Generally, the amount of collateral due from or to a counterparty is subject to a minimum transfer threshold amount before a transfer is required, which may vary by counterparty. Collateral pledged for the benefit of the Fund and/or counterparty is held in segregated accounts by the Fund’s custodian and cannot be sold, re-pledged, assigned or otherwise used while pledged. The portion of such collateral representing cash, if any, is reflected as deposits for derivatives collateral and, in the case of cash pledged by a counterparty for the benefit of the Fund, a corresponding liability on the Statement of Assets and Liabilities. Securities pledged by the Fund as collateral, if any, are identified as such in the Portfolio of Investments.
Eaton Vance
Tax-Advantaged Global Dividend Opportunities Fund
April 30, 2022
Notes to Financial Statements (Unaudited) — continued
The fair value of open derivative instruments (not considered to be hedging instruments for accounting disclosure purposes) by risk exposure at April 30, 2022 was as follows:
| | | Fair Value |
| Risk | Derivative | Asset Derivative | Liability Derivative |
| Equity Price | Futures contracts | $ 211,508(1) | $ (673,428)(1) |
| Foreign Exchange | Forward foreign currency exchange contracts | 115,923 (2) | — |
| Total | $327,431 | $(673,428) |
| Derivatives not subject to master netting or similar agreements | $211,508 | $(673,428) |
| Total Derivatives subject to master netting or similar agreements | $115,923 | $ — |
| (1) | Only the current day's variation margin on open futures contracts is reported within the Statement of Assets and Liabilities as Receivable or Payable for variation margin on open futures contracts, as applicable. |
| (2) | Statement of Assets and Liabilities location: Receivable for open forward foreign currency exchange contracts. |
The Fund’s derivative assets and liabilities at fair value by risk, which are reported gross in the Statement of Assets and Liabilities, are presented in the table above. The following table presents the Fund’s derivative assets by counterparty, net of amounts available for offset under a master netting agreement and net of the related collateral received by the Fund for such assets as of April 30, 2022.
| Counterparty | Derivative
Assets Subject to
Master Netting
Agreement | Derivatives
Available
for Offset | Non-cash
Collateral
Received(a) | Cash
Collateral
Received(a) | Net Amount
of Derivative
Assets(b) |
| Bank of America, N.A. | $ 19,477 | $ — | $ — | $ — | $ 19,477 |
| State Street Bank and Trust Company | 96,446 | — | — | — | 96,446 |
| | $115,923 | $ — | $ — | $ — | $115,923 |
| (a) | In some instances, the total collateral received and/or pledged may be more than the amount shown due to overcollateralization. |
| (b) | Net amount represents the net amount due from the counterparty in the event of default. |
The effect of derivative instruments (not considered to be hedging instruments for accounting disclosure purposes) on the Statement of Operations by risk exposure for the six months ended April 30, 2022 was as follows:
| Risk | Derivative | Realized Gain (Loss)
on Derivatives Recognized
in Income(1) | Change in Unrealized
Appreciation (Depreciation) on
Derivatives Recognized in Income(2) |
| Equity Price | Futures contracts | $ (569,025) | $ (461,920) |
| Foreign Exchange | Forward foreign currency exchange contracts | — | 115,923 |
| Total | $(569,025) | $(345,997) |
| (1) | Statement of Operations location: Net realized gain (loss): Futures contracts and Forward foreign currency exchange contracts, respectively. |
| (2) | Statement of Operations location: Change in unrealized appreciation (depreciation): Futures contracts and Forward foreign currency exchange contracts, respectively. |
Eaton Vance
Tax-Advantaged Global Dividend Opportunities Fund
April 30, 2022
Notes to Financial Statements (Unaudited) — continued
The average notional cost of futures contracts and average notional amounts of other derivative contracts outstanding during the six months ended April 30, 2022, which are indicative of the volume of these derivative types, were approximately as follows:
Futures
Contracts — Long | Futures
Contracts — Short | Forward
Foreign Currency
Exchange Contracts* |
| $7,171,000 | $7,184,000 | $1,132,000 |
| * | The average notional amount for forward foreign currency exchange contracts is based on the absolute value of notional amounts of currency purchased and currency sold. |
7 Liquidity Agreement
Effective August 28, 2020, the Fund entered into a Liquidity Agreement (the Agreement) with State Street Bank and Trust Company (SSBT) that allows the Fund to borrow or otherwise access up to $121 million through securities lending transactions, direct loans from SSBT or a combination of both. The Fund has granted to SSBT a security interest in all its cash, securities and other financial assets, unless otherwise pledged, to secure the payment and performance of its obligations under the Agreement. Pursuant to the terms of the Agreement, the Fund has made its securities available for securities lending transactions by SSBT acting as securities lending agent for the Fund. Securities lending transactions are required to be secured with cash collateral received from the securities borrowers equal at all times to at least 100%, 102% or 105% of the market value of the securities loaned, depending on the type of security. The market value of securities loaned is determined daily and any additional required collateral is delivered to SSBT on the next business day. The Fund is subject to the possible delay in the recovery of loaned securities. Pursuant to the Agreement, SSBT has provided indemnification to the Fund in the event of default by a securities borrower with respect to security loans. However, the Fund retains all risk of loss and gains associated with securities purchased using cash received as collateral for security loans. The Fund is entitled to receive from securities borrowers all substitute interest, dividends and other distributions paid with respect to the securities on loan. The Fund may instruct SSBT to recall a security on loan at any time. At April 30, 2022, the value of the securities loaned and the value of the cash collateral received by SSBT, which exceeded the value of the securities loaned, amounted to $81,152,390 and $87,073,111, respectively.
Interest on borrowings outstanding under the Agreement is charged at a rate equal to 1-month LIBOR plus 0.50%, payable monthly. SSBT retains all net fees that may arise in connection with securities lending transactions. If the value of securities available to lend falls below a prescribed level, the interest rate may be increased. If the Fund utilizes less than 50% of the commitment amount, it will be charged a monthly non-usage fee of 0.25% per annum on the unused portion of the commitment. The Agreement may be terminated by either SSBT or the Fund upon 360 days’ prior written notice to the other party and after the second anniversary of the Agreement, by the Fund upon 90 days’ prior written notice to SSBT. If certain asset coverage and collateral requirements or other covenants are not met, the Agreement could be deemed in default and result in termination. At April 30, 2022, the Fund had borrowings outstanding under the Agreement of $103 million at an annual interest rate of 0.95%, which are shown as Liquidity Agreement borrowings on the Statement of Assets and Liabilities. The carrying amount of the borrowings at April 30, 2022 approximated its fair value. If measured at fair value, borrowings under the Agreement would have been considered as Level 2 in the fair value hierarchy (see Note 9) at April 30, 2022. For the six months ended April 30, 2022, the aggregate average borrowings under the Agreement and the average annual interest rate (excluding fees) were $103,000,000 and 0.72%, respectively.
Eaton Vance
Tax-Advantaged Global Dividend Opportunities Fund
April 30, 2022
Notes to Financial Statements (Unaudited) — continued
8 Investments in Affiliated Issuers and Funds
The Fund invested in issuers that may be deemed to be affiliated with Morgan Stanley. At April 30, 2022, the value of the Fund's investment in affiliated issuers and funds was $161,332, which represents less than 0.05% of the Fund's net assets. Transactions in affiliated issuers and funds by the Fund for the six months ended April 30, 2022 were as follows:
| Name | Value,
beginning
of period | Purchases | Sales
proceeds | Net
realized
gain (loss) | Change in
unrealized
appreciation
(depreciation) | Value, end
of period | Dividend
income | Units/Shares,
end of period |
| Common Stocks |
| Mitsubishi UFJ Financial Group, Inc. | $4,100,508 | $ — | $ (4,409,903) | $ 863,606 | $ (554,211) | $ — | $ — | — |
| Short-Term Investments |
| Cash Reserves Fund | 2,219,959 | 44,960,150 | (47,180,073) | (36) | — | — | 1,334 | — |
| Liquidity Fund | — | 4,605,636 | (4,444,304) | — | — | 161,332 | 98 | 161,332 |
| Total | | | | $863,570 | $(554,211) | $161,332 | $1,432 | |
9 Fair Value Measurements
Under generally accepted accounting principles for fair value measurements, a three-tier hierarchy to prioritize the assumptions, referred to as inputs, is used in valuation techniques to measure fair value. The three-tier hierarchy of inputs is summarized in the three broad levels listed below.
| • | Level 1 – quoted prices in active markets for identical investments |
| • | Level 2 – other significant observable inputs (including quoted prices for similar investments, interest rates, prepayment speeds, credit risk, etc.) |
| • | Level 3 – significant unobservable inputs (including a fund's own assumptions in determining the fair value of investments) |
In cases where the inputs used to measure fair value fall in different levels of the fair value hierarchy, the level disclosed is determined based on the lowest level input that is significant to the fair value measurement in its entirety. The inputs or methodology used for valuing securities are not necessarily an indication of the risk associated with investing in those securities.
At April 30, 2022, the hierarchy of inputs used in valuing the Fund's investments and open derivative instruments, which are carried at value, were as follows:
| Asset Description | Level 1 | Level 2 | Level 3 | Total |
| Common Stocks: | | | | |
| Communication Services | $ 27,263,449 | $ 10,105,398 | $ — | $ 37,368,847 |
| Consumer Discretionary | 21,373,245 | 28,343,501 | — | 49,716,746 |
| Consumer Staples | 14,912,037 | 13,627,810 | — | 28,539,847 |
| Energy | 13,924,768 | — | — | 13,924,768 |
| Financials | 25,693,624 | 35,768,486 | — | 61,462,110 |
| Health Care | 28,861,685 | 33,933,391 | — | 62,795,076 |
| Industrials | 16,316,303 | 36,473,294 | — | 52,789,597 |
| Information Technology | 68,161,205 | 25,341,603 | — | 93,502,808 |
| Materials | — | 13,964,551 | — | 13,964,551 |
| Real Estate | 3,110,401 | — | — | 3,110,401 |
| Utilities | 5,122,757 | 3,698,085 | — | 8,820,842 |
| Total Common Stocks | $ 224,739,474 | $201,256,119* | $ — | $ 425,995,593 |
| Corporate Bonds | $ — | $ 67,405,733 | $ — | $ 67,405,733 |
| Exchange-Traded Funds | 6,361,026 | — | — | 6,361,026 |
Eaton Vance
Tax-Advantaged Global Dividend Opportunities Fund
April 30, 2022
Notes to Financial Statements (Unaudited) — continued
| Asset Description (continued) | Level 1 | Level 2 | Level 3 | Total |
| Preferred Stocks: | | | | |
| Communication Services | $ 642,560 | $ — | $ — | $ 642,560 |
| Consumer Staples | — | 535,480 | — | 535,480 |
| Energy | 3,977,094 | — | — | 3,977,094 |
| Financials | 6,354,860 | 3,681,125 | — | 10,035,985 |
| Real Estate | 3,203,624 | — | — | 3,203,624 |
| Utilities | 1,792,603 | — | — | 1,792,603 |
| Total Preferred Stocks | $ 15,970,741 | $ 4,216,605 | $ — | $ 20,187,346 |
| Short-Term Investments | $ 161,332 | $ — | $ — | $ 161,332 |
| Total Investments | $ 247,232,573 | $272,878,457 | $ — | $ 520,111,030 |
| Forward Foreign Currency Exchange Contracts | $ — | $ 115,923 | $ — | $ 115,923 |
| Futures Contracts | 211,508 | — | — | 211,508 |
| Total | $ 247,444,081 | $272,994,380 | $ — | $ 520,438,461 |
| Liability Description | | | | |
| Futures Contracts | $ (673,428) | $ — | $ — | $ (673,428) |
| Total | $ (673,428) | $ — | $ — | $ (673,428) |
| * | Includes foreign equity securities whose values were adjusted to reflect market trading of comparable securities or other correlated instruments that occurred after the close of trading in their applicable foreign markets. |
10 Risks and Uncertainties
Risks Associated with Foreign Investments
Foreign investments can be adversely affected by political, economic and market developments abroad, including the imposition of economic and other sanctions by the United States or another country. There may be less publicly available information about foreign issuers because they may not be subject to reporting practices, requirements or regulations comparable to those to which United States companies are subject. Foreign markets may be smaller, less liquid and more volatile than the major markets in the United States. Trading in foreign markets typically involves higher expense than trading in the United States. The Fund may have difficulties enforcing its legal or contractual rights in a foreign country. Securities that trade or are denominated in currencies other than the U.S. dollar may be adversely affected by fluctuations in currency exchange rates.
Pandemic Risk
An outbreak of respiratory disease caused by a novel coronavirus was first detected in China in late 2019 and subsequently spread internationally. This coronavirus has resulted in closing borders, enhanced health screenings, changes to healthcare service preparation and delivery, quarantines, cancellations, disruptions to supply chains and customer activity, as well as general concern and uncertainty. Health crises caused by outbreaks of disease, such as the coronavirus outbreak, may exacerbate other pre-existing political, social and economic risks and disrupt normal market conditions and operations. The impact of this outbreak has negatively affected the worldwide economy, as well as the economies of individual countries and industries, and could continue to affect the market in significant and unforeseen ways. Other epidemics and pandemics that may arise in the future may have similar effects. Any such impact could adversely affect the Fund's performance, or the performance of the securities in which the Fund invests.
Eaton Vance
Tax-Advantaged Global Dividend Opportunities Fund
April 30, 2022
Annual Meeting of Shareholders (Unaudited)
The Fund held its Annual Meeting of Shareholders on February 10, 2022. The following action was taken by the shareholders:
Proposal 1: The election of George J. Gorman, Helen Frame Peters, Marcus L. Smith and Susan J. Sutherland as Class III Trustees of the Fund for a three-year term expiring in 2025.
| | | | Number of Shares |
| Nominees for Trustee | | | For | Withheld |
| George J. Gorman | | | 12,586,937 | 188,550 |
| Helen Frame Peters | | | 12,504,714 | 270,773 |
| Marcus L. Smith | | | 12,580,684 | 194,803 |
| Susan J. Sutherland | | | 12,567,256 | 208,231 |
Eaton Vance
Tax-Advantaged Global Dividend Opportunities Fund
April 30, 2022
| Officers |
Edward J. Perkin
President | Jill R. Damon
Secretary |
Deidre E. Walsh
Vice President and Chief Legal Officer | Richard F. Froio
Chief Compliance Officer |
James F. Kirchner
Treasurer | |
George J. Gorman
Chairperson | |
| Thomas E. Faust Jr.* | |
| Mark R. Fetting | |
| Cynthia E. Frost | |
| Valerie A. Mosley | |
| William H. Park | |
| Helen Frame Peters | |
| Keith Quinton | |
| Marcus L. Smith | |
| Susan J. Sutherland | |
| Scott E. Wennerholm | |
| Nancy A. Wiser** | |
| * | Interested Trustee |
| ** | Ms. Wiser began serving as a Trustee effective April 4, 2022. |
| FACTS | WHAT DOES EATON VANCE DO WITH YOUR
PERSONAL INFORMATION? |
| Why? | Financial companies choose how they share your personal information. Federal law gives consumers the right to limit some but not all sharing. Federal law also requires us to tell you how we collect, share, and protect your personal information. Please read this notice carefully to understand what we do. |
| |
| What? | The types of personal information we collect and share depend on the product or service you have with us. This information can include:■ Social Security number and income
■ investment experience and risk tolerance
■ checking account number and wire transfer instructions |
| |
| How? | All financial companies need to share customers’ personal information to run their everyday business. In the section below, we list the reasons financial companies can share their customers’ personal information; the reasons Eaton Vance chooses to share; and whether you can limit this sharing. |
Reasons we can share your
personal information | Does Eaton Vance
share? | Can you limit
this sharing? |
| For our everyday business purposes — such as to process your transactions, maintain your account(s), respond to court orders and legal investigations, or report to credit bureaus | Yes | No |
| For our marketing purposes — to offer our products and services to you | Yes | No |
| For joint marketing with other financial companies | No | We don’t share |
| For our investment management affiliates’ everyday business purposes — information about your transactions, experiences, and creditworthiness | Yes | Yes |
| For our affiliates’ everyday business purposes — information about your transactions and experiences | Yes | No |
| For our affiliates’ everyday business purposes — information about your creditworthiness | No | We don’t share |
| For our investment management affiliates to market to you | Yes | Yes |
| For our affiliates to market to you | No | We don’t share |
| For nonaffiliates to market to you | No | We don’t share |
To limit our
sharing | Call toll-free 1-800-262-1122 or email: EVPrivacy@eatonvance.comPlease note:If you are a new customer, we can begin sharing your information 30 days from the date we sent this notice. When you are no longer our customer, we continue to share your information as described in this notice. However, you can contact us at any time to limit our sharing. |
| Questions? | Call toll-free 1-800-262-1122 or email: EVPrivacy@eatonvance.com |
| Privacy Notice — continued | April 2021 |
| Who we are |
| Who is providing this notice? | Eaton Vance Management, Eaton Vance Distributors, Inc., Eaton Vance Trust Company, Eaton Vance Management (International) Limited, Eaton Vance Advisers International Ltd., Eaton Vance Global Advisors Limited, Eaton Vance Management’s Real Estate Investment Group, Boston Management and Research, Calvert Research and Management, Eaton Vance and Calvert Fund Families and our investment advisory affiliates (“Eaton Vance”) (see Investment Management Affiliates definition below) |
| What we do |
How does Eaton Vance
protect my personal
information? | To protect your personal information from unauthorized access and use, we use security measures that comply with federal law. These measures include computer safeguards and secured files and buildings. We have policies governing the proper handling of customer information by personnel and requiring third parties that provide support to adhere to appropriate security standards with respect to such information. |
How does Eaton Vance
collect my personal
information? | We collect your personal information, for example, when you■ open an account or make deposits or withdrawals from your account
■ buy securities from us or make a wire transfer
■ give us your contact informationWe also collect your personal information from others, such as credit bureaus, affiliates, or other companies. |
| Why can’t I limit all sharing? | Federal law gives you the right to limit only■ sharing for affiliates’ everyday business purposes — information about your creditworthiness
■ affiliates from using your information to market to you
■ sharing for nonaffiliates to market to youState laws and individual companies may give you additional rights to limit sharing. See below for more on your rights under state law. |
| Definitions |
Investment Management
Affiliates | Eaton Vance Investment Management Affiliates include registered investment advisers, registered broker- dealers, and registered and unregistered funds. Investment Management Affiliates does not include entities associated with Morgan Stanley Wealth Management, such as Morgan Stanley Smith Barney LLC and Morgan Stanley & Co. |
| Affiliates | Companies related by common ownership or control. They can be financial and nonfinancial companies.■ Our affiliates include companies with a Morgan Stanley name and financial companies such as Morgan Stanley Smith Barney LLC and Morgan Stanley & Co. |
| Nonaffiliates | Companies not related by common ownership or control. They can be financial and nonfinancial companies.■ Eaton Vance does not share with nonaffiliates so they can market to you. |
| Joint marketing | A formal agreement between nonaffiliated financial companies that together market financial products or services to you.■ Eaton Vance doesn’t jointly market. |
| Other important information |
| Vermont: Except as permitted by law, we will not share personal information we collect about Vermont residents with Nonaffiliates unless you provide us with your written consent to share such information.California: Except as permitted by law, we will not share personal information we collect about California residents with Nonaffiliates and we will limit sharing such personal information with our Affiliates to comply with California privacy laws that apply to us. |
Delivery of Shareholder Documents. The Securities and Exchange Commission (SEC) permits funds to deliver only one copy of shareholder documents, including prospectuses, proxy statements and shareholder reports, to fund investors with multiple accounts at the same residential or post office box address. This practice is often called “householding” and it helps eliminate duplicate mailings to shareholders. American Stock Transfer & Trust Company, LLC (“AST”), the closed-end funds transfer agent, or your financial intermediary, may household the mailing of your documents indefinitely unless you instruct AST, or your financial intermediary, otherwise. If you would prefer that your Eaton Vance documents not be householded, please contact AST or your financial intermediary. Your instructions that householding not apply to delivery of your Eaton Vance documents will typically be effective within 30 days of receipt by AST or your financial intermediary.
Portfolio Holdings. Each Eaton Vance Fund and its underlying Portfolio(s) (if applicable) files a schedule of portfolio holdings on Part F to Form N-PORT with the SEC. Certain information filed on Form N-PORT may be viewed on the Eaton Vance website at www.eatonvance.com, by calling Eaton Vance at 1-800-262-1122 or in the EDGAR database on the SEC’s website at www.sec.gov.
Proxy Voting. From time to time, funds are required to vote proxies related to the securities held by the funds. The Eaton Vance Funds or their underlying Portfolios (if applicable) vote proxies according to a set of policies and procedures approved by the Funds’ and Portfolios’ Boards. You may obtain a description of these policies and procedures and information on how the Funds or Portfolios voted proxies relating to portfolio securities during the most recent 12-month period ended June 30, without charge, upon request, by calling 1-800-262-1122 and by accessing the SEC’s website at www.sec.gov.
Share Repurchase Program. The Fund’s Board of Trustees has approved a share repurchase program authorizing the Fund to repurchase up to 10% of its common shares outstanding as of the last day of the prior calendar year in open-market transactions at a discount to net asset value. The repurchase program does not obligate the Fund to purchase a specific amount of shares. The Fund’s repurchase activity, including the number of shares purchased, average price and average discount to net asset value, is disclosed in the Fund’s annual and semi-annual reports to shareholders.
Additional Notice to Shareholders. If applicable, a Fund may also redeem or purchase its outstanding preferred shares in order to maintain compliance with regulatory requirements, borrowing or rating agency requirements or for other purposes as it deems appropriate or necessary.
Closed-End Fund Information. Eaton Vance closed-end funds make fund performance data and certain information about portfolio characteristics available on the Eaton Vance website shortly after the end of each month. Other information about the funds is available on the website. The funds’ net asset value per share is readily accessible on the Eaton Vance website. Portfolio holdings for the most recent month-end are also posted to the website approximately 30 days following the end of the month. This information is available at www.eatonvance.com on the fund information pages under "Closed-End Funds & Term Trusts".
This Page Intentionally Left Blank
This Page Intentionally Left Blank
This Page Intentionally Left Blank
Investment Adviser and Administrator
Eaton Vance Management
Two International Place
Boston, MA 02110
Investment Sub-Adviser
Eaton Vance Advisers International Ltd.
125 Old Broad Street
London, EC2N 1AR
United Kingdom
Custodian
State Street Bank and Trust Company
State Street Financial Center, One Lincoln Street
Boston, MA 02111
Transfer Agent
American Stock Transfer & Trust Company, LLC
6201 15th Avenue
Brooklyn, NY 11219
Fund Offices
Two International Place
Boston, MA 02110
Item 2. Code of Ethics
Not required in this filing.
Item 3. Audit Committee Financial Expert
Not required in this filing.
Item 4. Principal Accountant Fees and Services
Not required in this filing.
Item 5. Audit Committee of Listed Registrants
Not required in this filing.
Item 6. Schedule of Investments
Please see schedule of investments contained in the Report to Stockholders included under Item 1 of this Form N-CSR.
Item 7. Disclosure of Proxy Voting Policies and Procedures for Closed-End Management Investment Companies
Not required in this filing.
Item 8. Portfolio Managers of Closed-End Management Investment Companies
Not required in this filing.
Item 9. Purchases of Equity Securities by Closed-End Management Investment Company and Affiliated Purchasers
No such purchases this period.
Item 10. Submission of Matters to a Vote of Security Holders
No material changes.
Item 11. Controls and Procedures
(a) It is the conclusion of the registrant’s principal executive officer and principal financial officer that the effectiveness of the registrant’s current disclosure controls and procedures (such disclosure controls and procedures having been evaluated within 90 days of the date of this filing) provide reasonable assurance that the information required to be disclosed by the registrant has been recorded, processed, summarized and reported within the time period specified in the Commission’s rules and forms and that the information required to be disclosed by the registrant has been accumulated and communicated to the registrant’s principal executive officer and principal financial officer in order to allow timely decisions regarding required disclosure.
(b) There have been no changes in the registrant’s internal controls over financial reporting during the period covered by this report that has materially affected, or is reasonably likely to materially affect, the registrant’s internal control over financial reporting.
Item 12. Disclosure of Securities Lending Activities for Closed-End Management Investment Companies
No activity to report for the Registrant’s most recent fiscal year end.
Item 13. Exhibits
Signatures
Pursuant to the requirements of the Securities Exchange Act of 1934 and the Investment Company Act of 1940, the registrant has duly caused this report to be signed on its behalf by the undersigned, thereunto duly authorized.
Eaton Vance Tax-Advantaged Global Dividend Opportunities Fund
| | |
| By: | | /s/ Edward J. Perkin |
| | Edward J. Perkin |
| | President |
| |
| Date: | | June 23, 2022 |
Pursuant to the requirements of the Securities Exchange Act of 1934 and the Investment Company Act of 1940, this report has been signed below by the following persons on behalf of the registrant and in the capacities and on the dates indicated.
| | |
| By: | | /s/ James F. Kirchner |
| | James F. Kirchner |
| | Treasurer |
| |
| Date: | | June 23, 2022 |
| |
| By: | | /s/ Edward J. Perkin |
| | Edward J. Perkin |
| | President |
| |
| Date: | | June 23, 2022 |