Searchable text section of graphics shown above
[LOGO]
Fourth Quarter 2004
Earnings Conference Call
February 11, 2005
Slide 1
Cautionary Statement
Forward-Looking Statements
This press release includes forward-looking statements within the meaning of the Private Securities Litigation Reform Act of 1995. Such statements, including statements regarding anticipated financial results, are subject to certain risks, trends, and uncertainties that could cause actual results to differ materially from those projected, expressed or implied by such forward-looking statements. The statements are based on assumptions about important factors, including general business conditions; market trends; competition; weather; vehicle production; trends in new and used vehicle sales; business development activities, including acquisitions; economic conditions, including exchange rate and interest rate fluctuations; litigation developments and the other risk factors described in the Company’s Registration Statement on Form S-1 as declared effective on June 15, 2004 and other risks described from time to time in the Company’s filings with the Securities and Exchange Commission. Many of these risk factors are outside of the Company’s control, and as such, they involve risks which are not currently known to the Company that could cause actual results to differ materially from forecasted results. The forward-looking statements in this document are made as of the date hereof and the Company does not undertake to update its forward-looking statements.
This presentation includes certain non-GAAP measures as defined by SEC rules. As required by SEC rules, we have provided reconciliations of those measures to the most directly comparable GAAP measures. The reconciliations are available in our earnings press release.
Slide 2
Recent Highlights
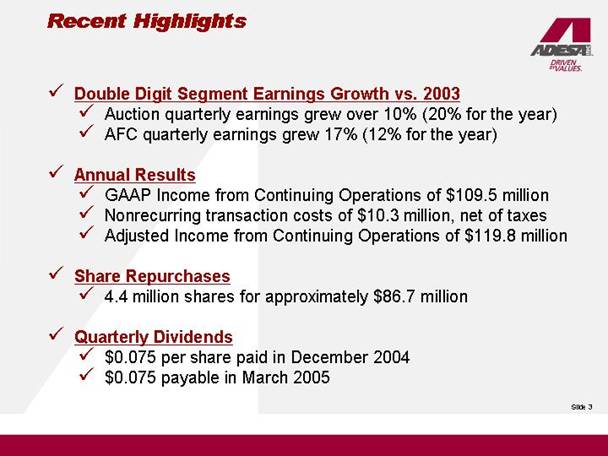
• Double Digit Segment Earnings Growth vs. 2003
• Auction quarterly earnings grew over 10% (20% for the year)
• AFC quarterly earnings grew 17% (12% for the year)
• Annual Results
• GAAP Income from Continuing Operations of $109.5 million
• Nonrecurring transaction costs of $10.3 million, net of taxes
• Adjusted Income from Continuing Operations of $119.8 million
• Share Repurchases
• 4.4 million shares for approximately $86.7 million
• Quarterly Dividends
• $0.075 per share paid in December 2004
• $0.075 payable in March 2005
Slide 3
Recent Highlights Continued
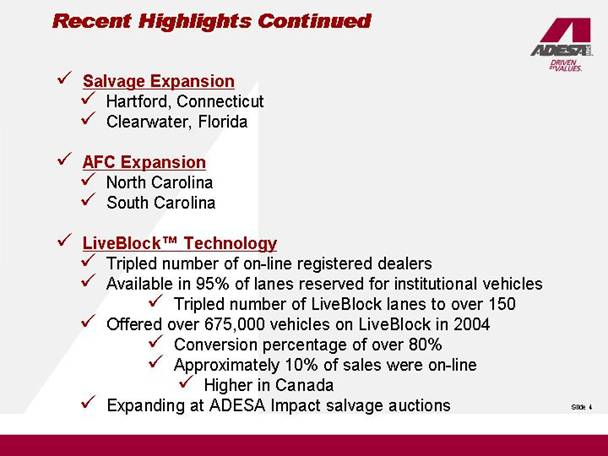
• Salvage Expansion
• Hartford, Connecticut
• Clearwater, Florida
• AFC Expansion
• North Carolina
• South Carolina
• LiveBlock™ Technology
• Tripled number of on-line registered dealers
• Available in 95% of lanes reserved for institutional vehicles
• Tripled number of LiveBlock lanes to over 150
• Offered over 675,000 vehicles on LiveBlock in 2004
• Conversion percentage of over 80%
• Approximately 10% of sales were on-line
• Higher in Canada
• Expanding at ADESA Impact salvage auctions
Slide 4
Quarterly and Annual Consolidated
EBITDA
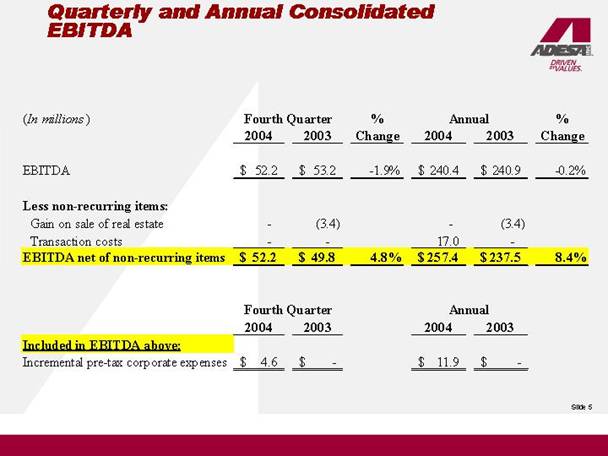
| | Fourth Quarter | | % | | Annual | | % | |
(In millions) | | 2004 | | 2003 | | Change | | 2004 | | 2003 | | Change | |
| | | | | | | | | | | | | |
EBITDA | | $ | 52.2 | | $ | 53.2 | | $ | -1.9 | % | $ | 240.4 | | $ | 240.9 | | -0.2 | % |
| | | | | | | | | | | | | |
Less non-recurring items: | | | | | | | | | | | | | |
Gain on sale of real estate | | — | | (3.4 | ) | | | — | | (3.4 | ) | | |
Transaction costs | | — | | — | | | | 17.0 | | — | | | |
EBITDA net of non-recurring items | | $ | 52.2 | | $ | 49.8 | | $ | 4.8 | % | $ | 257.4 | | $ | 237.5 | | $ | 8.4 | % |
| | | | | | | | | | | | | |
| | | | | | | | | |
| | | | | | | | | |
| | Fourth Quarter | | | | Annual | | | |
| | 2004 | | 2003 | | | | 2004 | | 2003 | | | |
Included in EBITDA above: | | | | | | | | | | | | | |
Incremental pre-tax corporate expenses | | $ | 4.6 | | $ | — | | | | $ | 11.9 | | $ | — | | | |
| | | | | | | | | | | | | | | | | | | |
Slide 5
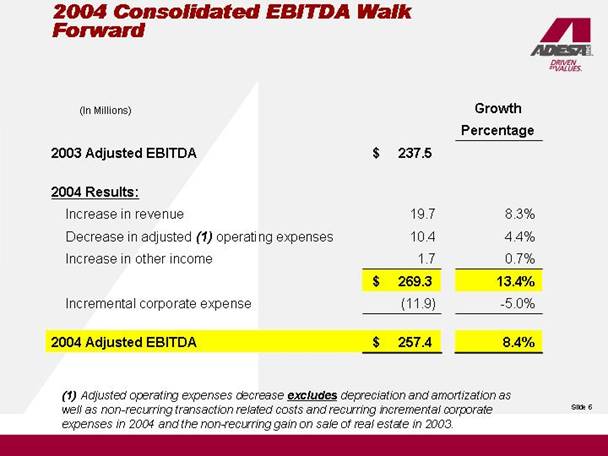
2004 Consolidated EBITDA Walk
Forward
(In Millions) | | | | Growth Percentage | |
2003 Adjusted EBITDA | | $ | 237.5 | | | |
| | | | | |
2004 Results: | | | | | |
Increase in revenue | | 19.7 | | 8.3 | % |
Decrease in adjusted (1) operating expenses | | 10.4 | | 4.4 | % |
Increase in other income | | 1.7 | | 0.7 | % |
| | $ | 269.3 | | 13.4 | % |
Incremental corporate expense | | (11.9 | ) | -5.0 | % |
| | | | | |
2004 Adjusted EBITDA | | $ | 257.4 | | 8.4 | % |
(1) Adjusted operating expenses decrease excludes depreciation and amortization as well as non-recurring transaction related costs and recurring incremental corporate expenses in 2004 and the non-recurring gain on sale of real estate in 2003.
Slide 6
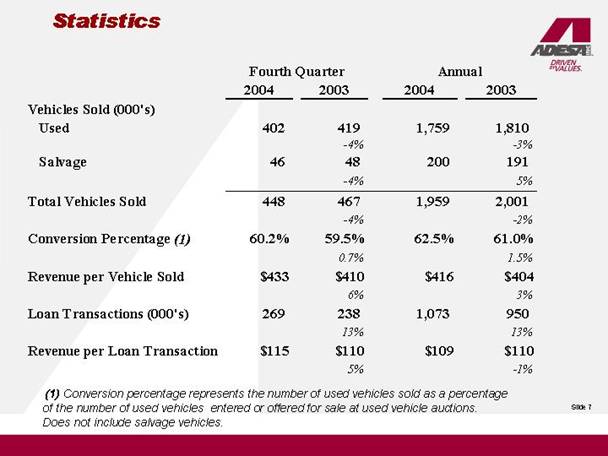
Statistics
| | Fourth Quarter | | Annual | |
| | 2004 | | 2003 | | 2004 | | 2003 | |
Vehicles Sold (000's) | | | | | | | | | |
Used | | 402 | | 419 | | 1,759 | | 1,810 | |
| | | | -4 | % | | | -3 | % |
Salvage | | 46 | | 48 | | 200 | | 191 | |
| | | | -4 | % | | | 5 | % |
Total Vehicles Sold | | 448 | | 467 | | 1,959 | | 2,001 | |
| | | | -4 | % | | | -2 | % |
Conversion Percentage (1) | | 60.2 | % | 59.5 | % | 62.5 | % | 61.0 | % |
| | | | 0.7 | % | | | 1.5 | % |
Revenue per Vehicle Sold | | $433 | | $410 | | $416 | | $404 | |
| | | | 6 | % | | | 3 | % |
Loan Transactions (000's) | | 269 | | 238 | | 1,073 | | 950 | |
| | | | 13 | % | | | 13 | % |
Revenue per Loan Transaction | | $115 | | $110 | | $109 | | $110 | |
| | | | 5 | % | | | -1 | % |
(1) Conversion percentage represents the number of used vehicles sold as a percentage of the number of used vehicles entered or offered for sale at used vehicle auctions.
Does not include salvage vehicles.
Slide 7
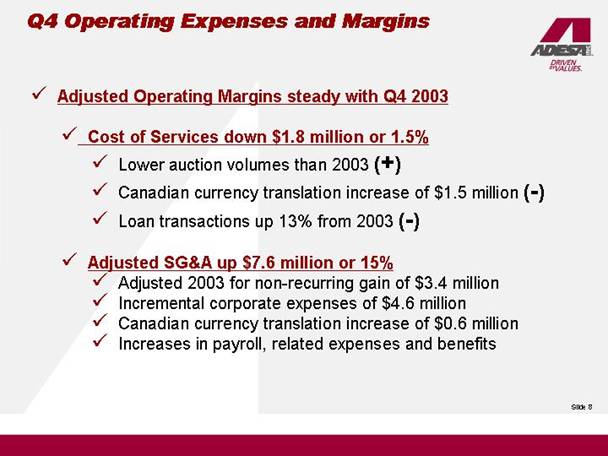
Q4 Operating Expenses and Margins
• Adjusted Operating Margins steady with Q4 2003
• Cost of Services down $1.8 million or 1.5%
• Lower auction volumes than 2003 (+)
• Canadian currency translation increase of $1.5 million (-)
• Loan transactions up 13% from 2003 (-)
• Adjusted SG&A up $7.6 million or 15%
• Adjusted 2003 for non-recurring gain of $3.4 million
• Incremental corporate expenses of $4.6 million
• Canadian currency translation increase of $0.6 million
• Increases in payroll, related expenses and benefits
Slide 8
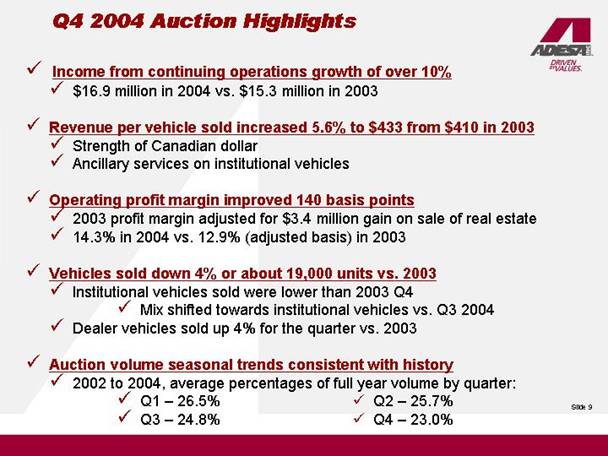
Q4 2004 Auction Highlights
• Income from continuing operations growth of over 10%
• $16.9 million in 2004 vs. $15.3 million in 2003
• Revenue per vehicle sold increased 5.6% to $433 from $410 in 2003
• Strength of Canadian dollar
• Ancillary services on institutional vehicles
• Operating profit margin improved 140 basis points
• 2003 profit margin adjusted for $3.4 million gain on sale of real estate
• 14.3% in 2004 vs. 12.9% (adjusted basis) in 2003
• Vehicles sold down 4% or about 19,000 units vs. 2003
• Institutional vehicles sold were lower than 2003 Q4
• Mix shifted towards institutional vehicles vs. Q3 2004
• Dealer vehicles sold up 4% for the quarter vs. 2003
• Auction volume seasonal trends consistent with history
• 2002 to 2004, average percentages of full year volume by quarter:
• Q1 — 26.5% • Q2 — 25.7%
• Q3 — 24.8% • Q4 — 23.0%
Slide 9
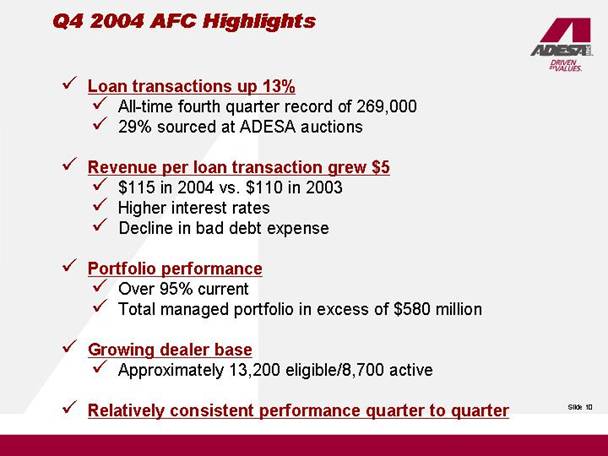
Q4 2004 AFC Highlights
• Loan transactions up 13%
• All-time fourth quarter record of 269,000
• 29% sourced at ADESA auctions
• Revenue per loan transaction grew $5
• $115 in 2004 vs. $110 in 2003
• Higher interest rates
• Decline in bad debt expense
• Portfolio performance
• Over 95% current
• Total managed portfolio in excess of $580 million
• Growing dealer base
• Approximately 13,200 eligible/8,700 active
• Relatively consistent performance quarter to quarter
Slide 10
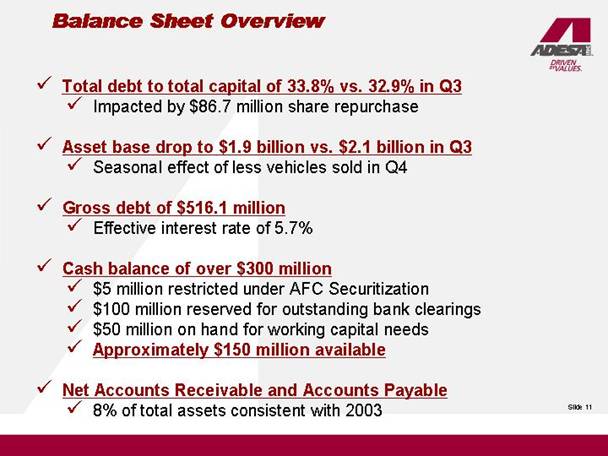
Balance Sheet Overview
• Total debt to total capital of 33.8% vs. 32.9% in Q3
• Impacted by $86.7 million share repurchase
• Asset base drop to $1.9 billion vs. $2.1 billion in Q3
• Seasonal effect of less vehicles sold in Q4
• Gross debt of $516.1 million
• Effective interest rate of 5.7%
• Cash balance of over $300 million
• $5 million restricted under AFC Securitization
• $100 million reserved for outstanding bank clearings
• $50 million on hand for working capital needs
• Approximately $150 million available
• Net Accounts Receivable and Accounts Payable
• 8% of total assets consistent with 2003
Slied 11
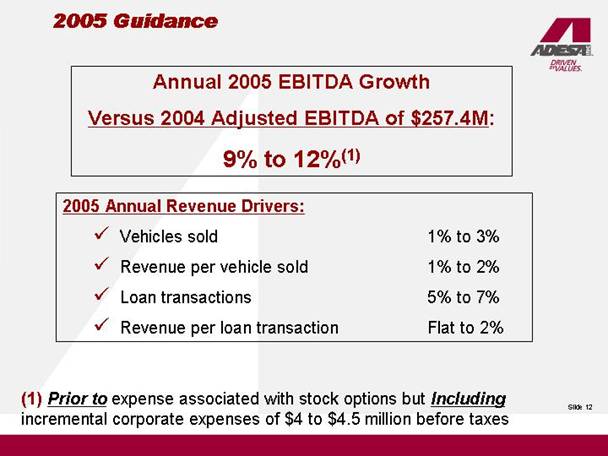
2005 Guidance
Annual 2005 EBITDA Growth
Versus 2004 Adjusted EBITDA of $257.4M:
9% to 12%(1)
2005 Annual Revenue Drivers:
• Vehicles sold 1% to 3%
• Revenue per vehicle sold 1% to 2%
• Loan transactions 5% to 7%
• Revenue per loan transaction Flat to 2%
(1) Prior to expense associated with stock options but Including incremental corporate expenses of $4 to $4.5 million before taxes
Slide 12
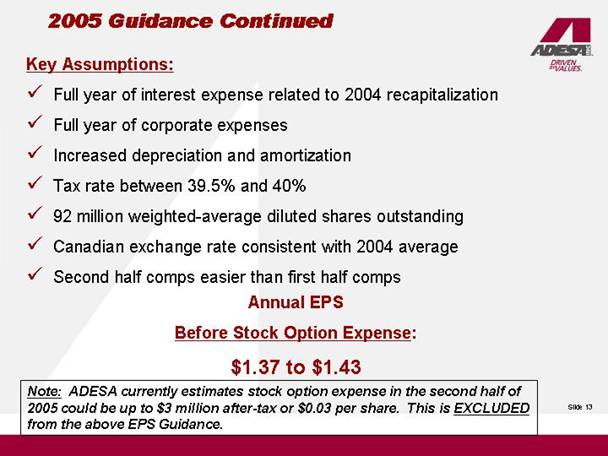
2005 Guidance Continued
Key Assumptions:
• Full year of interest expense related to 2004 recapitalization
• Full year of corporate expenses
• Increased depreciation and amortization
• Tax rate between 39.5% and 40%
• 92 million weighted-average diluted shares outstanding
• Canadian exchange rate consistent with 2004 average
• Second half comps easier than first half comps
Annual EPS
Before Stock Option Expense:
$1.37 to $1.43
Note: ADESA currently estimates stock option expense in the second half of 2005 could be up to $3 million after-tax or $0.03 per share. This is EXCLUDED from the above EPS Guidance.
Slide 13