Searchable text section of graphics shown above
[LOGO]
First Quarter 2005
Earnings Conference Call
April 29, 2005
Cautionary Statement
Forward-Looking Statements
This presentation includes forward-looking statements within the meaning of the Private Securities Litigation Reform Act of 1995. Such statements, including statements regarding anticipated financial results, anticipated industry developments and growth initiatives are subject to certain risks, trends, and uncertainties that could cause actual results to differ materially from those projected, expressed or implied by such forward-looking statements. The statements are based on assumptions about important factors including: general business conditions; market trends; competition; weather; vehicle production; trends in new and used vehicle sales; business development activities, including acquisitions; economic conditions, including exchange rate and interest rate fluctuations; litigation developments; and the other risk factors described in the Company’s Annual Report on Form 10-K, and other risks described from time to time in the Company’s filings with the Securities and Exchange Commission. Many of these risk factors are outside of the Company’s control, and as such, they involve risks which are not currently known to the Company that could cause actual results to differ materially from forecasted results. The forward-looking statements in this document are made as of the date hereof and the Company does not undertake to update its forward-looking statements.
This presentation includes certain non-GAAP measures. These non-GAAP measures are reconciled to the most directly comparable GAAP measures in Appendix 2 to this presentation.
Highlights
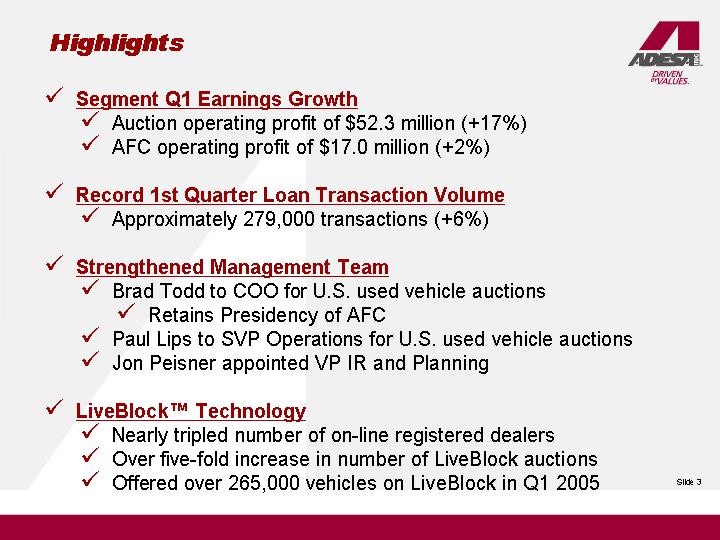
• Segment Q1 Earnings Growth
• Auction operating profit of $52.3 million (+17%)
• AFC operating profit of $17.0 million (+2%)
• Record 1st Quarter Loan Transaction Volume
• Approximately 279,000 transactions (+6%)
• Strengthened Management Team
• Brad Todd to COO for U.S. used vehicle auctions
• Retains Presidency of AFC
• Paul Lips to SVP Operations for U.S. used vehicle auctions
• Jon Peisner appointed VP IR and Planning
• LiveBlock™ Technology
• Nearly tripled number of on-line registered dealers
• Over five-fold increase in number of LiveBlock auctions
• Offered over 265,000 vehicles on LiveBlock in Q1 2005
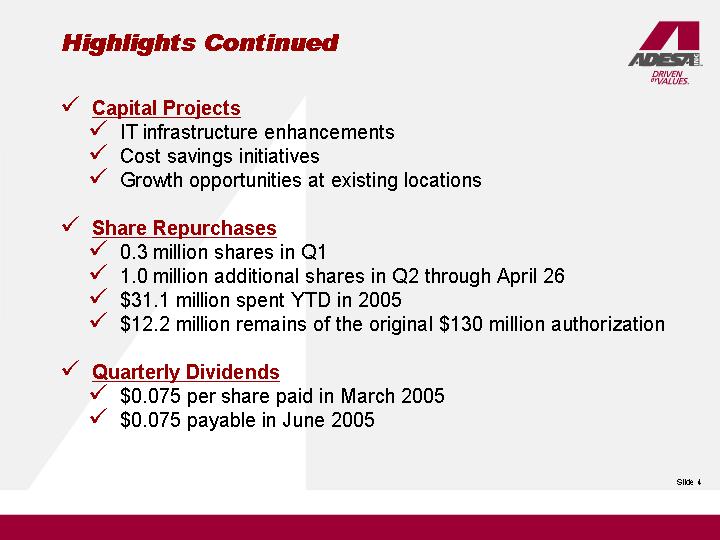
• Capital Projects
• IT infrastructure enhancements
• Cost savings initiatives
• Growth opportunities at existing locations
• Share Repurchases
• 0.3 million shares in Q1
• �� 1.0 million additional shares in Q2 through April 26
• $31.1 million spent YTD in 2005
• $12.2 million remains of the original $130 million authorization
• Quarterly Dividends
• $0.075 per share paid in March 2005
• $0.075 payable in June 2005
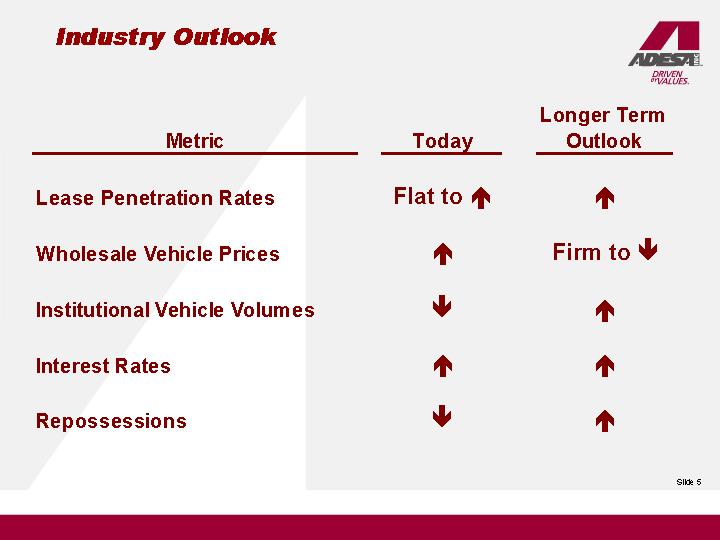
Industry Outlook
| | | | Longer Term |
Metric | | Today | | Outlook |
| | | | |
Lease Penetration Rates | | Flat to  | |
|
| | | | |
Wholesale Vehicle Prices | |
| | Firm to  |
| | | | |
Institutional Vehicle Volumes | |
| |
|
| | | | |
Interest Rates | |
| |
|
| | | | |
Repossessions | |
| |
|
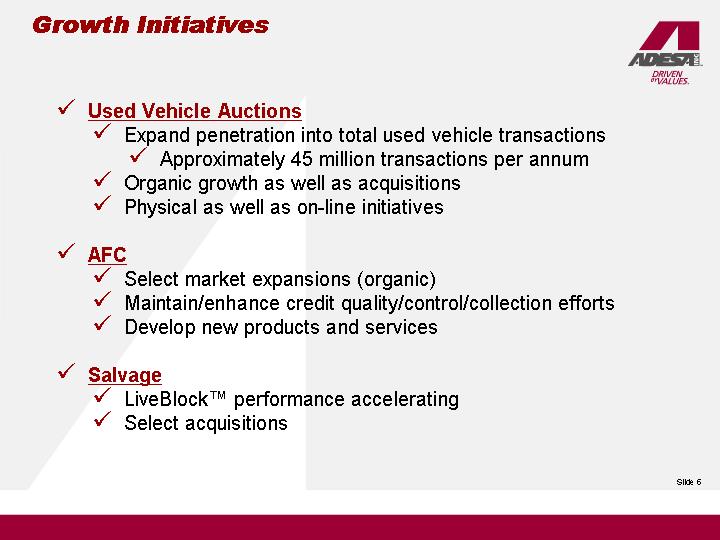
Growth Initiatives
• Used Vehicle Auctions
• Expand penetration into total used vehicle transactions
• Approximately 45 million transactions per annum
• Organic growth as well as acquisitions
• Physical as well as on-line initiatives
• AFC
• Select market expansions (organic)
• Maintain/enhance credit quality/control/collection efforts
• Develop new products and services
• Salvage
• LiveBlock™ performance accelerating
• Select acquisitions
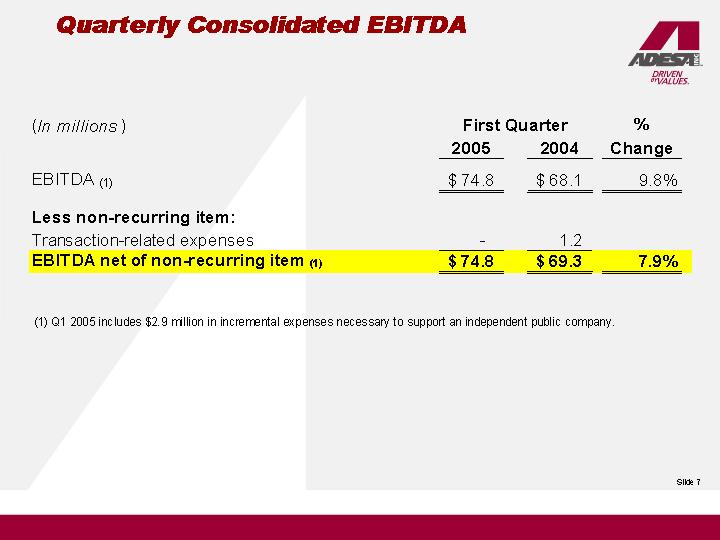
Quarterly Consolidated EBITDA
| | First Quarter | | % | |
(In millions) | | 2005 | | 2004 | | Change | |
| | | | | | | |
EBITDA (1) | | $ | 74.8 | | $ | 68.1 | | 9.8 | % |
| | | | | | | |
Less non-recurring item: | | | | | | | |
Transaction-related expenses | | — | | 1.2 | | | |
EBITDA net of non-recurring item (1) | | $ | 74.8 | | $ | 69.3 | | 7.9 | % |
(1) Q1 2005 includes $2.9 million in incremental expenses necessary to support an independent public company.
2005 Consolidated EBITDA Walk Forward
| | | | Percentage | |
(In Millions) | | | | Growth | |
| | | | | |
Q1 2004 EBITDA net of non-recurring item | | $ | 69.3 | | | |
| | | | | |
2005 Results: | | | | | |
Decrease in revenue | | (3.3 | ) | (4.8 | )% |
Decrease in operating expenses | | 8.1 | | 11.7 | % |
Increase in other income | | 0.7 | | 1.0 | % |
Q1 2005 EBITDA (1) | | $ | 74.8 | | 7.9 | % |
(1) Includes $2.9 million in incremental expenses necessary to support an independent public company.
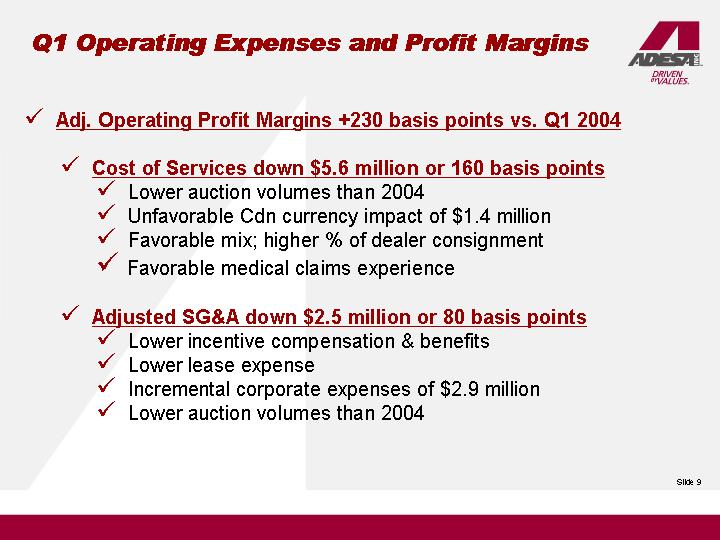
Q1 Operating Expenses and Profit Margins
• Adj. Operating Profit Margins +230 basis points vs. Q1 2004
• Cost of Services down $5.6 million or 160 basis points
• Lower auction volumes than 2004
• Unfavorable Cdn currency impact of $1.4 million
• Favorable mix; higher % of dealer consignment
• Favorable medical claims experience
• Adjusted SG&A down $2.5 million or 80 basis points
• Lower incentive compensation & benefits
• Lower lease expense
• Incremental corporate expenses of $2.9 million
• Lower auction volumes than 2004
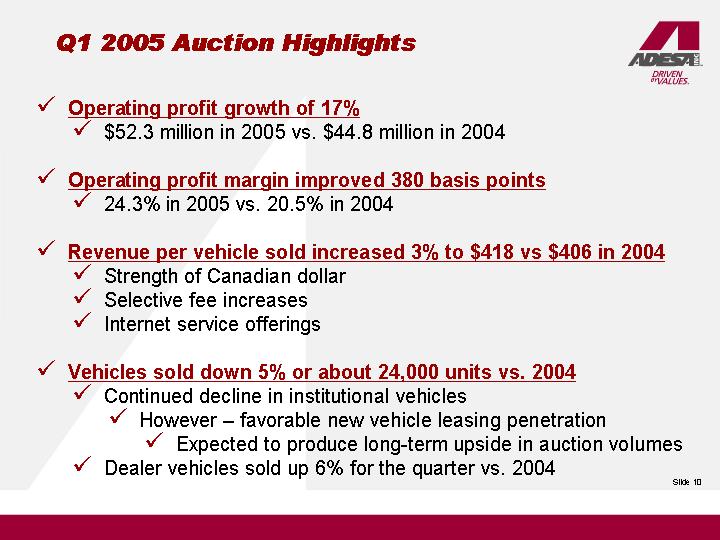
Q1 2005 Auction Highlights
• Operating profit growth of 17%
• $52.3 million in 2005 vs. $44.8 million in 2004
• Operating profit margin improved 380 basis points
• 24.3% in 2005 vs. 20.5% in 2004
• Revenue per vehicle sold increased 3% to $418 vs $406 in 2004
• Strength of Canadian dollar
• Selective fee increases
• Internet service offerings
• Vehicles sold down 5% or about 24,000 units vs. 2004
• Continued decline in institutional vehicles
• However – favorable new vehicle leasing penetration
• Expected to produce long-term upside in auction volumes
• Dealer vehicles sold up 6% for the quarter vs. 2004
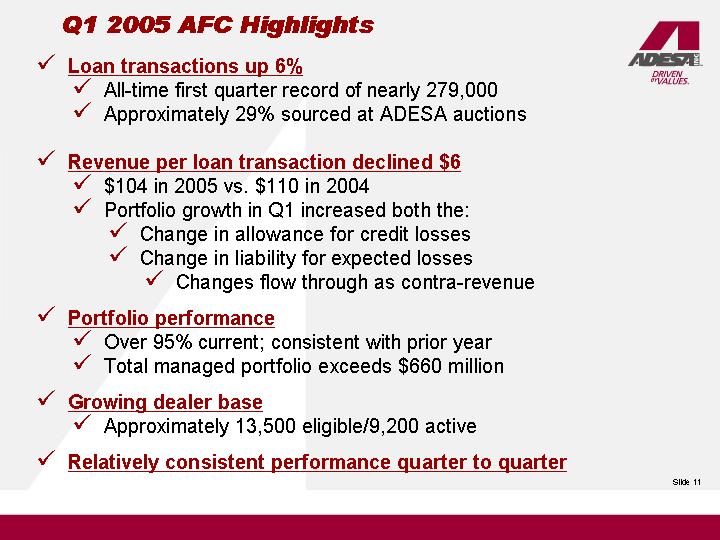
Q1 2005 AFC Highlights
• Loan transactions up 6%
• All-time first quarter record of nearly 279,000
• Approximately 29% sourced at ADESA auctions
• Revenue per loan transaction declined $6
• $104 in 2005 vs. $110 in 2004
• Portfolio growth in Q1 increased both the:
• Change in allowance for credit losses
• Change in liability for expected losses
• Changes flow through as contra-revenue
• Portfolio performance
• Over 95% current; consistent with prior year
• Total managed portfolio exceeds $660 million
• Growing dealer base
• Approximately 13,500 eligible/9,200 active
• Relatively consistent performance quarter to quarter
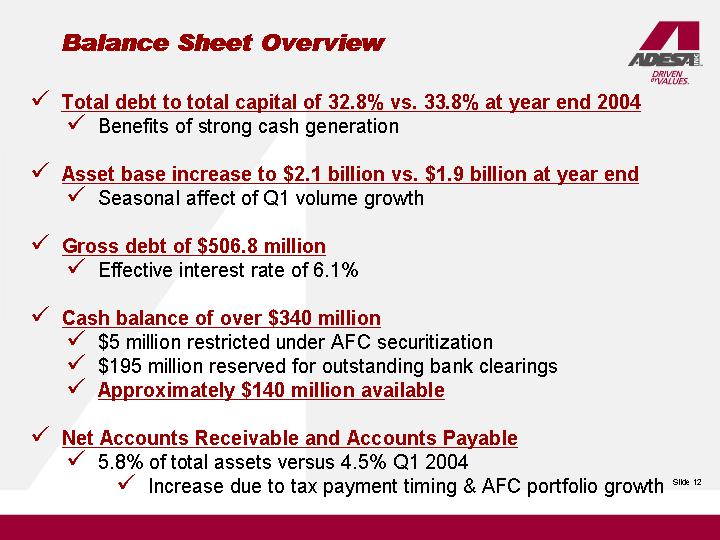
Balance Sheet Overview
• Total debt to total capital of 32.8% vs. 33.8% at year end 2004
• Benefits of strong cash generation
• Asset base increase to $2.1 billion vs. $1.9 billion at year end
• Seasonal affect of Q1 volume growth
• Gross debt of $506.8 million
• Effective interest rate of 6.1%
• Cash balance of over $340 million
• $5 million restricted under AFC securitization
• $195 million reserved for outstanding bank clearings
• Approximately $140 million available
• Net Accounts Receivable and Accounts Payable
• 5.8% of total assets versus 4.5% Q1 2004
• Increase due to tax payment timing & AFC portfolio growth
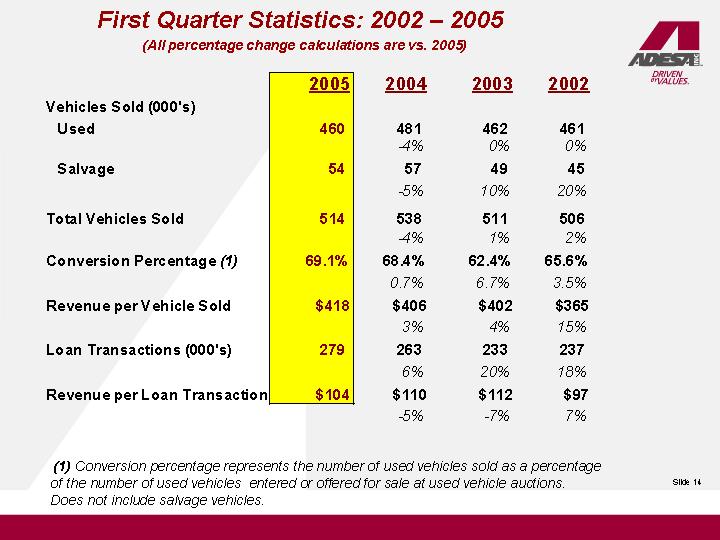
First Quarter Statistics: 2002 – 2005
(All percentage change calculations are vs. 2005)
First Quarter Statistics
| | 2005 | | 2004 | | 2003 | | 2002 | |
Vehicles Sold (000’s) | | | | | | | | | |
Used | | 460 | | 481 | | 462 | | 461 | |
| | | | -4 | % | 0 | % | 0 | % |
Salvage | | 54 | | 57 | | 49 | | 45 | |
| | | | -5 | % | 10 | % | 20 | % |
Total Vehicles Sold | | 514 | | 538 | | 511 | | 506 | |
| | | | -4 | % | 1 | % | 2 | % |
Conversion Percentage (1) | | 69.1 | % | 68.4 | % | 62.4 | % | 65.6 | % |
| | | | 0.7 | % | 6.7 | % | 3.5 | % |
Revenue per Vehicle Sold | | $ | 418 | | $ | 406 | | $ | 402 | | $ | 365 | |
| | | | 3 | % | 4 | % | 15 | % |
Loan Transactions (000’s) | | 279 | | 263 | | 233 | | 237 | |
| | | | 6 | % | 20 | % | 18 | % |
Revenue per Loan Transaction | | $ | 104 | | $ | 110 | | $ | 112 | | $ | 97 | |
| | | | -5 | % | -7 | % | 7 | % |
(1) Conversion percentage represents the number of used vehicles sold as a percentage of the number of used vehicles entered or offered for sale at used vehicle auctions. Does not include salvage vehicles.
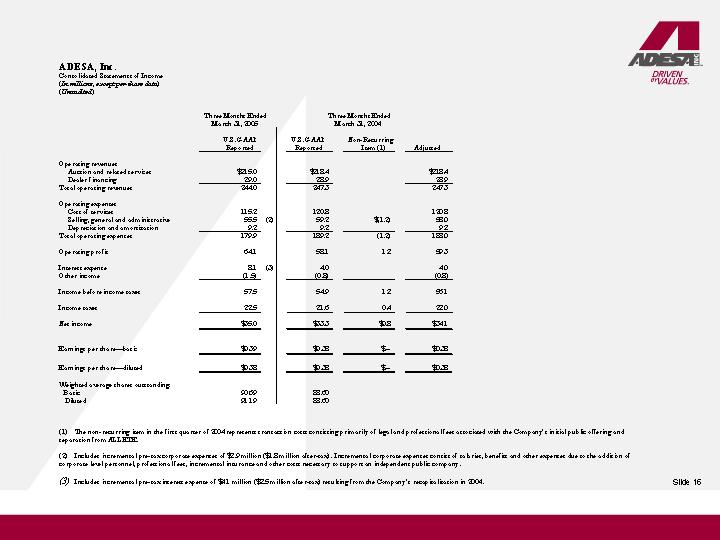
ADESA, Inc.
Consolidated Statements of Income
(In millions, except per-share data)
(Unaudited)
| | Three Months Ended
March 31, 2005 | | Three Months Ended
March 31, 2004 | |
| | U.S. GAAP
Reported | | U.S. GAAP
Reported | | Non-Recurring
Item (1) | | Adjusted | |
| | | | | | | | | |
Operating revenues | | | | | | | | | |
Auction and related services | | $ | 215.0 | | $ | 218.4 | | | | $ | 218.4 | |
Dealer financing | | 29.0 | | 28.9 | | | | 28.9 | |
Total operating revenues | | 244.0 | | 247.3 | | | | 247.3 | |
| | | | | | | | | |
Operating expenses | | | | | | | | | |
Cost of services | | 115.2 | | 120.8 | | | | 120.8 | |
Selling, general and administrative | | 55.5 | (2) | 59.2 | | $ | (1.2 | ) | 58.0 | |
Depreciation and amortization | | 9.2 | | 9.2 | | | | 9.2 | |
Total operating expenses | | 179.9 | | 189.2 | | (1.2 | ) | 188.0 | |
| | | | | | | | | |
Operating profit | | 64.1 | | 58.1 | | 1.2 | | 59.3 | |
| | | | | | | | | |
Interest expense | | 8.1 | (3) | 4.0 | | | | 4.0 | |
Other income | | (1.5 | ) | (0.8 | ) | | | (0.8 | ) |
| | | | | | | | | |
Income before income taxes | | 57.5 | | 54.9 | | 1.2 | | 56.1 | |
| | | | | | | | | |
Income taxes | | 22.5 | | 21.6 | | 0.4 | | 22.0 | |
| | | | | | | | | |
Net income | | $ | 35.0 | | $ | 33.3 | | $ | 0.8 | | $ | 34.1 | |
| | | | | | | | | |
Earnings per share—basic | | $ | 0.39 | | $ | 0.38 | | $ | — | | $ | 0.38 | |
| | | | | | | | | |
Earnings per share—diluted | | $ | 0.38 | | $ | 0.38 | | $ | — | | $ | 0.38 | |
| | | | | | | | | |
Weighted average shares outstanding: | | | | | | | | | |
Basic | | 90.69 | | 88.60 | | | | | |
Diluted | | 91.19 | | 88.60 | | | | | |
| | | | | | | | | | | | | | |
(1) The non-recurring item in the first quarter of 2004 represents transaction costs consisting primarily of legal and professional fees associated with the Company’s initial public offering and separation from ALLETE.
(2) Includes incremental pre-tax corporate expenses of $2.9 million ($1.8 million after-tax). Incremental corporate expenses consist of salaries, benefits and other expenses due to the addition of corporate level personnel, professional fees, incremental insurance and other costs necessary to support an independent public company.
(3) Includes incremental pre-tax interest expense of $4.1 million ($2.5 million after-tax) resulting from the Company’s recapitalization in 2004.
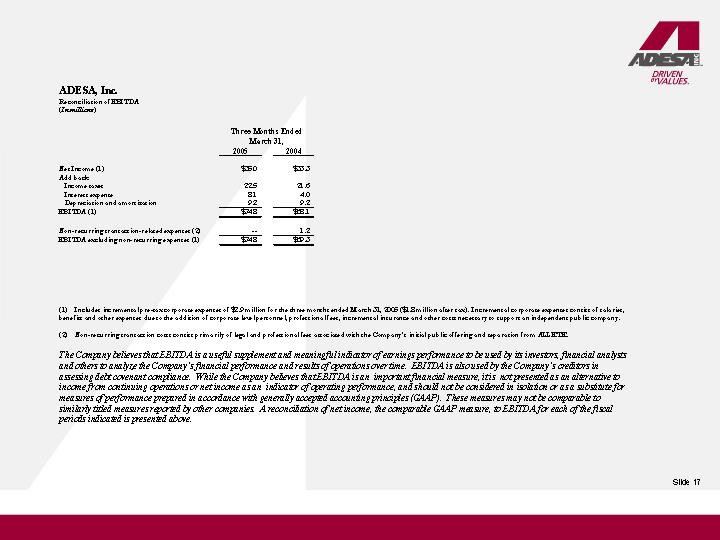
ADESA, Inc.
Reconciliation of EBITDA
(In millions)
| | Three Months Ended
March 31, | |
| | 2005 | | 2004 | |
| | | | | |
Net Income (1) | | $ | 35.0 | | $ | 33.3 | |
Add back: | | | | | |
Income taxes | | 22.5 | | 21.6 | |
Interest expense | | 8.1 | | 4.0 | |
Depreciation and amortization | | 9.2 | | 9.2 | |
EBITDA (1) | | $ | 74.8 | | $ | 68.1 | |
| | | | | |
Non-recurring transaction-related expenses (2) | | — | | 1.2 | |
EBITDA excluding non-recurring expenses (1) | | $ | 74.8 | | $ | 69.3 | |
(1) Includes incremental pre-tax corporate expenses of $2.9 million for the three months ended March 31, 2005 ($1.8 million after tax). Incremental corporate expenses consist of salaries, benefits and other expenses due to the addition of corporate level personnel, professional fees, incremental insurance and other costs necessary to support an independent public company.
(2) Non-recurring transaction costs consist primarily of legal and professional fees associated with the Company’s initial public offering and separation from ALLETE.
The Company believes that EBITDA is a useful supplement and meaningful indicator of earnings performance to be used by its investors, financial analysts and others to analyze the Company’s financial performance and results of operations over time. EBITDA is also used by the Company’s creditors in assessing debt covenant compliance. While the Company believes that EBITDA is an important financial measure, it is not presented as an alternative to income from continuing operations or net income as an indicator of operating performance, and should not be considered in isolation or as a substitute for measures of performance prepared in accordance with generally accepted accounting principles (GAAP). These measures may not be comparable to similarly titled measures reported by other companies. A reconciliation of net income, the comparable GAAP measure, to EBITDA for each of the fiscal periods indicated is presented above.