Searchable text section of graphics shown above
[GRAPHIC]
[LOGO]
Third Quarter 2005
Earnings Conference Call
October 28, 2005
Cautionary Statement | [LOGO] |
Forward-Looking Statements
This presentation includes forward-looking statements within the meaning of the Private Securities Litigation Reform Act of 1995. Such statements, including statements regarding anticipated financial results; the company’s 2005 guidance, the company’s acquisition opportunities and the company’s strategic initiatives are subject to certain risks, trends, and uncertainties that could cause actual results to differ materially from those projected, expressed or implied by such forward-looking statements. The statements are based on assumptions about important factors including: general business conditions; trends in new and used vehicle sales and incentives, including wholesale used vehicle pricing; economic conditions, including fuel prices and exchange rate and interest rate fluctuations; competition; market trends; business development activities, including acquisitions; litigation developments; weather; vehicle production; and the other risk factors described in the company’s Annual Report on Form 10-K, and other risks described from time to time in the company’s filings with the Securities and Exchange Commission. Many of these risk factors are outside of the company’s control, and as such, they involve risks which are not currently known to the company that could cause actual results to differ materially from forecasted results. The forward-looking statements in this document are made as of the date hereof and the company does not undertake to update its forward-looking statements.
This presentation includes certain non-GAAP measures. These non-GAAP measures are reconciled to the most directly comparable GAAP measures in Appendix 2 to this presentation.
2
ADESA, Inc. Third Quarter 2005 Performance Overview
Dave Gartzke
Chairman, President & CEO
3
Financial Highlights
Q3 2005 Financial Summary
• Revenue of $241 million (+6%)
• GAAP Income from Continuing Operations of $31.6 million, or $0.35 per diluted share
• Adjusted Income from Continuing Operations of $33 million, or $0.37 per diluted share
• 2005 excludes $1.5 million (after-tax), or $0.02 per diluted share, related to the July amendment of our credit facility
• 2004 excludes $8.7 million (after-tax), or $0.09 per diluted share, of debt prepayment and spin-related charges
• Q3 benefited from a 34.3% effective tax rate
4
Q3 Wholesale Used Vehicle Market Overview
Employee Pricing | | Hurricanes |
| | |
Increased New Vehicle Sales | | Increased Fuel Prices |
| | |
Soft Retail Used Vehicle Market
for Independent Dealers |
| | |
Soft Wholesale Used Vehicle Prices |
| | |
Decline in Conversion Rate & Volatility |
| | |
Decline in Operating Profit |
5
Recent Accomplishments
Business Segment Overview
• Dealer Financing (AFC) – Ninth consecutive quarter of year-over-year Loan Transaction Volume growth (+3.4%)
• Third quarter record of approximately 277,000 loan transactions
• Auction and Related Services – Tenth consecutive quarter of year-over-year Revenue Per Vehicle growth to $438 per vehicle
LiveBlock™ Technology
• Achieved “Million Vehicle Milestone” in July for vehicles offered
• Offered over 260,000 vehicles for sale on LiveBlock in Q3 2005
• Continued growth – both the number of vehicles sold to online bidders, as well as the number of vehicles sold where the online bid was the 2nd highest, more than doubled vs. Q3 ‘04
Auction ACCESS® rollout to simplify dealer registration
• Commenced rollout of Auction ACCESS® dealer registration program throughout ADESA U.S. auction locations which will further enhance used vehicle dealer “buying experience” at ADESA
• Anticipate completing roll-out to U.S. auctions Q1 ‘06
6
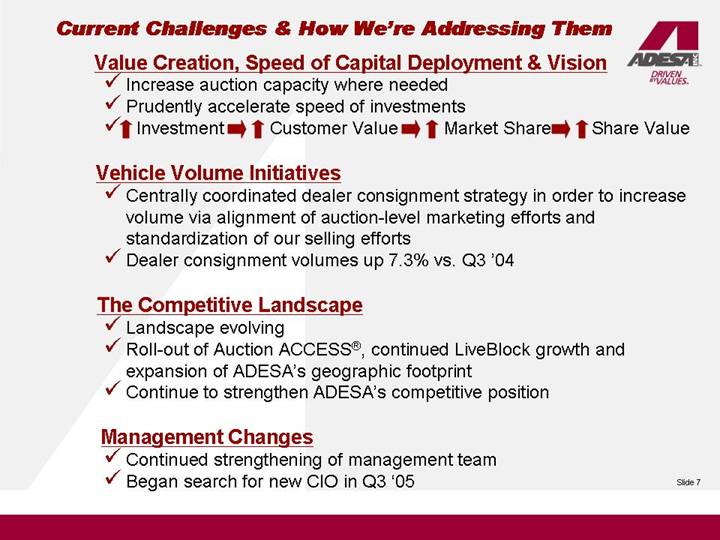
Current Challenges & How We’re Addressing Them
Value Creation, Speed of Capital Deployment & Vision
• Increase auction capacity where needed
• Prudently accelerate speed of investments
• ã Investment â ãCustomer Value â ãMarket Share â ãShare Value
Vehicle Volume Initiatives
• Centrally coordinated dealer consignment strategy in order to increase volume via alignment of auction-level marketing efforts and standardization of our selling efforts
• Dealer consignment volumes up 7.3% vs. Q3 ‘04
The Competitive Landscape
• Landscape evolving
• Roll-out of Auction ACCESS®, continued LiveBlock growth and expansion of ADESA’s geographic footprint
• Continue to strengthen ADESA’s competitive position
Management Changes
• Continued strengthening of management team
• Began search for new CIO in Q3 ‘05
7
ADESA, Inc. Third Quarter & YTD 2005 Financial Review
Cam Hitchcock
EVP and Chief Financial Officer
8
Q3 2005 Financial Overview
($ In Millions, Except Per Share Amounts)
Item | | As of
Q3 2005 | | Variance vs.
Q3 2004
Dollars / % | | Explanation / Notes |
| | | | | | |
Revenue | | $ | 241.0 | | $14.0 / 6.2% | | Revenue per vehicle +5.5%, |
| | | | | | Loan volume + 3.4%; Revenue per loan |
| | | | | | +12.3%; Fx = $3.7M favorable |
| | | | | | |
Cost of Services | | $ | 116.8 | | $7.2 / 6.6% | | Unfavorable conversion rate, FX, |
| | | | | | conversion rate volatility, fuel costs, |
| | | | | | costs from acquisitions |
| | | | | | |
SG&A | | $ | 57.5* | | $5.3 / 10.2% | | Compensation and benefit costs, |
| | | | | | dealer consignment training, SOX, |
| | | | | | FX, costs from acquisitions |
| | | | | | |
Operating Profit/ | | $ | 55.9 | * | ($0.8) / (1.4%) | | Decline in conversion rate and |
Operating Margin | | /23.2 | %* | (180) basis points | | conversion rate volatility |
| | | | | | |
Interest Expense | | $ | 7.4 | | ($1.3) / (14.9%) | | Benefits from July 2005 refinancing |
| | | | | | |
Tax Rate | | 34.5 | %* | (490) basis points | | Strategic tax initiatives and changes |
| | | | | | to previous estimates |
| | | | | | |
Adjusted Income from
Continuing Ops. | | $ | 33.1 | * | $2.9 / 9.6% | | 2005 excludes $1.5M (after-tax) refinancing costs |
| | | | | | |
Adjusted EPS from Continuing Ops. | | $ | 0.37 | * | $0.05 / 15.9% | | 2005 excludes non-recurring costs ($0.02) |
| | | | | | |
GAAP Income from Continuing Ops. | | $ | 31.6 | | $10.1 / 47.0% | | |
| | | | | | |
GAAP EPS from Continuing Ops. | | $ | 0.35 | | $0.12 / 55.4% | | |
* Q3 2004 adjusted for $0.4M (pre-tax) non-recurring SG&A costs and $14.0 million pre-tax loss on extinguisment of debt. Q3 2005 adjusted for $2.9 million pre-tax loss on debt refinancing and $0.5 million pre-tax gain on termination of interest rate swap.
9
2005 Tax Rate Highlights
Strategic Tax Initiatives
• The decline in effective tax rate was due to the company’s ongoing review of its tax structure and positions in both the U.S. and Canada
• Rate benefited from adjustments to previous estimates related to strategic initiatives and planning
• $12M cash flow benefit related to initiatives
• Effective tax rate for full-year 2005 expected to be 37.6%
10
Q3 2005 Consolidated EBITDA Walk Forward
(In Millions)
| | | | Percentage of
EBITDA Growth | |
| | | | | |
Q3 2004 Adjusted EBITDA* | | $ | 67.0 | | | |
| | | | | |
2005 Results: | | | | | |
| | | | | |
Increase in revenue | | 14.0 | | 20.9 | % |
| | | | | |
Increase in operating expense | | (12.5 | ) | (18.7 | )% |
| | | | | |
Increase in other income | | 0.2 | | 0.3 | % |
| | | | | |
Net Increase | | 1.7 | | 2.5 | % |
| | | | | |
Q3 2005 Adjusted EBITDA** | | $ | 68.7 | | | |
* 2004 excludes $14.4 million in non-recurring transaction and debt prepayment expenses
** 2005 excludes net non-recurring $2.4 million related to credit facility amendment
11
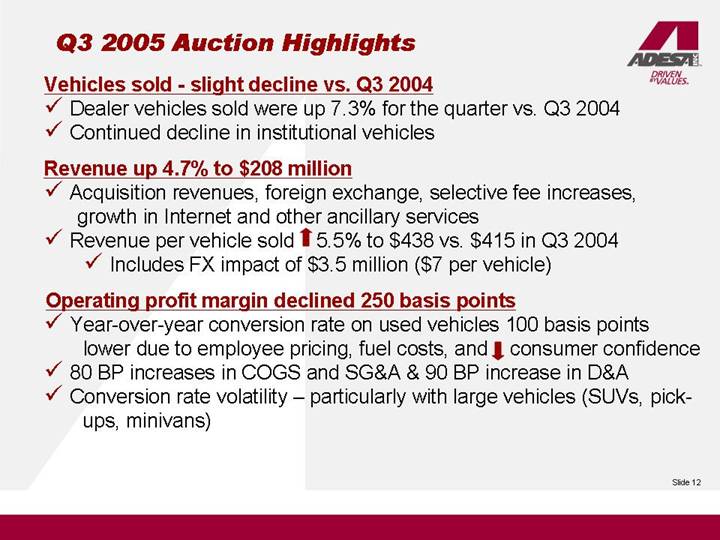
Q3 2005 Auction Highlights
Vehicles sold - slight decline vs. Q3 2004
• Dealer vehicles sold were up 7.3% for the quarter vs. Q3 2004
• Continued decline in institutional vehicles
Revenue up 4.7% to $208 million
• Acquisition revenues, foreign exchange, selective fee increases, growth in Internet and other ancillary services
• Revenue per vehicle sold ã 5.5% to $438 vs. $415 in Q3 2004
• Includes FX impact of $3.5 million ($7 per vehicle)
Operating profit margin declined 250 basis points
• Year-over-year conversion rate on used vehicles 100 basis points lower due to employee pricing, fuel costs, and ä consumer confidence
• 80 BP increases in COGS and SG&A & 90 BP increase in D&A
• Conversion rate volatility – particularly with large vehicles (SUVs, pickups, minivans)
12
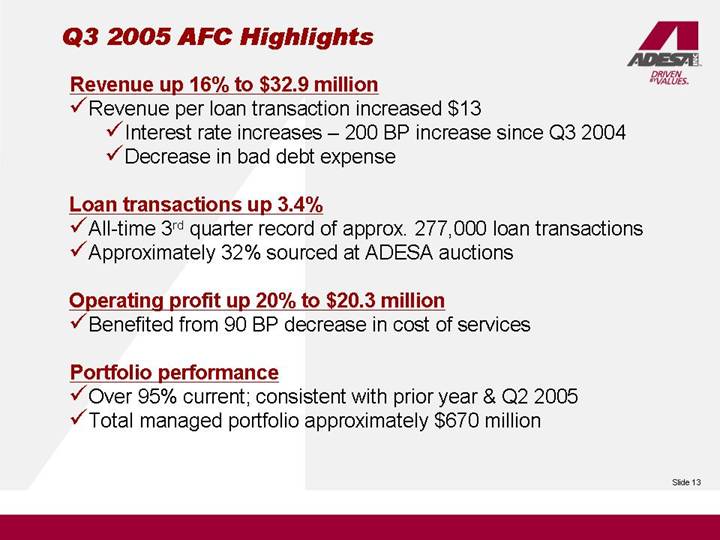
Q3 2005 AFC Highlights
Revenue up 16% to $32.9 million
• Revenue per loan transaction increased $13
• Interest rate increases – 200 BP increase since Q3 2004
• Decrease in bad debt expense
Loan transactions up 3.4%
• All-time 3rd quarter record of approx. 277,000 loan transactions
• Approximately 32% sourced at ADESA auctions
Operating profit up 20% to $20.3 million
• Benefited from 90 BP decrease in cost of services
Portfolio performance
• Over 95% current; consistent with prior year & Q2 2005
• Total managed portfolio approximately $670 million
13
Balance Sheet Overview
Total debt to total capital of 30.0% vs. 32.5% at Q2 2005
Cash balance of over $286 million vs. $254 million @ Q2 ‘05
• Approximately $117 million available for shareholder initiatives
• Approximately $163 million unavailable due to bank clearings
• $6 million restricted under AFC securitization
Asset base flat at $2.1 billion vs. Q2 2005
Gross debt of $460.1 million
• Benefits from July 2005 amendment of credit facility
• Effective interest rate of approximately 6.0%, down over 40 basis points vs. Q2 2005
• Debt pay down of $37.5 million
14
YTD 2005 Major Cash Flow Uses
($ In Millions)
| | Q1 2005 | | Q2 2005 | | Q3 2005 | | YTD | |
| | | | | | | | | |
CASH PAID FOR INTEREST | | $ | (4.9 | ) | $ | (9.9 | ) | $ | (4.3 | ) | $ | (19.1 | ) |
| | | | | | | | | |
CASH TAXES | | $ | (21.6 | ) | $ | (24.6 | ) | $ | (2.0 | ) | $ | (48.2 | ) |
| | | | | | | | | |
DIVIDENDS | | $ | (6.9 | ) | $ | (6.6 | ) | $ | (6.7 | ) | $ | (20.2 | ) |
| | | | | | | | | |
DEBT REPAYMENT | | $ | (9.3 | ) | $ | (9.2 | ) | $ | (37.5 | ) | $ | (56.0 | ) |
| | | | | | | | | |
CAPITAL EXPENDITURES* | | $ | (20.0 | ) | $ | (16.7 | ) | $ | (11.1 | ) | $ | (47.8 | ) |
| | | | | | | | | |
SHARE REPURCHASES | | $ | (4.7 | ) | $ | (38.7 | ) | $ | (0.1 | ) | $ | (43.5 | ) |
| | | | | | | | | |
ACQUISITIONS | | $ | — | | $ | (18.7 | ) | $ | — | | $ | (18.7 | ) |
| | | | | | | | | |
DIVESTITURES | | $ | — | | $ | — | | $ | 3.3 | | $ | 3.3 | |
* As indicated on ADESA’s Q2 2005 earnings conference call, annual 2005 cap-ex was anticipated to be at the high end of a $50-to-$60 million range; this outlook on capital spending has not changed.
15
2005 Share History
(In Millions)
| | Q1 | | Q2 | | Q3 | | YTD | |
| | | | | | | | | |
ACTUAL SHARES O/S | | 90.8 | | 89.5 | | 89.6 | | 89.6 | |
| | | | | | | | | |
WEIGHTED AVE DILUTED SHARES O/S | | 91.2 | | 90.1 | | 90.0 | | 90.4 | |
| | | | | | | | | |
TREASURY SHARES | | 4.1 | | 5.4 | | 5.3 | | 5.3 | |
| | | | | | | | | |
SHARES REPURCHASED | | 0.4 | | 1.5 | | — | | 1.9 | |
16
YTD 2005 Financial Overview
($ In Millions, Except Earnings Per Share Amounts)
Item | | 9 months ended
Sep-05 | | Variance vs.
9 months 9/04
Dollars / % | | Explanation / Notes |
| | | | | | |
Revenue | | $ | 730.2 | | $28.1 / 4.0% | | Revenue per vehicle +5.1%; |
| | | | | | Loan volume + 4%; |
| | | | | | FX approximately $11M favorable |
| | | | | | |
Adjusted Income from | | $ | 104.3 | | $7.0 / 7.2% | | 2005/2004 excludes $2.4M/$17M |
Continuing Ops. | | | | | | (pre-tax) of non-recurring costs |
| | | | | | ($1.5M/$10.3M after-tax) |
| | | | | | |
Adjusted EPS from | | | | | | 2005 excludes $0.01 per diluted share |
Continuing Ops. | | $ | 1.15 | | $0.08 / 8.0% | | of non-recurring costs |
| | | | | | |
Weighted Avg. Diluted Shares | | 90.4 | M | (0.7)M shares/(0.8%) | | vs. 91.1M shares in 2004 |
| | | | | | |
GAAP Income from | | | | | | |
Continuing Ops. | | $ | 102.8 | | $15.8 / 18.2% | | |
| | | | | | |
GAAP EPS from | | | | | | |
Continuing Ops. | | $ | 1.14 | | $0.19 / 19.1% | | |
17
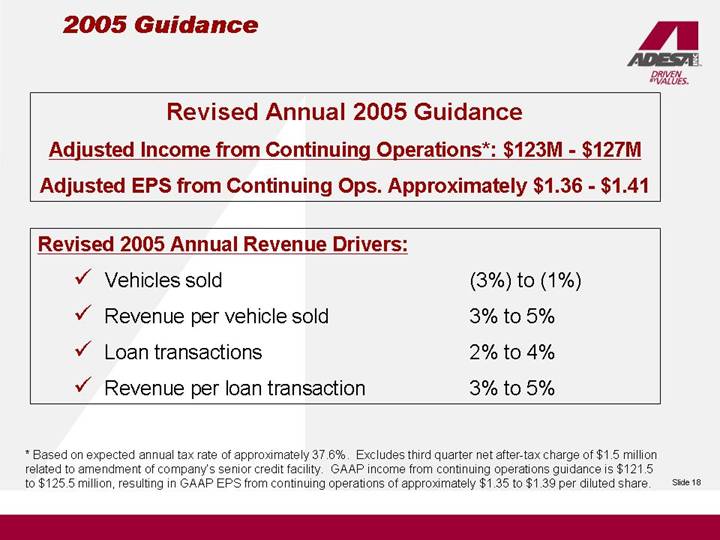
2005 Guidance
Revised Annual 2005 Guidance
Adjusted Income from Continuing Operations*: $123M -$127M
Adjusted EPS from Continuing Ops. Approximately $1.36 - $1.41
Revised 2005 Annual Revenue Drivers:
• Vehicles sold | | (3%) to (1%) |
| | |
• Revenue per vehicle sold | | 3% to 5% |
| | |
• Loan transactions | | 2% to 4% |
| | |
• Revenue per loan transaction | | 3% to 5% |
* Based on expected annual tax rate of approximately 37.6%. Excludes third quarter net after-tax charge of $1.5 million related to amendment of company’s senior credit facility. GAAP income from continuing operations guidance is $121.5 to $125.5 million, resulting in GAAP EPS from continuing operations of approximately $1.35 to $1.39 per diluted share.
18
QUESTION AND ANSWER
SESSION
19
DAVID GARTZKE
CLOSING REMARKS
20
Third Quarter Statistics: 2002 – 2005 |
(All percentage change calculations are vs. 2005) |
| | 2005* | | 2004 | | 2003 | | 2002 | |
| | | | | | | | | |
Vehicles Sold (000’s) | | | | | | | | | |
| | | | | | | | | |
Used | | 430 | | 431 | | 458 | | 433 | |
| | | | 0 | % | -6 | % | -1 | % |
Salvage | | 45 | | 47 | | 45 | | 41 | |
| | | | -4 | % | 0 | % | 10 | % |
Total Vehicles Sold | | 475 | | 478 | | 503 | | 474 | |
| | | | -1 | % | -6 | % | 0 | % |
Conversion Percentage (1) | | 58.8 | % | 59.8 | % | 61.1 | % | 56.0 | % |
| | | | -1.0 | % | -2.3 | % | 2.8 | % |
Revenue per Vehicle Sold (2) | | $ | 438 | | $ | 415 | | $ | 393 | | $ | 382 | |
| | | | 6 | % | 11 | % | 15 | % |
Loan Transactions (000’s) | | 277 | | 268 | | 238 | | 237 | |
| | | | 3 | % | 16 | % | 17 | % |
Revenue per Loan Transaction | | $ | 119 | | $ | 106 | | $ | 107 | | $ | 108 | |
| | | | 12 | % | 11 | % | 10 | % |
* Includes vehicle volumes from recent acquisitions
(1) Conversion percentage represents the number of used vehicles sold as a percentage of the number of used vehicles entered or offered for sale at used vehicle auctions. Does not include salvage vehicles.
(2) Amounts restated to exclude the operations of ComSearch, Inc. which was sold in Q3 2005.
22
ADESA, Inc.
Consolidated Statements of Income
(In millions, except per-share data)
(Unaudited)
| | Three Months Ended
September 30, 2005 | | Three Months Ended
September 30, 2004 (4) | |
| | U.S. GAAP
Reported | | Non-
Recurring
Items | | Adjusted | | U.S. GAAP
Reported | | Non-
Recurring
Items | | Adjusted | |
| | | | | | | | | | | | | |
Operating revenues | | | | | | | | | | | | | |
Auction and related services | | $ | 208.1 | | | | $ | 208.1 | | $ | 198.7 | | | | $ | 198.7 | |
Dealer financing | | 32.9 | | | | 32.9 | | 28.3 | | | | 28.3 | |
Total operating revenues | | 241.0 | | | | 241.0 | | 227.0 | | | | 227.0 | |
| | | | | | | | | | | | | |
Operating expenses | | | | | | | | | | | | | |
Cost of services | | 116.8 | | | | 116.8 | | 109.6 | | | | 109.6 | |
Selling, general and administrative | | 57.5 | | | | 57.5 | | 52.6 | | $ | (0.4 | )(3) | 52.2 | |
Depreciation and amortization | | 10.8 | | | | 10.8 | | 8.5 | | | | 8.5 | |
Total operating expenses | | 185.1 | | | | 185.1 | | 170.7 | | (0.4 | ) | 170.3 | |
| | | | | | | | | | | | | |
Operating profit | | 55.9 | | | | 55.9 | | 56.3 | | 0.4 | | 56.7 | |
| | | | | | | | | | | | | |
Interest expense | | 7.4 | | | | 7.4 | | 8.7 | | | | 8.7 | |
Other income | | (2.5 | ) | $ | 0.5 | (1) | (2.0 | ) | (1.8 | ) | | | (1.8 | ) |
Loss on extinguishment of debt | | 2.9 | | (2.9 | )(2) | — | | 14.0 | | (14.0 | )(2) | — | |
| | | | | | | | | | | | | |
Income from continuing operations before income taxes | | 48.1 | | 2.4 | | 50.5 | | 35.4 | | 14.4 | | 49.8 | |
| | | | | | | | | | | | | |
Income taxes | | 16.5 | | 0.9 | | 17.4 | | 13.9 | | 5.7 | | 19.6 | |
| | | | | | | | | | | | | |
Income from continuing operations | | $ | 31.6 | | $ | 1.5 | | $ | 33.1 | | $ | 21.5 | | $ | 8.7 | | $ | 30.2 | |
| | | | | | | | | | | | | |
Loss from discontinued operations, net of income taxes | | (0.1 | ) | | | | | — | | | | | |
| | | | | | | | | | | | | |
Net income | | $ | 31.5 | | | | | | $ | 21.5 | | | | | |
| | | | | | | | | | | | | |
Earnings per share—basic and diluted | | | | | | | | | | | | | |
Income from continuing operations | | $ | 0.35 | | $ | 0.02 | | $ | 0.37 | | $ | 0.23 | | $ | 0.09 | | $ | 0.32 | |
Loss from discontinued operations, net of income taxes | | — | | | | | | — | | | | | |
Net income | | $ | 0.35 | | | | | | $ | 0.23 | | | | | |
| | | | | | | | | | | | | |
Weighted average shares outstanding: | | | | | | | | | | | | | |
Basic | | 89.53 | | | | 89.53 | | 94.86 | | | | 94.86 | |
Diluted | | 89.97 | | | | 89.97 | | 95.11 | | | | 95.11 | |
(1) The interest rate swap agreement related to the former Term Loan B facility was terminated in the third quarter of 2005, as a result of the Term Loan B facility being repaid. Consequently, the $0.5 million unrealized gain on hedge that was a component of “Other Comprehensive Income” prior to the termination, was recorded as a $0.5 million realized gain in “Other Income” in the third quarter of 2005.
(2) In the third quarter of 2005, a charge was incurred for the write-off of unamortized debt issuance costs associated with the company’s June 2004 credit facility and expenses related to the amended and restated credit facility. Debt prepayment expenses in 2004 consisted of make-whole premiums related to the redemption of the company’s senior notes and write-off of related unamortized debt issuance costs.
(3) In 2004, transaction-related costs consisted primarily of legal and professional fees associated with the initial public offering and separation from former parent company, ALLETE, Inc.
(4) Amounts restated to reflect the operations of ComSearch, Inc. as discontinued operations.
24
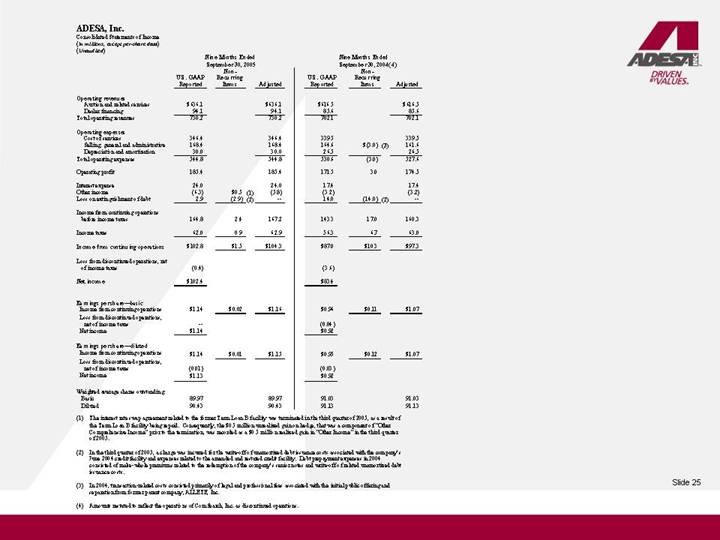
ADESA, Inc.
Consolidated Statements of Income
(In millions, except per share data)
(Unaudited)
| | Nine Months Ended
September 30, 2005 | | Nine Months Ended
September 30, 2004(4) | |
| | U.S. GAAP
Reported | | Non-
Recurring
Items | | Adjusted | | U.S. GAAP
Reported | | Non-
Recurring
Items | | Adjusted | |
| | | | | | | | | | | | | |
Operating revenues | | | | | | | | | | | | | |
Auction and related services | | $ | 636.1 | | | | $ | 636.1 | | $ | 616.5 | | | | $ | 616.5 | |
Dealer financing | | 94.1 | | | | 94.1 | | 85.6 | | | | 85.6 | |
Total operating revenues | | 730.2 | | | | 730.2 | | 702.1 | | | | 702.1 | |
| | | | | | | | | | | | | |
Operating expenses | | | | | | | | | | | | | |
Cost of services | | 346.4 | | | | 346.4 | | 339.5 | | | | 339.5 | |
Selling, general and administrative | | 168.4 | | | | 168.4 | | 164.6 | | $ | (3.0 | )(3) | 161.6 | |
Depreciation and amortization | | 30.0 | | | | 30.0 | | 26.5 | | | | 26.5 | |
Total operating expenses | | 544.8 | | | | 544.8 | | 530.6 | | (3.0 | ) | 527.6 | |
| | | | | | | | | | | | | |
Operating profit | | 185.4 | | | | 185.4 | | 171.5 | | 3.0 | | 174.5 | |
| | | | | | | | | | | | | |
Interest expense | | 24.0 | | | | 24.0 | | 17.4 | | | | 17.4 | |
Other income | | (6.3 | ) | $ | 0.5 | (1) | (5.8 | ) | (3.2 | ) | | | (3.2 | ) |
Loss on extinguishment of debt | | 2.9 | | (2.9 | )(2) | — | | 14.0 | | (14.0 | )(2) | — | |
| | | | | | | | | | | | | |
Income from continuing operations before income taxes | | 164.8 | | 2.4 | | 167.2 | | 143.3 | | 17.0 | | 160.3 | |
| | | | | | | | | | | | | |
Income taxes | | 62.0 | | 0.9 | | 62.9 | | 56.3 | | 6.7 | | 63.0 | |
| | | | | | | | | | | | | |
Income from continuing operations | | $ | 102.8 | | $ | 1.5 | | $ | 104.3 | | $ | 87.0 | | $ | 10.3 | | $ | 97.3 | |
| | | | | | | | | | | | | |
Loss from discontinued operations, net of income taxes | | (0.4 | ) | | | | | (3.6 | ) | | | | |
| | | | | | | | | | | | | |
Net income | | $ | 102.4 | | | | | | $ | 83.4 | | | | | |
| | | | | | | | | | | | | |
Earnings per share—basic | | | | | | | | | | | | | |
Income from continuing operations | | $ | 1.14 | | $ | 0.02 | | $ | 1.16 | | $ | 0.96 | | $ | 0.11 | | $ | 1.07 | |
Loss from discontinued operations, net of income taxes | | — | | | | | | (0.04 | ) | | | | |
Net income | | $ | 1.14 | | | | | | $ | 0.92 | | | | | |
| | | | | | | | | | | | | |
Earnings per share—diluted | | | | | | | | | | | | | |
Income from continuing operations | | $ | 1.14 | | $ | 0.01 | | $ | 1.15 | | $ | 0.95 | | $ | 0.12 | | $ | 1.07 | |
Loss from discontinued operations, net of income taxes | | (0.01 | ) | | | | | (0.03 | ) | | | | |
Net income | | $ | 1.13 | | | | | | $ | 0.92 | | | | | |
| | | | | | | | | | | | | |
Weighted average shares outstanding: | | | | | | | | | | | | | |
Basic | | 89.97 | | | | 89.97 | | 91.03 | | | | 91.03 | |
Diluted | | 90.43 | | | | 90.43 | | 91.13 | | | | 91.13 | |
(1) The interest rate swap agreement related to the former Term Loan B facility was terminated in the third quarter of 2005, as a result of the Term Loan B facility being repaid. Consequently, the $0.5 million unrealized gain on hedge, that was a component of “Other Comprehensive Income” prior to the termination, was recorded as a $0.5 million realized gain in “Other Income” in the third quarter of 2005.
(2) In the third quarter of 2005, a charge was incurred for the write-off of unamortized debt issuance costs associated with the company’s June 2004 credit facility and expenses related to the amended and restated credit facility. Debt prepayment expenses in 2004 consisted of make-whole premiums related to the redemption of the company’s senior notes and write-off of related unamortized debt issuance costs.
(3) In 2004, transaction-related costs consisted primarily of legal and professional fees associated with the initial public offering and separation from former parent company, ALLETE, Inc.
(4) Amounts restated to reflect the operations of ComSearch, Inc. as discontinued operations.
25
ADESA, Inc.
Condensed Consolidated Balance Sheets
(In millions)
| | September 30, 2005 | | December 31, 2004 * | |
| | (Unaudited) | | | |
| | | | | |
Cash and cash equivalents | | $ | 286.0 | | $ | 309.4 | |
Trade receivables, net | | 250.5 | | 160.2 | |
Finance receivables, net | | 257.4 | | 218.6 | |
Other current assets | | 47.7 | | 42.6 | |
| | | | | |
Total current assets | | 841.6 | | 730.8 | |
| | | | | |
Other assets | | 617.6 | | 606.1 | |
Property and equipment, net | | 598.3 | | 576.6 | |
| | | | | |
Total assets | | $ | 2,057.5 | | $ | 1,913.5 | |
| | | | | |
Current liabilities, excluding current maturities of debt | | $ | 457.4 | | $ | 335.5 | |
Current maturities of debt | | 80.1 | | 37.1 | |
| | | | | |
Total current liabilities | | 537.5 | | 372.6 | |
| | | | | |
Long-term debt | | 380.0 | | 479.0 | |
Other non-current liabilities | | 67.7 | | 50.5 | |
Stockholders’ equity | | 1,072.3 | | 1,011.4 | |
| | | | | |
Total liabilities and equity | | $ | 2,057.5 | | $ | 1,913.5 | |
* Amounts restated to reflect the operations of ComSearch, Inc. as discontinued operations.
26
ADESA, Inc.
Reconciliation of EBITDA
(In millions)
| | Three Months Ended
September 30, | | Nine Months Ended
September 30, | |
| | 2005 | | 2004 (4) | | 2005 | | 2004 (4) | |
| | | | | | | | | |
Income from continuing operations (1) | | $ | 31.6 | | $ | 21.5 | | $ | 102.8 | | $ | 87.0 | |
Add back: | | | | | | | | | |
Income taxes | | 16.5 | | 13.9 | | 62.0 | | 56.3 | |
Interest expense | | 7.4 | | 8.7 | | 24.0 | | 17.4 | |
Depreciation and amortization | | 10.8 | | 8.5 | | 30.0 | | 26.5 | |
EBITDA (1) | | $ | 66.3 | | $ | 52.6 | | $ | 218.8 | | $ | 187.2 | |
| | | | | | | | | |
Non-recurring transaction-related and debt prepayment expenses (2) | | 2.9 | | 14.4 | | 2.9 | | 17.0 | |
Gain on termination of SWAP (3) | | (0.5 | ) | — | | (0.5 | ) | — | |
EBITDA excluding non-recurring expenses (1) | | $ | 68.7 | | $ | 67.0 | | $ | 221.2 | | $ | 204.2 | |
(1) Includes incremental pre-tax corporate expenses of $3.9 million for the nine months ended September 30, 2005 ($2.4 million after tax). Incremental corporate expenses consist of salaries, benefits and other expenses due to the addition of corporate level personnel, professional fees, incremental insurance and other costs necessary to support an independent public company.
(2) In the third quarter of 2005, a charge was incurred for the write-off of certain unamortized debt issuance costs associated with the Company’s June 2004 credit facility and certain expenses related to the amended credit facility. In 2004, transaction-related costs consisted primarily of legal and professional fees associated with the initial public offering and separation from former parent company, ALLETE, Inc. Debt prepayment expenses in 2004 consisted of make-whole premiums related to the redemption of the Company’s senior notes and the write-off of related unamortized debt issuance costs.
(3) The interest rate swap agreement related to the former Term Loan B facility was terminated in the third quarter of 2005, as a result of the Term Loan B facility being repaid. Consequently, the $0.5 million unrealized gain on hedge that was a component of “Other Comprehensive Income” prior to the termination, was recorded as a $0.5 million realized gain in “Other Income” in the third quarter of 2005.
(4) Amounts restated to reflect the operations of ComSearch, Inc. as discontinued operations.
The company believes that EBITDA is a useful supplement and meaningful indicator of earnings performance to be used by its investors, financial analysts and others to analyze the company’s financial performance and results of operations over time. EBITDA is also used by the company’s creditors in assessing debt covenant compliance. While the company believes that EBITDA is an important financial measure, it is not presented as an alternative to income from continuing operations or net income as an indicator of operating performance, and should not be considered in isolation or as a substitute for measures of performance prepared in accordance with generally accepted accounting principles (GAAP). These measures may not be comparable to similarly titled measures reported by other companies. A reconciliation of income from continuing operations, the comparable GAAP measure, to EBITDA for each of the fiscal periods indicated is presented above.
27