Searchable text section of graphics shown above
[GRAPHIC]
[LOGO]
Fourth Quarter 2005
Earnings Conference Call
February 14, 2006
Cautionary Statement | [LOGO] |
Forward-Looking Statements
This presentation includes forward-looking statements within the meaning of the Private Securities Litigation Reform Act of 1995. Such statements, including statements regarding anticipated financial results, the company’s 2006 guidance, the 2006 industry outlook, the company’s acquisition opportunities and the company’s goals and strategic initiatives are subject to certain risks, trends, and uncertainties that could cause actual results to differ materially from those projected, expressed or implied by such forward-looking statements. The statements are based on assumptions about important factors including: general business conditions; trends in new and used vehicle sales and incentives, including wholesale used vehicle pricing; economic conditions, including fuel prices, Canadian exchange rate and interest rate fluctuations; competition; market trends; business development activities, including acquisitions; investments in technology; litigation developments; weather; vehicle production; and the other risk factors described in the company’s Annual Report on Form 10-K, and other risks described from time to time in the company’s filings with the Securities and Exchange Commission. Many of these risk factors are outside of the company’s control, and as such, they involve risks which are not currently known to the company that could cause actual results to differ materially from forecasted results. The forward-looking statements in this document are made as of the date hereof and the company does not undertake to update its forward-looking statements.
This presentation includes certain non-GAAP measures. These non-GAAP measures are reconciled to the most directly comparable GAAP measures in Appendix 2 to this presentation.
2
Financial Highlights
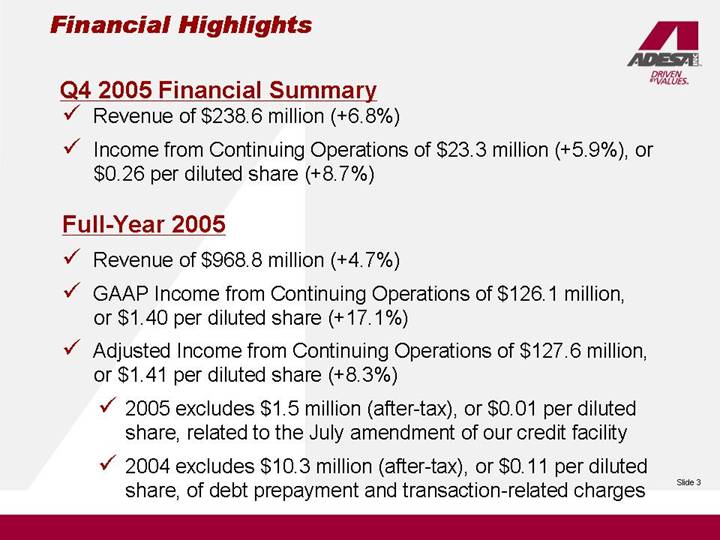
Q4 2005 Financial Summary
• Revenue of $238.6 million (+6.8%)
• Income from Continuing Operations of $23.3 million (+5.9%), or $0.26 per diluted share (+8.7%)
Full-Year 2005
• Revenue of $968.8 million (+4.7%)
• GAAP Income from Continuing Operations of $126.1 million, or $1.40 per diluted share (+17.1%)
• Adjusted Income from Continuing Operations of $127.6 million, or $1.41 per diluted share (+8.3%)
• 2005 excludes $1.5 million (after-tax), or $0.01 per diluted share, related to the July amendment of our credit facility
• 2004 excludes $10.3 million (after-tax), or $0.11 per diluted share, of debt prepayment and transaction-related charges
3
ADESA, Inc. Fourth Quarter and 2005 Performance Overview
Dave Gartzke
Chairman, President & CEO
4
2005 Performance Highlights
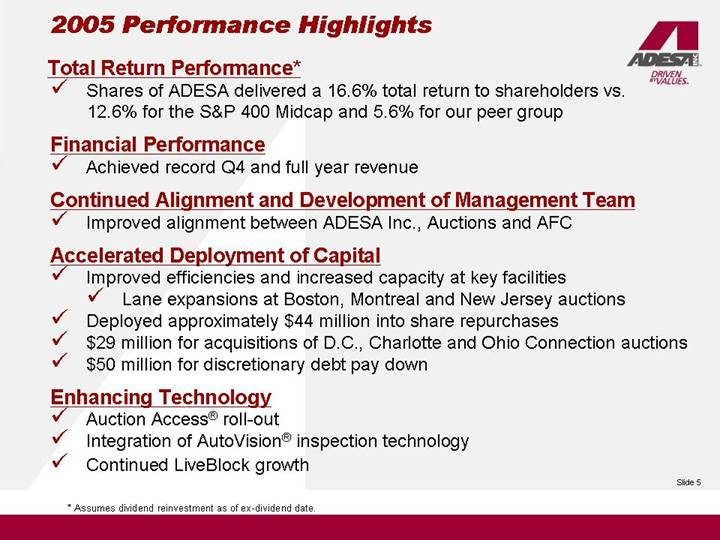
Total Return Performance*
• Shares of ADESA delivered a 16.6% total return to shareholders vs. 12.6% for the S&P 400 Midcap and 5.6% for our peer group
Financial Performance
• Achieved record Q4 and full year revenue
Continued Alignment and Development of Management Team
• Improved alignment between ADESA Inc., Auctions and AFC
Accelerated Deployment of Capital
• Improved efficiencies and increased capacity at key facilities
• Lane expansions at Boston, Montreal and New Jersey auctions
• Deployed approximately $44 million into share repurchases
• $29 million for acquisitions of D.C., Charlotte and Ohio Connection auctions
• $50 million for discretionary debt pay down
Enhancing Technology
• Auction Access® roll-out
• Integration of AutoVision® inspection technology
• Continued LiveBlock growth
* Assumes dividend reinvestment as of ex-dividend date.
5
2006 Transactions
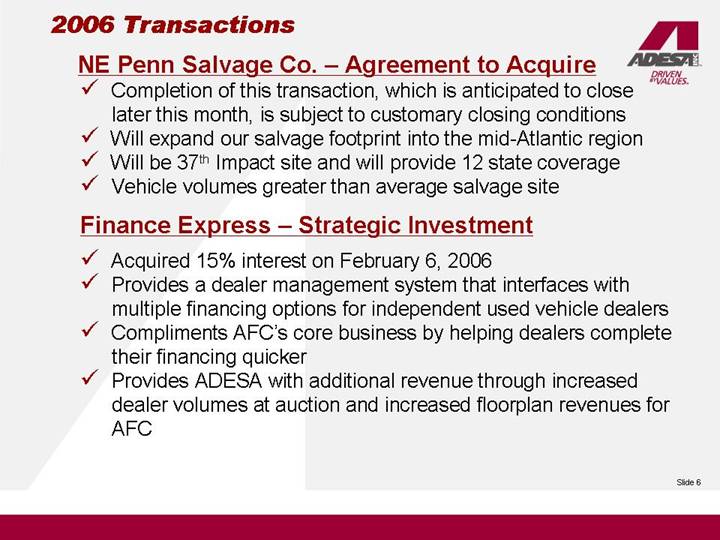
NE Penn Salvage Co. – Agreement to Acquire
• Completion of this transaction, which is anticipated to close later this month, is subject to customary closing conditions
• Will expand our salvage footprint into the mid-Atlantic region
• Will be 37th Impact site and will provide 12 state coverage
• Vehicle volumes greater than average salvage site
Finance Express – Strategic Investment
• Acquired 15% interest on February 6, 2006
• Provides a dealer management system that interfaces with multiple financing options for independent used vehicle dealers
• Compliments AFC’s core business by helping dealers complete their financing quicker
• Provides ADESA with additional revenue through increased dealer volumes at auction and increased floorplan revenues for AFC
6
2006 Industry Outlook
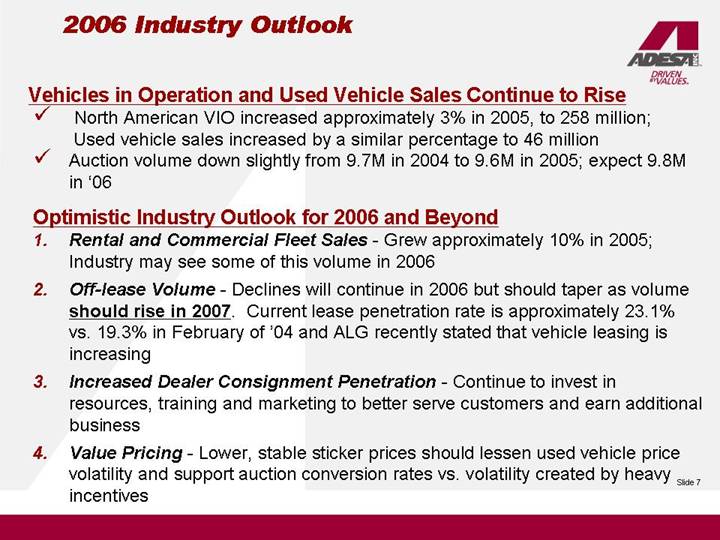
Vehicles in Operation and Used Vehicle Sales Continue to Rise
• North American VIO increased approximately 3% in 2005, to 258 million; Used vehicle sales increased by a similar percentage to 46 million
• Auction volume down slightly from 9.7M in 2004 to 9.6M in 2005; expect 9.8M in ‘06
Optimistic Industry Outlook for 2006 and Beyond
1. Rental and Commercial Fleet Sales - Grew approximately 10% in 2005; Industry may see some of this volume in 2006
2. Off-lease Volume - Declines will continue in 2006 but should taper as volume should rise in 2007. Current lease penetration rate is approximately 23.1% vs. 19.3% in February of ‘04 and ALG recently stated that vehicle leasing is increasing
3. Increased Dealer Consignment Penetration - Continue to invest in resources, training and marketing to better serve customers and earn additional business
4. Value Pricing - Lower, stable sticker prices should lessen used vehicle price volatility and support auction conversion rates vs. volatility created by heavy incentives
7
ADESA’s Vision & Mission
Vision
ADESA Inc. aims to be the industry leader in diversified remarketing and financing services based on sustainable, profitable growth and best-in-class services.
Mission
ADESA Inc. helps its business-to-business customers succeed by providing a comprehensive array of superior, customer-focused diversified remarketing and financing services.
Goals
1. Increase remarketed volume at physical auctions and the Internet to 3 million by end of the decade
2. Attain sustainable double digit profit growth
3. Enhance total shareholder return
8
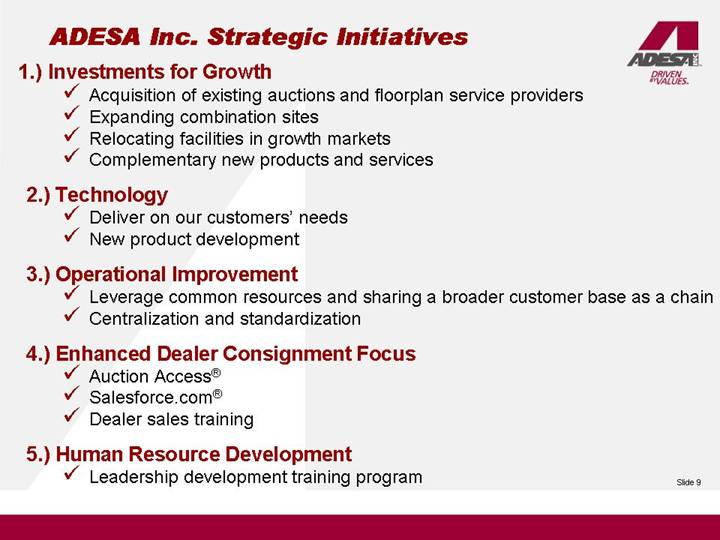
ADESA Inc. Strategic Initiatives
1.) Investments for Growth
• Acquisition of existing auctions and floorplan service providers
• Expanding combination sites
• Relocating facilities in growth markets
• Complementary new products and services
2.) Technology
• Deliver on our customers’ needs
• New product development
3.) Operational Improvement
• Leverage common resources and sharing a broader customer base as a chain
• Centralization and standardization
4.) Enhanced Dealer Consignment Focus
• Auction Access®
• Salesforce.com®
• Dealer sales training
5.) Human Resource Development
• Leadership development training program
9
ADESA, Inc. Fourth Quarter & 2005 Financial Review
Cam Hitchcock
EVP and Chief Financial Officer
10
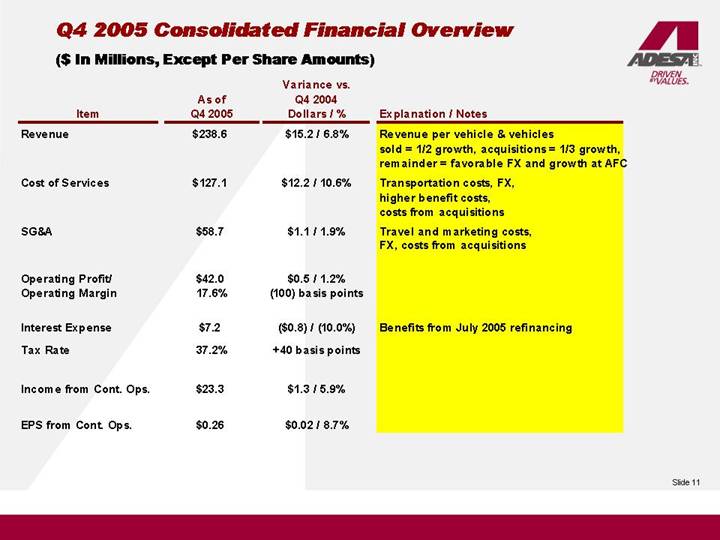
Q4 2005 Consolidated Financial Overview
($ In Millions, Except Per Share Amounts)
| | | | Variance vs. | | | |
| | As of | | Q4 2004 | | | |
Item | | Q4 2005 | | Dollars / % | | Explanation / Notes | |
Revenue | | $ | 238.6 | | $15.2 / 6.8% | | Revenue per vehicle & vehicles | |
| | | | | | sold = 1/2 growth, acquisitions = 1/3 growth, | |
| | | | | | remainder = favorable FX and growth at AFC | |
| | | | | | | |
Cost of Services | | $ | 127.1 | | $12.2 / 10.6% | | Transportation costs, FX, | |
| | | | | | | higher benefit costs, | |
| | | | | | costs from acquisitions | |
| | | | | | | |
SG&A | | $ | 58.7 | | $1.1 / 1.9% | | Travel and marketing costs, | |
| | | | | | FX, costs from acquisitions | |
| | | | | | | |
Operating Profit/ | | $ | 42.0 | | $0.5 / 1.2% | | | |
Operating Margin | | 17.6 | % | (100) basis points | | | |
| | | | | | | |
Interest Expense | | $ | 7.2 | | ($0.8) / (10.0%) | | Benefits from July 2005 refinancing | |
| | | | | | | |
Tax Rate | | 37.2 | % | +40 basis points | | | |
| | | | | | | |
Income from Cont. Ops. | | $ | 23.3 | | $1.3 / 5.9% | | | |
| | | | | | | |
EPS from Cont. Ops. | | $ | 0.26 | | $0.02 / 8.7% | | | |
11
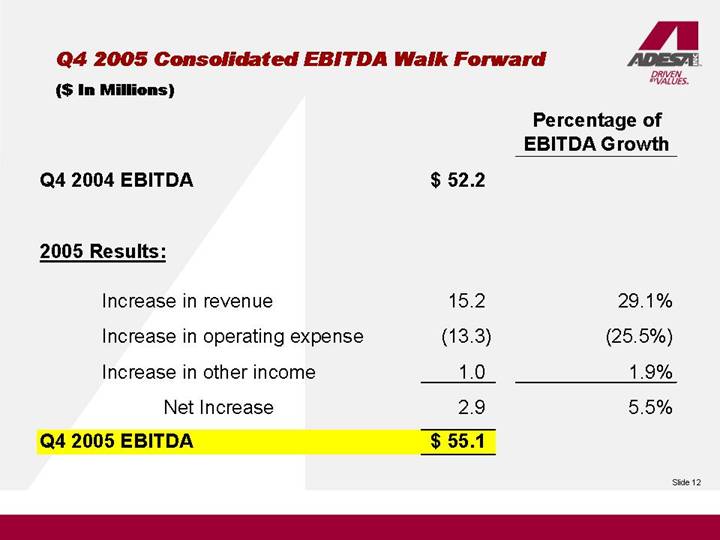
Q4 2005 Consolidated EBITDA Walk Forward
($ In Millions)
| | | | Percentage of | |
| | | | EBITDA Growth | |
Q4 2004 EBITDA | | $ | 52.2 | | | |
| | | | | |
2005 Results: | | | | | |
| | | | | |
Increase in revenue | | 15.2 | | 29.1 | % |
| | | | | |
Increase in operating expense | | (13.3 | ) | (25.5 | )% |
| | | | | |
Increase in other income | | 1.0 | | 1.9 | % |
| | | | | |
Net Increase | | 2.9 | | 5.5 | % |
| | | | | |
Q4 2005 EBITDA | | $ | 55.1 | | | |
12
Q4 2005 Auction Segment Highlights
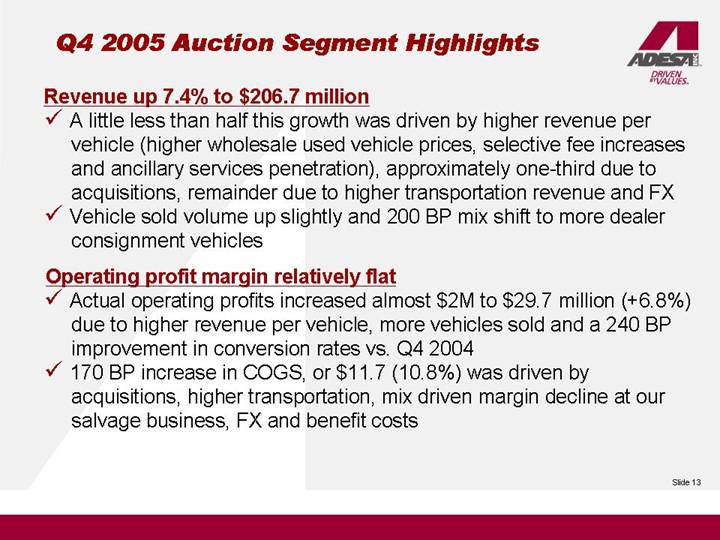
Revenue up 7.4% to $206.7 million
• A little less than half this growth was driven by higher revenue per vehicle (higher wholesale used vehicle prices, selective fee increases and ancillary services penetration), approximately one-third due to acquisitions, remainder due to higher transportation revenue and FX
• Vehicle sold volume up slightly and 200 BP mix shift to more dealer consignment vehicles
Operating profit margin relatively flat
• Actual operating profits increased almost $2M to $29.7 million (+6.8%) due to higher revenue per vehicle, more vehicles sold and a 240 BP improvement in conversion rates vs. Q4 2004
• 170 BP increase in COGS, or $11.7 (10.8%) was driven by acquisitions, higher transportation, mix driven margin decline at our salvage business, FX and benefit costs
13
Q4 2005 AFC Highlights
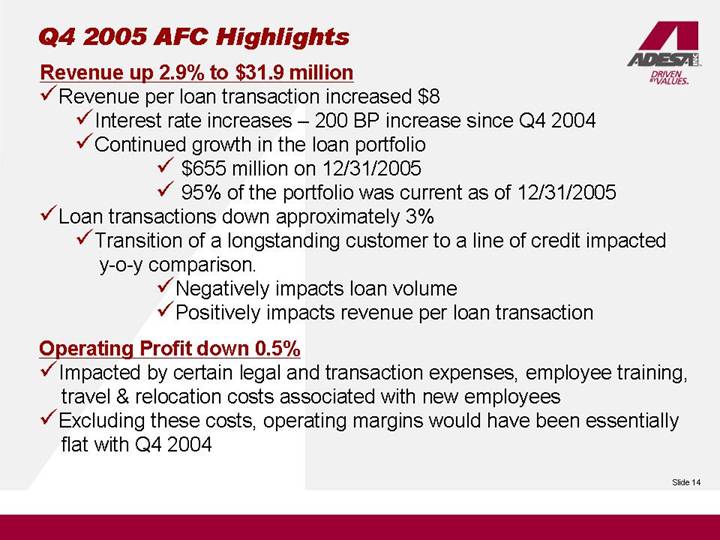
Revenue up 2.9% to $31.9 million
• Revenue per loan transaction increased $8
• Interest rate increases – 200 BP increase since Q4 2004
• Continued growth in the loan portfolio
• $655 million on 12/31/2005
• 95% of the portfolio was current as of 12/31/2005
• Loan transactions down approximately 3%
• Transition of a longstanding customer to a line of credit impacted y-o-y comparison.
• Negatively impacts loan volume
• Positively impacts revenue per loan transaction
Operating Profit down 0.5%
• Impacted by certain legal and transaction expenses, employee training, travel & relocation costs associated with new employees
• Excluding these costs, operating margins would have been essentially flat with Q4 2004
14
Balance Sheet Overview
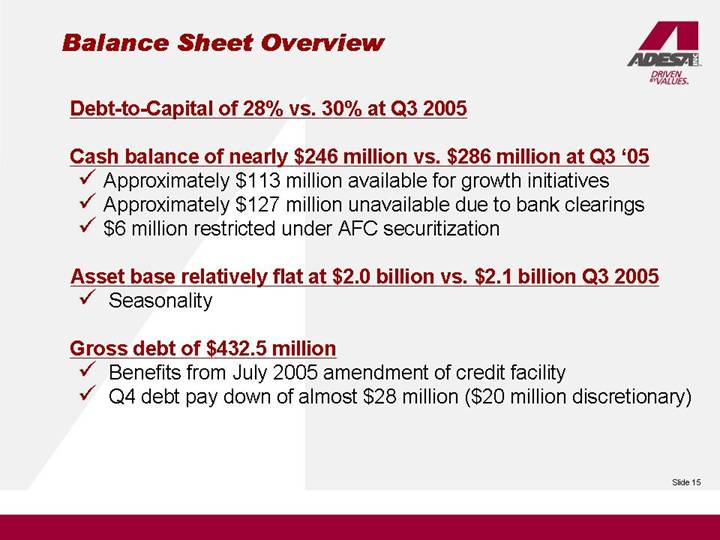
Debt-to-Capital of 28% vs. 30% at Q3 2005
Cash balance of nearly $246 million vs. $286 million at Q3 ‘05
• Approximately $113 million available for growth initiatives
• Approximately $127 million unavailable due to bank clearings
• $6 million restricted under AFC securitization
Asset base relatively flat at $2.0 billion vs. $2.1 billion Q3 2005
• Seasonality
Gross debt of $432.5 million
• Benefits from July 2005 amendment of credit facility
• Q4 debt pay down of almost $28 million ($20 million discretionary)
15
2005 Major Cash Flow Uses
($ In Millions)
| | Q1 2005 | | Q2 2005 | | Q3 2005 | | Q4 2005 | | 2005 | |
CASH PAID FOR INTEREST | | $ | (4.9 | ) | $ | (9.9 | ) | $ | (4.3 | ) | $ | (8.4 | ) | $ | (27.5 | ) |
CASH TAXES | | $ | (21.6 | ) | $ | (24.6 | ) | $ | (2.0 | ) | $ | (15.5 | ) | $ | (63.7 | ) |
DIVIDENDS | | $ | (6.9 | ) | $ | (6.6 | ) | $ | (6.7 | ) | $ | (6.8 | ) | $ | (27.0 | ) |
DEBT REPAYMENT | | $ | (9.3 | ) | $ | (9.2 | ) | $ | (37.5 | ) | $ | (27.6 | ) | $ | (83.6 | ) |
CAPITAL EXPENDITURES | | $ | (20.0 | ) | $ | (16.7 | ) | $ | (11.1 | ) | $ | (7.5 | ) | $ | (55.3 | ) |
SHARE REPURCHASES | | $ | (4.7 | ) | $ | (38.7 | ) | $ | (0.1 | ) | $ | (0.1 | ) | $ | (43.6 | ) |
ACQUISITIONS | | $ | — | | $ | (18.7 | ) | $ | — | | $ | (10.4 | ) | $ | (29.1 | ) |
DIVESTITURES | | $ | — | | $ | — | | $ | 3.3 | | $ | 0.5 | | $ | 3.8 | |
16
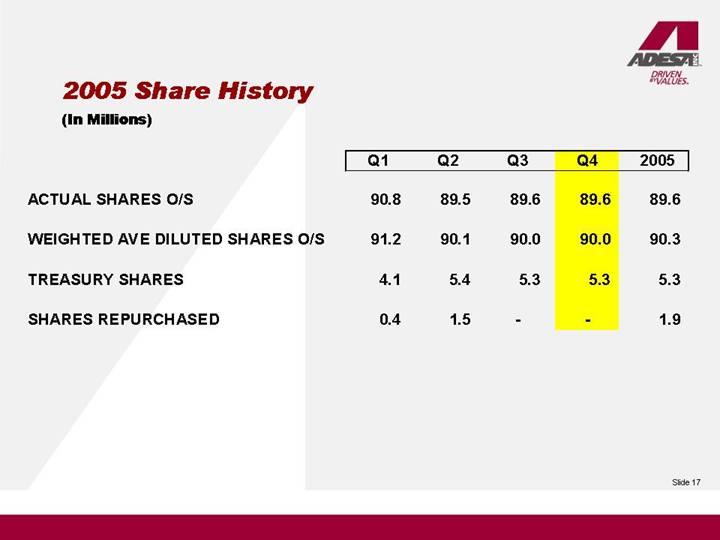
2005 Share History
(In Millions)
| | Q1 | | Q2 | | Q3 | | Q4 | | 2005 | |
| | | | | | | | | | | |
ACTUAL SHARES O/S | | 90.8 | | 89.5 | | 89.6 | | 89.6 | | 89.6 | |
| | | | | | | | | | | |
WEIGHTED AVE DILUTED SHARES O/S | | 91.2 | | 90.1 | | 90.0 | | 90.0 | | 90.3 | |
| | | | | | | | | | | |
TREASURY SHARES | | 4.1 | | 5.4 | | 5.3 | | 5.3 | | 5.3 | |
| | | | | | | | | | | |
SHARES REPURCHASED | | 0.4 | | 1.5 | | — | | — | | 1.9 | |
17
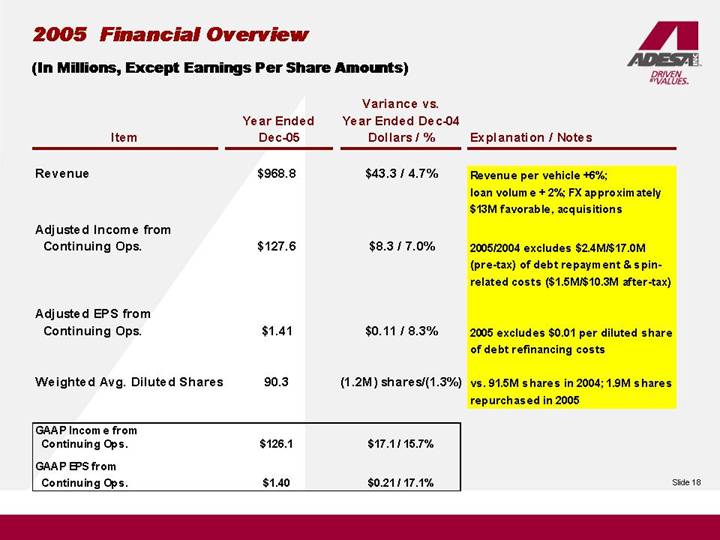
2005 Financial Overview
(In Millions, Except Earnings Per Share Amounts)
| | | | Variance vs. | | | |
| | Year Ended | | Year Ended Dec-04 | | | |
Item | | Dec-05 | | Dollars /% | | Explanation / Notes | |
| | | | | | | |
Revenue | | $ | 968.8 | | $43.3 / 4.7% | | Revenue per vehicle +6%; | |
| | | | | | loan volume + 2%; FX approximately | |
| | | | | | $13M favorable, acquisitions | |
| | | | | | | |
Adjusted Income from | | | | | | | |
Continuing Ops. | | $ | 127.6 | | $8.3 / 7.0% | | 2005/2004 excludes $2.4M/$17.0M | |
| | | | | | (pre-tax) of debt repayment & spin- | |
| | | | | | related costs ($1.5M/$10.3M after-tax) | |
| | | | | | | |
Adjusted EPS from | | | | | | | |
Continuing Ops. | | $ | 1.41 | | $0.11 / 8.3% | | 2005 excludes $0.01 per diluted share | |
| | | | | | of debt refinancing costs | |
| | | | | | | |
Weighted Avg. Diluted Shares | | 90.3 | | (1.2M) shares/(1.3%) | | vs. 91.5M shares in 2004; 1.9M shares | |
| | | | | | repurchased in 2005 | |
| | | | | | | |
GAAP Income from | | | | | | | |
Continuing Ops. | | $ | 126.1 | | $17.1 / 15.7% | | | |
| | | | | | | |
GAAP EPS from | | | | | | | |
Continuing Ops. | | $ | 1.40 | | $0.21 / 17.1% | | | |
18
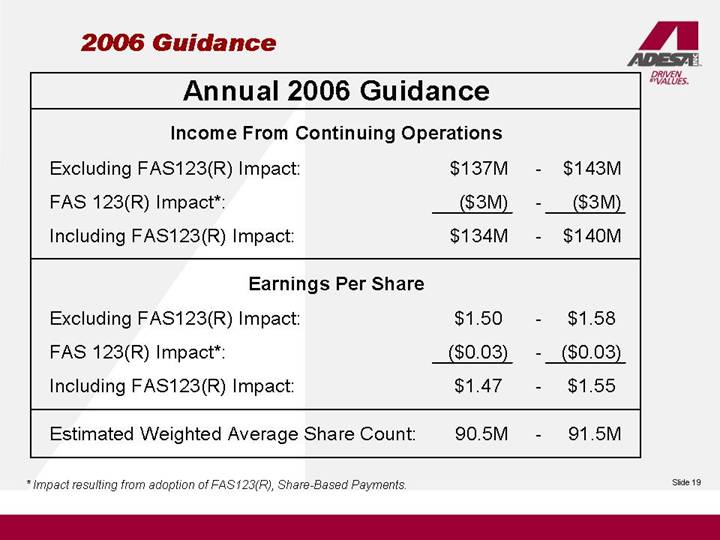
2006 Guidance
Annual 2006 Guidance
Income From Continuing Operations
Excluding FAS123(R) Impact: | | $ | 137 | M | - | | $ | 143 | M |
FAS 123(R) Impact*: | | $ | (3 | )M | - | | $ | (3 | )M |
Including FAS123(R) Impact: | | $ | 134 | M | - | | $ | 140 | M |
| | | | | | | |
Earnings Per Share |
| | | | | | | |
Excluding FAS123(R) Impact: | | $ | 1.50 | | - | | $ | 1.58 | |
FAS 123(R) Impact*: | | $ | (0.03 | ) | - | | $ | (0.03 | ) |
Including FAS123(R) Impact: | | $ | 1.47 | | - | | $ | 1.55 | |
| | | | | | | |
Estimated Weighted Average Share Count: | | 90.5 | M | - | | 91.5 | M |
* Impact resulting from adoption of FAS123(R), Share-Based Payments.
19
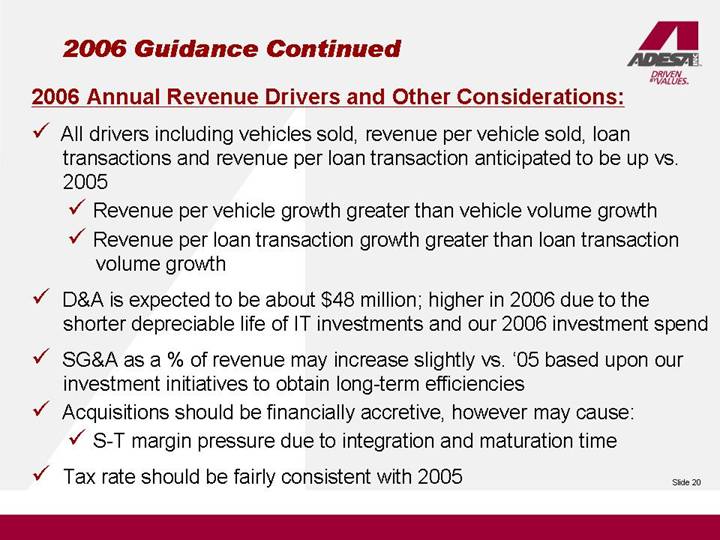
2006 Guidance Continued
2006 Annual Revenue Drivers and Other Considerations:
• All drivers including vehicles sold, revenue per vehicle sold, loan transactions and revenue per loan transaction anticipated to be up vs. 2005
• Revenue per vehicle growth greater than vehicle volume growth
• Revenue per loan transaction growth greater than loan transaction volume growth
• D&A is expected to be about $48 million; higher in 2006 due to the shorter depreciable life of IT investments and our 2006 investment spend
• SG&A as a % of revenue may increase slightly vs. ‘05 based upon our investment initiatives to obtain long-term efficiencies
• Acquisitions should be financially accretive, however may cause:
• S-T margin pressure due to integration and maturation time
• Tax rate should be fairly consistent with 2005
20
QUESTION AND ANSWER
SESSION
21
DAVID GARTZKE
CLOSING REMARKS
22
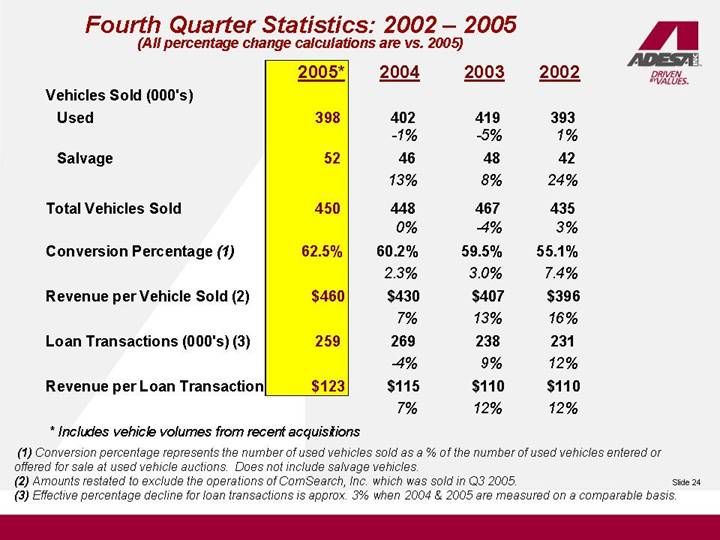
Fourth Quarter Statistics: 2002 – 2005
(All percentage change calculations are vs. 2005)
| | 2005* | | 2004 | | 2003 | | 2002 | |
Vehicles Sold (000’s) | | | | | | | | | |
Used | | 398 | | 402 | | 419 | | 393 | |
| | | | -1 | % | -5 | % | 1 | % |
Salvage | | 52 | | 46 | | 48 | | 42 | |
| | | | 13 | % | 8 | % | 24 | % |
Total Vehicles Sold | | 450 | | 448 | | 467 | | 435 | |
| | | | 0 | % | -4 | % | 3 | % |
Conversion Percentage (1) | | 62.5 | % | 60.2 | % | 59.5 | % | 55.1 | % |
| | | | 2.3 | % | 3.0 | % | 7.4 | % |
Revenue per Vehicle Sold (2) | | $ | 460 | | $ | 430 | | $ | 407 | | $ | 396 | |
| | | | 7 | % | 13 | % | 16 | % |
Loan Transactions (000’s) (3) | | 259 | | 269 | | 238 | | 231 | |
| | | | -4 | % | 9 | % | 12 | % |
Revenue per Loan Transaction | | $ | 123 | | $ | 115 | | $ | 110 | | $ | 110 | |
| | | | 7 | % | 12 | % | 12 | % |
* Includes vehicle volumes from recent acquisitions
(1) Conversion percentage represents the number of used vehicles sold as a % of the number of used vehicles entered or offered for sale at used vehicle auctions. Does not include salvage vehicles.
(2) Amounts restated to exclude the operations of ComSearch, Inc. which was sold in Q3 2005.
(3) Effective percentage decline for loan transactions is approx. 3% when 2004 & 2005 are measured on a comparable basis.
24
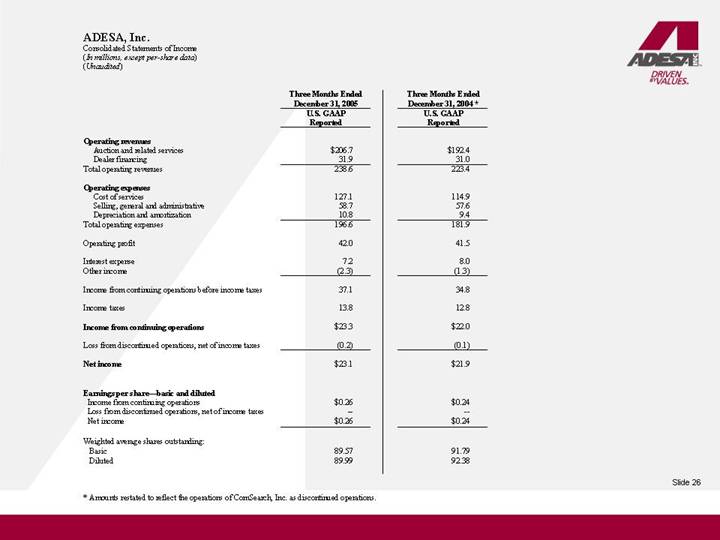
ADESA, Inc.
Consolidated Statements of Income
(In millions, except per-share data)
(Unaudited)
| | Three Months Ended | | Three Months Ended | |
| | December 31, 2005 | | December 31, 2004 * | |
| | U.S. GAAP | | U.S. GAAP | |
| | Reported | | Reported | |
| | | | | |
Operating revenues | | | | | |
Auction and related services | | $ | 206.7 | | $ | 192.4 | |
Dealer financing | | 31.9 | | 31.0 | |
Total operating revenues | | 238.6 | | 223.4 | |
| | | | | |
Operating expenses | | | | | |
Cost of services | | 127.1 | | 114.9 | |
Selling, general and administrative | | 58.7 | | 57.6 | |
Depreciation and amortization | | 10.8 | | 9.4 | |
Total operating expenses | | 196.6 | | 181.9 | |
| | | | | |
Operating profit | | 42.0 | | 41.5 | |
| | | | | |
Interest expense | | 7.2 | | 8.0 | |
Other income | | (2.3 | ) | (1.3 | ) |
| | | | | |
Income from continuing operations before income taxes | | 37.1 | | 34.8 | |
| | | | | |
Income taxes | | 13.8 | | 12.8 | |
| | | | | |
Income from continuing operations | | $ | 23.3 | | $ | 22.0 | |
| | | | | |
Loss from discontinued operations, net of income taxes | | (0.2 | ) | (0.1 | ) |
| | | | | |
Net income | | $ | 23.1 | | $ | 21.9 | |
| | | | | |
Earnings per share—basic and diluted | | | | | |
Income from continuing operations | | $ | 0.26 | | $ | 0.24 | |
Loss from discontinued operations, net of income taxes | | — | | — | |
Net income | | $ | 0.26 | | $ | 0.24 | |
| | | | | |
Weighted average shares outstanding: | | | | | |
Basic | | 89.57 | | 91.79 | |
Diluted | | 89.99 | | 92.38 | |
* Amounts restated to reflect the operations of ComSearch, Inc. as discontinued operations.
26
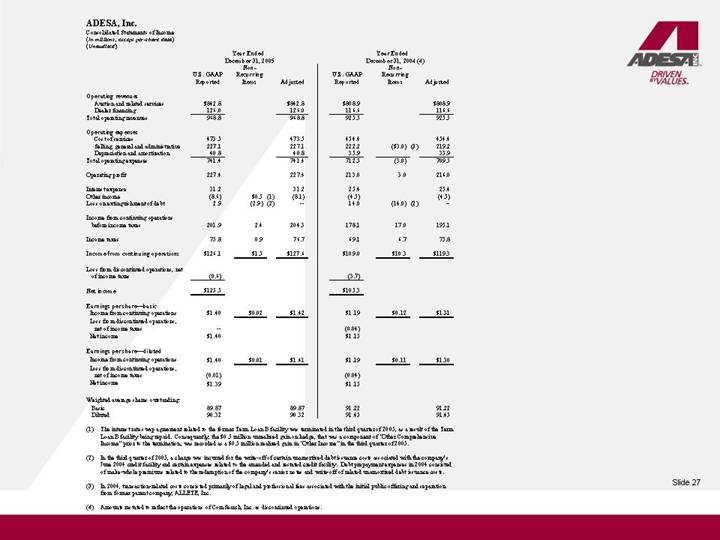
ADESA, Inc.
Consolidated Statements of Income
(In millions, except per-share data)
(Unaudited)
| | Year Ended
December 31, 2005 | | Year Ended
December 31, 2004 (4) | |
| | | | Non- | | | | | | Non- | | | |
| | U.S. GAAP | | Recurring | | | | U.S. GAAP | | Recurring | | | |
| | Reported | | Items | | Adjusted | | Reported | | Items | | Adjusted | |
| | | | | | | | | | | | | |
Operating revenues | | | | | | | | | | | | | |
Auction and related services | | $ | 842.8 | | | | $ | 842.8 | | $ | 808.9 | | | | $ | 808.9 | |
Dealer financing | | 126.0 | | | | 126.0 | | 116.6 | | | | 116.6 | |
Total operating revenues | | 968.8 | | | | 968.8 | | 925.5 | | | | 925.5 | |
| | | | | | | | | | | | | |
Operating expenses | | | | | | | | | | | | | |
Cost of services | | 473.5 | | | | 473.5 | | 454.4 | | | | 454.4 | |
Selling, general and administrative | | 227.1 | | | | 227.1 | | 222.2 | | $ | (3.0 | )(3) | 219.2 | |
Depreciation and amortization | | 40.8 | | | | 40.8 | | 35.9 | | | | 35.9 | |
Total operating expenses | | 741.4 | | | | 741.4 | | 712.5 | | (3.0 | ) | 709.5 | |
| | | | | | | | | | | | | |
Operating profit | | 227.4 | | | | 227.4 | | 213.0 | | 3.0 | | 216.0 | |
| | | | | | | | | | | | | |
Interest expense | | 31.2 | | | | 31.2 | | 25.4 | | | | 25.4 | |
Other income | | (8.6 | ) | $ | 0.5 | (1) | (8.1 | ) | (4.5 | ) | | | (4.5 | ) |
Loss on extinguishment of debt | | 2.9 | | (2.9 | )(2) | — | | 14.0 | | (14.0 | )(2) | — | |
| | | | | | | | | | | | | |
Income from continuing operations before income taxes | | 201.9 | | 2.4 | | 204.3 | | 178.1 | | 17.0 | | 195.1 | |
| | | | | | | | | | | | | |
Income taxes | | 75.8 | | 0.9 | | 76.7 | | 69.1 | | 6.7 | | 75.8 | |
| | | | | | | | | | | | | |
Income from continuing operations | | $ | 126.1 | | $ | 1.5 | | $ | 127.6 | | $ | 109.0 | | $ | 10.3 | | $ | 119.3 | |
| | | | | | | | | | | | | |
Loss from discontinued operations, net of income taxes | | (0.6 | ) | | | | | (3.7 | ) | | | | |
| | | | | | | | | | | | | |
Net income | | $ | 125.5 | | | | | | $ | 105.3 | | | | | |
| | | | | | | | | | | | | |
Earnings per share—basic | | | | | | | | | | | | | |
Income from continuing operations | | $ | 1.40 | | $ | 0.02 | | $ | 1.42 | | $ | 1.19 | | $ | 0.12 | | $ | 1.31 | |
Loss from discontinued operations, net of income taxes | | — | | | | | | (0.04 | ) | | | | |
Net income | | $ | 1.40 | | | | | | $ | 1.15 | | | | | |
| | | | | | | | | | | | | |
Earnings per share—diluted | | | | | | | | | | | | | |
Income from continuing operations | | $ | 1.40 | | $ | 0.01 | | $ | 1.41 | | $ | 1.19 | | $ | 0.11 | | $ | 1.30 | |
Loss from discontinued operations, net of income taxes | | (0.01 | ) | | | | | (0.04 | ) | | | | |
Net income | | $ | 1.39 | | | | | | $ | 1.15 | | | | | |
| | | | | | | | | | | | | |
Weighted average shares outstanding: | | | | | | | | | | | | | |
Basic | | 89.87 | | | | 89.87 | | 91.22 | | | | 91.22 | |
Diluted | | 90.32 | | | | 90.32 | | 91.45 | | | | 91.45 | |
(1) The interest rate swap agreement related to the former Term Loan B facility was terminated in the third quarter of 2005, as a result of the Term Loan B facility being repaid. Consequently, the $0.5 million unrealized gain on hedge, that was a component of “Other Comprehensive Income” prior to the termination, was recorded as a $0.5 million realized gain in “Other Income” in the third quarter of 2005.
(2) In the third quarter of 2005, a charge was incurred for the write-off of certain unamortized debt issuance costs associated with the company’s June 2004 credit facility and certain expenses related to the amended and restated credit facility. Debt prepayment expenses in 2004 consisted of make-whole premiums related to the redemption of the company’s senior notes and write-off of related unamortized debt issuance costs.
(3) In 2004, transaction-related costs consisted primarily of legal and professional fees associated with the initial public offering and separation from former parent company, ALLETE, Inc.
(4) Amounts restated to reflect the operations of ComSearch, Inc. as discontinued operations.
27
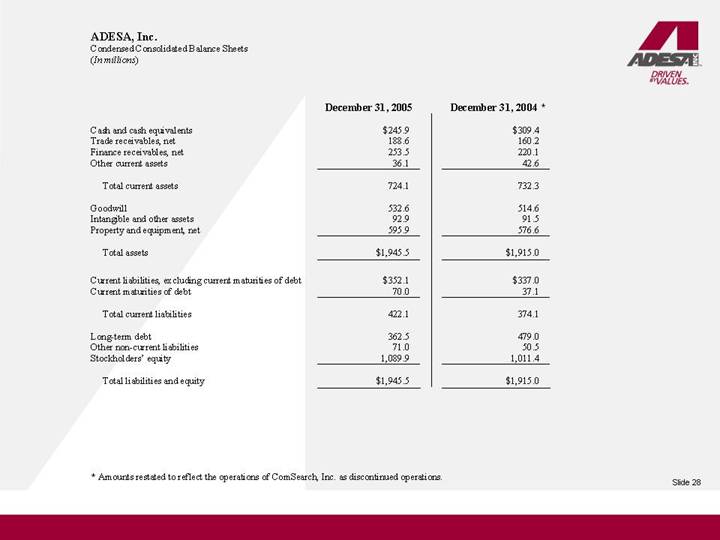
ADESA, Inc.
Condensed Consolidated Balance Sheets
(In millions)
| | December 31, 2005 | | December 31, 2004 * | |
| | | | | |
Cash and cash equivalents | | $ | 245.9 | | $ | 309.4 | |
Trade receivables, net | | 188.6 | | 160.2 | |
Finance receivables, net | | 253.5 | | 220.1 | |
Other current assets | | 36.1 | | 42.6 | |
| | | | | |
Total current assets | | 724.1 | | 732.3 | |
| | | | | |
Goodwill | | 532.6 | | 514.6 | |
Intangible and other assets | | 92.9 | | 91.5 | |
Property and equipment, net | | 595.9 | | 576.6 | |
| | | | | |
Total assets | | $ | 1,945.5 | | $ | 1,915.0 | |
| | | | | |
Current liabilities, excluding current maturities of debt | | $ | 352.1 | | $ | 337.0 | |
Current maturities of debt | | 70.0 | | 37.1 | |
| | | | | |
Total current liabilities | | 422.1 | | 374.1 | |
| | | | | |
Long-term debt | | 362.5 | | 479.0 | |
Other non-current liabilities | | 71.0 | | 50.5 | |
Stockholders’ equity | | 1,089.9 | | 1,011.4 | |
| | | | | |
Total liabilities and equity | | $ | 1,945.5 | | $ | 1,915.0 | |
* Amounts restated to reflect the operations of ComSearch, Inc. as discontinued operations.
28
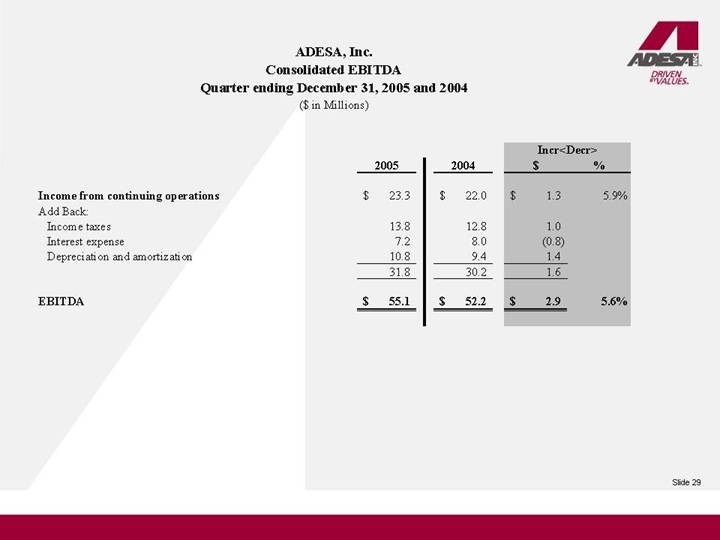
ADESA, Inc.
Consolidated EBITDA
Quarter ending December 31, 2005 and 2004
($ in Millions)
| | | | | | Incr<Decr> | |
| | 2005 | | 2004 | | $ | | % | |
| | | | | | | | | |
Income from continuing operations | | $ | 23.3 | | $ | 22.0 | | $ | 1.3 | | 5.9 | % |
Add Back: | | | | | | | | | |
Income taxes | | 13.8 | | 12.8 | | 1.0 | | | |
Interest expense | | 7.2 | | 8.0 | | (0.8 | ) | | |
Depreciation and amortization | | 10.8 | | 9.4 | | 1.4 | | | |
| | 31.8 | | 30.2 | | 1.6 | | | |
| | | | | | | | | |
EBITDA | | $ | 55.1 | | $ | 52.2 | | $ | 2.9 | | 5.6 | % |
29
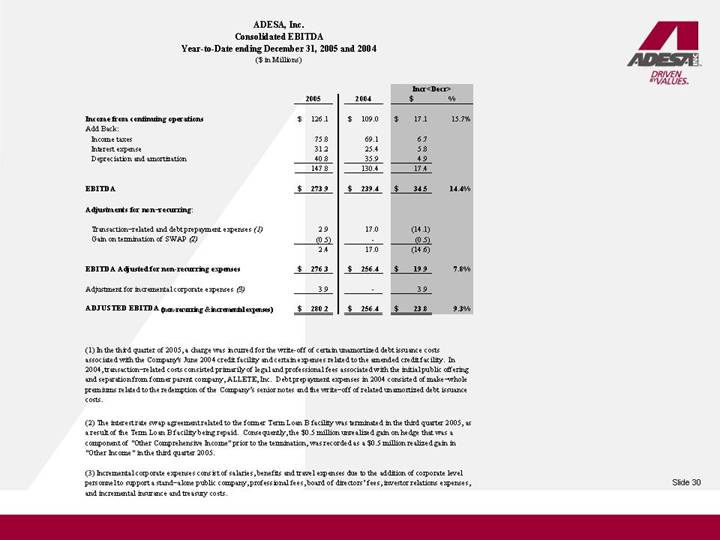
ADESA, Inc.
Consolidated EBITDA
Year-to-Date ending December 31, 2005 and 2004
($ in Millions)
| | | | | | Incr<Decr> | |
| | 2005 | | 2004 | | $ | | % | |
| | | | | | | | | |
Income from continuing operations | | $ | 126.1 | | $ | 109.0 | | $ | 17.1 | | 15.7 | % |
Add Back: | | | | | | | | | |
Income taxes | | 75.8 | | 69.1 | | 6.7 | | | |
Interest expense | | 31.2 | | 25.4 | | 5.8 | | | |
Depreciation and amortization | | 40.8 | | 35.9 | | 4.9 | | | |
| | 147.8 | | 130.4 | | 17.4 | | | |
| | | | | | | | | |
EBITDA | | $ | 273.9 | | $ | 239.4 | | $ | 34.5 | | 14.4 | % |
| | | | | | | | | |
Adjustments for non–recurring: | | | | | | | | | |
| | | | | | | | | |
Transaction–related and debt prepayment expenses (1) | | 2.9 | | 17.0 | | (14.1 | ) | | |
Gain on termination of SWAP (2) | | (0.5 | ) | — | | (0.5 | ) | | |
| | 2.4 | | 17.0 | | (14.6 | ) | | |
| | | | | | | | | |
EBITDA Adjusted for non-recurring expenses | | $ | 276.3 | | $ | 256.4 | | $ | 19.9 | | 7.8 | % |
| | | | | | | | | |
Adjustment for incremental corporate expenses (3) | | 3.9 | | — | | 3.9 | | | |
| | | | | | | | | |
ADJUSTED EBITDA (non-recurring & incremental expenses) | | $ | 280.2 | | $ | 256.4 | | $ | 23.8 | | 9.3 | % |
(1) In the third quarter of 2005, a charge was incurred for the write-off of certain unamortized debt issuance costs associated with the Company’s June 2004 credit facility and certain expenses related to the amended credit facility. In 2004, transaction related costs consisted primarily of legal and professional fees associated with the initial public offering and separation from former parent company, ALLETE, Inc. Debt prepayment expenses in 2004 consisted of make whole premiums related to the redemption of the Company’s senior notes and the write off of related unamortized debt issuance costs.
(2) The interest rate swap agreement related to the former Term Loan B facility was terminated in the third quarter 2005, as a result of the Term Loan B facility being repaid. Consequently, the $0.5 million unrealized gain on hedge that was a component of “Other Comprehensive Income” prior to the termination, was recorded as a $0.5 million realized gain in “Other Income” in the third quarter 2005.
(3) Incremental corporate expenses consist of salaries, benefits and travel expenses due to the addition of corporate level personnel to support a stand alone public company, professional fees, board of directors’ fees, investor relations expenses, and incremental insurance and treasury costs.
30