Exhibit 99
Link to searchable text of slide shown above

Link to searchable text of slide shown above

Link to searchable text of slide shown above
Link to searchable text of slide shown above
Link to searchable text of slide shown above
Link to searchable text of slide shown above
Link to searchable text of slide shown above
Link to searchable text of slide shown above
Link to searchable text of slide shown above
Link to searchable text of slide shown above
Link to searchable text of slide shown above

Link to searchable text of slide shown above
Link to searchable text of slide shown above
Link to searchable text of slide shown above
Link to searchable text of slide shown above
Link to searchable text of slide shown above
Link to searchable text of slide shown above
Link to searchable text of slide shown above
Link to searchable text of slide shown above
Link to searchable text of slide shown above
Link to searchable text of slide shown above

Link to searchable text of slide shown above
Link to searchable text of slide shown above

Link to searchable text of slide shown above
Link to searchable text of slide shown above
Link to searchable text of slide shown above
Link to searchable text of slide shown above
Link to searchable text of slide shown above
Link to searchable text of slide shown above
Link to searchable text of slide shown above
Link to searchable text of slide shown above
Searchable text section of graphics shown above
[LOGO]
First Quarter 2006
Earnings Conference Call
May 2, 2006
Cautionary Statement
Forward-Looking Statements
This presentation includes forward-looking statements within the meaning of the Private Securities Litigation Reform Act of 1995. Such statements, including statements regarding anticipated financial results, the company’s 2006 guidance, the 2006 industry outlook, and the company’s goals and strategic initiatives are subject to certain risks, trends, and uncertainties that could cause actual results to differ materially from those projected, expressed or implied by such forward-looking statements. The statements are based on assumptions about important factors including: general business conditions; trends in new and used vehicle sales and incentives, including wholesale used vehicle pricing; economic conditions, including fuel prices, Canadian exchange rate and interest rate fluctuations; competition; trends in the vehicle remarketing industry; business development activities, including acquisitions; investments in technology; litigation developments; weather; vehicle production; and the other risk factors described in the company’s Annual Report on Form 10-K, and other risks described from time to time in the company’s filings with the Securities and Exchange Commission. Many of these risk factors are outside of the company’s control, and as such, they involve risks which are not currently known to the company that could cause actual results to differ materially from forecasted results. The forward-looking statements in this document are made as of the date hereof and the company does not undertake to update its forward-looking statements.
This presentation includes certain non-GAAP measures. These non-GAAP measures are reconciled to the most directly comparable GAAP measures in Appendix 2 to this presentation.
2
Financial Highlights
Q1 2006 Financial Summary
• Revenue of $285.6 million (+17.7%)
• Growth in all revenue drivers vs. Q1 2005
• Vehicles sold increased 3.3%
• Revenue per vehicle sold increased 13.4%
• Loan transactions increased 0.7%
• Revenue per loan transaction increased 20.3%
• Income from Continuing Operations of $36.3 million (+3.4%), or $0.40 per diluted share (+4.5%)
• Includes approximately $0.01 per diluted share impact from the adoption of FAS123(R)
• Includes approximately $0.02 per diluted share related to unreconciled balance sheet differences concealed by a former employee at the company’s Kitchener, Ontario auction
3
ADESA, Inc. First Quarter 2006 Accomplishments
Dave Gartzke
Chairman & CEO
4
ADESA Inc. Goals & Strategic Initiatives
Goals
1. Increase remarketed volume at physical auctions and the Internet to 3 million by end of the decade
2. Attain sustainable double digit profit growth
3. Enhance total shareholder return
Strategic Initiatives
1. Investments for Growth
2. Technology
3. Operational Improvement
4. Enhanced Dealer Consignment Focus
5. Human Resource Development
5
Q1 2006 Accomplishments
Continued Strengthening of Management Team
Appointment of A. R. Sales as President & COO
• ADESA Board member since fiscal 2004
• Extensive operating experience including President of Roll Coater Division of ArvinMeritor, Inc. and CFO of Arvin Coil Coating Group
• 16+ years of automotive industry experience
• Sales’ operating background complements my strategic planning background
Ron Beaver appointed CIO and Executive Vice President
• Responsible for all information technology areas and strategies for the company, including e-Business and related activities
• Seasoned business executive and former CIO at Otis Elevator, a division of United Technologies Company
6
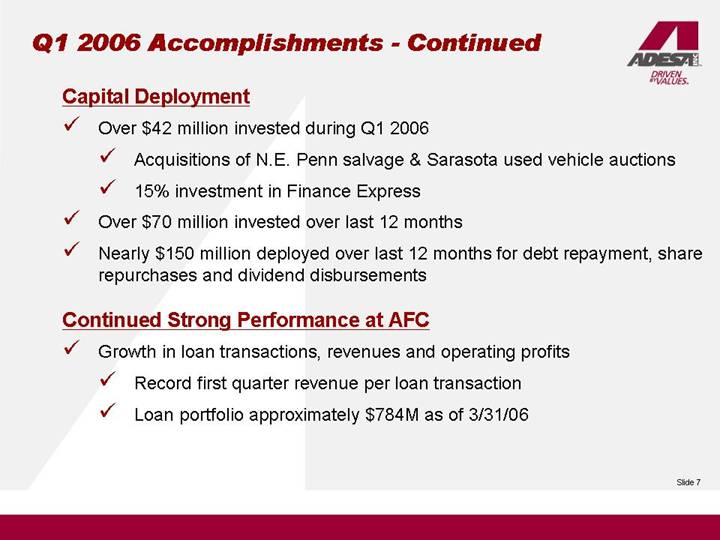
Capital Deployment
• Over $42 million invested during Q1 2006
• Acquisitions of N.E. Penn salvage & Sarasota used vehicle auctions
• 15% investment in Finance Express
• Over $70 million invested over last 12 months
• Nearly $150 million deployed over last 12 months for debt repayment, share repurchases and dividend disbursements
Continued Strong Performance at AFC
• Growth in loan transactions, revenues and operating profits
• Record first quarter revenue per loan transaction
• Loan portfolio approximately $784M as of 3/31/06
7
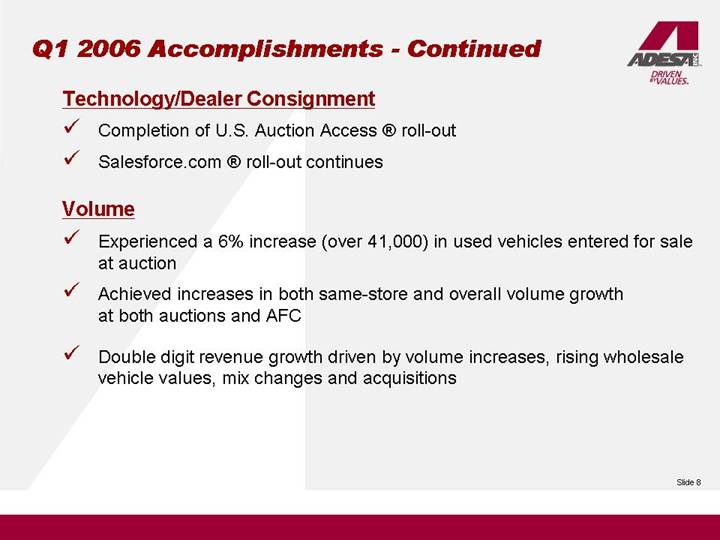
Technology/Dealer Consignment
• Completion of U.S. Auction Access ® roll-out
• Salesforce.com ® roll-out continues
Volume
• Experienced a 6% increase (over 41,000) in used vehicles entered for sale at auction
• Achieved increases in both same-store and overall volume growth at both auctions and AFC
• Double digit revenue growth driven by volume increases, rising wholesale vehicle values, mix changes and acquisitions
8
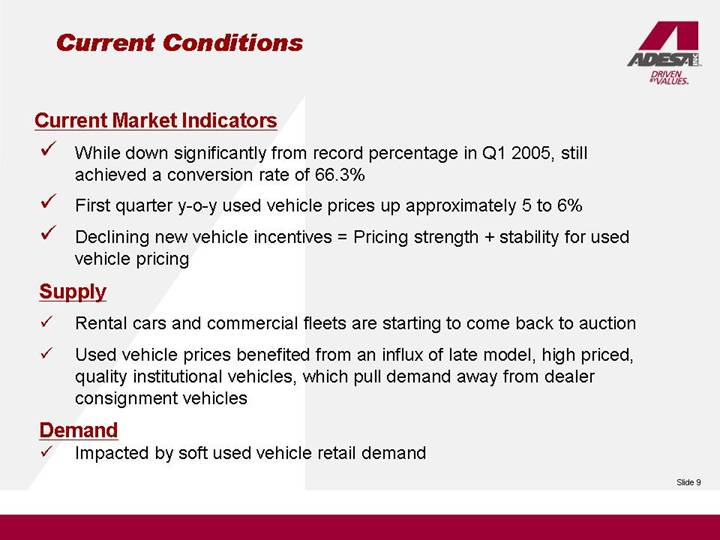
Current Conditions
Current Market Indicators
• While down significantly from record percentage in Q1 2005, still achieved a conversion rate of 66.3%
• First quarter y-o-y used vehicle prices up approximately 5 to 6%
• Declining new vehicle incentives = Pricing strength + stability for used vehicle pricing
Supply
• Rental cars and commercial fleets are starting to come back to auction
• Used vehicle prices benefited from an influx of late model, high priced, quality institutional vehicles, which pull demand away from dealer consignment vehicles
Demand
• Impacted by soft used vehicle retail demand
9
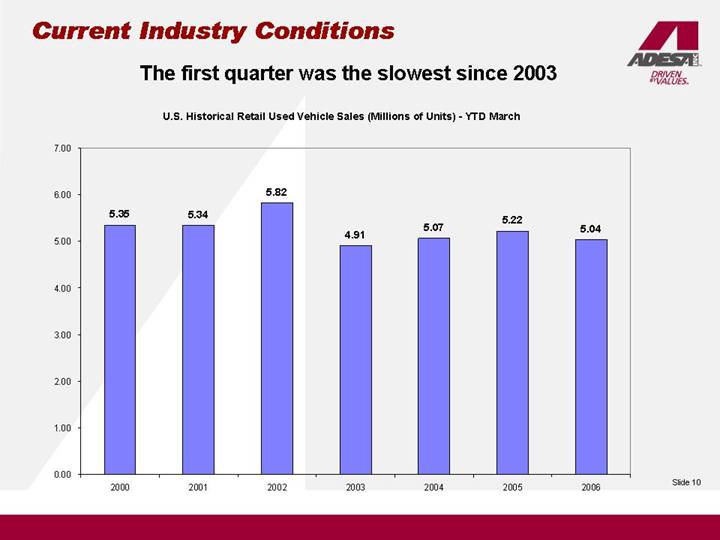
Current Industry Conditions
The first quarter was the slowest since 2003
U.S. Historical Retail Used Vehicle Sales (Millions of Units) - YTD March
[CHART]
10
ADESA, Inc. First Quarter 2006 Financial Review
Cam Hitchcock
EVP and Chief Financial Officer
11
Q1 2006 Consolidated Financial Overview
($ In Millions, Except Per Share Amounts)
| | | | Variance vs. | | |
| | As of | | Q1 2005 | | |
Item | | Q1 2006 | | Dollars /% | | Explanation / Notes |
| | | | | | |
Revenue | | $ | 285.6 | | $42.9 / 17.7% | | Growth components; 1) Organic approx. 60%, 2) Acquisitions approx. 20%, 3) AFC approx. 15% Remainder = foreign currency |
| | | | | | |
Cost of Services | | $ | 144.2 | | $29.7 / 25.9% | | Primarily driven by ARS (Higher volume and mix-driven transportation & reconditioning costs and mix shift at salvage business) |
| | | | | | |
SG&A | | $ | 66.9 | | $12.1 / 22.1% | | $1.0M incremental for FAS123(R); $2.7M Kitchener charge; approx. 70% of remainder = salary & benefits - including acquisitions & strategic initiatives |
| | | | | | |
Operating Profit/ | | $ | 63.7 | | ($0.5) /(0.8%) | | |
Operating Margin | | 22.3 | % | (420) basis points | | |
| | | | | | |
Interest Expense | | $ | 7.0 | | ($1.1) / (13.6%) | | Benefits from July 2005 refinancing and lower net debt |
| | | | | | |
Tax Rate | | 37.8 | % | (130) basis points | | |
| | | | | | |
Income from Cont. Ops. | | $ | 36.3 | | $1.2 / 3.4% | | |
| | | | | | |
EPS from Cont. Ops. | | $ | 0.40 | | $0.02 / 4.5% | | Incl. $1.0M, or $0.01 per share, incremental for adoption of FAS123(R) & $2.7M, or $0.02 per share, due to Kitchener charge |
12
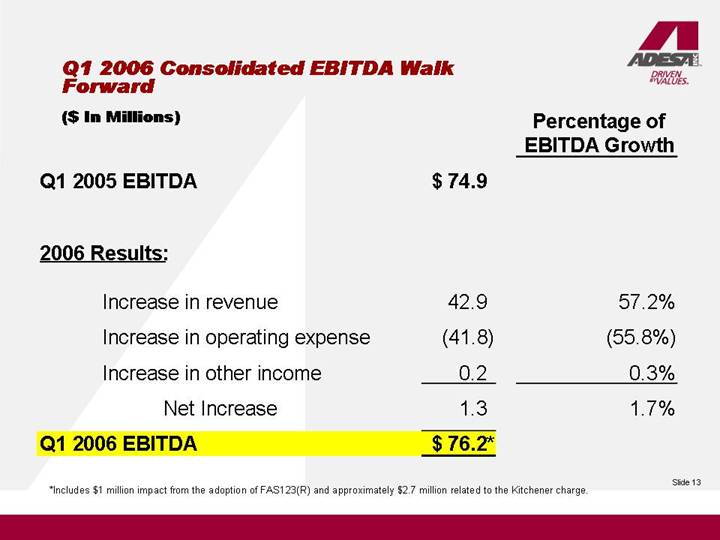
Q1 2006 Consolidated EBITDA Walk Forward
($ In Millions)
| | | | Percentage of | |
| | | | EBITDA Growth | |
Q1 2005 EBITDA | | $ | 74.9 | | | |
| | | | | |
2006 Results: | | | | | |
| | | | | |
Increase in revenue | | 42.9 | | 57.2 | % |
Increase in operating expense | | (41.8 | ) | (55.8 | )% |
Increase in other income | | 0.2 | | 0.3 | % |
Net Increase | | 1.3 | | 1.7 | % |
Q1 2006 EBITDA | | $ | 76.2 | * | | |
*Includes $1 million impact from the adoption of FAS123(R) and approximately $2.7 million related to the Kitchener charge.
13
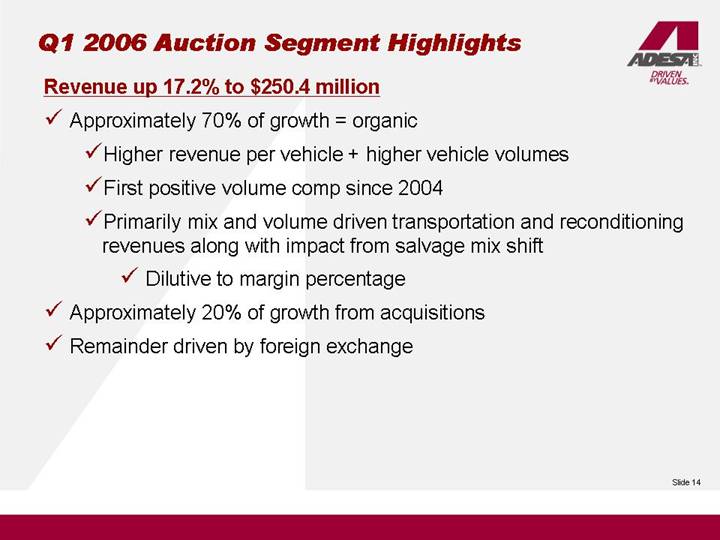
Q1 2006 Auction Segment Highlights
Revenue up 17.2% to $250.4 million
• Approximately 70% of growth = organic
• Higher revenue per vehicle + higher vehicle volumes
• First positive volume comp since 2004
• Primarily mix and volume driven transportation and reconditioning revenues along with impact from salvage mix shift
• Dilutive to margin percentage
• Approximately 20% of growth from acquisitions
• Remainder driven by foreign exchange
14
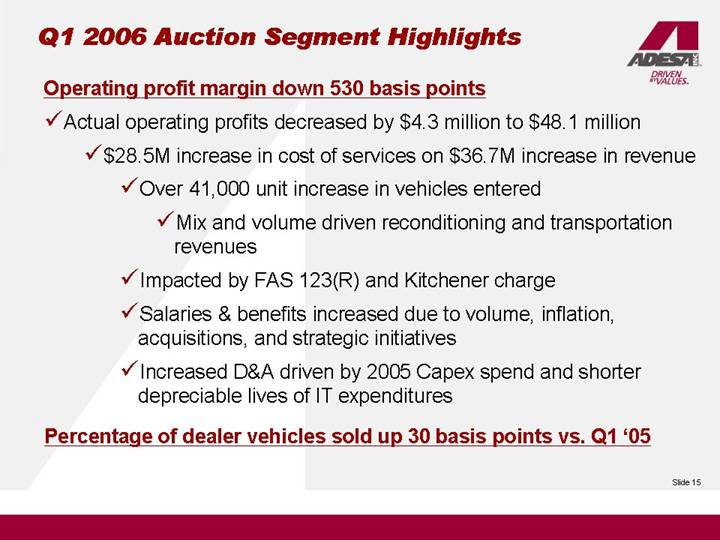
Operating profit margin down 530 basis points
• Actual operating profits decreased by $4.3 million to $48.1 million
• $28.5M increase in cost of services on $36.7M increase in revenue
• Over 41,000 unit increase in vehicles entered
• Mix and volume driven reconditioning and transportation revenues
• Impacted by FAS 123(R) and Kitchener charge
• Salaries & benefits increased due to volume, inflation, acquisitions, and strategic initiatives
• Increased D&A driven by 2005 Capex spend and shorter depreciable lives of IT expenditures
Percentage of dealer vehicles sold up 30 basis points vs. Q1 ‘05
15
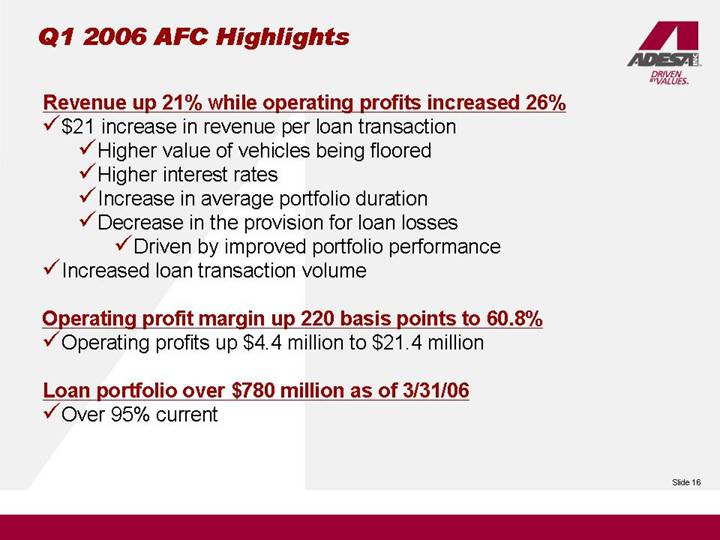
Q1 2006 AFC Highlights
Revenue up 21% while operating profits increased 26%
• $21 increase in revenue per loan transaction
• Higher value of vehicles being floored
• Higher interest rates
• Increase in average portfolio duration
• Decrease in the provision for loan losses
• Driven by improved portfolio performance
• Increased loan transaction volume
Operating profit margin up 220 basis points to 60.8%
• Operating profits up $4.4 million to $21.4 million
Loan portfolio over $780 million as of 3/31/06
• Over 95% current
16
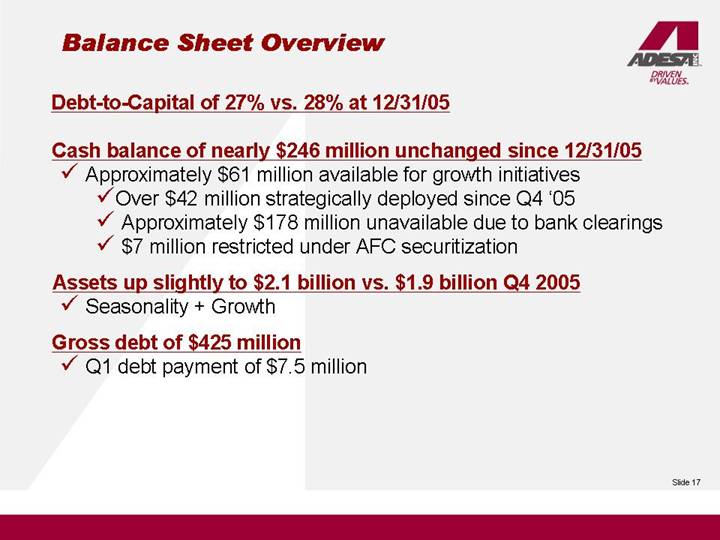
Balance Sheet Overview
Debt-to-Capital of 27% vs. 28% at 12/31/05
Cash balance of nearly $246 million unchanged since 12/31/05
• Approximately $61 million available for growth initiatives
• Over $42 million strategically deployed since Q4 ‘05
• Approximately $178 million unavailable due to bank clearings
• $7 million restricted under AFC securitization
Assets up slightly to $2.1 billion vs. $1.9 billion Q4 2005
• Seasonality + Growth
Gross debt of $425 million
• Q1 debt payment of $7.5 million
17
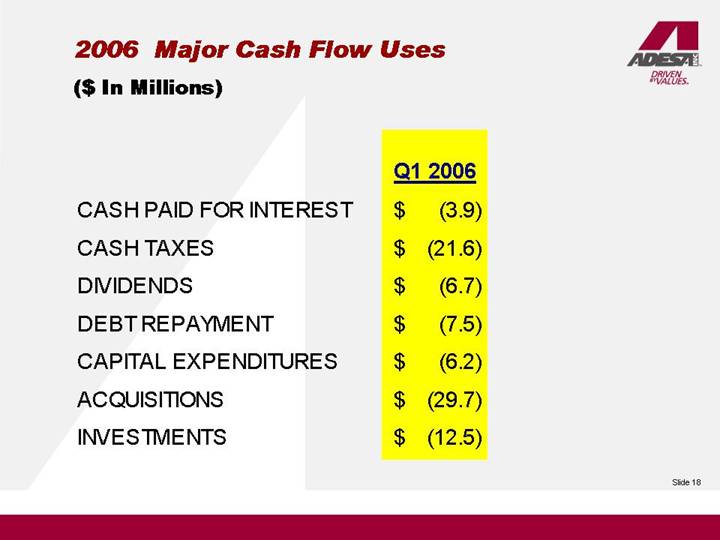
2006 Major Cash Flow Uses
($ In Millions)
| | Q1 2006 | |
| | | |
CASH PAID FOR INTEREST | | $ | (3.9 | ) |
| | | |
CASH TAXES | | $ | (21.6 | ) |
| | | |
DIVIDENDS | | $ | (6.7 | ) |
| | | |
DEBT REPAYMENT | | $ | (7.5 | ) |
| | | |
CAPITAL EXPENDITURES | | $ | (6.2 | ) |
| | | |
ACQUISITIONS | | $ | (29.7 | ) |
| | | |
INVESTMENTS | | $ | (12.5 | ) |
18
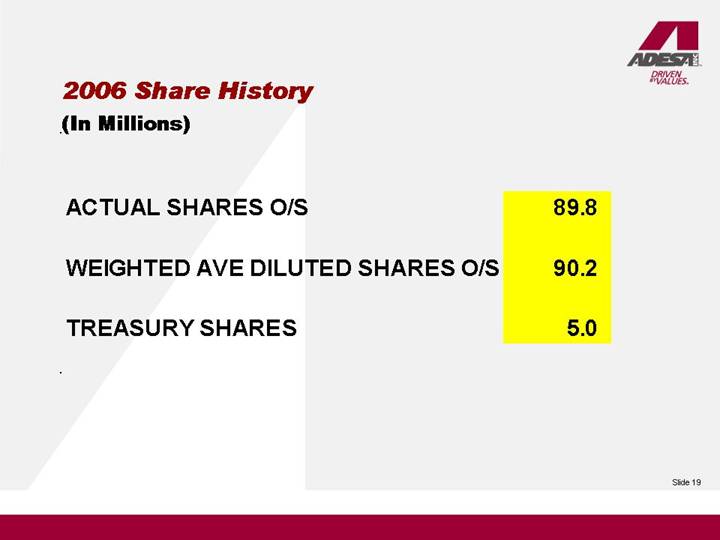
2006 Share History
(In Millions)
ACTUAL SHARES O/S | | 89.8 | |
| | | |
WEIGHTED AVE DILUTED SHARES O/S | | 90.2 | |
| | | |
TREASURY SHARES | | 5.0 | |
19
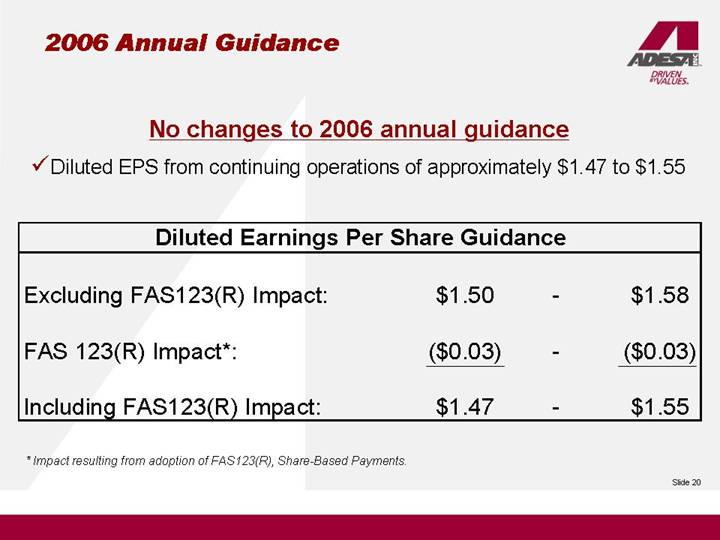
2006 Annual Guidance
No changes to 2006 annual guidance
• Diluted EPS from continuing operations of approximately $1.47 to $1.55
Diluted Earnings Per Share Guidance
Excluding FAS123(R) Impact: | | $ | 1.50 | | - | | $ | 1.58 | |
| | | | | | | |
FAS 123(R) Impact*: | | $ | (0.03 | ) | - | | $ | (0.03 | ) |
| | | | | | | |
Including FAS123(R) Impact: | | $ | 1.47 | | - | | $ | 1.55 | |
* Impact resulting from adoption of FAS123(R), Share-Based Payments.
20
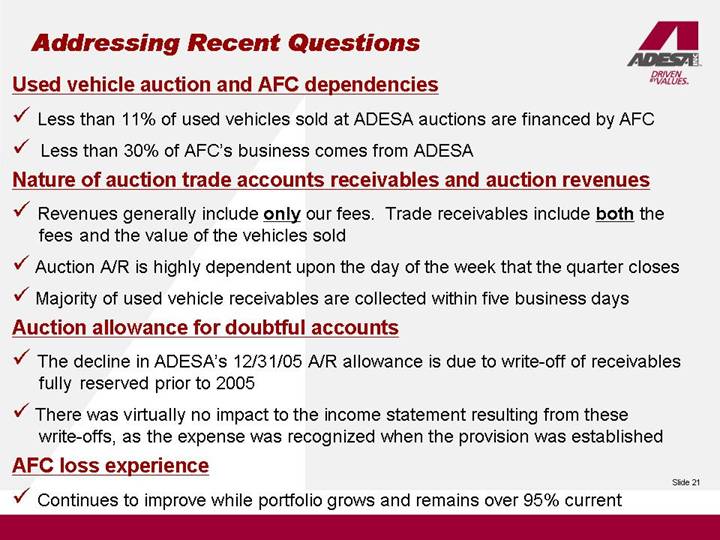
Addressing Recent Questions
Used vehicle auction and AFC dependencies
• Less than 11% of used vehicles sold at ADESA auctions are financed by AFC
• Less than 30% of AFC’s business comes from ADESA
Nature of auction trade accounts receivables and auction revenues
• Revenues generally include only our fees. Trade receivables include both the fees and the value of the vehicles sold
• Auction A/R is highly dependent upon the day of the week that the quarter closes
• Majority of used vehicle receivables are collected within five business days
Auction allowance for doubtful accounts
• The decline in ADESA’s 12/31/05 A/R allowance is due to write-off of receivables fully reserved prior to 2005
• There was virtually no impact to the income statement resulting from these write-offs, as the expense was recognized when the provision was established
AFC loss experience
• Continues to improve while portfolio grows and remains over 95% current
21
QUESTION AND ANSWER SESSION
22
DAVID GARTZKE
CLOSING REMARKS
23
APPENDIX 1
24
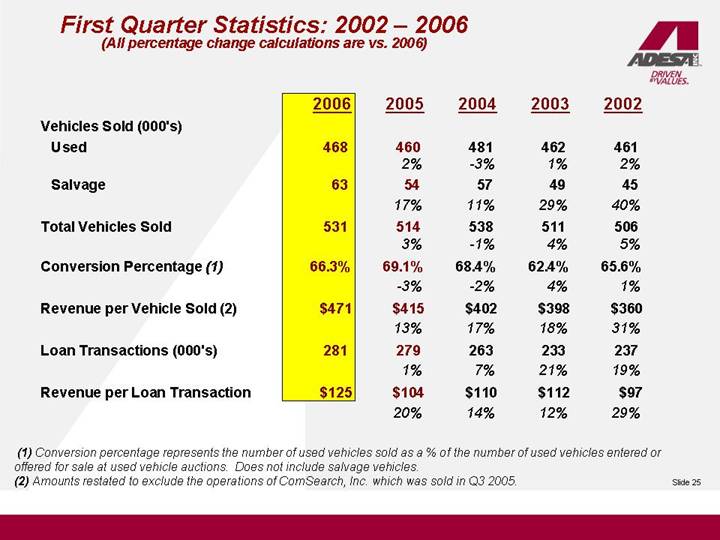
First Quarter Statistics: 2002 – 2006
(All percentage change calculations are vs. 2006)
| | 2006 | | 2005 | | 2004 | | 2003 | | 2002 | |
Vehicles Sold (000’s) | | | | | | | | | | | |
Used | | 468 | | 460 | | 481 | | 462 | | 461 | |
| | | | 2 | % | -3 | % | 1 | % | 2 | % |
Salvage | | 63 | | 54 | | 57 | | 49 | | 45 | |
| | | | 17 | % | 11 | % | 29 | % | 40 | % |
Total Vehicles Sold | | 531 | | 514 | | 538 | | 511 | | 506 | |
| | | | 3 | % | -1 | % | 4 | % | 5 | % |
Conversion Percentage (1) | | 66.3 | % | 69.1 | % | 68.4 | % | 62.4 | % | 65.6 | % |
| | | | -3 | % | -2 | % | 4 | % | 1 | % |
Revenue per Vehicle Sold (2) | | $ | 471 | | $ | 415 | | $ | 402 | | $ | 398 | | $ | 360 | |
| | | | 13 | % | 17 | % | 18 | % | 31 | % |
Loan Transactions (000’s) | | 281 | | 279 | | 263 | | 233 | | 237 | |
| | | | 1 | % | 7 | % | 21 | % | 19 | % |
Revenue per Loan Transaction | | $ | 125 | | $ | 104 | | $ | 110 | | $ | 112 | | $ | 97 | |
| | | | 20 | % | 14 | % | 12 | % | 29 | % |
(1) Conversion percentage represents the number of used vehicles sold as a % of the number of used vehicles entered or offered for sale at used vehicle auctions. Does not include salvage vehicles.
(2) Amounts restated to exclude the operations of ComSearch, Inc. which was sold in Q3 2005.
25
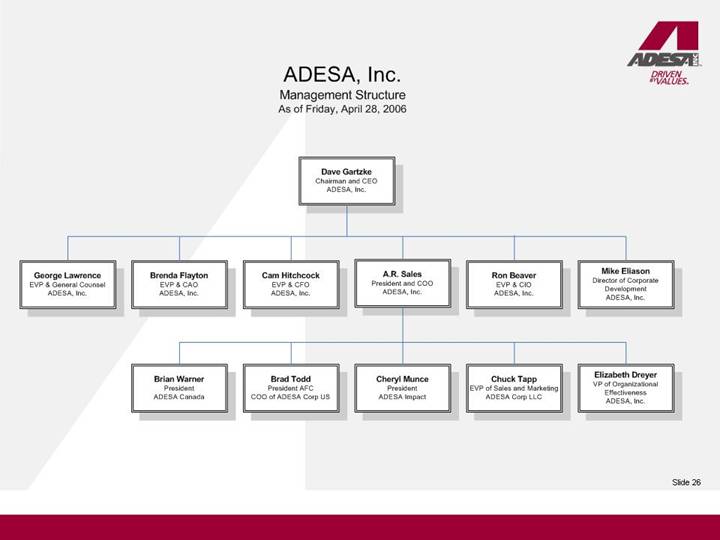
ADESA, Inc.
Management Structure
As of Friday, April 28, 2006
[GRAPHIC]
26
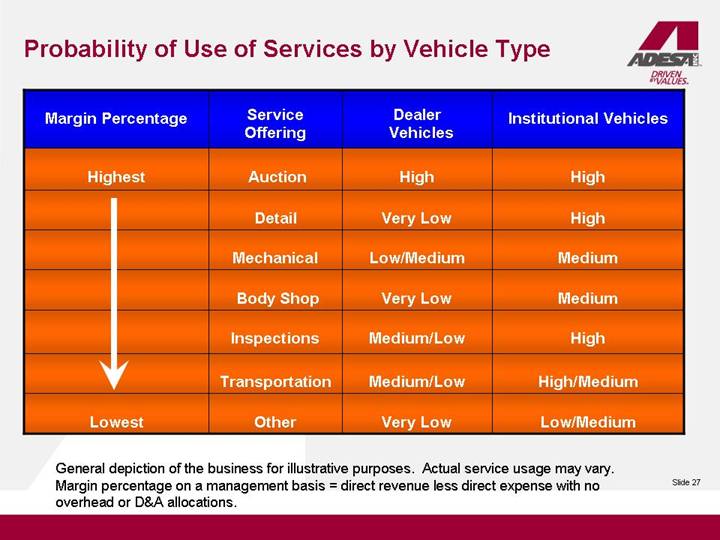
Probability of Use of Services by Vehicle Type
| | Service | | Dealer | | |
Margin Percentage | | Offering | | Vehicles | | Institutional Vehicles |
| | | | | | |
Highest | | Auction | | High | | High |
| | | | | | |
| | Detail | | Very Low | | High |
| | | | | | |
| | Mechanical | | Low/Medium | | Medium |
| | | | | | |
| | Body Shop | | Very Low | | Medium |
| | | | | | |
| | Inspections | | Medium/Low | | High |
| | | | | | |
| | Transportation | | Medium/Low | | High/Medium |
| | | | | | |
Lowest | | Other | | Very Low | | Low/Medium |
General depiction of the business for illustrative purposes. Actual service usage may vary. Margin percentage on a management basis = direct revenue less direct expense with no overhead or D&A allocations.
27
APPENDIX 2
28
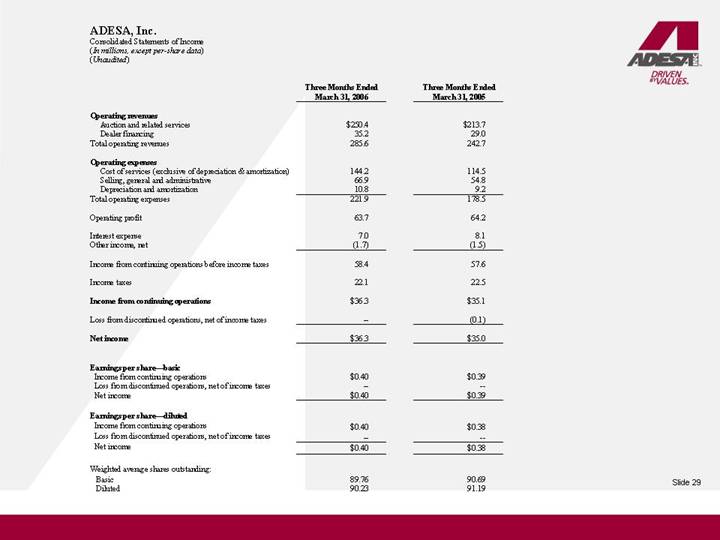
ADESA, Inc.
Consolidated Statements of Income
(In millions, except per-share data)
(Unaudited)
| | Three Months Ended | | Three Months Ended | |
| | March 31, 2006 | | March 31, 2005 | |
| | | | | |
Operating revenues | | | | | |
Auction and related services | | $ | 250.4 | | $ | 213.7 | |
Dealer financing | | 35.2 | | 29.0 | |
Total operating revenues | | 285.6 | | 242.7 | |
| | | | | |
Operating expenses | | | | | |
Cost of services (exclusive of depreciation & amortization) | | 144.2 | | 114.5 | |
Selling, general and administrative | | 66.9 | | 54.8 | |
Depreciation and amortization | | 10.8 | | 9.2 | |
Total operating expenses | | 221.9 | | 178.5 | |
| | | | | |
Operating profit | | 63.7 | | 64.2 | |
| | | | | |
Interest expense | | 7.0 | | 8.1 | |
Other income, net | | (1.7 | ) | (1.5 | ) |
| | | | | |
Income from continuing operations before income taxes | | 58.4 | | 57.6 | |
| | | | | |
Income taxes | | 22.1 | | 22.5 | |
| | | | | |
Income from continuing operations | | $ | 36.3 | | $ | 35.1 | |
| | | | | |
Loss from discontinued operations, net of income taxes | | — | | (0.1 | ) |
| | | | | |
Net income | | $ | 36.3 | | $ | 35.0 | |
| | | | | |
Earnings per share—basic | | | | | |
Income from continuing operations | | $ | 0.40 | | $ | 0.39 | |
Loss from discontinued operations, net of income taxes | | — | | — | |
Net income | | $ | 0.40 | | $ | 0.39 | |
| | | | | |
Earnings per share—diluted | | | | | |
Income from continuing operations | | $ | 0.40 | | $ | 0.38 | |
Loss from discontinued operations, net of income taxes | | — | | — | |
Net income | | $ | 0.40 | | $ | 0.38 | |
| | | | | |
Weighted average shares outstanding: | | | | | |
Basic | | 89.76 | | 90.69 | |
Diluted | | 90.23 | | 91.19 | |
29
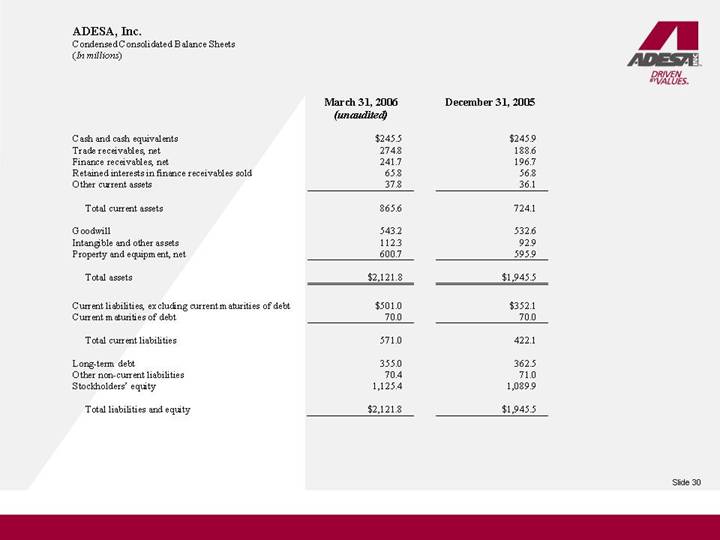
ADESA, Inc.
Condensed Consolidated Balance Sheets
(In millions)
| | March 31, 2006 | | December 31, 2005 | |
| | (unaudited) | | | |
| | | | | |
Cash and cash equivalents | | $ | 245.5 | | $ | 245.9 | |
Trade receivables, net | | 274.8 | | 188.6 | |
Finance receivables, net | | 241.7 | | 196.7 | |
Retained interests in finance receivables sold | | 65.8 | | 56.8 | |
Other current assets | | 37.8 | | 36.1 | |
| | | | | |
Total current assets | | 865.6 | | 724.1 | |
| | | | | |
Goodwill | | 543.2 | | 532.6 | |
Intangible and other assets | | 112.3 | | 92.9 | |
Property and equipment, net | | 600.7 | | 595.9 | |
| | | | | |
Total assets | | $ | 2,121.8 | | $ | 1,945.5 | |
| | | | | |
Current liabilities, excluding current maturities of debt | | $ | 501.0 | | $ | 352.1 | |
Current maturities of debt | | 70.0 | | 70.0 | |
| | | | | |
Total current liabilities | | 571.0 | | 422.1 | |
| | | | | |
Long-term debt | | 355.0 | | 362.5 | |
Other non-current liabilities | | 70.4 | | 71.0 | |
Stockholders’ equity | | 1,125.4 | | 1,089.9 | |
| | | | | |
Total liabilities and equity | | $ | 2,121.8 | | $ | 1,945.5 | |
30
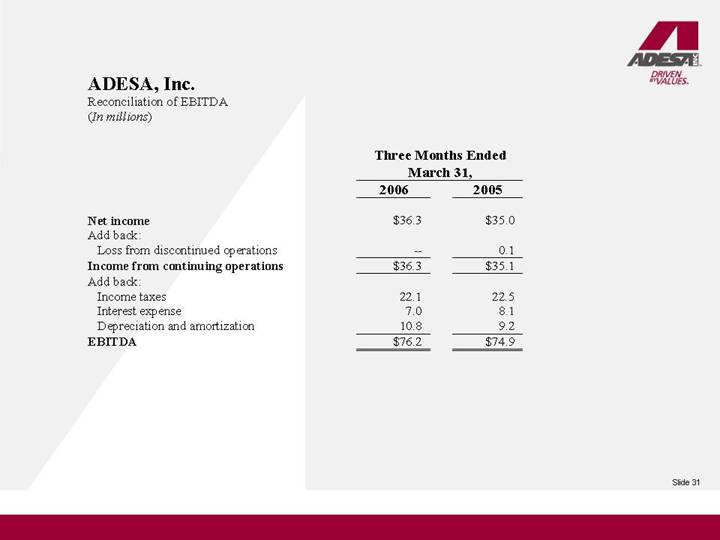
ADESA, Inc.
Reconciliation of EBITDA
(In millions)
| | Three Months Ended | |
| | March 31, | |
| | 2006 | | 2005 | |
| | | | | |
Net income | | $ | 36.3 | | $ | 35.0 | |
Add back: | | | | | |
Loss from discontinued operations | | — | | 0.1 | |
Income from continuing operations | | $ | 36.3 | | $ | 35.1 | |
Add back: | | | | | |
Income taxes | | 22.1 | | 22.5 | |
Interest expense | | 7.0 | | 8.1 | |
Depreciation and amortization | | 10.8 | | 9.2 | |
EBITDA | | $ | 76.2 | | $ | 74.9 | |
31