UNITED STATES
SECURITIES AND EXCHANGE COMMISSION
Washington, D.C. 20549
FORM 10-QSB
(Mark One)
x QUARTERLY REPORT PURSUANT TO SECTION 13 OR 15(d) OF THE SECURITIES
EXCHANGE ACT OF 1934
For the quarter ended February 29, 2008
o TRANSITION REPORT PURSUANT TO SECTION 13 OR 15(d) OF THE SECURITIES
EXCHANGE ACT OF 1934
For the transition period from _____________ to ____________
Commission File Number:
SEW CAL LOGO, INC.
(Exact name of Registrant as specified in charter)
| Nevada | 46-0495298 |
| (State or other jurisdiction of | (I.R.S. Employer I.D. No.) |
| incorporation or organization) |
207 W. 138th Street, Los Angeles, California 90061
(Address of principal executive offices) (Zip Code)
Issuer's telephone number, including area code: (310) 352-3300
Check whether the Issuer (1) has filed all reports required to be filed by section 13 or 15(d) of the Exchange Act during the past 12 months (or for such shorter period that the registrant was required to file such reports), and (2) has been subject to such filing requirements for the past 90 days. Yes x No o
State the number of shares outstanding of each of the Issuer's classes of common equity as of the latest practicable date: At February 29, 2008, there were 44,175,535 shares of the registrant's Common Stock outstanding and 300,000 shares of Series A Preferred Stock outstanding.
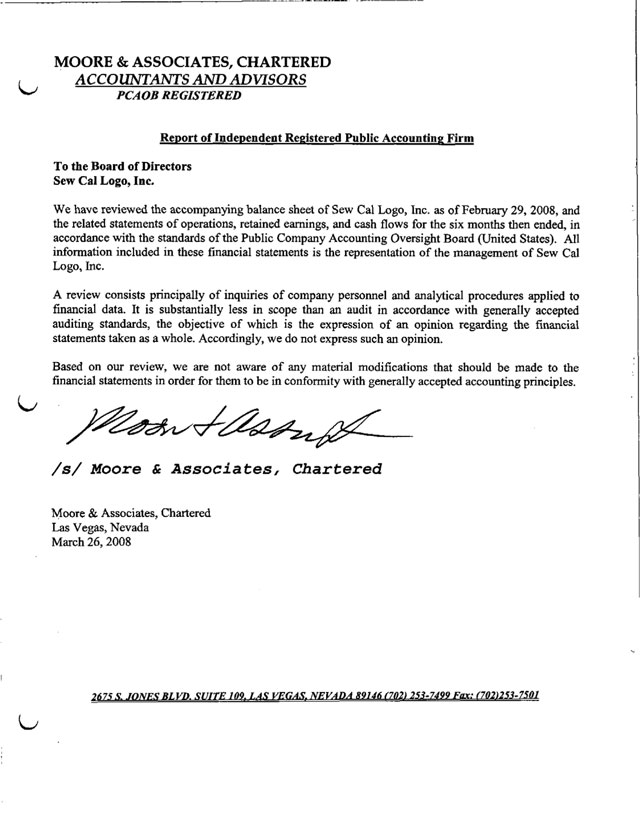
ITEM 1. FINANCIAL STATEMENTS
The financial statements included herein have been prepared by the Company, without audit, pursuant to the rules and regulations of the Securities and Exchange Commission. Certain information and footnote disclosures normally included in financial statements prepared in accordance with generally accepted accounting principles have been omitted. However, in the opinion of management, all adjustments (which include only normal recurring accruals) necessary to present fairly the financial position and results of operations for the periods presented have been made. The results for interim periods are not necessarily indicative of trends or of results to be expected for the full year. These financial statements should be read in conjunction with the financial statements and notes thereto included in the Company's most recent registration statement on Form SB-2 as amended.
SEW CAL LOGO, INC.
BALANCE SHEETS
| February 29, | August 31, | ||||||
| 2008 | 2007 | ||||||
| (Audited) | |||||||
ASSETS | |||||||
| Current Assets | |||||||
| Cash and cash equivalents | $ | 28,424 | $ | 155,704 | |||
| Accounts Receivable, net | 141,959 | 141,361 | |||||
| Inventory | 78,895 | 96,875 | |||||
| Security Deposits | 2,200 | 6,000 | |||||
| Prepaid Expenses | 6,000 | 3,800 | |||||
| Total current assets | 257,478 | 403,740 | |||||
| Equipment and machinery, net | 179,557 | 217,266 | |||||
| Other assets | - | - | |||||
| Total assets | $ | 437,035 | $ | 621,006 | |||
LIABILITIES AND STOCKHOLDERS' EQUITY | |||||||
| Current liabilities | |||||||
| Accounts payable | $ | 82,004 | $ | 53,317 | |||
| Note Payable-shareholder | 353,884 | 347,884 | |||||
| Other current liabilities | 399,552 | 252,630 | |||||
| Current Poriton of Long Term Debt | 194,145 | 227,659 | |||||
| Total current liabilities | 1,029,585 | 881,490 | |||||
| Long-term liabilities | |||||||
| Note Payable-related party | 35,707 | 46,019 | |||||
| Convertible Debentures | 2,330,480 | 2,331,517 | |||||
| Discount on Convertible Debentures | (646,899 | ) | (646,899 | ) | |||
| Equipment Loans | 10,969 | 11,851 | |||||
| Total liabilities | 2,759,842 | 2,623,978 | |||||
| Stockholders' Equity (Deficit) | |||||||
| Preferred stock, authorized 300,000 shares, Par value $0.001, issued and outstanding at 11/30/07 and 8/31/07 is 300,000 respectively | 300 | 300 | |||||
| Common stock, authorized 500,000,000 shares, $0.001 par value, issued and outstanding at 2/29/08 and 8/31/07 is 44,175,535 and 34,080,702 shares respectively. | 44,176 | 34,081 | |||||
| Additional Paid in Capital | 4,191,869 | 4,154,977 | |||||
| Stock Subscribed | - | - | |||||
| Accumulated Deficit | (6,559,152 | ) | (6,192,330 | ) | |||
| Total stockholders' equity (deficit) | (2,322,807 | ) | (2,002,972 | ) | |||
| Total liabilities and stockholders' equity | $ | 437,035 | $ | 621,006 | |||
The accompanying notes are an integral part of these statements
SEW CAL LOGO, INC.
STATEMENTS OF OPERATIONS
(Unaudited)
| Six Months Ended | Three Months Ended | ||||||||||||
| February 29, | February 28, | February 29, | February 28, | ||||||||||
| 2008 | 2007 | 2008 | 2007 | ||||||||||
| Revenue: | |||||||||||||
| Sales of Caps, Embroidery and Other | $ | 998,339 | $ | 1,005,468 | $ | 449,427 | $ | 443,864 | |||||
| Total Revenue | 998,339 | 1,005,468 | 449,427 | 443,864 | |||||||||
| Cost of Goods Sold | 957,810 | 907,108 | 466,907 | 455,655 | |||||||||
| Gross profit | 40,529 | 98,360 | (17,480 | ) | (11,791 | ) | |||||||
| Expenses: | |||||||||||||
| General and Administrative | 122,681 | 163,678 | 58,583 | 61,232 | |||||||||
| Officer and Administrative Compensation | 91,908 | 201,266 | 31,308 | 94,423 | |||||||||
| Consulting, Legal and Accounting | 127,798 | 107,469 | 59,667 | 52,597 | |||||||||
| Depreciation | 3,118 | 41,784 | 1,559 | 20,892 | |||||||||
| Rent | 24,000 | 140,000 | 12,000 | 60,000 | |||||||||
| Total expenses | 369,505 | 654,197 | 163,117 | 289,144 | |||||||||
| Loss from Operations | (328,976 | ) | (555,837 | ) | (180,597 | ) | (300,935 | ) | |||||
| Other Income (Expenses) | |||||||||||||
| Interest (Expense) | 37,846 | 58,509 | 17,268 | 18,160 | |||||||||
| Total other expenses | 37,846 | 58,509 | 17,268 | 18,160 | |||||||||
| Loss before income taxes | (366,822 | ) | (614,346 | ) | (197,865 | ) | (319,095 | ) | |||||
| Provision for income taxes | - | - | - | - | |||||||||
| Net loss | $ | (366,822 | ) | $ | (614,346 | ) | $ | (197,865 | ) | $ | (319,095 | ) | |
| Basic and Diluted Earnings (Loss) per Share | $ | (0.01 | ) | $ | (0.05 | ) | $ | (0.01 | ) | $ | (0.03 | ) | |
| Weighted Average Number of Common Shares | 27,595,484 | 12,030,707 | 27,595,484 | 12,030,707 | |||||||||
The accompanying notes are an integral part of these statements
SEW CAL LOGO, INC.
STATEMENTS OF STOCKHOLDERS' EQUITY
(Unaudited)
| Additional | Total | ||||||||||||||||||||||||
| Preferred Stock | Common Stock | Paid in | Stock | Accumulated | Stockholders' | ||||||||||||||||||||
| Shares | Amount | Shares | Amount | Capital | Subscribed | (Deficit) | Equity | ||||||||||||||||||
Balance, August 31, 2005 | 234,800 | $ | 235 | 5,176,168 | $ | 5,176 | $ | 187,517 | $ | 36,000 | $ | (673,814 | ) | $ | (444,886 | ) | |||||||||
| Shares issued for Services at $0.15 per share | 50,000 | 50 | 7,450 | 7,500 | |||||||||||||||||||||
| Fair Value of Warrants attached to Convertible Debentures | 1,081,657 | 1,081,657 | |||||||||||||||||||||||
| Beneficial Conversion Feature attached to Convertible Debentures | 2,500,000 | 2,500,000 | |||||||||||||||||||||||
| Shares issued for Services at $0.10 per share | 33,334 | 33 | 3,300 | 3,333 | |||||||||||||||||||||
| Shares issued for Conversion of Debt | 290,000 | 290 | 32,741 | 33,031 | |||||||||||||||||||||
| Net Loss for Year | (2,947,833 | ) | (2,947,833 | ) | |||||||||||||||||||||
Balance, August 31, 2006 | 234,800 | 235 | 5,549,502 | 5,549 | 3,812,665 | 36,000 | (3,621,647 | ) | 232,802 | ||||||||||||||||
| Preferred Shares issued for Services | 65,200 | 65 | 1,891 | 1,956 | |||||||||||||||||||||
| Common Stock Issued for Cash | 61,000 | 61 | 60,939 | (36,000 | ) | 25,000 | |||||||||||||||||||
| Shares issued for Services | 3,500,200 | 3,501 | 214,000 | 217,501 | |||||||||||||||||||||
| Shares issued for Conversion of Debt | 24,970,000 | 24,970 | 65,482 | 90,452 | |||||||||||||||||||||
| Net Income (Loss) for period | (2,570,683 | ) | (2,570,683 | ) | |||||||||||||||||||||
Balance, August 31, 2007 | 300,000 | 300 | 34,080,702 | 34,081 | 4,154,977 | - | (6,192,330 | ) | (2,002,972 | ) | |||||||||||||||
| Shares issued for Services | 9,150,000 | 9,150 | 36,600 | 45,750 | |||||||||||||||||||||
| Shares issued for Conversion of Debt | 744,833 | 745 | 292 | 1,037 | |||||||||||||||||||||
| Shares issued for Conversion of Debt | 200,000 | 200 | - | 200 | |||||||||||||||||||||
| Net Income (Loss) for period | (366,822 | ) | (366,822 | ) | |||||||||||||||||||||
Balance, February 29, 2008 | 300,000 | 300 | 44,175,535 | 44,176 | 4,191,869 | - | (6,559,152 | ) | (2,322,807 | ) | |||||||||||||||
The accompanying notes are an integral part of these statements
SEW CAL LOGO, INC.
STATEMENTS OF CASH FLOWS
(Unaudited)
| Six Months Ended | Three Months Ended | ||||||||||||
| February 29, | February 28, | February 29, | February 28, | ||||||||||
| 2008 | 2007 | 2008 | 2007 | ||||||||||
| Operating Activities: | |||||||||||||
| Net income (loss) | $ | (366,822 | ) | $ | (614,346 | ) | $ | (197,865 | ) | $ | (329,864 | ) | |
| Adjustments to reconcile net income (loss) | |||||||||||||
| Depreciation | 3,118 | 41,784 | 3,118 | 20,893 | |||||||||
| Stock issued for services | 45,950 | 19,835 | 200 | - | |||||||||
| Warrants issued for convertible debt | - | 68,898 | - | - | |||||||||
| Amortization of Discount on Debentures | - | 21,538 | - | - | |||||||||
| Changes in Assets and Liabilities | |||||||||||||
| (Increase) decrease in prepaid expenses | (2,200 | ) | (9,890 | ) | (2,200 | ) | (6,593 | ) | |||||
| (Increase) decrease in inventory | 17,980 | 693 | 3,230 | 3,403 | |||||||||
| (Increase) decrease in security deposits | 3,800 | - | 3,800 | - | |||||||||
| (Increase) decrease in accounts receivable | (598 | ) | 101,645 | 48,964 | 75,535 | ||||||||
| Increase (decrease) in accounts payable | 28,687 | (118 | ) | 51,717 | 20,502 | ||||||||
| Increase (decrease) in other current liabilities | 113,408 | 66,379 | 73,497 | 130,310 | |||||||||
| Net cash provided by (used in) operating activities | (156,677 | ) | (303,582 | ) | (15,539 | ) | (85,814 | ) | |||||
| Investing Activities: | |||||||||||||
| (Purchases) disposal of equipment | 34,591 | (15,000 | ) | 15,737 | - | ||||||||
| Cash (used) in investing activities | 34,591 | (15,000 | ) | 15,737 | - | ||||||||
| Financing Activities: | |||||||||||||
| Notes Payable | (48,291 | ) | - | ||||||||||
| Debentures Payable | 6,000 | (68,898 | ) | 6,000 | - | ||||||||
| Stock Subscription | - | - | - | - | |||||||||
| Stock Sales | - | 25,000 | - | - | |||||||||
| Increase/(Decrease) in shareholder loan | - | - | - | - | |||||||||
| Repayment of loans | (10,312 | ) | (4,674 | ) | (5,188 | ) | 4,734 | ||||||
| Proceeds from equipment loan | (882 | ) | - | (882 | ) | (2,459 | ) | ||||||
| Net cash provided by (used in) financing activities | (5,194 | ) | (96,863 | ) | (70 | ) | 2,275 | ||||||
| Net increase (decrease) in cash and cash equivalents | (127,280 | ) | (415,445 | ) | 128 | (83,539 | ) | ||||||
| Cash and cash equivalents at beginning of the period | 155,704 | 988,251 | 28,296 | 656,345 | |||||||||
| Cash and cash equivalents at end of the period | $ | 28,424 | $ | 572,806 | $ | 28,424 | $ | 572,806 | |||||
| Cash Paid For: | |||||||||||||
| Interest | $ | 37,846 | $ | 58,509 | $ | 37,846 | $ | 58,509 | |||||
| Taxes | $ | - | $ | - | $ | - | $ | - | |||||
| Non Cash Activities: | |||||||||||||
| Depreciation | $ | 3,118 | $ | 41,784 | $ | 3,118 | $ | 20,893 | |||||
| Stock issued for services | $ | 45,950 | $ | 19,835 | $ | 200 | $ | - | |||||
| Warrants issued for convertible debt | $ | - | $ | 68,898 | $ | - | $ | - | |||||
| Amortization of Discount on Debentures | $ | - | $ | 21,538 | $ | - | $ | - | |||||
The accompanying notes are an integral part of these statements
NOTES TO UNAUDITED FINANCIAL STATEMENTS
(February 29, 2008 and August 31, 2007)
NOTE 1. Summary of Significant Accounting Policies
The Company
C J Industries was incorporated in the State of California on August 30, 1985 and changed its name to Southern California Logo, Inc (the Company). The Company transacts business as Sew Cal Logo.
On February 24, 2004 the Company merged with Calvert Corporation, a Nevada Corporation. This was a recapitalization accounted for as a stock exchange transaction (reverse merger). Calvert also changed its name to Sew Cal Logo, Inc. See Note 9 for more details of this merger.
The Company is located in Los Angeles, California. The Company produces and manufactures custom embroidered caps, sportswear and related corporate identification apparel. The Company provides an in-house, full-service custom design center where original artwork and logo reproduction for embroidery are available. The Company also offers contract embroidery and silk-screening to the manufacturing and promotional industry. The Company’s products are sold, primarily in the United States, to Fortune 500 companies, major motion picture and television studios, retailers, and local schools and small businesses.
Use of Estimates
The financial statements have been prepared in conformity with accounting principles generally accepted in the United States, which require management to make estimates, and assumptions that affect the reported amounts of assets and liabilities (including disclosure of contingent assets and liabilities) at the date of the financial statements and the reported amounts of revenues and expenses during the reporting period. Actual results could differ from those estimates.
Accounts Receivable
The Company’s trade accounts receivable and allowance for doubtful accounts are shown below.
| 2/29/08 | 8/31/07 | ||||||
| Gross Trade Accounts Receivable | $ | 143,393 | $ | 142,798 | |||
| Allowance for Doubtful Accounts | (1,434 | ) | (1,428 | ) | |||
| Accounts Receivable, net | $ | 141,959 | $ | 141,361 | |||
Revenue Recognition
The Company recognizes revenue from product sales upon shipment, which is the point in time when risk of loss is transferred to the customer, net of estimated returns and allowances.
Cash and Cash equivalents
The Company maintains cash deposits in banks and in financial institutions located in southern California. Deposits in banks are insured up to $100,000 by the Federal Deposit Insurance Corporation (“FDIC”). The Company has not experienced any losses in such accounts and believes it is not exposed to any significant credit risk on cash deposits.
Inventory
Inventory is stated at the lower of cost (first-in, first-out method) or market and consists of raw material, work-in-process and finished goods. Normally the Company ships out to the customer the finished goods as soon as they are produced and therefore usually does not maintain a finished goods inventory. Overhead items are applied on a standard cost basis to work in process and finished goods.
| 2/29/08 | 8/31/07 | ||||||
| Raw Materials and WIP | $ | 78,895 | $ | 96,875 | |||
| Finished Goods | - | - | |||||
| Total Inventory | $ | 78,895 | $ | 96,875 | |||
Equipment and Machinery
Equipment and machinery are stated at cost. Depreciation is computed using the straight-line method over their estimated useful lives ranging from five to seven years. Depreciation and amortization expense for the fiscal years ended August 31, 2007 and 2006 amounted to $79,493 and $81,430 respectively. Gains from losses on sales and disposals are included in the statements of operations. Maintenance and repairs are charged to expense as incurred. As of February 29, 2008 and August 31, 2007 equipment and machinery consisted of the following:
| 2/29/08 | 8/31/07 | ||||||
| Equipment and Machinery | $ | 942,890 | $ | 968,644 | |||
| Less: | |||||||
| Accumulated depreciation | (763,333 | ) | (678,586 | ) | |||
| $ | 179,557 | $ | 290,058 | ||||
Fiscal Year
The Company operates on a fiscal year basis with a year ending August 31.
Earnings and Loss Per Share Information
Basic net earnings (loss) per common share is computed by dividing net earnings (loss) applicable to common shareholders by the weighted-average number of common shares outstanding during the period.
Segment Reporting
Pursuant to Statement of Financial Accounting Standards No. 131 (“SFAS No. 131”), “Disclosure about Segments of an Enterprise and Related Information,” the Company has determined it operated in only one segment.
NOTE 2. Going Concern
The accompanying financial statements have been prepared assuming that the Company will continue as a going concern, which contemplates the realization of assets and the liquidation of liabilities in the normal course of business. However, the Company has accumulated a loss $6,361,287 during its years of operation. This raises substantial doubt about the Company’s ability to continue as a going concern. The financial statements do not include any adjustments that might result from this uncertainty.
Managements Plan
Management continues to seek funding from its shareholders and other qualified investors to pursue its business plan. It is in the process of expanding its sales and distribution capability.
NOTE 3. Accounts Payable and Other Current Liabilities
As of the period ends shown, accounts payable and accrued liabilities consisted of the following:
| 2/29/08 | 8/31/07 | ||||||
| Trade accounts payable | $ | 82,004 | $ | 53,317 | |||
| Sales tax payable | $ | 2,391 | $ | 2,443 | |||
| Short Term Loan – Related Party | 244,063 | 86,600 | |||||
| Payroll Liabilities | 32,744 | 31,389 | |||||
| Credit Card Debt | 22,284 | 32,778 | |||||
| Revolving bank line of credit (Prime + 3.8 %, interest payable monthly), Principal due upon maturity on 7/1/07 unless renewed by bank, secured by accounts receivable | 98,070 | 99,420 | |||||
| - | - | ||||||
| $ | 399,552 | $ | 252,630 | ||||
NOTE 4. Note Payable- Related Party
On March 1, 2003, for purposes of working capital, the sole shareholder and spouse made a $355,384 subordinated loan to the Company. The Company is obligated to pay monthly interest only on the subordinated loan during its term at the rate of 10% per annum (fixed-rate calculated as simple interest). The entire principal amount of the loan was originally due on March 1, 2004, and has continued from that time on a month-to-month basis. The subordinated loan, which was consented to by United Commercial Bank and subsequent banks, is collateralized by the assets of the Company, including but not limited to any and all equipment owned by the Company, inventory, and outstanding receivables. The balance due at February 29, 2008 is $353,884.
On April 4, 2005 a shareholder loaned the company $100,000 on a five year monthly installment loan at 5% per annum for the purchase equipment. Balance of loan as of February 29, 2008 is $36,398.
NOTE 5. Commitments and Contingencies
Long-Term Debt
On March 25, 2002 the Company entered into an agreement with United Commercial Bank for a $515,000 SBA loan. For the years ending August 31, 2003 and 2002, the unpaid principal balance of the loan was $462,100 and $500,313 respectively. The monthly required payment varied with an annual interest rate of 6.75% and a maturity date of March 1, 2012. This loan related to the purchase of equipment.
On August 11, 2004 the Company refinanced this SBA loan with Pacific Liberty Bank. As of February 29, 2008 the balance was $194,444. Monthly payments are made the 15th of each month with interest at prime plus 2.5. Currently the interest rate is 9.5%. This loan is collateralized by the assets of the corporation and is in first place before the shareholder loan.
On April 16, 2003 the Company entered an installment sale contract with GMAC for the purchase of a vehicle. The total amount financed at signing was $40,754 that represents the total sale price. The agreement requires 60 monthly payments of approximately $679 beginning on May 16, 2003 and ending on April 16, 2008. This Loan has been paid off.
The Company has a second installment loan with GMAC on a vehicle with a balance as of February 29, 2008 of $10,969.
Lease Commitments
The Company leases warehouse and office facilities under an operating lease requiring the Company to pay property taxes and utilities. In July 2004 this building was purchased by a related party (a corporation controlled by the officers) and the lease was re-written for 5 years. Lease expense is currently $12,500 per month.
The lease obligation is shown below for the next five years.
| Year 1 | Year 2 | Year 3 | Year 4 | Year 5 | ||||||||||||
| Office /warehouse lease | $ | 150,000 | $ | 150,000 | $ | 150,000 | $ | 150,000 | $ | 150,000 | ||||||
Callable Convertible Debentures
On February 16, 2006 the Company executed an equity financing agreement wherein it will issue an aggregate of $2,000,000 callable convertible debentures in three segments. The Company has received a net of $1,955,000. The debentures are convertible to common stock at 45% below the lowest three intra-day trading price during the 20 trading days immediately preceding conversion.
The Debentures also carry five-year warrants exercisable at $0.50 per share. The aggregate number of warrants to be issued is 2,142,855. The Company has recorded an expense of $585,343 for the fair value of the warrants. The value was determined using the Black-Scholes pricing model and assumes a 5 year maturity, a risk free interest rate of 4.85% and a volatility of 207%.
The Company has recorded a discount on the convertible debentures of $2,000,000 which represents the beneficial conversion feature. During the years ended August 31, 2007 and 2006 the Company converted $90,452 and $33,031 debt into stock, respectively. During the years ended August 31, 2007 and 2006 the Company expensed $983,485 and $565,752 of the recorded discount as interest expense, respectively. The Company will amortize the remaining discount over the remaining life of the debentures. The discount was determined using the Black-Scholes pricing model and assumes a 2 year maturity, a risk free interest rate of 4.85% and a volatility of 207%.
On July 31, 2006 the Company executed an equity financing agreement wherein it has issued $500,000 in callable convertible debentures and 20,000,000 seven year warrants exercisable at $0.05 per share. The debentures are convertible to common stock at 40% below the lowest three intra-day trading price during the 20 trading days immediately preceding conversion. The aggregate number of shares to possibly be issued at 100% conversion is 69,444,444 shares. Calculated using a current 3 day trading average price per share of $0.012 per share less 40% is $0.0072 per share divided into $500,000 equals 69,444,444 shares.
During the year ended August 31, 2006, the Company recorded an expense of $496,314 for the fair value of the warrants. The value was determined using the Black-Scholes pricing model and assumes a 5 year maturity, a risk free interest rate of 4.85% and a volatility of 207%.
The Company recorded a discount on the convertible debentures of $500,000 which represents the beneficial conversion feature and is amortized to interest expense over the 2 year life of the debentures. The Company recorded an expense of $ 250,000 and $20,833 respectively for the years ended August 31, 2007 and 2006. The discount was determined using the Black-Scholes pricing model and assumes a 2 year maturity, a risk free interest rate of 4.85% and a volatility of 207%.
NOTE 6. Stockholders’ Equity
Preferred Stock
The Company (post merger) is authorized to issue three hundred thousand (300,000) shares of series A preferred stock at a par value of $0.001. The preferred stock is convertible to common stock at one share of preferred for every 100 shares of common. The preferred shares can only be converted when the Company reaches $10,000,000 in sales for any fiscal year. As of August 31, 2004 there were 234,800 shares of preferred stock. The value was placed at par. The conversion to common stock would be 23,480,000 shares. Based upon the actual growth for the last two years, the $10,000,000 in sales will not be reached within five years. Therefore, these shares are not considered in calculating the loss per share.
During the quarter ended May 31, 2007 the Company issued 65,200 preferred shares for services to key employees for services.
Common Stock
On August 25, 2006 the Company’s authorization to issued common stock was increased from 50,000,000 shares to 500,000,000 shares at par value of $0.001
As of August 31, 2004 (post merger) the Company had 5,020,000 common shares issued and outstanding. The Company’s financial statements have been restated to reflect the recapitalization on a retroactive basis.
In May 2005 the Company purchased equipment valued at $114,100 for 33,334 common share and issued 122,834 common shares for services valued at $12,283.
As of 31 May 2005 the Company had received from investors $36,000 in investment funds for which restricted common shares will be issued. The exact number of shares has not yet been determined.
On January 6, 2006 the Company issued 50,000 common shares for services valued at $7,500.
On February 16, 2006 the Company entered into a securities purchase agreement for a total subscription amount of $2,000,000 that includes stock purchase warrants and callable convertible debentures. A discount on convertible debentures was recorded as additional paid in capital of $2,000,000 for the beneficial conversion feature which is being amortized over the life of the debentures. The total subscription includes an aggregate of 2,142,858 five-year warrants exercisable for the same number of common shares at $0.50 per share. An aggregate of 25,974,026 common shares have been registered and are available for issue to potentially convert the full $2,000,000.
On July 31, 2006 the Company issued $500,000 in convertible debentures which are convertible to shares of the Company’s common stock at a 40% discount to the market price at the time of conversion. A discount on convertible debentures was recorded as additional paid in capital of $500,000 for the beneficial conversion feature which is being amortized over the life of the debentures. Common stock registered to convert the full $500,000 was calculated at 69,444,444 shares using the current three day average price per share of $0.012 less a 40% discount.
On May 31, 2006 the Company issued 290,000 common shares by converting $33,031 of debenture debt and issued 33,334 common shares for consulting services valued at $3,333.
The Company issued 61,000 common shares for cash of $25,000 and the subscription deposit of $36,000 received in May 2005 in a private placement.
During the Year ended August 31, 2007 the Company issued 3,500,200 common shares for various services valued at $217,501 including 2,750,000 common shares in settlement of a finders fee dispute valued at $200,000. The Company converted $90,452 debenture debt by issuing 24,970,000 common shares.
During the three months ended November 30, 2007 the Company issued 9,150,000 common shares for various services valued at $45,750. The Company converted $1,037 debenture debt by issuing 744,833 common shares.
During the three months ended February 29, 2008 the Company converted $200 debenture debt using 200,000 common shares.
Warrants
With the $1,955,000 worth of convertible debentures described above 2,000,000 five-year warrants for commons stock exercisable at $0.50 per share were issued and with the $500,000 convertible debentures 20,000,000 seven-year warrants for common shares exercisable at $0.05 per share were issued. Both exercisable prices are “out of the money” therefore no discount has been recorded.
NOTE 7. Interest Expense
Interest expense for the periods ended February 29, 2008 and August 31, 2007 is $37,846 and $1,309,263 respectively.
NOTE 8. Income Taxes
The Company provides for income taxes under Statement of Financial Accounting Standards No. 109, Accounting for Income Taxes. SFAS No. 109 requires the use of an asset and liability approach in accounting for income taxes. Deferred tax assets and liabilities are recorded based on the differences between the financial statement and tax bases of assets and liabilities and the tax rates in effect when these differences are expected to reverse.
SFAS No. 109 requires the reduction of deferred tax assets by a valuation allowance if, based on the weight of available evidence, it is more likely than not that some or all of the deferred tax assets will not be realized. In the Company’s opinion, it is uncertain whether they will generate sufficient taxable income in the future to fully utilize the net deferred tax asset. Accordingly, a valuation allowance equal to the deferred tax asset has been recorded. The total deferred tax asset is calculated by multiplying a 15% estimated tax rate by the items making up the deferred tax account. For the Company only the Net Operating Loss (NOL) was available for a tax asset.
The provision for income taxes is comprised of the net changes in deferred taxes less the valuation account plus the current taxes payable.
At August 31, 2006, federal income tax net operating loss carry forwards (“NOL’s”) which were available to the Company were the following with the year in which they expire.
| Year (8/31) | Amount | Expires | |||||
| 1996 | $ | 2,104 | 2011 | ||||
| 1997 | 9,265 | 2012 | |||||
| 1998 | 26,317 | 2013 | |||||
| 1999 | 21,074 | 2019 | |||||
| 2000 | 50,619 | 2020 | |||||
| 2001 | 21,675 | 2020 | |||||
| 2002 | 319,424 | 2022 | |||||
| 2003 | 45,381 | 2023 | |||||
| 2005 | 105,366 | 2025 | |||||
| 2006 | 2,947,833 | 2026 | |||||
| 2007 | 2,570,683 | 2027 | |||||
| Total | $ | 6,119,741 | |||||
Were the NOL tax asset to be recorded at 8/31/07 it would be a long-term asset of $917,961. Continued profitability by the Company will be a major factor in the valuation account being removed and the recording of this asset.
NOTE 9. Merger with Calvert
On February 24, 2004 the Company merged with Calvert Corporation, an inactive Nevada Corporation. This was a recapitalization accounted for as a stock exchange reverse acquisition with Calvert being the surviving legal entity and Southern California becoming the surviving historical entity. Before the merger Southern California had 100 shares of common stock issued and outstanding that were owned by a single shareholder. As part of the merger Calvert issued to this shareholder 189,800 shares of series A preferred stock and 3,000,000 shares of common stock in exchange for all the shares (100) of Southern California. These share totals have been retroactively applied to previous years.
As part of the merger 45,000 shares of preferred stock and 1,500,000 shares of common stock were issued for services rendered. A value of $1,545 was placed upon these shares.
Calvert had a zero book value prior to the merger and is shown as the acquired company on the statement of stockholders’ equity with 520,000 shares outstanding prior to the merger.
After the completion of the merger the Company had 5,020,000 shares of common stock and 234,800 shares of series A preferred stock.
NOTE 10. THE EFFECT OF RECENTLY ISSUED ACCOUNTING STANDARDS
Below is a listing of the most recent Statement of Financial Accounting Standards (SFAS) SFAS 155-157 and their effect on the Company.
Statement No. 155 – Accounting for Certain Hybrid Financial Instruments
In February 2006, the FASB issued SFAS No. 155, Accounting for Certain Hybrid Financial Instruments, which amends SFAS No. 133, Accounting for Derivatives Instruments and Hedging Activities and SFAS No. 140, Accounting for Transfers and Servicing of Financial Assets and Extinguishment of Liabilities. SFAS No. 155 amends SFAS No. 133 to narrow the scope exception for interest-only and principal-only strips on debt instruments to include only such strips representing rights to receive a specified portion of the contractual interest or principle cash flows. SFAS No. 155 also amends SFAS No. 140 to allow qualifying special-purpose entities to hold a passive derivative financial instrument pertaining to beneficial interests that itself is a derivative instrument.
Statement No. 156 – Accounting for Servicing of Financial Assets
In March 2006, the FASB issued SFAS No. 156, Accounting for Servicing of Financial Assets, which provides an approach to simplify efforts to obtain hedge-like (offset) accounting. This Statement amends FASB Statement No. 140, Accounting for Transfers and Servicing of Financial Assets and Extinguishments of Liabilities, with respect to the accounting for separately recognized servicing assets and servicing liabilities. The Statement (1) requires an entity to recognize a servicing asset or servicing liability each time it undertakes an obligation to service a financial asset by entering into a servicing contract in certain situations; (2) requires that a separately recognized servicing asset or servicing liability be initially measured at fair value, if practicable; (3) permits an entity to choose either the amortization method or the fair value method for subsequent measurement for each class of separately recognized servicing assets or servicing liabilities; (4) permits at initial adoption a one-time reclassification of available-for-sale securities to trading securities by an entity with recognized servicing rights, provided the securities reclassified offset the entity's exposure to changes in the fair value of the servicing assets or liabilities; and (5) requires separate presentation of servicing assets and servicing liabilities subsequently measured at fair value in the balance sheet and additional disclosures for all separately recognized servicing assets and servicing liabilities. SFAS No. 156 is effective for all separately recognized servicing assets and liabilities as of the beginning of an entity's fiscal year that begins after September 15, 2006, with earlier adoption permitted in certain circumstances. The Statement also describes the manner in which it should be initially applied.
Statement No. 157 – Fair Value Measurements
In September 2006, the FASB issued SFAS No. 157, Fair Value Measurements, to clarify how to measure fair value and to expand disclosures about fair value measurements. The expanded disclosures include the extent to which companies measure assets and liabilities at fair value, the information used to measure fair value, and the effect of fair value on earnings and is applicable whenever other standards require (or permit) assets and liabilities to be measured at fair value. SFAS 157 is effective for financial statements issued for fiscal years beginning after November 15, 2007 and interim periods within those fiscal years.
Statement No. 158 – Employers’ Accounting for Defined Benefit Pension and Other Postretirement Plans—an amendment of FASB Statements No. 87, 88, 106, and 132(R)
In September 2006, the FASB issued SFAS No. 158, Employers’ Accounting for Defined Benefit Pension and Other Postretirement Plans—an amendment of FASB Statements No. 87, 88, 106, and 132(R). To improve financial reporting by requiring an employer to recognize the overfunded or underfunded status of a defined benefit postretirement plan (other than a multiemployer plan) as an asset or liability in its statement of financial position and to recognize changes in that funded status in the year in which the changes occur through comprehensive income of a business entity or changes in unrestricted net assets of a not-for-profit organization. This Statement also improves financial reporting by requiring an employer to measure the funded status of a plan as of the date of its year-end statement of financial position, with limited exceptions.
Statement No. 159 – The Fair Value Option for Financial Assets and Financial Liabilities—Including an amendment of FASB Statement No. 115
In February 2007, the FASB issued SFAS No. 159, The Fair Value Option for Financial Assets and Financial Liabilities—Including an amendment of FASB Statement No. 115. This Statement permits entities to choose to measure many financial instruments and certain other items at fair value. The objective is to improve financial reporting by providing entities with the opportunity to mitigate volatility in reported earnings caused by measuring related assets and liabilities differently without having to apply complex hedge accounting provisions. This Statement is expected to expand the use of fair value measurement, which is consistent with the Board’s long-term measurement objectives for accounting for financial instruments.
Statement No. 141 (revised 2007) – Business Combinations
In December 2007, the FASB revised SFAS No. 141, Business Combinations. This revision changes the way the minority interest in a company is measured, recorded and reported in the parent companies financial statements to the end that a statement user can better evaluate the nature and financial effects of the business combination.
Statement No. 160 – Noncontrolling Interests in Consolidated Financial Statements—an amendment of ARB No. 51
In December 2007, the FASB issued SFAS No. 160, Noncontrolling Interests in Consolidated Financial Statements—an amendment of ARB No. 51. A noncontrolling interest, sometimes called a minority interest, is the portion of equity in a subsidiary not attributable, directly or indirectly, to a parent. The objective of this Statement is to improve the relevance, comparability, and transparency of the financial information that a reporting entity provides in its consolidated financial statements related to the noncontrolling or minority interest.
The adoption of these new Statements is not expected to have a material effect on the Company’s current financial position, results or operations, or cash flows.
NOTE 11. Restated Financial Statements
The Company’s financial statements for the year ended August 31, 2006 have been restated to reflect the beneficial conversion feature and the warrants attached to the convertible debt issued during 2006. A summary of the effect of the restatements is as follows:
Balance Sheet:
| Discount on Convertible Debentures | ||||
| Original | $ | 485,014 | ||
| As Restated | 1,880,384 | |||
| Additional Paid in Capital | ||||
| Original | $ | 746,008 | ||
| As Restated | 3,812,665 | |||
| Accumulated Deficit | ||||
| Original | $ | 1,950,360 | ||
| As Restated | 3,621,647 | |||
Statement of Operations: | ||||
| Warrant Expense | ||||
| Original | $ | - | ||
| As Restated | 1,081,657 | |||
| Interest Expense | ||||
| Original | $ | 126,810 | ||
| As restated | 716,440 | |||
ITEM 2. MANAGEMENT'S DISCUSSION AND ANALYSIS OF CONTINUING AND FUTURE PLAN OF OPERATIONS.
FORWARD LOOKING STATEMENTS
This analysis should be read in conjunction with the condensed consolidated financial statements, the notes thereto, and the financial statements and notes thereto included in the Company's Registration Statement on Form SB-2, as amended, initially filed on March 20, 2004. All non-historical information contained in this annual report is a forward-looking statement. The forward-looking statements contained herein are subject to certain risks and uncertainties that could cause the actual results to differ materially from those reflected in the forward-looking statements.
Results of Operations
Total revenue was $449,427for the quarter ended February 29, 2008 as compared to $443,864 for the quarter ended February 28, 2007, a net increase of $5,563. The net increase is a result of our effort to replace what has become non-profitable business with profitable activities. Also, overall losses as a percentage of sales were cut by approximately 38%, reversing a negative trend. This can be attributed directly to both internal restructuring and to our significant investment in the research and development of our new brand based on the Pipeline Posse. Our line of clothing is continuing to be developed and advertising and promotional campaigns are initiated and underway. Officer and Administrative Compensation was $31,308 for the quarter ended February 29, 2008 as compared to $94,423 for the quarter ended February 28, 2008, a net decrease of $63,115. The net decrease is due to restructuring and streamlining management responsibilities to help facilitate future company direction and resulting profitability. Total Assets were $437,035 at February 29, 2008as compared to $621,006 at February 28, 2007, a net decrease of $183,791. The net decrease was primarily due to cash used for development expenses and reduction of inventory.
Plan of Operation
We continue promoting and marketing the Pipeline Posse product line, a recognized name in the world of surf and action sports. Our intent remains the manufacturing, selling and distributing of our own lines of surf wear and to promote this and other lines of goods in appropriate trade journals and other media as they are developed, expanded and distributed. Our first full length movie (surf video) – “Pipeline Posse – Project One” is now for sale in surf shops nationwide as well as available on the website: pipelineposse.com. Ads have been placed in major surf publications as well as on selected internet websites and the video trailers are available for viewing in our website video section. Private label business is beginning to return in spite of the continuing competition with aggressively marketed inexpensive overseas manufacturing. We continue to advocate the value of “Made in the USA” products and this is having some effect on new business as well as the return of previous customers. Our unique ability to respond to client needs for fast delivery also adds to our value as a domestic producer of quality goods. Should we be able to perpetuate and expand this trend we will add to our existing staff to support expansion and growth of both our private label business and entertainment business now that the writer’s strike has ended and remain cautiously optimistic on both issues.
Private Labeling
Domestic headwear suppliers have been drastically reduced as a result of increased lower pieced imports. Suppliers remaining in this business each have their own niche in the market place. Few remain in California and our customer base is increasing somewhat with this reduced competition. There are U.S. suppliers located in the Midwest and on the East Coast. They seldom manufacture for our market and deal mainly in the golf, major league baseball and ad specialty-type businesses.
Overseas suppliers are a different situation. They can produce a cap at a fraction of the price we can and we are constantly in competition with them. They can copy all that we create, but if they are asked to create on their own, they may fall short, as our industry is constantly changing by way of fabrics, styles, and method of decorating. Overseas suppliers are in the business of mass production for export. Our current customers use overseas suppliers for some of their "bread and butter" styles but tend to use U.S. suppliers for the more cutting edge products. However, overseas manufacturers require considerably more time in creating new products because of their inability to provide face-to-face contact with designers and domestic customers. They also require greater lead times for shipping and cannot make changes overnight (literally) when required. The logistics also may not allow them to be immediately aware of developing trends, forecasting them, and then developing an appropriate finished product instantly.
At present, the youth oriented "action sports" lifestyle-clothing market (surf/skate/snow) is led by labels such as "Quiksilver" of Huntington Beach, California, representing in excess of $1 billion in annual sales. Also, "O'Neill Sportswear", "Rip Curl", "Lost", "Billabong", "Volcom", and numerous other Orange County, California-based clothing companies service this market and can be considered competition for our new brands. We believe that teens and young adults are looking for something new and trendy to identify with, purchase, and wear.
Although we believe we now have the experience and resources to take advantage of and fulfill the needs of this market and we have already made significant steps towards doing so, the youth, active and sports apparel industry is highly competitive, with many of our competitors having greater name recognition and resources than we do. Many of our competitors are well established, have longer-standing relationships with customers and suppliers, greater name recognition and greater financial, technical and marketing resources. As a result, these competitors may be able to respond more quickly and effectively than we can to new or changing opportunities or customer requirements. Existing or future competitors may develop or offer products that provide price, service, number or other advantages over those we intend to offer. If we fail to compete successfully against current or future competitors with respect to these or other factors, our business, financial condition, and results of operations may be materially and adversely affected.
We currently have no market share data available for competition in these areas. We work on each job through personal contacts and are frequently the only company contacted for the particular project.
We do not depend on any one or a few major customers.
Patents, Trademarks, Franchises, Concessions, Royalty Agreements, or Labor Contracts
We recently applied to the USTPO for the trademark “Pipeline Posse” in several categories. Each of our applications is active and currently under review for approval by the USPTO examiners We will continue to assess the need for any copyright, trademark or patent applications on an ongoing basis.
Film Wardrobe & Entertainment Related Business
Film wardrobe and related business remains slow as productions continue to be produced outside the United States. This holds true for nearly all of the major studios as well as independent filmmakers, causing the majority of the local costume houses to downsize.
To counter this trend and help regain our lost dollar volume in this area we will continue our existing strategy of marketing directly to movie and television productions before they begin filming locally and send units out of town on location. Our strategy of dealing directly with producers, wardrobe personnel, and talent is beginning to pay off with recent orders from major films such as “Superman Returns” and the recently released “American Gangster” starring Denzel Washington and Russell Crowe.
Corporate Sales
While corporate clients currently account for less than fifteen percent (15%) of our business, we continue to focus on growing this area of our business over the next year with the addition of in-house salespeople. Also, the addition of new silk screening equipment has given us the capability to accept and produce large orders of promotional t-shirts and related items for corporate programs through outside sales and advertising organizations. Our salespeople are now attempting to solicit business to our existing client base via telephone and Internet as well as to potential new customers through the same means as well as through print advertising via mailing and placement in trade publications. We are committed to making this new division profitable and more qualified labor has been retained to operate the new equipment as needed. Second and third manufacturing shifts can be added as growth requires. We have assigned two in-house clerical persons to service new inquiries and added accounts, as well as order finished goods for embellishment and shipping. Current production capacity is adequate to handle the anticipated increased volume. No other major capital expenditures are anticipated at this time.
Development of new Product Lines
We have identified and developed an opportunity to export the California life style to the rest of America and to the worldwide markets in general. Started as an idea born in San Clemente, California, home of the premier surfing beaches in the world, we have created a number of California Driven brands of products.
Under the California Driven umbrella, several lines are being developed with specific target markets in mind. Currently, several California Driven products are being developed by us but they do not represent any significant amount of our current overall revenue. The California Driven brand lines are being developed as an expansion into our own line of products to market and sell.
The first identified brand line is Pipeline Posse™. Three trademarks have been applied for and are under active review for approval by the USPTO. We have completed initial design of a line of surf wear under the Pipeline Posse™ logo and have manufactured lifestyle oriented goods to begin a sales and marketing campaign. The exclusive rights for Pipeline Posse™ were acquired on August 15, 2005 from Braden Dias of Hawaii. Mr. Dias is a world renowned surfer and is under agreement with us to represent Pipeline Posse as a professional athlete in the development of Surf and Sportswear lines. In addition to Mr. Dias, several additional professional Hawaiian surfers are currently under agreement to represent the project and 3 support people have been hired, both in Hawaii and California. Clothing design is being aggressively developed by both in-house personnel and professional independent contractors experienced in product development for the Action Sports Industry.
Contact with our target market has been initially established in several major surf publications through personal interviews with our athletes as well as editorials on The Pipeline Posse itself. Print and on-line advertising campaigns have commenced in both industry related magazines and websites. We have also published and activated PIPELINEPOSSE.COM, our website which features up to date information on the athletes, activities, photo and video galleries, an active news blog, related action sports links, and a fully developed online store. The secure site and shopping capability has been recently activated to accept credit cards and offer shipment of merchandise worldwide. A multi- faceted major advertising and marketing campaign is being budgeted and developed for 2008 and professional sales organizations are being interviewed and considered for representation and distribution of the brand both domestically and worldwide.
Additional Action Sport related brands are being considered and are in various stages of development in regard to trademarks, competition, market potential, and strategy and cost. Target dates for launch have not been yet established.
This Form 10-QSB includes forward looking statements concerning the future operations of the Company. This statement is for the express purpose of availing the Company of the protections of such safe harbor with respect to all forward looking statements contained in this Form 10-QSB. We have used forward looking statements to discuss future plans and strategies of the Company. Management's ability to predict results or the effect of future plans is inherently uncertain. Factors that could affect results include, without limitation, competitive factors, general economic conditions, customer relations, relationships with vendors, the interest rate environment, governmental regulation and supervision, seasonality, distribution networks, product introductions, acceptance, technological change, changes in industry practices and one-time events. These factors should be considered when evaluating the forward looking statements and undue reliance should not be placed on such statements. Should any one or more of these risks or uncertainties materialize, or should any underlying assumptions prove incorrect, actual results may vary materially from those described herein.
Critical Accounting Policies
Sew Cal’s financial statements and related public financial information are based on the application of accounting principles generally accepted in the United States ("GAAP"). GAAP requires the use of estimates; assumptions, judgments and subjective interpretations of accounting principles that have an impact on the assets, liabilities, revenue and expense amounts reported. These estimates can also affect supplemental information contained in our external disclosures including information regarding contingencies, risk and financial condition. We believe our use if estimates and underlying accounting assumptions adhere to GAAP and are consistently and conservatively applied. We base our estimates on historical experience and on various other assumptions that we believe to be reasonable under the circumstances. Actual results may differ materially from these estimates under different assumptions or conditions. We continue to monitor significant estimates made during the preparation of our financial statements.
Our significant accounting policies are summarized in Note 1 of our financial statements. While all these significant accounting policies impact its financial condition and results of operations, Sew Cal's views certain of these policies as critical. Policies determined to be critical are those policies that have the most significant impact on Sew Cal's consolidated financial statements and require management to use a greater degree of judgment and estimates. Actual results may differ from those estimates. Our management believes that given current facts and circumstances, it is unlikely that applying any other reasonable judgments or estimate methodologies would cause effect on our consolidated results of operations, financial position or liquidity for the periods presented in this report. During the next twelve months, we expect to take the following steps in connection with the further development of our business and the implementation of our plan of operations:
Item 3. Controls and Procedures
Our management, under the supervision and with the participation of our Chief Executive Officer (“CEO”) and Chief Financial Officer (“CFO”), has evaluated the effectiveness of our disclosure controls and procedures as defined in Securities and Exchange Commission (“SEC”) Rule 13a-15(e) and 15d-15(e) as of the end of the period covered by this report. Based upon that evaluation, management has concluded that our disclosure controls and procedures are effective to ensure that information we are required to disclose in reports that we file or submit under the Securities Exchange Act is communicated to management, including the CEO and CFO, as appropriate to allow timely decisions regarding required disclosure and is recorded, processed, summarized and reported within the time periods specified in the SEC’s rules and forms.
There were no changes (including corrective actions with regard to significant deficiencies or material weaknesses) in our internal controls overfinancial reporting that occurred during the second quarter 2007-2008 that has materially affected, or is reasonably likely to materially affect, our internal control over financial reporting.
ITEM 1. LEGAL PROCEEDINGS
Naranjo v. Sew Cal Logo Inc., California Case No. BC368353
In March, 2007 Mr. Naranjo filed a purported class action suit against Sew Cal asserting wages due and violations of various sections of the California Labor Code relating to his purported tenure with the company. Sew Cal denies all allegations in the complaint and intends to defend the suit accordingly.
ITEM 2. CHANGES IN SECURITIES
ITEM 3. DEFAULTS UPON SENIOR SECURITIES
ITEM 4. SUBMISSION OF MATTERS TO A VOTE OF SECURITY HOLDERS
(a) EXHIBITS
| 31.1 | Certification of the Chief Executive Officer Pursuant to Section 302 of the Sarbanes-Oxley Act | |
| 31.2 | Certification of the Chief Financial Officer Pursuant to Section 302 of the Sarbanes-Oxley Act | |
| 32.1 | Certification of the Chief Executive Officer Pursuant to Section 906 of the Sarbanes-Oxley Act | |
| 32.2 | Certification of the Chief Financial Officer Pursuant to Section 906 of the Sarbanes-Oxley Act |
(b) REPORTS ON FORM 8-K
SIGNATURES
Pursuant to the requirements of Section 13 or 15(d) of the Securities Exchange Act of 1934, the Registrant has duly caused this report to be signed on its behalf by the undersigned, thereunto duly authorized.
| Date: April 7, 2008 | By: | /s/ Richard Songer | |
| Richard Songer | |||
| President, Director and Chie | |||
| Executive Officer | |||
| By: | /s/ Judy Songer | ||
| Judy Songer | |||
| Director and Chief | |||
| Financial Officer |