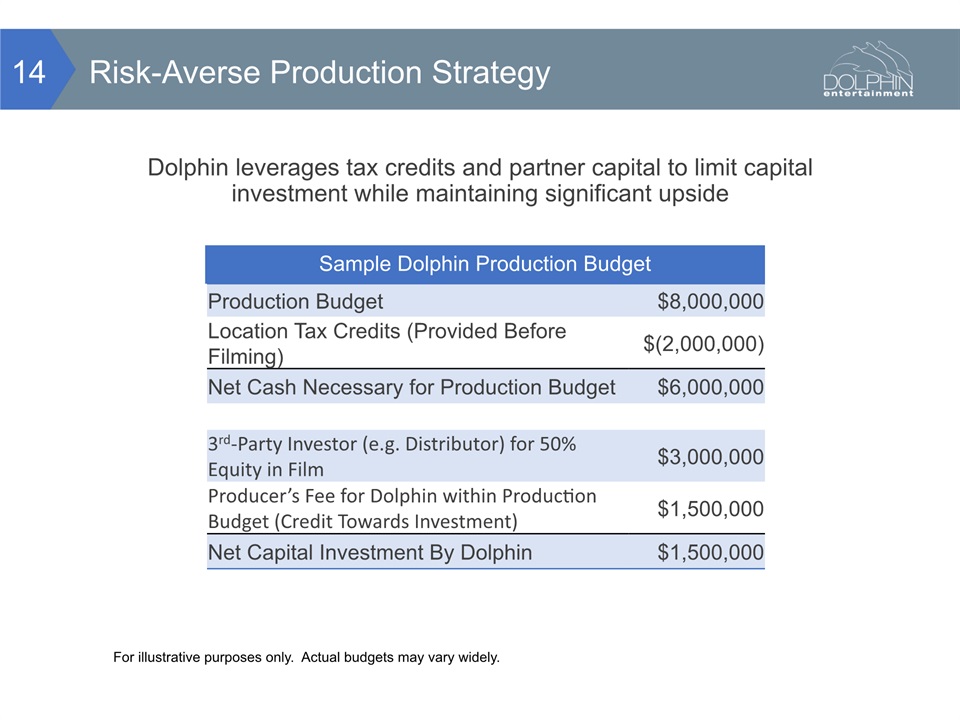
Sample Film Revenue Waterfall (1) Other revenue streams include US home video, Video on Demand, Pay-per-view, electronic sell-through, pay TV, subscription video on demand, Network/Free TV (Basic Cable, etc.). (2) Total Distribution costs include the distributor's fee, US home video costs and residuals.(3) Assumes that $6MM of cash will be needed for the production of the film., net of incentive tax credits and international sales.(4) Average of Wide-Release, PG/PG-13 Films by Independent Distributors between 2012-2016(5) For illustrative purposes only. Actual budgets may vary widely. Fixed production risk per film of $6M (*With $3M provided by Producer)Controlled budgets allow for strong ROI at average box office resultsCommercial properties with strong marketing hooks will maximize 42West PR and marketing capabilities, providing opportunities for “hit” outcomes *Values in Thousands (000) AVERAGE(4) US Box Office $25,000 $30,000 $34,000 $40,000 $45,000 $50,000 $75,000 $100,000 Gross Theatrical Revenue 10,750 13,200 15,300 18,000 20,700 23,000 36,000 48,500 All Other Revenue(1) 24,500 28,825 32,235 37,875 41,975 45,975 63,125 79,625 Gross Distributor Revenue 35,250 42,025 47,535 55,875 62,675 68,975 99,125 128,125 Total distribution costs(2) (10,384) (12,285) (13,848) (16,284) (18,183) (20,021) (28,622) (36,999) Prints & advertising (P&A) Costs (20,000) (20,000) (20,000) (20,000) (20,000) (20,000) (20,000) (20,000) Interest on P&A costs (2,000) (2,000) (2,000) (2,000) (2,000) (2,000) (2,000) (2,000) Gross Producer Revenue 2,866 7,740 11,687 17,591 22,492 26,954 48,503 69,126 Recoupment of equity investment(3) (3,134) (6,000) (6,000) (6,000) (6,000) (6,000) (6,000) (6,000) Interest on equity investment - (600) (600) (600) (600) (600) (600) (600) Gross Profits - 1,140 5,087 10,991 15,892 20,354 41,903 62,526 Other profit participants (50%) - (570) (2,544) (5,496) (7,946) (10,177) (20,952) (31,263) PRODUCER PROFITS (50%) 570 2,544 5,496 7,946 10,177 20,952 31,263 Indicative Potential Payout Scenarios for Producers