Table of Contents
UNITED STATES
SECURITIES AND EXCHANGE COMMISSION
Washington, D.C. 20549
FORM 10-K
| x | ANNUAL REPORT PURSUANT TO SECTION 13 OR 15(d) OF THE SECURITIES EXCHANGE ACT OF 1934 |
For the fiscal year ended December 31, 2008
OR
| ¨ | TRANSITION REPORT PURSUANT TO SECTION 13 OR 15(d) OF THE SECURITIES EXCHANGE ACT OF 1934 |
For the transition period from to
Commission file number 000-50795

(Exact name of registrant as specified in its charter)
| Delaware | 75-2770432 | |
| (State of other jurisdiction of | (I.R.S. Employer | |
| incorporation or organization) | Identification No.) | |
| 4450 Sojourn Drive, Suite 500 | ||
| Addison, Texas | 75001 | |
| (Address of principal executive offices) | (Zip Code) | |
(972) 728-6300
(Registrant’s telephone number, including area code)
Securities registered pursuant to Section 12(b) of the Act:
Title of Each Class | Name of Each Exchange on Which Registered | |
| Common stock, $0.01 par value per share | The NASDAQ Stock Market LLC |
Securities registered pursuant to Section 12(g) of the Act:
None
Indicate by check mark if the registrant is a well-known seasoned issuer, as defined in Rule 405 of the Securities Act: Yes ¨ No x
Indicate by check mark if the registrant is not required to file reports pursuant to Section 13 or Section 15(d) of the Act: Yes ¨ No x
Indicate by check mark whether the registrant (1) has filed all reports required to be filed by Section 13 or 15(d) of the Securities Exchange Act of 1934 during the preceding 12 months (or for such shorter period that the registrant was required to file such reports), and (2) has been subject to such filing requirements for the past 90 days. Yes x No ¨
Indicate by check mark if disclosure of delinquent filers pursuant to Item 405 of Regulation S-K is not contained herein, and will not be contained, to the best of registrant’s knowledge, in definitive proxy or information statements incorporated by reference in Part III of this Form 10-K or any amendment to this Form 10-K. ¨
Indicate by check mark if the registrant is a large accelerated filer, an accelerated filer, a non-accelerated filer, or a smaller reporting company. See definition of “accelerated filer, large accelerated filer and smaller reporting company “ in Rule 12b-2 of the Exchange Act.
Large Accelerated Filer ¨ Accelerated Filer x Non-Accelerated Filer ¨ Smaller Reporting Company ¨
Indicated by check mark whether the registrant is a shell company (as defined in Rule 12b-2 of the Exchange Act: Yes ¨ No x
The aggregate market value of the voting and non-voting common equity held by non-affiliates of the registrant as of the most recently completed second fiscal quarter (June 30, 2008), based on the price at which the common equity was last sold on such date ($6.80): $55,111,933.
Indicate the number of shares outstanding of each of the issuer’s classes of common stock, as of the latest practicable date: the number of shares outstanding of the registrant’s common stock, $.01 par value, as of March 31, 2009 was 15,415,358.
DOCUMENTS INCORPORATED BY REFERENCE
Certain information called for by Part III of this Form 10-K is incorporated by reference to certain sections of the Proxy Statement for the 2009 Annual Meeting of our stockholders, which will be filed with the Securities and Exchange Commission no later than 120 days from December 31, 2008.
Table of Contents
AFFIRMATIVE INSURANCE HOLDINGS, INC.
YEAR ENDED DECEMBER 31, 2008
INDEX TO FORM 10-K
2
Table of Contents
PART I
| Item 1. | BUSINESS |
Affirmative Insurance Holdings, Inc., formerly known as Instant Insurance Holdings, Inc., was incorporated in Delaware in June 1998 and completed an initial public offering of its common stock in July 2004. In this report, the terms “Affirmative,” “the Company,” “we,” “us” or “our” mean Affirmative Insurance Holdings, Inc. and all entities included in our consolidated financial statements. We are a distributor and producer of non-standard personal automobile insurance policies and related products and services for individual consumers in targeted geographic markets. Non-standard personal automobile insurance policies provide coverage to drivers who find it difficult to obtain insurance from standard automobile insurance companies due to their lack of prior insurance, age, driving record, limited financial resources or other factors. Non-standard personal automobile insurance policies generally require higher premiums than standard automobile insurance policies for comparable coverage.
As of December 31, 2008, our subsidiaries included insurance companies licensed to write policies in 40 states, underwriting agencies, and retail agencies with 219 owned stores and 33 operating franchise retail store locations and relationships with two unaffiliated underwriting agencies. We are currently active in offering insurance directly to individual consumers through retail stores in 10 states (Louisiana, Texas, Illinois, Alabama, Florida, Missouri, Indiana, South Carolina, Kansas and Wisconsin) including our franchised stores in Florida and distributing our own insurance policies through 8,000 independent agents or brokers in 10 states (Louisiana, Texas, Illinois, California, Michigan, Florida, Missouri, Indiana, South Carolina and New Mexico).
On January 31, 2007, we completed the acquisition of USAgencies L.L.C. (USAgencies), a non-standard automobile insurance distributor and provider headquartered in Baton Rouge, Louisiana, in a fully-financed all cash transaction valued at approximately $199.1 million. At the time of acquisition, USAgencies had two insurance companies, 91 operating retail sales locations in Louisiana, Illinois and Alabama selling its products directly to consumers through its owned retail stores, virtual call center and internet site and a premium finance company. The acquisition gives us a leading market position in Louisiana, the twelfth largest non-standard automobile insurance market. The transaction was effective as of January 1, 2007.
Our Operating Structure
We believe that the delivery of non-standard personal automobile insurance policies to individual consumers requires the interaction of three basic operations, each with a specialized function:
| • | Insurance companies, which possess the regulatory authority and capital necessary to issue insurance policies; |
| • | Underwriting agencies, which supply centralized infrastructure and personnel required to design and service insurance policies that are distributed through retail agencies; and |
| • | Retail agencies, which provide multiple points of sale under established local brands with personnel licensed and trained to sell insurance policies and ancillary products to individual consumers. |
Our three operating components often function as a vertically integrated unit, capturing the premium and associated risk and the commission income and fees generated from the sale of an insurance policy. There are other instances, however, when each of our operations functions with unaffiliated entities on an unbundled basis, either independently or with one or both of the other two operations. For example, our retail stores earn commission income and fees from sales of non-standard automobile insurance policies issued by third-party insurance carriers.
We believe that our ability to enter into a variety of business relationships with third-parties allows us to maximize sales penetration and profitability through industry cycles better than if we employed a single, vertically integrated operating structure.
3
Table of Contents
Insurance Products
Our insurance company products. We issue non-standard personal automobile insurance policies through our wholly-owned insurance company subsidiaries. At December 31, 2008, our insurance companies were licensed to write business in 40 states, although we primarily wrote business during 2008 in 10 states. Our insurance companies possess the certificates of authority and capital necessary to transact insurance business and issue policies, but they rely on both our underwriting agencies and unaffiliated underwriting agencies to design, distribute and service those policies.
Our non-standard personal automobile insurance policies, which generally are issued for the minimum limits of liability coverage mandated by state laws, provide coverage to drivers who find it difficult to obtain insurance from standard insurance companies due to a number of factors, including lack of prior coverage, failure to maintain continuous coverage, age, prior accidents, driving violations, type of vehicle or limited financial resources. We believe that the majority of customers who purchase our non-standard personal automobile insurance policies do not qualify for standard policies because of financial reasons, such as the failure to maintain continuous coverage or the lack of flexible payment options in the standard market. Over 70% of the drivers who purchased our policies in 2008 had no at-fault accidents, moving violations or tickets in the 36 months preceding the date of the quote. In general, customers in the non-standard market have higher average premiums for a comparable amount of coverage than customers who qualify for the standard market resulting from increased loss costs and transaction expenses, partially offset by the lower severity of losses resulting from lower limits of coverage.
We offer a wide range of coverage options to meet our policyholders’ needs. We offer both liability-only policies, as well as full coverage policies, which include first-party coverage for the insured’s vehicle. Our liability-only policies generally include:
| • | Bodily injury liability coverage, which protects insureds if they are involved in accidents that cause bodily injury to others, and also provides them with a defense if others sue for covered damages; and |
| • | Property damage liability coverage, which protects insureds if they are involved in accidents that cause damage to another’s property. |
The liability-only policies may also include personal injury protection coverage and/or medical payment coverage, depending on state statutes. These policies provide coverage for injuries without regard to fault, as well as uninsured/underinsured motorist coverage.
In addition to our liability-only coverage, the full coverage policies we sell include:
| • | Collision coverage, which pays for damage to the insured vehicle as a result of a collision with another vehicle or object, regardless of fault; and |
| • | Comprehensive coverage, which pays for damages to the insured vehicle as a result of causes other than collision, such as theft, hail and vandalism. |
Full coverage policies may also include optional coverages such as towing, rental reimbursement and special equipment.
Our policies are designed to be priced to allow us to achieve our targeted underwriting margin while at the same time meeting our customers’ needs for low down payments and flexible payment plans. We offer a variety of policy terms ranging from one month to one year. Our policy processing systems and payment plans enable us to offer a variety of payment plans while minimizing the potential credit risk of uncollectible premiums. We offer discounts for such items as proof of having purchased automobile insurance within a prescribed prior time period, maintaining homeowners’ insurance, or owning a vehicle with safety features or anti-theft equipment. We also surcharge the customer for traffic violations and accidents, among other things.
4
Table of Contents
Third-party non-standard personal automobile insurance policies. With the exception of stores located in Louisiana and Alabama, our owned retail stores also sell non-standard personal automobile insurance policies issued by third-party insurance companies for which we receive commission income and fees. We do not bear insurance underwriting risk with respect to these policies. Our retail stores offer these insurance policies underwritten by third-party insurance companies in addition to our own insurance policies primarily to provide a range of products and pricing to meet our customers’ needs, which we believe increases our chances of making a sale. Additionally, should sales of our policies decline in favor of lower-priced non-standard personal automobile insurance products offered by the third-party insurance carriers, we believe that our ability to generate increased commission and fee revenue from sales of third-party insurance policies will help us preserve underwriting profitability and offset decreases in premium volume while maintaining control of our customers’ business until acceptable underwriting margins are again achievable.
Complementary insurance products.Our retail stores also sell a small amount of standard and preferred personal automobile insurance and certain other personal lines insurance products underwritten by third-party insurance companies. Our complementary insurance products are designed to appeal to purchasers of non-standard personal automobile insurance policies and currently include such products as motorcycle and recreational vehicle coverage, motor club memberships, vehicle protection, travel protection and hospital indemnity, as well as certain life, health and disability insurance policies. We offer these products to complement our core offering of non-standard personal automobile insurance policies and to take advantage of our largely fixed cost retail stores, which enables us to generate additional commission income and fees with minimal incremental cost. The insurance companies that underwrite these products bear the insurance risk associated with these policies.
Ancillary non-insurance products and services.Our retail stores may offer non-insurance products and services designed to appeal to our customers, including prepaid cellular telephones, prepaid local telephone, long distance calling card services and income tax services. We believe that these products and services will attract additional customers to our stores and will provide an additional means of generating commission income and fees with minimal incremental cost to us.
Distribution and Marketing
Most of the policies issued by our insurance company subsidiaries utilize the services of our underwriting agencies, which perform or supervise all of the administrative functions associated with the design, sale and subsequent servicing of a non-standard personal automobile insurance policy. Our underwriting agencies provide the following services, in part, in exchange for internal commission income and fees:
| • | product design and management services, including the development, pricing and market positioning of non-standard personal automobile insurance policies; |
| • | distribution services, including marketing and distribution, independent agency development and support and policy issuance; |
| • | policy administration services, including premium billing and collection, endorsement processing, accounting and financial reporting; |
| • | claims handling services, including claims settlement, adjuster auditing and special investigations; and |
| • | supervision of unaffiliated underwriting agencies, including oversight of each unaffiliated underwriting agency’s underwriting, policy administration, claims handling and related operations. |
Our insurance company subsidiaries also issue insurance policies that are designed, distributed and serviced by unaffiliated underwriting agencies. We issue insurance policies sold through unaffiliated underwriting agencies with established customer bases in order to capture business in markets other than those targeted by our own underwriting agencies. In these instances, we collect fees to compensate us both for the use of our certificates of authority to transact insurance business in selected markets as well as for assuming the risk that the unaffiliated underwriting agency will continuously and effectively administer these policies.
5
Table of Contents
As of December 31, 2008, two unaffiliated underwriting agencies in California that distributed policies through an aggregate of approximately 4,100 independent agencies, produced business for our insurance company subsidiaries. For the years ended December 31, 2008 and 2007, these two unaffiliated underwriting agencies produced $30.4 million and $39.0 million of gross premiums written by our insurance company subsidiaries, respectively.
Our owned retail stores. Our retail stores serve as direct sales and customer service outlets for insurance companies and other vendors. As of December 31, 2008, we employed approximately 455 licensed sales personnel who sell products and services directly to individual consumers through our 219 owned retail stores. In addition, we distribute products through 33 franchised retail stores located in Florida. In contrast to the traditional state-by-state marketing approach that is a common practice in our industry, we have established the designated market area (DMA) as the fundamental market focus in our retail operations. As of December 31, 2008, our retail stores were located in 23 DMAs in 10 states.
The following charts list the geographic locations of our owned retail stores by DMA and by state as of December 31, 2008:
DMA | Retail Stores | State | Retail Stores | |||
Chicago | 61 | Illinois | 65 | |||
Dallas/Fort Worth | 21 | Texas | 46 | |||
Houston | 12 | Louisiana | 44 | |||
Miami / Ft. Lauderdale | 9 | Alabama | 17 | |||
San Antonio | 7 | Florida | 17 | |||
Kansas City | 6 | South Carolina | 11 | |||
Orlando | 6 | Missouri | 10 | |||
St. Louis | 4 | Indiana | 6 | |||
Baton Rouge | 4 | Kansas | 2 | |||
Other | 89 | Wisconsin | 1 | |||
Total | 219 | Total | 219 | |||
We operate our retail stores under six names — A-Affordable, Driver’s Choice, Fed USA, InsureOne, USAgencies and Yellow Key — that are well established in their respective DMAs. We extend market awareness through, among other things, yellow pages advertisements, television and radio advertising campaigns and print advertisements that emphasize our down payments, flexible payment plans, convenient neighborhood locations and customer service, all of which are designed to generate walk-in traffic, or telephone inquiries to our retail stores. Since our retail business is highly dependent on advertising, segmenting our geographic markets into DMAs allows us to more efficiently concentrate these advertising and marketing support activities.
We lease retail stores located in strip malls or other visible locations on major thoroughfares where we believe our customers drive or live. Our retail stores provide customer contact at the point of sale and most policy applications are completed in the retail stores. After completion of the initial insurance transaction, our customers often revisit these stores to make premium payments. This direct contact gives us an opportunity to establish a personal relationship with our customers, who in our experience generally prefer face-to-face interaction, and helps us provide quality and efficient service and identify opportunities to provide additional products and services.
Independent agencies. Our underwriting agencies also appoint independent retail agencies to sell our insurance company subsidiaries’ policies to individual customers. We believe that selling our insurance company subsidiaries’ policies through the independent agency distribution channel, in addition to selling through our owned retail stores, helps us to better leverage our resources to maximize sales of our insurance company subsidiaries’ policies when underwriting conditions are favorable. In 2008, our underwriting agencies utilized approximately 3,900 independent agencies to sell the policies that they administer and these independent
6
Table of Contents
agencies were responsible for 31.3% of the gross written premiums produced by our underwriting agencies. In 2008, no independent agency accounted for more than 3% of the gross premiums written by our underwriting agencies and only one independent agent accounted for more than 1% of the gross premiums written. The ability of our underwriting agencies to develop strong and mutually beneficial relationships with independent agencies is important to the success of our multiple distribution strategy. We believe that strong product positioning and high service standards are key to independent agency loyalty. We foster our independent agency relationships by providing them our agency interface software applications designed to strengthen and expand their sales and service capabilities for our products. These software applications provide independent agencies with the ability to service their customers’ accounts and access their own commission information. We maintain strict and high standards for call answering and abandonment rate service levels in our customer service call centers. We believe the level and array of services that we offer to independent agencies creates value in their businesses.
Our underwriting agencies’ centralized marketing department is responsible for managing our relationships with independent agencies. This department is split into two key areas, promotion and service. The promotion function includes prospecting and establishing independent agency relationships, initial contracting and appointment of independent agencies, establishing initial independent agency production goals and implementing market penetration strategies. The service function includes training independent agencies to sell our products and supporting their sales efforts, ongoing monitoring of independent agency performance to ensure compliance with our production and profitability standards and paying independent agency commissions.
Pricing and Product Management
We believe that our insurance product management approach to risk analysis and segmentation is a driving factor in maximizing underwriting performance. We employ an insurance product management approach that requires the extensive involvement of product managers who are responsible for the profitability of a specific state or region, with the direct oversight of rate-level structure by our most senior managers. Our product managers are experienced insurance professionals with backgrounds in the major functional areas of the insurance business — accounting, actuarial, claims, information technology, operations, pricing, product development and underwriting. In addition to broad insurance industry knowledge, all our product managers have extensive experience in the non-standard personal automobile insurance market, enabling them to develop products to meet the distinctive needs of non-standard customers.
Our product managers work with our actuaries who provide them with profitability and rate assessments. These actuarial evaluations are combined with economic and business modeling information and competitive intelligence monitored by our product managers to be proactive in making appropriate revisions and enhancements to our rate levels, product structures and underwriting guidelines. As part of our pricing and product management process, pricing and underwriting guidelines and policy attributes are developed by our product managers for each of the products that we administer and products underwritten by our insurance companies through underwriting agencies. These metrics are monitored on a weekly, monthly and quarterly basis to determine if there are deviations from expected results for each product. Based on the review of these metrics, our product managers make revisions and enhancements to products to assure that our underwriting profit targets are being attained.
We believe that the analysis of competitive intelligence is a critical element of understanding the performance of our products and our position in markets. Although we put more weight on our own product experience and performance data, we gain insights into our markets, our customers, our agents and trends in the business by monitoring changes made by our competitors. We routinely analyze changes made by competitors to understand the rate and product adjustments they are making, and we routinely compare and rank our rates against those of our competitors to understand our market position.
Premium Finance
We believe that the amount of down payment and the availability of flexible payment plans are two of the primary factors that our customers consider when purchasing non-standard personal automobile insurance. Down
7
Table of Contents
payments and payment plans typically are offered by insurers and agents in the form of either installment billing or premium financing arrangements. Premium finance involves making a loan to the customer that is backed by the unearned portion of the insurance premiums being financed. We offer our customers a variety of payment plans that allow for low down payments. Insurers typically use installment billing arrangements to bill for the premium of a single policy. Independent agents, who may offer policies from multiple insurers, use premium financing to finance multiple policies through one premium finance agreement.
Historically, we elected to use installment billing arrangements rather than premium financing. However, USAgencies’ practice has been to use premium financing for their customers. In December 2007, we began using premium financing in one of our markets for third-party insurance company policies only. During the first quarter of 2008, we provided a premium finance option for all of our customers of third-party insurance company policies. The option to premium finance offers several advantages, including:
| • | the ability to finance multiple policies through a single premium finance agreement; |
| • | a greater flexibility of payment plan structure and down payment; |
| • | a more defined regulatory framework for financing premiums; |
| • | the ability to generate revenues in our non-insurance subsidiaries; and |
| • | returns comparable to or exceeding those of installment billing. |
In a typical premium finance arrangement, the premium finance company lends the amount of the premium (minus the insured’s down payment) to the insured and pays it to the insurance company on behalf of the insured. The insured makes periodic payments to the premium finance company over the term of the finance agreement. Payment plans and down payments are developed by giving consideration to expected default rates and their timing and the amount of the unearned portion of the insurance premiums being financed, since that provides security for the loan.
If an insurance policy is cancelled before its term expires, the policyholder has the right to receive a return of the unearned premium. However, under a premium finance agreement, the policyholder assigns this right to the premium finance company to secure his or her obligations under the loan. If the policyholder defaults on a payment and after being notified of the default, fails to cure the default within the prescribed time period, the premium finance company has the right to order the insurance company to cancel the policy and pay to the premium finance company the amount of any unearned premium on the policy. If the amount of unearned premium exceeds the balance due on the loan plus any interest and applicable fees owed by the policyholder to the premium finance company, then the premium finance company returns the excess amount to the policyholder in accordance with applicable law.
The regulatory framework under which premium finance procedures are established is generally set forth in the premium finance statutes of the states in which we operate. Among other restrictions, the interest rate we may charge our customers for financing their premiums is limited by these state statutes. See “Regulatory Environment — Premium Finance Regulation” for additional information about state usury and other regulatory restrictions applicable to our premium finance operations.
We mitigate the risk to us of potential losses from the insured’s default under the premium finance agreement by designing payment plans that give consideration to the principal amount of the loan that is outstanding and the unearned premium securing the loan. In addition, whenever a policyholder fails to timely cure a default on his or her premium finance loan, we act promptly to order the insurance company to cancel the insurance policy and return to us any unearned premium.
Claims Management
We believe that effective claims management is critical to our success. We have adopted a metrics-driven and customer-focused claims management process that is cost efficient, delivers the appropriate claims service
8
Table of Contents
and produces superior claims results. Our claims management process is focused on controlling claims from their inception, accelerating communication to insureds and claimants, and compressing the cycle time of claims to control both loss costs and claims handling costs. We believe our process provides the appropriate level of customer service and results in the appropriate handling of claims, allowing us to cost-effectively pay valid claims and contest fraudulent claims.
We conduct our claims management operations out of four regional claims centers that are responsible for handling claims in their region. Our national claims practices group manages certain claims management functions, such as litigation management, total loss, salvage, subrogation and audit, on a national basis, which we believe produces greater efficiencies than can be achieved at the regional or local levels.
Claims are handled directly by our employees for the insurance policies we administer and our staff oversees the claims handling on the programs underwritten by our insurance companies through unaffiliated underwriting agencies. Whether through direct claims management or in standards established for claims management operations subject to our oversight, we are focused on implementing uniform “best practices” claims management processes that are regularly measured and audited.
Each claims center maintains a fully-staffed field operations team, which we believe allows us to control loss severity while improving customer service by shortening the time it takes to complete vehicle repairs. Through the utilization of well-trained field appraisal and reinspection personnel, we are able to maintain tighter control of the vehicle repair process, thereby reducing the amount we pay for repairs, storage costs and auto rental costs. In addition to field appraisals and reinspections, we audit vehicle damage appraisals through the use of industry-recognized vehicle damage appraisal software programs.
All of our claims employees have been trained to handle claims according to our metrics-driven and customer-focused claims management process, and all are subject to audit by our national quality assurance team as well as being measured against specific performance metric standards. We systematically conduct continuing education for our claims staff in the areas of best practices and claims metrics, fraud awareness, changes in legislation and litigation management. All our claims employees, whether or not they have prior claims experience or other qualifications, such as auto body or mechanical repair experience for field adjusters, are trained to handle claims according to our claims management processes.
Our national quality assurance team, a team of three full-time auditors reporting directly to our chief claims officer, continually reviews claims files, assessing each of our claims employees and particular units or teams against specific performance metric standards, evaluating the performance in investigations, file documentation, reasonableness of settlements and other relevant areas. This team, along with members of our senior claims management team, establishes standards for and audits the practices of the claims management operations of the unaffiliated underwriting agencies producing business for our insurance companies.
Our claims management process is designed to handle legitimate claims efficiently while defending against those that are without merit or that are fraudulent. Potentially fraudulent claims are identified through our fraud awareness program, which is designed to educate our claims employees and others throughout the organization of fraud indicators. Potentially fraudulent claims are referred to our special investigation unit, where suspicious claims are investigated and fraudulent claims are contested. As part of this strategy, we have aligned ourselves with a key industry vendor, who provides us with software that delivers data on injuries sustained in motor vehicle collisions. This tool is important in helping us identify potentially exaggerated injury claims and achieve what we believe are more appropriate settlements.
We maintain specialized liability teams that are responsible for overseeing all injury-related losses. The experienced adjusters on these teams focus on quality file handling, primarily through ongoing emphasis on proper investigations, evaluations and negotiating skills. In addition to maintaining highly trained staff, our management remains involved in the day-to-day handling of these files, providing appropriate settlement
9
Table of Contents
authority to adjusters, maintaining several key tracking reports and hosting a weekly claims committee meeting. In our claims committee meetings, the key managers of each regional office make presentations regarding potentially large-value cases, denials, coverage issues and other cases warranting review. In addition, claims, legal and underwriting personnel at the management level attend these meetings in order to monitor these cases and provide input from their specific areas of expertise.
We allow claims to go to litigation in matters such as value disputes and questionable liability and we defend appropriate denials of coverage. We generally retain outside defense counsel to litigate such matters. We negotiate fee arrangements with retained defense counsel that are aimed at limiting our litigation costs. We have built a limited staff counsel operation for those areas in which there is a sufficient volume of claims to make staff counsel economical. Whether using outside defense counsel or staff counsel, our claims professionals manage the litigation process rather than ceding control to an attorney. Cases are constantly reviewed to adjust the litigation plan if necessary, and all cases going to trial are reviewed in committee to assess the value of trial or settlement.
Losses and Loss Adjustment Expenses
Automobile accidents generally result in insurance companies paying settlements resulting from physical damage to an automobile or other property and injury to a person. Because our insureds and claimants typically notify us within a short time frame after an accident has occurred, our ultimate liability for losses and loss adjustment expenses on our policies generally emerges in a relatively short period of time. In some cases, however, the period of time between the occurrence of an insured event and the final settlement of a claim may be several months or years, and during this period it often becomes necessary to adjust the loss reserve estimates either upward or downward.
We record loss reserves to cover our estimated ultimate liability for reported and incurred but not reported losses under insurance policies that we write and for losses and loss adjustment expenses relating to the investigation and settlement of claims. We estimate liabilities for the cost of losses and loss adjustment expenses for both reported and unreported claims based on historical trends adjusted for changes in loss costs, underwriting standards, policy provisions and other factors. Estimating the liability for unpaid losses and loss adjustment expenses is inherently a matter of judgment and is influenced by factors that are subject to significant variation. We monitor items such as the effect of inflation on medical, hospitalization, material repair and replacement costs, general economic trends and the legal environment. While the ultimate liability may be higher or lower than recorded loss reserves, the loss reserves for personal auto coverage can be established with a greater degree of certainty in a shorter period of time than that associated with many other property and casualty coverages which, due to the nature of the coverage being provided, take a longer period of time to establish a similar level of certainty.
Reinsurance
We may selectively utilize the reinsurance markets to increase our underwriting capacity and to reduce our exposure to losses. Reinsurance refers to an arrangement in which a reinsurer agrees in a contract to assume specified risks written by an insurance company, commonly referred to as the “ceding” company, by paying the insurance company all or a portion of the insurance company’s losses arising under specified classes of insurance policies. Generally, we cede premium and losses to reinsurers under quota-share reinsurance arrangements, pursuant to which our reinsurers agree to assume a specified percentage of our losses in exchange for a corresponding portion of the policy premiums we receive.
Although our reinsurers are liable for loss to the extent of the coverage they assume, our reinsurance contracts do not discharge our insurance company subsidiaries from primary liability for the full amount of policies issued. In order to mitigate the credit risk of reinsurance companies, we select financially strong reinsurers with an A.M. Best rating of “A-” or better and continue to evaluate their financial condition.
10
Table of Contents
Competition
The non-standard personal automobile insurance business is highly competitive and, except for regulatory considerations, there are relatively few barriers to entry. We compete based on factors such as the convenience of retail store locations, price, coverages offered, availability of flexible down payment arrangements and billing plans, customer service, claims handling and agent commission. We compete with other insurance companies that sell non-standard personal automobile insurance policies through independent agencies as well as with insurance companies that sell such policies directly to their customers. Our retail agencies and the independent agencies that sell our insurance products compete both with these direct writers and with other independent agencies. Therefore, our competitors are not only large national insurance companies, but also smaller regional insurance companies and independent agencies that operate in a specific region or single state in which we operate. Based upon data compiled from A.M. Best, we believe that, as of December 31, 2007, the top ten insurance groups accounted for approximately 10% of the approximate $29.7 billion non-standard market segment, measured in annual direct premiums written.
The non-standard personal automobile insurance industry historically has been cyclical in nature, characterized by periods of severe price competition and excess underwriting capacity followed by periods of high premium rates and shortages of underwriting capacity. In the late 1990s, many non-standard personal automobile insurers attempted to capture more business by reducing rates. We believe that these industry-wide rate reductions, combined with increased costs per claim during the period, contributed to the deterioration of industry loss ratios in the years 1999 through 2001. We believe that in 2002 through 2004, the underwriting results in the non-standard personal automobile insurance business improved as a result of favorable pricing and competitive conditions that allowed for broad increases in rate levels by insurers, including us. In late 2004 and continuing through 2008, increased price competition and excess underwriting capacity produced a softening market. These fluctuations in the non-standard personal automobile insurance business cycle may negatively impact our profitability.
Some of our competitors have substantially greater financial and other resources and may offer a broader range of products or competing products at lower prices. In addition, existing competitors may attempt to increase market share by lowering rates and new competitors may enter this market, particularly larger insurance companies that do not presently write non-standard personal automobile insurance in our markets. As a result, we may experience a reduction in our underwriting margins or sales of our insurance policies may decrease as individuals purchase lower-priced products from other insurance companies. A loss of business to competitors offering similar insurance products at lower prices or having other competitive advantages would negatively affect our revenues and net income.
In addition to selling policies for our own insurance companies, our retail stores offer and sell non-standard personal automobile insurance policies for third-party insurance companies. As a result, our insurance companies compete with these third-party insurance companies for sales to the customers of our retail stores. If the competing insurance products offered by a third-party insurance company are priced lower or have more attractive features than the insurance policies offered by our insurance companies, customers of our retail stores may decide not to purchase insurance policies from our insurance companies and may instead purchase policies from the third-party insurance company. A loss of business by our insurance companies resulting from our retail stores selling relatively more policies of third-party insurance companies and fewer policies of our insurance companies would negatively affect our earned premiums. However, instead we would earn commission income and fees from the third-party insurance companies.
Regulatory Environment
We are subject to comprehensive regulation and supervision by government agencies in Illinois, Louisiana, Michigan and New York, the states in which our insurance company subsidiaries are domiciled, as well as in the states where our subsidiaries sell insurance products, issue policies and handle claims. Certain states impose restrictions or require prior regulatory approval of certain corporate actions, which may adversely affect our
11
Table of Contents
ability to operate, innovate, obtain necessary rate adjustments in a timely manner or grow our business profitably. These regulations provide safeguards for policy owners and are not intended to protect the interests of stockholders. Our ability to comply with these laws and regulations, and to obtain necessary regulatory action in a timely manner, is and will continue to be critical to our success.
Required licensing.We operate under licenses issued by various state insurance authorities. These licenses govern, among other things, the types of insurance coverage and agency and claim services that we may offer consumers in these states. Such licenses typically are issued only after we file an appropriate application and satisfy prescribed criteria. We must apply for and obtain the appropriate new licenses before we can implement any plan to expand into a new state or offer a new line of insurance or other new product that requires separate licensing.
Transactions between insurance companies and their affiliates. We are a holding company and are subject to regulation in the jurisdictions in which our insurance company subsidiaries conduct business. The insurance laws in those states provide that all transactions among members of an insurance holding company system must be fair and reasonable. Transactions between our insurance company subsidiaries and their affiliates generally must be disclosed to state regulators and prior regulatory approval generally is required before any material or extraordinary transaction may be consummated or any management agreement, services agreement, expense sharing arrangement or other contract providing for the rendering of services on a regular, systematic basis is entered into. State regulators may refuse to approve or delay approval of such a transaction, which may impact our ability to innovate or operate efficiently.
Regulation of insurance rates and approval of policy forms. The insurance laws of most states in which our insurance subsidiaries operate require insurance companies to file insurance rate schedules and insurance policy forms for review and approval. State insurance regulators have broad discretion in judging whether our rates are adequate, not excessive and not unfairly discriminatory and whether our policy forms comply with law. The speed at which we can change our rates depends, in part, on the method by which the applicable state’s rating laws are administered. Generally, state insurance regulators have the authority to disapprove our rates or requested changes in our rates.
Restrictions on cancellation, non-renewal or withdrawal. Many states have laws and regulations that limit an insurance company’s ability to exit or significantly reduce its writings in a market. For example, certain states limit an automobile insurance company’s ability to cancel or not renew policies. Some states prohibit an insurance company from withdrawing from one or more lines of business in the state, except pursuant to a plan approved by the state insurance department. In some states, this applies to reductions of anything greater than 50% in the amount of insurance written, not just to a complete withdrawal. The state insurance department may disapprove a plan that may lead to market disruption.
Investment restrictions. We are subject to state laws and regulations that require diversification of our investment portfolios and that limit the amount of investments in certain categories. Failure to comply with these laws and regulations would cause non-conforming investments to be treated as non-admitted assets for purposes of measuring statutory surplus and, in some instances, would require divestiture.
Capital requirements. Our insurance company subsidiaries are subject to risk-based capital standards and other minimum capital and surplus requirements imposed under applicable state laws, including the laws of their state of domicile. The risk-based capital standards, based upon the Risk-Based Capital Model Act, adopted by the National Association of Insurance Commissioners (NAIC), require our insurance company subsidiaries to report their results of risk-based capital calculations to state departments of insurance and the NAIC. Failure to meet applicable risk-based capital requirements or minimum statutory capital requirements could subject us to further examination or corrective action imposed by state regulators, including limitations on our writing of additional business, state supervision or liquidation. Any changes in existing risk-based capital requirements or minimum statutory capital requirements may require us to increase our statutory capital levels. At December 31, 2008, each of our insurance subsidiaries maintained a risk-based capital level that was in excess of an amount that would require any corrective actions on our part.
12
Table of Contents
IRIS Ratios.The NAIC Insurance Regulatory Information System (IRIS) is part of a collection of analytical tools designed to provide state insurance regulators with an integrated approach to screening and analyzing the financial condition of insurance companies operating in their respective states. IRIS is intended to assist state insurance regulators in targeting resources to those insurers in greatest need of regulatory attention. IRIS consists of two phases: statistical and analytical. In the statistical phase, the NAIC database generates key financial ratio results based on financial information obtained from insurers’ annual statutory statements. The analytical phase is a review of the annual statements, financial ratios and other automated solvency tools. The primary goal of the analytical phase is to identify companies that appear to require immediate regulatory attention. A ratio result falling outside the usual range of IRIS ratios is not considered a failing result; rather, unusual values are viewed as part of the regulatory early monitoring system. Furthermore, in some years, it may not be unusual for financially sound companies to have several ratios with results outside the usual ranges. An insurance company may fall outside of the usual range for one or more ratios because of specific transactions that are in themselves not significant. As of December 31, 2008, AIC had three ratios outside the usual ranges. Two of these ratios resulted from reductions in surplus primarily associated with the purchase of software in 2008 to run our insurance operations which is capitalized under generally accepted accounting principles, but is not admitted on a statutory basis. The other ratio outside the usual range affecting AIC and three of our other insurance subsidiaries, related to reduced investment yields for the year. Both Casualty and Direct had one ratio outside the usual range due to affiliate reinsurance assumed by AIC. In addition, the payment of extraordinary dividends by Direct in 2008 resulted in reduced policyholder surplus and caused two additional ratios to be outside the usual range. Because our insurance companies write exclusively non-standard personal automobile insurance policies, they maintain a higher than usual balance of premiums receivable compared to the overall industry. Non-standard personal automobile insurance customers often have limited financial resources and pay their premiums on monthly installments significantly more often than customers reported by the broader industry index, which includes all personal and commercial insurance customers who more often elect or are required to pay premiums up front when their policies are issued.
Regulation of dividends. We are a holding company with no business operations of our own. Consequently, our ability to pay dividends to stockholders and meet our debt payment obligations is largely dependent on dividends or other payments from our operating subsidiaries, which include our agency subsidiaries and our insurance company subsidiaries. State insurance laws restrict the ability of our insurance company subsidiaries to declare stockholder dividends. Our insurance companies may not make an “extraordinary dividend” until 30 days after the applicable commissioner of insurance has received notice of the intended dividend and has not objected in such time or the commissioner has approved the payment of the extraordinary dividend within the 30-day period. In most states, an extraordinary dividend is defined as any dividend or distribution that, together with other distributions made within the preceding 12 months, exceeds the greater of 10% of the insurance company’s surplus as of the preceding year end, or the insurance company’s net income for the preceding year, in each case determined in accordance with statutory accounting practices. In addition, dividends may only be paid from unassigned earnings and an insurance company’s remaining surplus must be both reasonable in relation to its outstanding liabilities and adequate to its financial needs.
Generally, the net admitted assets of insurance companies that, subject to other applicable insurance laws and regulations, are available for transfer to the parent company cannot include the net admitted assets required to meet the minimum statutory surplus requirements of the states where the companies are licensed.
Acquisitions of control. The acquisition of control of our insurance company subsidiaries requires the prior approval of their applicable insurance regulators. Generally, any person who directly or indirectly through one or more affiliates acquires 10% or more of the outstanding securities of an insurance company or its parent company is presumed to have acquired control of the insurance company. In addition, certain state insurance laws contain provisions that require pre-acquisition notification to state agencies of a change in control with respect to a non-domestic insurance company licensed to do business in that state. While such pre-acquisition notification statutes do not authorize the state agency to disapprove the change of control, such statutes do authorize certain remedies, including the issuance of a cease and desist order with respect to the non-domestic insurer if certain conditions exist, such as undue market concentration. Such approval requirements may deter, delay or prevent certain transactions affecting the ownership of our common stock.
13
Table of Contents
Shared or residual markets. Like other insurance companies, we are required to participate in mandatory shared market mechanisms or state pooling arrangements as a condition for maintaining our automobile insurance licenses to do business in various states. The purpose of these state-mandated arrangements is to provide insurance coverage to individuals who, because of poor driving records or other underwriting reasons, are unable to purchase such coverage voluntarily provided by private insurers. These risks can be assigned to all insurers licensed in the state and the maximum volume of such risks that any one insurance company may be assigned typically is proportional to that insurance company’s annual premium volume in that state. The underwriting results of this mandatory business traditionally have been unprofitable. The amount of premiums we might be required to assume in a given state in connection with an involuntary arrangement may be reduced because of credits we may receive for non-standard personal automobile insurance policies that we write voluntarily.
Guaranty funds. Under state insurance guaranty fund laws, insurance companies doing business in a state can be assessed for certain obligations of insolvent insurance companies to policyholders and claimants. Maximum contributions required by laws in any one year vary between 1% and 2% of annual written premiums in that state, but it is possible that caps on such contributions could be raised if there are numerous or large insolvencies. In most states, guaranty fund assessments are recoverable either through future policy surcharges or offsets to state premium tax liability.
Premium finance regulation. Our premium finance subsidiaries are regulated by governmental agencies in states in which they conduct business. The agency responsible for such regulation varies by state, but generally is the banking department or the insurance department of the applicable state. These regulations, which generally are designed to protect the interests of policyholders who elect to finance their insurance premiums, vary by jurisdiction, but, among other matters, usually involve:
| • | requiring our premium finance companies to qualify for and obtain a license and to renew the license each year; |
| • | regulating the interest rates, fees and service charges we may charge our customers; |
| • | establishing standards for filing annual financial reports of our premium finance companies; |
| • | imposing minimum capital requirements for our premium finance subsidiaries or requiring surety bonds in addition to or as an alternative to such capital requirements; |
| • | prescribing minimum notice and cure periods before we may cancel a customer’s policy for non-payment under the terms of the financing agreement; |
| • | governing the form and content of our financing agreements; |
| • | prescribing timing and notice procedures for collecting unearned premium from the insurance company, applying the unearned premium to our customer’s premium finance account, and, if applicable, returning any refund due to our customer; |
| • | conducting periodic financial and market conduct examinations and investigations of our premium finance companies and its operations; and |
| • | requiring prior notice to the regulating agency of any change of control of our premium finance companies. |
Some of these states may require our premium finance subsidiaries to maintain a specified minimum net worth, post a surety bond or deposit securities with the state regulator.
In addition, our premium finance business is subject to the federal Truth-in-Lending Act (TILA) and Regulation Z promulgated pursuant to the TILA and similar state statutes.
Privacy Regulations. The Gramm-Leach-Bliley Act protects consumers from the unauthorized dissemination of certain personal information. The majority of states have implemented additional regulations to address privacy issues. These laws and regulations apply to all financial institutions, including insurance and
14
Table of Contents
finance companies, and require us to maintain appropriate procedures for managing and protecting certain personal information of our customers and to fully disclose our privacy practices to our customers. We may also be exposed to future privacy laws and regulations, which could impose additional costs and impact our results of operations or financial condition.
Regulation of Our Ancillary Product Vendors. The vendors of the ancillary products and services we offer to our customers are also subject to various federal and state laws and regulations. The failure of any vendor to comply with such laws and regulations could affect our ability to sell the ancillary products or services of that particular vendor. However, we believe that there are adequate alternative vendors of all the material ancillary products and services sold by us.
Trade practices. The manner in which we conduct the business of insurance is regulated by state statutes in an effort to prohibit practices that constitute unfair methods of competition or unfair or deceptive acts or practices. Prohibited practices include disseminating false information or advertising; defamation; boycotting, coercion and intimidation; false statements or entries; unfair discrimination; rebating; improper tie-ins with lenders and the extension of credit; failure to maintain proper records; improper use of proprietary information; sliding, packaging or other deceptive sales conduct; failure to maintain proper complaint handling procedures; and making false statements in connection with insurance applications for the purpose of obtaining a fee, commission or other benefit. We set business conduct policies for our employees and we require them, among other things, to conduct their activities in compliance with these statutes.
Unfair claims practices. Generally, insurance companies, adjusting companies and individual claims adjusters are prohibited by state statutes from engaging in unfair claims practices on a flagrant basis or with such frequency to indicate a general business practice. Unfair claims practices include:
| • | misrepresenting pertinent facts or insurance policy provisions relating to coverages at issue; |
| • | failing to acknowledge and act reasonably promptly upon communications with respect to claims arising under insurance policies; |
| • | failing to adopt and implement reasonable standards for the prompt investigation and settlement of claims arising under its policies; |
| • | failing to affirm or deny coverage of claims within a reasonable time after proof of loss statements have been completed; |
| • | attempting to settle a claim for less than the amount to which a reasonable person would have believed such person was entitled; |
| • | attempting to settle claims on the basis of an application that was altered without notice to or knowledge or consent of the insured; |
| • | compelling insureds to institute suits to recover amounts due under policies by offering substantially less than the amounts ultimately recovered in suits brought by them; |
| • | refusing to pay claims without conducting a reasonable investigation; |
| • | making claim payments to an insured without indicating the coverage under which each payment is being made; |
| • | delaying the investigation or payment of claims by requiring an insured, claimant or the physician of either to submit a preliminary claim report and then requiring the subsequent submission of formal proof of loss forms, both of which submissions contains substantially the same information; |
| • | failing, in the case of claim denials or offers of compromise or settlement, to promptly provide a reasonable and accurate explanation of the basis for such actions; and |
| • | not attempting in good faith to effectuate prompt, fair and equitable settlements of claims in which liability has become reasonably clear. |
15
Table of Contents
We set business conduct policies and conduct training to make our employee-adjusters and other claims personnel aware of these prohibitions and we require them to conduct their activities in compliance with these statutes.
Licensing of retail agents and adjusters. Generally, individuals who sell, solicit or negotiate insurance, whether employed by one of our retail agencies or an independent agency, are required to be licensed by the state in which they work for the applicable line or lines of insurance they offer. Agents generally must renew their licenses annually and complete a certain number of hours of continuing education. In certain states in which we operate, insurance claims adjusters are also required to be licensed and some must fulfill annual continuing education requirements.
Financial reporting. We are required to file quarterly and annual financial reports with states using statutory accounting practices that are different from generally accepted accounting principles, (GAAP), which reflect our insurance company subsidiaries on a going concern basis. The statutory accounting practices used by state regulators, in keeping with the intent to assure policyholder protection, are generally based on a liquidation concept. For a summary of significant differences for our insurance companies between statutory accounting practices and GAAP, see Note 2 of Notes to Consolidated Financial Statements contained in Item 8 of this report.
Periodic financial and market conduct examinations. The state insurance departments that have jurisdiction over our insurance company subsidiaries may conduct on-site visits and examinations of the insurance companies’ affairs, especially as to their financial condition, ability to fulfill their obligations to policyholders, market conduct, claims practices and compliance with other laws and applicable regulations. Typically, these examinations are conducted every three to five years. In addition, if circumstances dictate, regulators are authorized to conduct special or target examinations of insurance companies to address particular concerns or issues. The results of these examinations can give rise to regulatory orders requiring remedial, injunctive or other corrective action on the part of the company that is the subject of the examination or assessing fines or other penalties against that company.
Use of county mutual in Texas. In 2003, legislation was passed in Texas that was described as comprehensive insurance reform affecting the homeowners and automobile insurance business. With respect to non-standard personal automobile insurance, the most significant provisions provided for additional rate regulation and limitations on the use of credit scoring and territorial distinctions in underwriting and rating risks. For the year ended December 31, 2008, approximately 17.1% of our gross premiums written from non-standard personal automobile insurance policies produced on behalf of our insurance companies and other unaffiliated insurance companies we represent were issued to customers in Texas. Currently, 91% of these policies were written by an unaffiliated county mutual insurance company and 100% assumed by our insurance companies. The remaining 9% were written directly by our insurance companies. We and many of our competitors contract with Texas county mutual insurance companies primarily because these entities are allowed the flexibility of multiple rate plans. Even though the Texas Commissioner of Insurance has been given broader rulemaking authority under the 2003 law, to date we have experienced little impact in the design and pricing flexibility of our products. The county mutual system remains flexible and continues to meet our needs.
Employees
As of December 31, 2008, we employed 1,257 employees.
Access to Reports
Our annual report on Form 10-K, quarterly reports on Form 10-Q, current reports on Form 8-K, and amendments to those reports filed or furnished pursuant to Section 13(a) or 15(d) of the Securities Exchange Act of 1934 are made available free of charge through the “SEC Filings” link within the Investor Relations section of our website atwww.affirmativeholdings.com as soon as reasonably practicable after such material is electronically filed with, or furnished to, the Securities and Exchange Commission.
16
Table of Contents
| Item 1A. | Risk Factors |
The recent disruptions in the overall economy and the financial markets may adversely impact our business and results of operations.
The capital and credit markets have been experiencing volatility and disruption for more than 12 months. The insurance industry can be affected by many macroeconomic factors, including changes in national, regional, and local economic conditions, employment levels and consumer spending patterns. The recent disruptions in the overall economy and financial markets could reduce consumer confidence in the economy and adversely affect consumers’ ability to purchase automobile insurance policies or ancillary products from us, which could be harmful to our financial position and results of operations, adversely affect our ability to comply with our covenants under our credit facility and may result in a deceleration of the number and timing of insurance agency openings. Such declines may also, in addition to negatively impacting our operating results, adversely impact our overall financial condition, liquidity, credit rating, ability to access capital markets, and ability to retain and attract key employees. There can be no assurances that government responses to the recent disruptions in the financial markets will restore consumer confidence, stabilize the markets or increase liquidity and the availability of credit.
We may be affected by general economic conditions.
Prolonged negative changes in domestic and global economic conditions or disruptions of either or both of the financial and credit markets, including the availability of short and long-term debt financing, may affect the consumers of the products and services we sell and may have a material adverse effect on our consolidated results of operations, financial condition, and liquidity.
Our largest stockholder controls a significant percentage of our common stock and its interests may conflict with those of our other stockholders.
New Affirmative LLC (New Affirmative) beneficially owns approximately 51.0% of our outstanding common stock. As a result, New Affirmative exercises significant influence over matters requiring stockholder approval, including the election of directors, changes to our charter documents and significant corporate transactions. This concentration of ownership makes it unlikely that any other holder or group of holders of our common stock will be able to affect the way we are managed or the direction of our business. The interests of New Affirmative with respect to matters potentially or actually involving or affecting us, such as future acquisitions, financings and other corporate opportunities and attempts to acquire us, may conflict with the interests of our other stockholders. New Affirmative’s continued concentrated ownership may have the effect of delaying or preventing a change of control of us, including transactions in which stockholders might otherwise receive a premium for their shares over then current market prices.
Future issuances or sales of our common stock, including under our equity incentive plan or in connection with future acquisition activities, may adversely affect our common stock price.
As of the date of this filing, we had an aggregate of 57,231,279 shares of our common stock authorized but unissued and not reserved for specific purposes. In general, we may issue all of these shares without any action or approval by our stockholders. We have reserved 3,000,000 shares of our common stock for issuance under our equity incentive plan, of which 1,724,531 shares are issuable upon vesting and exercise of options granted as of the date of this filing, including exercisable options of 645,435 as of December 31, 2008. In addition, we may pursue acquisitions of competitors and related businesses and may issue shares of our common stock in connection with these acquisitions. Sales or issuances of a substantial number of shares of common stock, or the perception that such sales could occur, could adversely affect prevailing market prices of our common stock, and any sale or issuance of our common stock will dilute the percentage ownership held by our stockholders.
New Affirmative, our largest stockholder, beneficially owns approximately 51.0% of our common stock. New Affirmative has certain demand and piggyback registration rights with respect to the shares of our common
17
Table of Contents
stock it beneficially owns. Sales of a substantial number of shares of common stock by our largest stockholder, New Affirmative, or the perception that such sales could occur, could adversely affect prevailing market prices of our common stock.
Since we are a “controlled company” for purposes of The NASDAQ Global Select Market’s corporate governance requirements, our stockholders will not have, and may never have, the protections that these corporate governance requirements are intended to provide.
Since we are a “controlled company” for purposes of The NASDAQ Global Select Market’s corporate governance requirements, we are not required to comply with the provisions requiring that a majority of our directors be independent, the compensation of our executives be determined by independent directors or nominees for election to our board of directors be selected by independent directors. As a result, our stockholders will not have, and may never have, the protections that these rules are intended to provide. The board of directors has determined that Paul J. Zucconi, Suzanne T. Porter, Thomas C. Davis, J. Christopher Teets and Nimrod T. Frazer are independent under The NASDAQ Global Select Market’s listing standards.
Because of our significant concentration in non-standard personal automobile insurance and in a limited number of states, our profitability may be adversely affected by negative developments and cyclical changes in the industry or negative developments in these states.
Substantially all of our gross premiums written and our commission income and fees is generated from sales of non-standard personal automobile insurance policies. As a result of our concentration in this line of business, negative developments in the business, economic, competitive or regulatory conditions affecting the non-standard personal automobile insurance industry could have a negative effect on our profitability and would have a more pronounced effect on us as compared to more diversified companies. Examples of such negative developments would be increasing trends in automobile repair costs, automobile parts costs, used car prices and medical care expenses, increased regulation, as well as increased litigation of claims and higher levels of fraudulent claims. All of these events can result in reduced profitability.
In addition, the non-standard personal automobile insurance industry historically has been cyclical in nature, characterized by periods of severe price competition and excess underwriting capacity followed by periods of high premium rates and shortages of underwriting capacity. In the late 1990s, many non-standard personal automobile insurers attempted to capture more business by reducing rates. We believe that these industry-wide rate reductions, combined with increased costs per claim during the period, contributed to the deterioration of industry loss ratios in the years 1999 through 2001. We believe that in 2002 through 2004, the underwriting results in the non-standard personal automobile insurance business improved as a result of favorable pricing and competitive conditions that allowed for broad increases in rate levels by insurers, including us. In late 2004 and continuing through 2008, increased price competition and excess underwriting capacity produced a softening market. These fluctuations in the non-standard personal automobile insurance business cycle may negatively impact our profitability.
Our financial results may be adversely affected by conditions in the states where our business is concentrated.
Our business is concentrated in a limited number of states. For the year ended December 31, 2008, approximately 36.4% of our gross premiums written related to policies issued to customers in Louisiana, 17.1% to customers in Texas and 13.7% to customers in Illinois. Our revenues and profitability are therefore subject to prevailing regulatory, legal, economic, demographic, competitive and other conditions in these states. Changes in any of these conditions could make it less attractive for us to do business in these states and could have an adverse effect on our financial results.
Intense competition could adversely affect our profitability.
The non-standard personal automobile insurance business is highly competitive and, except for regulatory considerations, there are relatively few barriers to entry. Our insurance companies compete with other insurance
18
Table of Contents
companies that sell non-standard personal automobile insurance policies through independent agencies as well as with insurance companies that sell such policies directly to their customers. Our retail agencies and the independent agencies that sell our insurance products compete both with these direct writers and with other independent agencies. Therefore, our competitors are not only large national insurance companies, but also smaller regional insurance companies and independent agencies. Some of our competitors have substantially greater financial and other resources than we have and may offer a broader range of products or competing products at lower prices. In addition, existing competitors may attempt to increase market share by lowering rates and new competitors may enter this market, particularly larger insurance companies that do not presently write non-standard personal automobile insurance. In this environment, we may experience a reduction in our underwriting margins or sales of our insurance policies may decrease as individuals purchase lower-priced products from other insurance companies. A loss of business to competitors offering similar insurance products at lower prices or having other competitive advantages could negatively affect our revenues and net income.
In addition to selling policies for our own insurance companies, our retail stores offer and sell non-standard personal automobile insurance policies for unaffiliated insurance companies. As a result, our insurance companies compete with these unaffiliated insurance companies for sales to the customers of our owned retail stores. If the competing insurance products offered by an unaffiliated insurance company are priced lower or have more attractive features than the insurance policies offered by our insurance companies, customers of our retail stores may decide not to purchase insurance policies from our insurance companies and may instead purchase policies from the unaffiliated insurance company. A loss of business by our insurance companies resulting from our retail stores selling relatively more policies of unaffiliated insurance companies and fewer policies of our insurance companies could negatively affect our revenues and profitability. Our retail stores would, however, earn commission income and fees from the unaffiliated insurance companies for the sales of their policies.
Our success depends on our ability to price accurately the risks we underwrite.
The results of our operations and the financial condition of our insurance companies depend on our ability to underwrite and set premium rates accurately for a wide variety of risks. Rate adequacy is necessary to generate sufficient premiums to pay losses, loss adjustment expenses and underwriting expenses and to earn a profit. In order to price our products accurately, we must collect and properly analyze a substantial amount of data; develop, test and apply appropriate rating formulas; closely monitor and timely recognize changes in trends and project both severity and frequency of losses with reasonable accuracy. Our ability to undertake these efforts successfully, and as a result price our products accurately, is subject to a number of risks and uncertainties, some of which are outside our control, including:
| • | the availability of sufficient reliable data and our ability to properly analyze available data; |
| • | the uncertainties that inherently characterize estimates and assumptions; |
| • | our selection and application of appropriate rating and pricing techniques; and |
| • | unanticipated changes in legal standards, claim settlement practices, medical care expenses and automobile repair costs. |
Consequently, we could underprice risks, which would negatively affect our profit margins, or we could overprice risks, which could reduce our sales volume and competitiveness. In either event, the profitability of our insurance companies could be materially and adversely affected.
If our actual losses and loss adjustment expenses exceed our loss and loss adjustment expense reserves, we will incur additional charges to earnings.
We maintain reserves to cover our estimated ultimate liability for losses and the related loss adjustment expenses for both reported and unreported claims on insurance policies issued by our insurance companies. The
19
Table of Contents
establishment of appropriate reserves is an inherently uncertain process, involving actuarial and statistical projections of what we expect to be the cost of the ultimate settlement and administration of claims based on historical claims information, estimates of future trends in claims severity in multiple markets and other variable factors such as inflation. Due to the inherent uncertainty of estimating reserves, it has been necessary, and will continue to be necessary, to revise estimated future liabilities as reflected in our reserves for claims and related expenses.
We cannot be sure that our ultimate losses and loss adjustment expenses will not materially exceed our reserves. To the extent that our reserves prove to be inadequate in the future, we would be required to increase our reserves for losses and the related loss adjustment expenses and incur a charge to earnings in the subsequent period during which such reserves are increased, which could have a material and adverse impact on our financial condition and results of operations in the subsequent period. In addition, we have a limited history in establishing reserves, and our reserves for losses and loss adjustment expenses may not necessarily accurately predict future trends in our models to assess these amounts.
We may not be successful in reducing our risk and increasing our underwriting capacity through reinsurance arrangements, which could adversely affect our business, financial condition and results of operations.
In order to reduce our underwriting risk and increase our underwriting capacity, we may choose to transfer portions of our insurance risk to other insurers through reinsurance contracts. Historically, we have ceded a portion of our non-standard automobile insurance premiums and losses to unaffiliated reinsurers in accordance with these contracts. The availability, cost and structure of reinsurance protection is subject to changing market conditions that are outside of our control. In order for these contracts to qualify for reinsurance accounting and thereby provide the additional underwriting capacity that we might need, the reinsurer generally must assume significant risk and have a reasonable possibility of a significant loss. Reinsurance may not be continuously available to us to the same extent and on the same terms and rates that are currently available.
Although the reinsurer is liable to us to the extent we transfer, or “cede,” risk to the reinsurer, we remain ultimately liable to the policyholder on all risks reinsured. As a result, ceded reinsurance arrangements do not limit our ultimate obligations to policyholders to pay claims. We are subject to credit risks with respect to the financial strength of our reinsurers. We are also subject to the risk that our reinsurers may dispute their obligations to pay our claims. As a result, we may not recover claims made to our reinsurers in a timely manner, if at all. In addition, if insurance departments deem that under our existing or future reinsurance contracts the reinsurer does not assume significant risk and has a reasonable possibility of significant loss, we may not be able to increase our ability to write business based on this reinsurance. Any of these events could have a material adverse effect on our business, financial condition and results of operations.
We may incur significant losses if Vesta Fire Insurance Corporation (VFIC), which currently has an A.M. Best financial strength rating of “F” (In Liquidation) or any of our other reinsurers, do not pay our claims in a timely manner.
Although our reinsurers are liable to us to the extent we transfer risk to the reinsurers, we remain ultimately liable to our policyholders on all risks reinsured. Consequently, if any of our reinsurers cannot pay their reinsurance obligations, or dispute these obligations, we remain liable to pay the claims of our policyholders. In addition, our reinsurance agreements are subject to specified contractual limits on the amounts and types of losses covered, and we do not have reinsurance coverage to the extent our losses exceed those limits or are not of the type reinsured. As of December 31, 2008, we had a total of $63.3 million of receivables from reinsurers, including $17.1 million gross recoverable from VFIC. We have, with the approval of the VFIC Special Deputy Receiver and the District Court, Austin, Texas, withdrawn $7.4 million from the trust securing our reinsurance recoverables from VFIC, which represented 100% of the amount we paid in losses as of the date of the withdrawal covered by the VFIC reinsurance. We have made arrangements with the VFIC Special Deputy
20
Table of Contents
Receiver to submit quarterly statements for approval to withdraw additional funds from the trust based upon losses paid. VFIC currently has been assigned a financial strength rating of “F” (In Liquidation) from A.M. Best. According to A.M. Best, “F” ratings are assigned to companies that have been placed under an order of liquidation by a court of law or whose owners have voluntarily agreed to liquidate the company. If any of our reinsurers are unable or unwilling to pay amounts they owe us in a timely fashion, we could suffer a significant loss, which would have a material adverse effect on our business, financial condition and results of operations.
Because we have reduced our use of quota-share reinsurance, we have retained more risk, which could result in losses.
We have historically used quota-share reinsurance primarily to increase our underwriting capacity and to reduce our exposure to losses. Quota-share reinsurance is a form of pro rata reinsurance arrangement in which the reinsurer participates in a specified percentage of the premiums and losses on every risk that comes within the scope of the reinsurance agreement in return for a portion of the corresponding premiums.
We have reduced our use of quota-share reinsurance. As a result, we retain and earn more of the premiums we write, but we also retain more of the related losses. We generally enter into quota-share reinsurance agreements that cover business written through our underwriting agencies in specified states or regions. Reducing our use of quota-share reinsurance increases our risk and exposure to such losses, which could have a material adverse effect on our business, financial condition and results of operations.
We are subject to comprehensive regulation that may restrict our ability to earn profits.
We are subject to comprehensive regulation and supervision by government agencies in the states in which our insurance company subsidiaries are domiciled, as well as in the states where our subsidiaries sell insurance products, issue policies and handle claims. Certain states impose restrictions or require prior regulatory approval of certain corporate actions, which may adversely affect our ability to operate, innovate, obtain necessary rate adjustments in a timely manner or grow our business profitably. These regulations provide safeguards for policy owners and are not intended to protect the interests of stockholders. Our ability to comply with these laws and regulations at reasonable expense and to obtain necessary regulatory action in a timely manner is and will continue to be critical to our success.
| • | Required licensing.We operate under licenses issued by various state insurance authorities. If a regulatory authority denies or delays granting a new license, our ability to enter that market quickly or offer new insurance products in that market might be substantially impaired. |
| • | Transactions between insurance companies and their affiliates. Transactions between our insurance companies and their affiliates generally must be disclosed to state regulators, and prior approval of the applicable regulator generally is required before any material or extraordinary transaction may be consummated. State regulators may refuse to approve or delay approval of such a transaction, which may impact our ability to innovate or operate efficiently. |
| • | Restrictions on cancellation, non-renewal or withdrawal.Many states have laws and regulations that limit an insurance company’s ability to exit a market. For example, certain states limit an automobile insurance company’s ability to cancel or not renew policies. Some states prohibit an insurance company from withdrawing from one or more lines of business in the state, except pursuant to a plan approved by the state insurance department. In some states, this applies to significant reductions in the amount of insurance written, not just to a complete withdrawal. These laws and regulations could limit our ability to exit or reduce our writings in unprofitable markets or discontinue unprofitable products in the future. |
| • | Other regulations. We must also comply with state and federal regulations involving, among other things: |
| — | the use of non-public consumer information and related privacy issues; |
21
Table of Contents
| — | the use of credit history in underwriting and rating; |
| — | limitations on types and amounts of investments; |
| — | premium finance laws and regulations; |
| — | the payment of dividends; |
| — | the acquisition or disposition of an insurance company or of any company controlling an insurance company; |
| — | involuntary assignments of high-risk policies, participation in reinsurance facilities and underwriting associations, assessments and other governmental charges; |
| — | the Sarbanes-Oxley Act of 2002; |
| — | SEC reporting; |
| — | reporting with respect to financial condition; and |
| — | periodic financial and market conduct examinations performed by state insurance department examiners. |
Compliance with laws and regulations addressing these and other issues often will result in increased administrative costs. In addition, these laws and regulations may limit our ability to underwrite and price risks accurately, prevent us from obtaining timely rate increases necessary to cover increased costs and may restrict our ability to discontinue unprofitable relationships or exit unprofitable markets. These results, in turn, may adversely affect our profitability or our ability to grow our business in certain jurisdictions. The failure to comply with these laws and regulations may also result in actions by regulators, fines and penalties, and in extreme cases, revocation of our ability to do business in that jurisdiction. In addition, we may face individual and class action lawsuits by our insureds and other parties for alleged violations of certain of these laws or regulations.
Regulation may become more extensive in the future, which may adversely affect our business.
We cannot assure that states will not make existing insurance-related laws and regulations more restrictive in the future or enact new restrictive laws. New or more restrictive regulation in any state in which we conduct business could make it more expensive for us to conduct our business, restrict the premiums we are able to charge or otherwise change the way we do business. In such events, we may seek to reduce our writings in, or to withdraw entirely from these states. In addition, from time to time, the United States Congress and certain federal agencies investigate the current condition of the insurance industry to determine whether federal regulation is necessary. We are unable to predict whether and to what extent new laws and regulations that would affect our business will be adopted in the future, the timing of any such adoption and what effects, if any, they may have on our operations, profitability and financial condition.
New pricing, claims, coverage and financing issues and class action litigation are continually emerging in the automobile insurance industry, and these issues could adversely impact our revenues or our methods of doing business.
As automobile insurance industry practices and regulatory, judicial and consumer conditions change, unexpected and unintended issues related to claims, coverages, business practices and premium financing plans may emerge. These issues can have an adverse effect on our business by changing the way we price our products, by extending coverage beyond our underwriting intent, or by increasing the size of claims. Examples of such issues include:
| • | concerns over the use of an applicant’s credit score and zip code as a factor in making risk selections and pricing decisions; |
22
Table of Contents
| • | a growing trend of plaintiffs targeting automobile insurers, including us, in purported class action litigation relating to claims-handling practices, such as the permitted use of aftermarket (non-original equipment manufacturer) parts, total loss evaluation methodology and the alleged diminution in value to insureds’ vehicles involved in accidents; |
| • | a relatively new trend of plaintiffs targeting insurers, including automobile insurers, in purported class action litigation which seek to recharacterize installment fees and other allowed charges related to insurers’ installment billing programs as interest that violates state usury laws or other interest rate restrictions; and |
| • | attempts by plaintiffs to initiate purported class action litigation targeting premium finance operations relating to unearned interest rebates and the collection of service and finance charges. |
The effects and costs of these and other unforeseen issues could negatively affect our revenues, income or our methods of business.
Our insurance companies are subject to minimum capital and surplus requirements, and our failure to meet these requirements could subject us to regulatory action.
Our insurance companies are subject to risk-based capital standards and other minimum capital and surplus requirements imposed under applicable state laws, including the laws of their state of domicile. The risk-based capital standards, based upon the Risk-Based Capital Model Act adopted by the National Association of Insurance Commissioners, or NAIC, require our insurance companies to report their results of risk-based capital calculations to state departments of insurance and the NAIC. These risk-based capital standards provide for different levels of regulatory attention depending upon the ratio of an insurance company’s total adjusted capital, as calculated in accordance with NAIC guidelines, to its authorized control level risk-based capital. Authorized control level risk-based capital is the number determined by applying the NAIC’s risk-based capital formula, which measures the minimum amount of capital that an insurance company needs to support its overall business operations.
Failure to meet applicable risk-based capital requirements or minimum statutory capital requirements could subject us to further examination or corrective action imposed by state regulators, including limitations on our writing of additional business, state supervision or liquidation. Any changes in existing risk-based capital requirements or minimum statutory capital requirements may require us to increase our statutory capital levels. At December 31, 2008, each of our insurance subsidiaries maintained a risk-based capital level that was in excess of an amount that would require any corrective actions on our part.
Our failure to pay claims accurately could adversely affect our business, financial results and capital requirements.
We must accurately evaluate and pay claims that are made under our policies. Many factors affect our ability to pay claims accurately, including the training and experience of our claims representatives, the culture of our claims organization and the effectiveness of our management, our ability to develop or select and implement appropriate procedures and systems to support our claims functions and other factors. Our failure to pay claims accurately could lead to material litigation, undermine our reputation in the marketplace, impair our image, as a result, and negatively affect our financial results.
In addition, if we do not train new claims employees effectively or if we lose a significant number of experienced claims employees, our claims department’s ability to handle an increasing workload as we grow could be adversely affected. In addition to potentially requiring that growth be slowed in the affected markets, we could suffer decreased quality of claims work, which in turn could lower our operating margins.
23
Table of Contents
If we are unable to retain and recruit qualified personnel, our ability to implement our business strategies could be hindered.
Our success depends in part on our ability to attract and retain qualified personnel. Our inability to recruit and retain qualified personnel could prevent us from fully implementing our business strategies and could materially and adversely affect our business, growth and profitability. We do not have key person insurance on the lives of any of our executive officers.
We may encounter difficulties in implementing our strategies of expanding into new markets and acquiring agencies.
Our growth strategy includes expanding into new geographic markets, introducing additional insurance and non-insurance products and acquiring the business and assets of underwriting and retail agencies. Our future growth will face risks, including risks associated with our ability to:
| • | obtain necessary licenses; |
| • | properly design and price our products; |
| • | identify, hire and train new claims and sales employees; |
| • | identify agency acquisition candidates; and |
| • | assimilate and integrate the operations, personnel, technologies, products and information systems of the acquired companies. |
We may also encounter difficulties in connection with implementing our growth strategy, including unanticipated expenditures, damaged or lost relationships with customers and independent agencies and contractual, intellectual property or employment issues relating to companies we acquire. In addition, our growth strategy may require us to enter into a geographic or business market in which we have little or no prior experience.
Further, any potential agency acquisitions may require significant capital outlays, and if we issue equity or convertible debt securities to pay for an acquisition, these securities may have rights, preferences or privileges senior to those of our common stockholders or the issuance may be dilutive to our existing stockholders. Once agencies are acquired, we could suffer increased costs, disruption of our business and distraction of our management if we are unable to smoothly integrate the agencies into our operations. Our expansion will also continue to place significant demands on our management, operations, systems, accounting, internal controls and financial resources. Any failure by us to manage our growth and to respond to changes in our business could have a material adverse effect on our business and profitability and could cause the price of our common stock to decline.
Our underwriting operations are vulnerable to a reduction in the amount of business written by independent agencies.
For the year ended December 31, 2008, independent agencies were responsible for approximately 31.3% of the gross premiums produced by our underwriting agencies. As a result, our business depends in part on the marketing efforts of independent agencies and on our ability to offer insurance products and services that meet the requirements of these independent agencies and their customers. Independent agencies are not obligated to sell or promote our products, and since many of our competitors rely significantly on the independent agency market, we must compete with other insurance companies and underwriting agencies for independent agencies’ business. Some of our competitors offer a larger variety of products, lower prices for insurance coverage or higher commissions, and we therefore may not be able to continue to attract and retain independent agencies to sell our insurance products. A material reduction in the amount of business our independent agencies sell would negatively impact our revenues.
24
Table of Contents
If we are unable to establish and maintain relationships with unaffiliated insurance companies to sell their non-standard personal automobile policies through our owned retail stores, our sales volume and profitability may suffer.
Our owned retail stores sell non-standard personal automobile insurance policies for our insurance companies and also for unaffiliated insurance companies. Particularly in soft markets, our commitment to underwriting discipline may result in declining sales of our insurance companies’ policies in favor of lower- priced products from other insurance companies willing to accept less attractive underwriting margins. Consequently, part of our strategy in a soft market is to generate increased commission income and fees from sales of third-party policies through our retail stores’ relationships with unaffiliated underwriting agencies and insurance companies. If our retail stores are unable to establish and maintain these relationships, they would have a more limited selection of non-standard personal automobile insurance policies to sell. In such an event, our retail stores might experience a net decline in overall sales volume of non-standard personal automobile insurance policies, which would decrease our profitability.
If our insurance companies, which currently have A.M. Best financial strength ratings of “B”, fail to maintain commercially acceptable financial strength ratings, our ability to implement our business strategies successfully could be significantly and negatively affected.
Financial strength ratings are important in establishing the competitive position of insurance companies and could have an effect on an insurance company’s sales. A.M. Best, generally considered to be a leading authority on insurance company ratings and information, has currently assigned three of our insurance companies ratings of “B” (Fair). The “B” rating is the seventh highest of fifteen rating categories that A.M. Best assigns to insurance companies, ranging from “A++” (Superior) to “F” (In Liquidation). According to A.M. Best, “B” ratings are assigned to insurers that have a fair ability to meet their current obligations to policyholders but are financially vulnerable to adverse changes in underwriting or economic conditions. This rating reflects A.M. Best’s opinion of our ability to pay claims and is not an evaluation directed to investors regarding an investment in our common stock. In evaluating an insurance company’s financial and operating performance, A.M. Best reviews its profitability, leverage and liquidity, as well as its book of business, the adequacy and soundness of its reinsurance, the quality and estimated market value of its assets, the adequacy of its loss reserves, the adequacy of its surplus, its capital structure, the experience and competence of its management and its market presence. In addition, A.M. Best evaluated the insurance company’s ownership and the capital structure of the parent company. Our insurance companies’ ratings are subject to change at any time and may be revised downward or revoked at the sole discretion of A.M. Best.
Because lenders and reinsurers will use our A.M. Best ratings as a factor in deciding whether to transact business with us, the current ratings of our insurance companies or their failure to maintain the current ratings may dissuade a financial institution or reinsurance company from conducting any business with us or may increase our borrowing costs or reinsurance costs.
We face litigation, which if decided adversely to us, could adversely impact our financial results.
We are a party in a number of lawsuits. These lawsuits are described more fully elsewhere in this report. Litigation, by its very nature, is unpredictable and the outcome of these cases is uncertain. The precise nature of the relief that may be sought or granted in any lawsuits is uncertain and may, if these lawsuits are determined adversely to us, negatively impact our earnings.
In addition, potential litigation involving new claim, coverage and business practice issues could adversely affect our business by changing the way we price our products, extending coverage beyond our underwriting intent or increasing the size of claims. Recent examples of some emerging issues include a growing trend of plaintiffs targeting automobile insurers in purported class action litigation relating to claims handling practices such as total loss evaluation methodology and the alleged diminution in value to insureds’ vehicles involved in
25
Table of Contents
accidents and the relatively new trend of plaintiffs targeting insurers, including automobile insurers, in purported class action litigation which seeks to recharacterize installment fees and other allowed charges related to insurers’ installment billing programs as interest that violates state usury laws or other interest rate restrictions. The effects of these and other unforeseen emerging claims, coverage and business practice issues could negatively impact our profitability or our methods of doing business.
Adverse securities market conditions can have a significant and negative impact on our investment portfolio.
Our results of operations depend in part on the performance of our invested assets. As of December 31, 2008, our investment portfolio was completely invested in fixed-income securities. Certain risks are inherent in connection with fixed maturity securities including loss upon default and price volatility in reaction to changes in interest rates and general market factors. In general, the fair value of a portfolio of fixed-income securities increases or decreases inversely with changes in the market interest rates, while net investment income realized from future investments in fixed-income securities increases or decreases along with interest rates. In addition, some of our fixed-income securities have call or prepayment options. This could subject us to reinvestment risk should interest rates fall and issuers call their securities. We attempt to mitigate this risk by investing in securities with varied maturity dates, so that only a portion of the portfolio will mature at any point in time. Furthermore, actual net investment income and/or cash flows from investments that carry prepayment risk, such as mortgage-backed and other asset-backed securities, may differ from those anticipated at the time of investment as a result of interest rate fluctuations. An investment has prepayment risk when there is a risk that the timing of cash flows that result from the repayment of principal might occur earlier than anticipated because of declining interest rates or later than anticipated because of rising interest rates. If market interest rates were to change 1.0% (for example, the difference between 5.0% and 6.0%), the fair value of our fixed-income securities would change approximately $4.1 million. The change in fair value was determined using duration modeling assuming no prepayments.
We are subject to a number of restrictive debt covenants under our current credit facility that may restrict our business and financing activities.
Our credit facility contains restrictive debt covenants that, among other things, restrict our ability to:
| • | Borrow money; |
| • | Pay dividends and make distributions; |
| • | Issue stock; |
| • | Make certain investments; |
| • | Use assets as security in other transactions; |
| • | Create liens; |
| • | Enter into affiliate transactions; |
| • | Merge or consolidate; or |
| • | Transfer and sell assets |
Our credit facility also requires us to meet certain financial tests, and our need to meet the requirements of these financial tests may limit our ability to expand or pursue our business strategies.
Our ability to comply with the provisions contained in our credit facility may be affected by changes in our business condition or results of operation, adverse regulatory developments, or other events beyond our control. Our failure to comply with the terms of these provisions could result in a default under our credit facility which,
26
Table of Contents
in turn, could cause all or a substantial portion of our debt to become immediately due and payable. If our debt under the credit facility was to be accelerated, we cannot assure that we would be able to repay it. In addition, a default would give our lender the right to terminate any commitment to provide us with additional funds under our credit facility.
We rely on our information technology and telecommunications systems, and the failure of these systems could disrupt our operations.
Our business is highly dependent upon the successful and uninterrupted functioning of our current information technology and telecommunications systems as well as our future integrated policy and claims system. We rely on these systems to process new and renewal business, provide customer service, make claims payments and facilitate collections and cancellations, as well as to perform actuarial and other analytical functions necessary for pricing and product development. As a result, the failure of these systems could interrupt our operations and adversely affect our financial results. Because our information technology and telecommunications systems interface with and depend on third-party systems, we could experience service denials if demand for such service exceeds capacity or such third-party systems fail or experience interruptions. If sustained or repeated, a system failure or service denial could result in a deterioration of our ability to write and process new and renewal business and provide customer service or compromise our ability to pay claims in a timely manner. This could result in a material adverse effect on our business.
As part of our efforts to continue improving our internal control over financial reporting, we are upgrading and transforming our existing information technology system. We may experience difficulties in transitioning to new or upgraded systems, including loss of data and decreases in productivity until personnel become familiar with new systems. In addition, our management information systems will require modification and refinement as we grow and as our business needs change, which could prolong difficulties we experience with systems transitions, and we may not always employ the most effective systems for our purposes. If we experience difficulties in implementing new or upgraded information systems or experience significant system failures, or if we are unable to successfully modify our management information systems and respond to changes in our business needs, our operating results could be harmed or we may fail to meet our reporting obligations.
Severe weather conditions and other catastrophes may result in an increase in the number and amount of claims filed against us.
Our business is exposed to the risk of severe weather conditions and other catastrophic events, such as rainstorms, snowstorms, hail and ice storms, hurricanes, tornadoes, earthquakes, fires and other events such as explosions, terrorist attacks and riots. The incidence and severity of catastrophes and severe weather conditions are inherently unpredictable. Such conditions generally result in higher incidence of automobile accidents and an increase in the number of claims filed, as well as the amount of compensation sought by claimants.
As a holding company, we are dependent on the results of operations of our operating subsidiaries to meet our obligations and pay future dividends.
We are organized as a holding company, a legal entity separate and distinct from our operating subsidiaries. As a holding company without significant operations of our own, we are dependent upon dividends and other payments from our operating subsidiaries, which include our agency subsidiaries and our insurance company subsidiaries. We cannot pay dividends to our stockholders and meet our other obligations unless we receive dividends and other payments from our operating subsidiaries, including our insurance company subsidiaries.
State insurance laws restrict the ability of our insurance company subsidiaries to declare stockholder dividends. These subsidiaries may not make an “extraordinary dividend” until 30 days after the applicable commissioner of insurance has received notice of the intended dividend and has not objected in such time or until the commissioner has approved the payment of the extraordinary dividend within the 30-day period. In most
27
Table of Contents
states, an extraordinary dividend is defined as any dividend or distribution of cash or other property whose fair market value, together with that of other dividends and distributions made within the preceding 12 months, exceeds the greater of 10.0% of the insurance company’s surplus as of the preceding year-end or the insurance company’s net income for the preceding year, in each case determined in accordance with statutory accounting practices. In addition, dividends may only be paid from unassigned earnings and an insurance company’s remaining surplus must be both reasonable in relation to its outstanding liabilities and adequate to its financial needs. As of December 31, 2008, our insurance companies may not pay ordinary dividends to us without prior regulatory approval due to a negative unassigned surplus position. Dividend payments of $7.3 million were received from our insurance company subsidiaries in 2008. On February 3, 2009, we obtained approval from the New York Department of Insurance for one of our insurance subsidiaries to retire one million shares of its stock for $2.9 million and approved payment of an extraordinary dividend for $100,000.
| Item 1B. | UNRESOLVED STAFF COMMENTS |
None.
| Item 2. | PROPERTIES |
As of December 31, 2008, we leased an aggregate of approximately 426,070 square feet of office space for our agencies, insurance companies and retail stores in various locations throughout the United States. The office space includes two leases for approximately 58,642 aggregate square feet of office space in a common building in Burr Ridge, Illinois. One Burr Ridge lease is for approximately 50,000 square feet of office space, and has a term that expires in November 2016. The other Burr Ridge lease is for approximately 8,642 square feet of office space, and has a term that expires in March 2009. We lease approximately 56,888 square feet of office space in Addison, Texas, and our Addison lease term expires in March 2010. We also lease approximately 26,370 aggregate square feet of office space in a common building in Baton Rouge, Louisiana. One Baton Rouge lease is for approximately 20,117 square feet of office space, and has a term that expires in September 2012. The other Baton Rouge lease is for approximately 6,253 square feet of office space, and has a term that expires in March 2010. In addition, we have 219 owned retail stores that presently lease space on an individual basis at various locations in the states in which we do business. None of these individual retail store leases are material to our operations.
In Baton Rouge, Louisiana, we own a building of approximately 177,469 square feet for investment purposes. The building is under a lease agreement with a federal agency. The lease expires on August 28, 2009. However, the federal agency may terminate the lease upon fifteen days’ written notice after February 28, 2009.
We believe that our properties have been adequately maintained, are in generally good condition and are suitable for our business as presently conducted. We believe our existing facilities sufficiently provide for both our present and presently anticipated needs. We also believe that, with respect to leased properties, upon the expiration of our current leases, we will be able to either secure renewal terms or enter into leases for alternative locations on acceptable market terms.
| Item 3. | LEGAL PROCEEDINGS |
We and our subsidiaries are named from time to time as parties in various legal actions arising in the ordinary course of our business and arising out of or related to claims made in connection with our insurance policies and claims handling. We believe that the resolution of these legal actions will not have a material adverse effect on our financial position or results of operations. However, the ultimate outcome of these matters is uncertain.
In December 2003, InsureOne Independent Agency, LLC (InsureOne), American Agencies General Agency, Inc. and Affirmative Insurance Holdings, Inc. brought action in the Circuit Court of Cook County, Illinois to enforce non-compete and non-solicitation agreements entered into with James Hallberg, the former
28
Table of Contents
president of InsureOne, a wholly-owned subsidiary, and eight former employees of InsureOne and two of Hallberg’s family trusts. On November 21, 2008, the Court entered a Memorandum Order and Judgment, which was amended on January 20, 2009, entering judgment in favor of InsureOne Independent Agency, LLC, American Agencies General Agency, Inc. and Affirmative Insurance Holdings, Inc., awarding us $7.7 million, plus reasonable attorneys’ fees and costs. The Court also entered judgment in favor of James Hallberg on a counterclaim, awarding him $130,168, plus attorneys’ fees and costs.
In October 2002, the named plaintiff Nickey Marsh filed suit in the Fourth Judicial District Court of Louisiana against USAgencies alleging that certain adjustments to the actual cash value of his total loss automobile claim were improper. In October 2003, the action was amended to a class action and the court certified the class in August 2006. On March 3, 2009, we executed a settlement agreement with the plaintiff which, subject to class notice and final court approval, will resolve this proceeding. Pursuant to the terms of the Acquisition Agreement between us and USAgencies, the selling parties are bound to indemnify us from any and all losses attendant to claims arising out of the Marsh litigation out of a sum placed into escrow specifically for such purpose.
From time to time, we and our subsidiaries are subject to random compliance audits from federal and state authorities regarding various operations within our business that involve collecting and remitting taxes in one form or another. In 2006, two of our owned underwriting agencies were subject to a sales and use tax audit conducted by the State of Texas. The examiner for the State of Texas completed his audit report and delivered an audit assessment asserting that, for the period from January 2002 to December 2005, we should have collected and remitted approximately $2.9 million in sales tax derived from claims services performed by our underwriting agencies for policies sold by these underwriting agencies and issued by an affiliated county mutual insurance company through a fronting arrangement. Our insurance companies reinsured 100% of these policies. The assessment included an additional $0.4 million for accrued interest and penalty for a total assessment of $3.3 million. We believe that these services are not subject to sales tax and are vigorously contesting the assertions made by the state and exercising all available rights and remedies available to us. In October 2006, we responded to the assessment by filing petitions with the Comptroller of Public Accounts for the State of Texas requesting a re-determination of the tax due and a hearing to present written and oral evidence and legal arguments to contest the imposition of the asserted taxes. As a result of the timely filing of these petitions, an administrative appeal process has commenced and the date for payment is delayed until the completion of the appeal process. Such appeals routinely take up to three years and much longer for complex cases. As such, the outcome of this tax assessment will not be known for a commensurate amount of time. At this time, we are uncertain of the probability of the outcome of our appeal and therefore cannot reasonably estimate the ultimate liability. We have not made an accrual for this potential liability as of December 31, 2008.
Affirmative Insurance Company is a party to a 100% quota-share reinsurance agreement with Hawaiian Insurance and Guaranty Company, Ltd (Hawaiian), which is ultimately a wholly-owned subsidiary of VIG. In November 2004, Hawaiian was named among a group of four other named defendants and twenty unnamed defendants in a complaint filed in the Superior Court of the State of California for the County of Los Angeles alleging causes of action as follows: enforcement of coverage under Hawaiian’s policy of an underlying default judgment plaintiff obtained against Hawaiian’s former insured, who was denied a defense in the underlying lawsuit due to his failure to timely pay the Hawaiian policy premium; ratification and waiver of policy lapse and declaratory relief against Hawaiian; breach of implied covenant of good faith and fair dealing against Hawaiian with the plaintiff as the assignee of the insured; intentional misconduct as to the defendant SCJ Insurance Services (SCJ); and professional negligence as to the defendants Prompt Insurance Services, Paul Ruelas, and Anthony David Medina. SCJ, Prompt Insurance Services, Paul Ruelas, and Anthony David Medina are not affiliated with AIC. The plaintiff sought to enforce an underlying default judgment obtained against Hawaiian’s insured in September 2004 in the amount of $35.0 million and additional bad faith damages including punitive damages in the amount of $35.0 million. In August 2005, plaintiff served a copy of its Second Amended Complaint, which added a cause of action for fraud and deceit against all defendants, and a cause of action for negligent misrepresentation against Hawaiian and SCJ.
29
Table of Contents
In January 2006, Judge Bigelow absolved Hawaiian and SCJ of all counts plaintiff filed against them in this litigation on the trial court level by virtue of court order on motions for summary judgment that were submitted by both Hawaiian and SCJ. A partial dismissal without prejudice was entered as to defendant Paul Ruelas. Plaintiff filed a notice of appeal in April 2006. In September 2006, Hawaiian moved to stay appellate proceedings pursuant to an Order of Liquidation entered in August 2006, in the Circuit Court for the State of Hawaii.
In October 2006, The Court of Appeal of the State of California, Second Appellate District, Division Five, granted the stay order requested by Hawaiian. In December 2006, the court modified its October 2006 stay order by lifting it as to SCJ, causing the suit to proceed with SCJ as the sole defendant. Hawaiian filed a status update with the court in March 2007, indicating that the liquidation proceeding for Hawaiian remained pending and in full force and effect. On March 15, 2007, plaintiff moved the Court of Appeal to lift the stay and that motion was denied. On March 27, 2007, plaintiff filed a petition with the Supreme Court of California for review of the Court of Appeal’s order denying plaintiff’s motion to lift the stay, and in July 2007, the Supreme Court of California denied that petition. At this time, we are uncertain of the probability of the outcome of plaintiff’s appeal and therefore cannot reasonably estimate the ultimate liability.
| Item 4. | SUBMISSION OF MATTERS TO A VOTE OF SECURITY HOLDERS |
None.
30
Table of Contents
PART II
| Item 5. | MARKET FOR REGISTRANT’S EQUITY, RELATED STOCKHOLDER MATTERS AND ISSUER PURCHASES OF EQUITY SECURITIES |
Market Information
Our common stock is traded on the NASDAQ Global Select Market (formerly known as the NASDAQ National Market) under the symbol AFFM. The following table sets forth, for the periods indicated, the high, low and closing sales prices for our common stock as reported on the NASDAQ Global Select Market:
| First Quarter Ended March 31 | Second Quarter Ended June 30 | Third Quarter Ended September 30 | Fourth Quarter Ended December 31 | |||||||||
2008 | ||||||||||||
High | $ | 10.30 | $ | 8.96 | $ | 7.05 | $ | 4.39 | ||||
Low | 7.13 | 6.25 | 2.53 | 0.80 | ||||||||
Close | 7.98 | 6.80 | 3.16 | 1.45 | ||||||||
Cash dividends declared per share | 0.02 | 0.02 | 0.02 | 0.02 | ||||||||
2007 | ||||||||||||
High | $ | 18.73 | $ | 18.43 | $ | 15.97 | $ | 11.88 | ||||
Low | 15.84 | 13.75 | 11.23 | 9.05 | ||||||||
Close | 17.30 | 15.25 | 11.50 | 10.38 | ||||||||
Cash dividends declared per share | 0.02 | 0.02 | 0.02 | 0.02 | ||||||||
Shareholders of Record
On March 27, 2009, the closing sales price of our common stock as reported by the NASDAQ Global Select Market was $3.89 per share, there were 15,415,358 shares of our common stock issued and outstanding and there were 9 known holders of record of our common stock and approximately 1,000 beneficial owners.
Dividends
The declaration and payment of dividends is subject to the discretion of our board of directors and will depend on our financial condition, results of operations, cash requirements, future prospects, regulatory and contractual restrictions on the payment of dividends by our subsidiaries, and other factors deemed relevant by our board of directors. On March 27, 2009, we amended our senior secured credit facility. Under the terms of the amendment, dividends are permitted only if the leverage ratio is less than or equal to 1.5. As a result, management believes dividends will not be paid during 2009. Further, we may enter into new agreements or incur additional indebtedness in the future which may further prohibit or restrict the payment of dividends. There is no requirement that we must, and we cannot assure that we will, declare and pay any dividends in the future. Our board of directors may determine to retain such capital for repayment of indebtedness, general corporate or other purposes. For a discussion of our cash resources and needs, see “Management’s Discussion and Analysis of Financial Condition and Results of Operations — Financial Condition — Liquidity and Capital Resources”.
We are a holding company and a legal entity separate and distinct from our operating subsidiaries. As a holding company without significant operations of our own, our principal sources of funds are dividends and other payments from our operating subsidiaries. The ability of our insurance subsidiaries to pay dividends is subject to limits under insurance laws of the states in which they are domiciled. Furthermore, there are no restrictions on payment of dividends from our agency, administrative, and consumer products subsidiaries, other than typical state corporation law requirements.
31
Table of Contents
Performance Graph
The following graph shows the percentage change in our cumulative total stockholder return on our common stock since our initial public offering measured by dividing (x) the sum of (A) the cumulative amount of dividends, assuming dividend reinvestment during the periods presented and (B) the difference between our share price at the end and the beginning of the periods presented, by (y) the share price at the beginning of the periods presented. The graph demonstrates cumulative total returns for us, NASDAQ and the NASDAQ Insurance Index from the date of our initial public offering, July 9, 2004, through December 31, 2008.
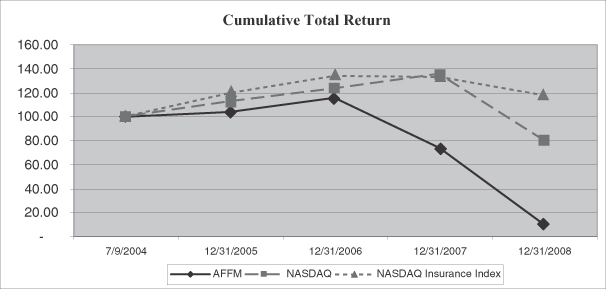
32
Table of Contents
| Item 6. | SELECTED FINANCIAL DATA |
The following selected financial data should be read in conjunction with “Item 7. Management’s Discussion and Analysis of Financial Condition and Results of Operations” and consolidated financial statements and notes thereto contained in “Item 8. Financial Statements and Supplementary Data” of this report.
| Year Ended December 31, | ||||||||||||||||
| 2008 | 2007 | 2006 | 2005 | 2004 | ||||||||||||
| (in thousands, except per share data) | ||||||||||||||||
Statement of Income Data | ||||||||||||||||
Premiums earned | $ | 357,301 | $ | 396,043 | $ | 288,110 | $ | 297,799 | $ | 194,341 | ||||||
Commission income and fees | 78,926 | 88,146 | 60,995 | 79,615 | 126,679 | |||||||||||
Total revenues | 448,923 | 500,034 | 357,112 | 381,479 | 323,339 | |||||||||||
Losses and loss adjustment expenses | 274,391 | 289,724 | 185,346 | 191,208 | 128,969 | |||||||||||
Selling, general and administrative expenses | 144,269 | 162,216 | 150,540 | 153,805 | 148,095 | |||||||||||
Total expenses | 450,860 | 488,260 | 344,626 | 352,735 | 281,870 | |||||||||||
Income (loss) before income taxes, minority interest and equity interest in unconsolidated subsidiaries | (1,937 | ) | 11,774 | 12,486 | 28,744 | 41,469 | ||||||||||
Net income | 1,438 | 9,669 | 9,744 | 18,305 | 24,433 | |||||||||||
Earnings per share: | ||||||||||||||||
Basic | 0.09 | 0.63 | 0.64 | 1.16 | 1.74 | |||||||||||
Diluted | 0.09 | 0.63 | 0.63 | 1.14 | 1.72 | |||||||||||
Dividends declared per share | 0.08 | 0.08 | 0.08 | 0.08 | 0.02 | |||||||||||
Weighted average shares outstanding: | ||||||||||||||||
Basic | 15,415 | 15,371 | 15,295 | 15,774 | 14,019 | |||||||||||
Diluted | 15,415 | 15,382 | 15,345 | 15,993 | 14,214 | |||||||||||
Operating Data | ||||||||||||||||
Gross premiums written | $ | 385,059 | $ | 442,700 | $ | 286,180 | $ | 321,204 | $ | 281,725 | ||||||
Net premiums written | 340,388 | 407,567 | 284,807 | 315,498 | 215,256 | |||||||||||
Balance Sheet Data | ||||||||||||||||
Cash, cash equivalents and total investments | $ | 325,656 | $ | 434,157 | $ | 274,254 | $ | 258,787 | $ | 183,757 | ||||||
Total assets | 802,051 | 900,637 | 557,267 | 544,125 | 521,622 | |||||||||||
Total debt | 213,586 | 273,896 | 56,702 | 56,702 | 30,928 | |||||||||||
Total liabilities | 585,568 | 683,592 | 350,874 | 344,163 | 316,316 | |||||||||||
Total stockholders’ equity | 216,483 | 217,045 | 206,393 | 199,962 | 205,306 | |||||||||||
Book value per common share | 14.04 | 14.08 | 13.44 | 12.96 | 12.19 | |||||||||||
33
Table of Contents
| Item 7. | MANAGEMENT’S DISCUSSION AND ANALYSIS OF FINANCIAL CONDITION AND RESULTS OF OPERATIONS |
OVERVIEW
We are a distributor and producer of non-standard personal automobile insurance policies for individual consumers in targeted geographic markets. Non-standard personal automobile insurance policies provide coverage to drivers who find it difficult to obtain insurance from standard automobile insurance companies due to their lack of prior insurance, age, driving record, limited financial resources or other factors. Non-standard personal automobile insurance policies generally require higher premiums than standard automobile insurance policies for comparable coverage.
As of December 31, 2008, our subsidiaries included insurance companies licensed to write insurance policies in 40 states, underwriting agencies, and retail agencies with 219 owned stores and 33 operating franchise retail store locations and relationships with two unaffiliated underwriting agencies. We are currently active in offering insurance directly to individual consumers through retail stores in 10 states (Louisiana, Texas, Illinois, Alabama, Florida, Missouri, Indiana, South Carolina, Kansas and Wisconsin) including our franchised stores in Florida and distributing our own insurance policies through 8,000 independent agents or brokers in 10 states (Louisiana, Texas, Illinois, California, Michigan, Florida, Missouri, Indiana, South Carolina and New Mexico).
In 2007, we completed the acquisition of USAgencies L.L.C. (USAgencies), a non-standard automobile insurance distributor and provider headquartered in Baton Rouge, Louisiana, in a fully-financed all cash transaction valued at approximately $199.1 million. At the time of acquisition, USAgencies had 91 operating retail sales locations in Louisiana, Illinois and Alabama selling its products directly to consumers through its owned retail stores, virtual call centers and internet site. The acquisition gave us a leading market position in Louisiana, the twelfth largest non-standard automobile insurance market. The transaction was effective as of January 1, 2007. The purchase of USAgencies was financed through $200.0 million in borrowings under a $220.0 million senior secured credit facility that was entered into concurrently with the completion of the acquisition.
We believe that the delivery of non-standard personal automobile insurance policies to individual consumers requires the interaction of three basic operations, each with a specialized function:
| • | Insurance companies, which possess the regulatory authority and capital necessary to issue insurance policies; |
| • | Underwriting agencies, which supply centralized infrastructure and personnel required to design and service insurance policies that are distributed through retail agencies; and |
| • | Retail agencies,which provide multiple points of sale under established local brands with personnel licensed and trained to sell insurance policies and ancillary products to individual consumers. |
Our three operating components often function as a vertically integrated unit, capturing the premium and associated risk and commission income and fees generated from the sale of an insurance policy. There are other instances, however, when each of our operations functions with unaffiliated entities on an unbundled basis, either independently or with one or both of the other two operations. For example, as of December 31, 2008, our insurance companies had relationships with two unaffiliated underwriting agencies that design, distribute and service our policies through their approximately 4,100 independent agencies, and our underwriting agencies distributed insurance policies through approximately 3,900 independent agencies in addition to our owned and franchised retail stores. In addition, our retail stores earn commission income and fees from sales of third-party policies.
We believe that our ability to enter into a variety of business relationships with third-parties allows us to maximize sales penetration and profitability through industry cycles better than if we employed a single, vertically integrated operating structure.
34
Table of Contents
CRITICAL ACCOUNTING POLICIES
The preparation of our consolidated financial statements in conformity with U. S. generally accepted accounting principles (generally accepted accounting principles) requires us to make estimates and assumptions when applying our accounting policies. The following sections provide information about our estimation process related to certain of our critical accounting policies:
| • | reinsurance recoverable on paid and incurred losses; |
| • | deferred policy acquisition costs; |
| • | reserving for unpaid losses and loss adjustment expenses; |
| • | valuation of investments; |
| • | accounting for business combinations, goodwill and other intangible assets; and |
| • | deferred income taxes. |
Reinsurance recoverable on paid and incurred losses.We record the amounts we expect to receive from reinsurers as an asset on our balance sheet. Our insurance companies report as assets the estimated reinsurance recoverable on paid losses and unpaid losses, including an estimate for losses incurred but not reported. These amounts are estimated based on our interpretation of each reinsurer’s obligations pursuant to the individual reinsurance contracts between us and each reinsurer, as well as judgments we make regarding the financial viability of each reinsurer and its ability to pay us what is owed under the reinsurance contract.
At December 31, 2008, our receivables from reinsurers included $17.1 million gross recoverable from VFIC. At December 31, 2008, the VFIC Trust held $17.1 million to collateralize the $17.1 million gross recoverable from VFIC. We have, with the approval of the VFIC Special Deputy Receiver and the District Court, Austin, Texas, withdrawn $7.4 million from the trust securing our reinsurance recoverables from VFIC, which represented 100% of the amount we paid in losses as of the date of the withdrawal covered by the VFIC reinsurance. We have made arrangements with the VFIC Special Deputy Receiver to submit quarterly statements for approval to withdraw additional funds from the trust based upon losses paid.
We routinely monitor the collectibility of the reinsurance recoverables of our insurance companies to determine if an amount is potentially uncollectible. Our evaluation is based on periodic reviews of our aged recoverables, as well as our assessment of recoverables due from reinsurers known to be in financial difficulty. Excluding VFIC, all reinsurers are currently rated A- or better by A. M. Best. Our estimates and judgment about collectibility of the recoverables and the financial condition of reinsurers can change, and these changes can affect the level of reserve required.
As of December 31, 2008 and 2007, we had no reserve for uncollectible reinsurance recoverables. We assessed the collectibility of our year-end receivables and believe all amounts are collectible based on currently available information.
Deferred policy acquisition costs.Deferred policy acquisition costs represent the deferral of expenses that we incur acquiring new business or renewing existing business. Policy acquisition costs (primarily commissions, advertising, premium taxes and underwriting and agency expenses related to issuing a policy) are deferred and charged against income ratably over the terms of the related policies. Management regularly reviews the categories of acquisition costs that are deferred and assesses the recoverability of this asset. A premium deficiency and a corresponding charge to income is recognized if the sum of the expected losses and loss adjustment expenses, unamortized acquisition costs and maintenance costs exceeds related unearned premiums and anticipated investment income. At December 31, 2008, we determined that there was no premium deficiency. Judgments as to the ultimate recoverability of such deferred costs are highly dependent upon estimated future loss costs associated with the premiums written.
35
Table of Contents
Reserving for unpaid losses and loss adjustment expenses.On a quarterly basis, for each financial reporting period, we record our best estimate of our overall reserve for both current and prior accident years. The amount recorded represents the remaining amount we expect to pay for all covered losses that occurred through the current financial statement date, as well as the amount we expect to expend for all claim settlement expenses. The overall reserve for losses and loss adjustment expenses estimate that we record is the difference between (1) our point estimate of the ultimate loss and ultimate loss adjustment expenses, and (2) the amount of losses and loss adjustment expenses paid through the current financial statement date. Our point estimate of ultimate loss consists of a point estimate for Incurred But Not Reported (IBNR) losses. The IBNR reserve is calculated by reducing the overall reserve for loss by the amount of our case reserves. The point estimate of ultimate loss adjustment expenses consists of a separate point estimate for adjusting and other expenses and for defense and cost containment expenses.
We utilize different processes to determine our best estimate for unpaid losses and unpaid loss adjustment expenses. We establish a standard system-generated case loss reserve that varies by state, program, coverage and, in some instances for certain coverages, elapsed time since date of loss. The only variation to this methodology for setting case loss reserves exists in the instance where we believe our financial exposure for a particular loss event is significant and in fact may approach or be equal to our policy limits. In these instances, we will establish a case loss reserve to reflect their view regarding the potential cost of this exposure to us. The system automatically adjusts the case loss reserves downward in the event a partial payment is made and a claim remains open. We will re-adjust the case loss reserves in an instance where a partial payment is made if we believe the facts of the claim justify a different reserve. This activity is generally limited to our personal injury protection coverage, where we have a significant amount of this type of activity.
We currently have one relationship with an unaffiliated reinsurer from which we obtain data that we use in the course of estimating our loss and loss adjustment expense reserves. Our relationship with this reinsurer consisted of a fronting relationship in which we ceded 100% of the policies written to the reinsurer, who was also responsible for managing the book of business. This book of business went into run-off in 2000. The reinsurer is currently responsible for the handling of claims. We receive estimates of direct loss and loss adjustment expense reserves on a monthly basis from the reinsurer, which we use in the course of estimating our own loss and loss adjustment expense reserves. We usually receive the monthly report within 10 business days from the close of the month. To our knowledge, there has been very little variation in the reinsurer’s reserve practices and methods. We review the data and evaluate using generally accepted actuarial loss and LAE reserving methodologies. The data is reconciled to the reinsurer’s Schedule F. There have been very few, if any, adjustments made to the data. At this time, we do not have (nor have there ever been) any disputes with this reinsurer, and we do not anticipate that our relationship with this unaffiliated reinsurer will have an impact on our financial position, due to our belief that this reinsurer’s financial strength is adequate (such belief is in part based upon and supported by the fact that the reinsurer is rated A- by A.M. Best).
We estimate IBNR losses and ultimate loss adjustment expenses quarterly using detailed statistical analyses and judgment including adjustment for deviations in trends caused by internal and external variables that may affect the resulting reserves. The underlying processes require the use of estimates and informed judgment, and as a result the establishment of loss and loss adjustment expenses reserves is an inherently uncertain process. The following generally accepted actuarial loss and LAE reserving methodologies are used in our analysis:
| • | Paid Loss Development — We use historical loss or loss adjustment expense payments over discrete periods of time to estimate future losses or loss adjustment expense. Paid development methods assume that the pattern of paid losses or loss adjustment expense occurring in past periods will recur for losses occurring in subsequent periods. |
| • | Incurred Loss Development — We use historical case incurred loss and loss adjustment expense (i.e., the sum of cumulative loss and loss adjustment expense payments plus outstanding case loss reserves) over discrete periods of time to estimate future losses. Incurred development methods assume that the case loss and loss adjustment expense reserving practices are consistently applied over time. |
36
Table of Contents
| • | Paid Bornhuetter/Ferguson — We use a combination of paid development methods and expected loss and loss adjustment expense methods. Expected loss ratio methods are based on the assumption that ultimate losses vary proportionately with premiums. Expected loss and loss adjustment expense ratios are typically developed based upon the information used in pricing and are multiplied by the total amount of premiums earned to calculate ultimate loss and loss adjustment expense. |
| • | Incurred Bornhuetter/Ferguson — We use a combination of incurred development methods and expected loss adjustment expense methods. Expected loss ratio methods are based on the assumption that ultimate losses vary proportionately with premiums. Expected loss and loss adjustment expense ratios are typically developed based upon the information used in pricing and are multiplied by the total amount of premiums earned to calculate ultimate loss and loss adjustment expense. |
| • | Frequency and Severity Methods — We use historical claim count development over discrete periods of time to estimate future claim count development. A ratio of ultimate claim counts to earned car years is applied to the ultimate dollars of loss per claim for each accident quarter. |
There are numerous factors, both internal and external, that we consider when evaluating the reasonableness of the various methods used to determine the actuarial best estimate of loss and loss adjustment expense reserves. Many of the factors vary for different states, programs, coverage groups, and accident periods. Some examples of internal factors considered are changes in product mix, changes in claims-handling practices, loss cost trends and underwriting standards and rules. External factors considered include frequency, severity, the effect of inflation on medical hospitalization, material repair and replacement costs, as well as general economic and legal trends. The majority of our customer base includes individuals with low disposable incomes, who have less money to spend as gas prices rise. As gas prices increase for a sustained period of time, consumers in general (and our customers in particular) change their driving habits to reduce gas consumption by car-pooling, using mass transit or simply by consolidating trips and driving less, which results in a decline in auto claims. Consequently, our frequency rates tend to improve as gas prices increase.
We track monthly the actual emergence of loss and loss adjustment expense data by accident period and compare it to the expected emergence. We review any deviations and determine if it is appropriate to revise any assumptions that they will use to develop loss and loss adjustment expense reserve estimates.
We review loss reserve adequacy quarterly by accident year at a state, program and coverage level. Carried reserves are adjusted as additional information becomes known. Such adjustments are reflected in our current year operations.
We determined that our historical loss and LAE reserve development does not provide the most reasonable indication of the potential variability associated with our reserves. Accordingly, we performed a sensitivity analysis of our loss and LAE reserve estimates based on potential variability of our carried loss reserves by accident period.
The variability surrounding the carried loss reserves diminishes for each accident period as the current accident year contains the greatest proportion of losses that have not been reported or settled, and these elements must be estimated as of the current reporting date. The proportion of losses with these characteristics diminishes in subsequent years. Applying a 95% confidence interval based on our paid loss development factors we have determined that the combined effects of adjustments to the initial estimate for loss reserves produce a range of -5.38% to 4.31%.
Applying the above potential variation to the December 31, 2008 estimate of ultimate loss reserves would yield an indication of sensitivity to held reserves from $(8.9) million to $7.1 million, generating an after-tax impact to net income of $(5.8) million to $4.6 million, respectively (assuming a 35% tax rate). The final outcome may fall below or above these amounts.
37
Table of Contents
There can be no assurance that actual future loss and LAE development variability will be consistent with any potential variation indicated by our historical loss and LAE development experience.
| • | Historically, one of the factors we considered in the course of estimating our reserves has included the input of several reinsurance companies, which we used in determining our initial provisional (expected) loss ratio to book the current treaty year loss ratio. Typically, this ratio has been monitored for adequacy, but not adjusted until 12 months after the beginning of each treaty period. At the time this process was implemented, we had a nominal amount of prior year experience to project ultimate loss reserves, which differed significantly by program. Additionally, we were in the process of developing a consistent set of practices within our claims organization, which reduced our ability to rely on historical patterns. As a result, we placed more weight on initial projected loss ratios than we do presently. |
| • | As more information has become available regarding the incurred and paid loss development patterns underlying these periods, the loss development patterns have proven reliable and the reserves have been adjusted to reflect the developed projected results. |
Valuation of available-for-sale investments. Our investments are recorded at fair value, which is typically based on publicly-available quoted prices. From time to time, the carrying value of our investments may be temporarily impaired because of the inherent volatility of publicly-traded investments. We do not adjust the carrying value of any investment unless management determines that the impairment of an investment’s value is other than temporary.
We conduct regular reviews to assess whether our investments are impaired and if any impairment is other than temporary. Factors considered by us in assessing whether an impairment is other than temporary include the credit quality of the investment, the duration of the impairment, our ability and intent to hold the investment until recovery or maturity and overall economic conditions. If we determine that the value of any investment is other-than-temporarily impaired, we record a charge against earnings in the amount of the impairment.
Gains and losses realized on the disposition of investment securities are determined on the specific identification basis and credited or charged to income. Premium and discount on investment securities are amortized and accreted using the interest method and charged or credited to investment income.
Valuation of trading investments. Our trading investment portfolio consists of fixed-income securities, which are carried at fair value with realized gains and losses reported in the current period’s earnings.
Valuation of goodwill and other intangible assets.We account for business combinations using the purchase method of accounting and accordingly, the assets and liabilities of the acquired entities are recorded at their estimated fair values at the date of acquisition. Goodwill represents the excess of the purchase price over the fair value of net assets, including the amount assigned to identifiable intangible assets. Identifiable intangible assets consist of brand names, agency relationships and non-competition agreements. Identifiable intangible assets that are determined to have a finite life are amortized over their useful lives, which range from two to twenty years. The results of operations of acquired businesses are included in our Consolidated Financial Statements from the respective dates of acquisition.
Goodwill and other intangible assets having an indefinite useful life are tested for impairment annually or more frequently if events or changes in circumstances indicate that the assets might be impaired. Intangible assets with finite lives are amortized over their useful lives and are periodically reviewed to ensure that no conditions exist indicating the recorded amount is not recoverable from future undiscounted cash flows.
We evaluate goodwill for impairment annually as of September 30, or more frequently if events or circumstances indicate that impairment may have occurred. Goodwill is evaluated for impairment by initially comparing an estimate of the fair value of the Company to its carrying value, including goodwill. If the Company’s estimated fair value exceeds its carrying value, then no impairment exists. When required, the second
38
Table of Contents
step of testing involves calculating the implied fair value of goodwill. The implied fair value of goodwill is determined in the same manner as the amount of goodwill recognized in a business combination, which is the excess of the fair value of the Company determined in step one over the fair value of the net assets and identifiable intangibles as if the Company were being acquired. If the amount of the goodwill allocated to the reporting unit exceeds the implied fair value of the goodwill in the pro forma purchase price allocation, an impairment charge is recorded for the excess. An impairment charge recognized cannot exceed the amount of goodwill and cannot be reversed subsequently even if the fair value increases.
Management applies significant judgment when determining the estimated fair value of the Company and when assessing the relationship of its market capitalization to its estimated fair value and book value. The valuation methodologies utilized are subject to key judgments and assumptions that are sensitive to change. Estimates of fair value are inherently uncertain and represent management’s reasonable expectation regarding future developments. These estimates and the judgments and assumptions upon which the estimates are based will, in all likelihood, differ in some respects from actual future results. Declines in estimated fair value could result in goodwill impairments in future periods which could materially adversely affect the Company’s results of operations or financial position.
Management considers current market conditions and operating results that may affect the estimated fair value of the Company as well as other data such as market capitalization to assess whether any goodwill impairment exists. Continued deteriorating or adverse market conditions may have a significant impact on the estimated fair value of the Company and could result in future impairments of goodwill.
Management believes that the current market displacement caused by the global credit crisis as well as the limited volume of its own shares that trade daily has resulted in the decrease in the Company’s market capitalization that is not representative of a long-term decrease in value.
Our annual impairment test as of September 30, 2008 was based on an evaluation using a discounted cash flow model based on our five-year financial forecast, which is developed internally by management. The forecast considers our experience during multi-year market cycles which have been observed when the insurance sector exhibited shifts between periods of constrained capital and excess capital. We believe these cycles will continue and that such assumptions are more meaningful rather than focusing on the results from a single year within the cycle. Market cycle results were averaged and used to estimate the value to perpetuity.
Key inputs in our valuation model are projected cash flows, future inflationary trends, future tax rates, and the risk-adjusted discount rate. The risk-adjusted discount rate was developed using a capital asset pricing model to estimate our weighted-average cost of capital. The relative mix of capital between debt and equity was estimated at 33.3 pct based on observed industry averages.
Based on the valuation model results, management concluded that goodwill was not impaired as the fair value of the Company exceeded its carrying value. Further, the fair value obtained from the discounted cash flow model was subject to a stress test by decreasing forecasted cash flows by 15%, and at the same time increasing the discount rate by 100 basis points to 15.3%. The indicated stress value was sufficient to cover the book value of the Company.
SFAS No. 142 requires annual testing of goodwill, and does not require interim testing unless, “an event occurs or circumstances change that would more likely than not reduce the fair value of a reporting unit below its carrying amount.” Examples of such events or circumstances include significant adverse changes in the business climate, a decision to sell or dispose of all or a significant portion of a reporting unit, or a significant decline in the Company’s stock price. At December 31, 2008, we evaluated the need to update our analysis of goodwill. Management considered its market capitalization in relation to its book value and believes that the overall decrease in the Company’s current market capitalization is not representative of a long-term decrease in the value of the Company. In arriving at this conclusion, management considered the global economic factors impacting
39
Table of Contents
the financial markets in general and the specific performance of the Company as indicated by written premium volumes as compared to plan during the recent months of economic decline. Management also evaluated whether any other events occurred or circumstances changed that would trigger the requirement of an interim impairment test of goodwill, and determined that there were none. Therefore no update of the goodwill impairment test was necessary at December 31, 2008.
Deferred income taxes.We account for taxes under the asset and liability method. Under this method, deferred income taxes are recognized for temporary differences between the financial statement and tax return bases of assets and liabilities. Any resulting future tax benefits are recognized to the extent that realization of such benefits is more likely than not, and a valuation allowance is established for any portion of a deferred tax asset that management believes will not be realized. The assessment of the need for a valuation allowance requires management to make estimates and assumptions about future earnings, reversal of existing temporary differences and available tax planning strategies. If actual experience differs from these estimates and assumptions, the recorded deferred tax asset may not be fully realized resulting in an increase to income tax expense in our results of operations. In addition, the ability to record deferred tax assets in the future could be limited resulting in a higher effective tax rate in that future period.
ADOPTION OF NEW ACCOUNTING STANDARDS
On January 1, 2008, we adopted the provisions of Statement of Financial Accounting Standards (SFAS) No. 157,Fair Value Measurements. SFAS No. 157 defines fair value to be the price that would be received to sell an asset or paid to transfer a liability in an orderly transaction between market participants at the measurement date and emphasizes that fair value is a market-based measurement, not an entity-specific measurement. SFAS No. 157 establishes a fair value hierarchy and expands disclosures about fair value measurements in both interim and annual periods. SFAS No. 157 is effective for fiscal years beginning after November 15, 2007 and interim periods within those fiscal years. In February 2008, the Financial Accounting Standards Board (FASB) issued FASB Staff Position No. FAS 157-1Applications of FASB Statement No. 157 to FASB Statement No. 13 and Other Accounting Pronouncements That Address Fair Value Measurements for Purpose of Lease Classification or Measurement under Statement 13(FSP 157-1) which removes leasing transactions from the scope of SFAS No. 157. FSP 157-1 is effective upon adoption of SFAS No. 157. In October 2008, the FASB issued FASB Staff Position 157-3,Determining the Fair Value of a Financial Asset When the Market for That Asset Is Not Active (FSP 157-3). FSP 157-3 clarifies the application of SFAS No. 157 in an inactive market and illustrates how an entity would determine fair value when the market for a financial asset is not active. FSP 157-3 is effective upon issuance and any revisions resulting from a change in valuation technique or its application will be accounted for as a change in accounting estimate. The adoption of SFAS No. 157, FSP 157-1 and FSP 157-3 did not have a material impact on our consolidated results of operations or financial condition.
On January 1, 2008, we also adopted the provisions of SFAS No. 159,Establishing the Fair Value Option for Financial Assets and Liabilities. SFAS No. 159 permits entities to choose to measure many financial instruments and certain other items at fair value. The objective is to improve financial reporting by providing entities with the opportunity to mitigate volatility in reported earnings caused by measuring related assets and liabilities differently without having to apply complex hedge accounting provisions. This statement is expected to expand the use of fair value measurement, which is consistent with the FASB’s long term measurement objectives for accounting for financial instruments. SFAS No. 159 applies to all entities and most of the provisions apply only to entities that elect the fair value option. SFAS No. 159 is effective for fiscal years beginning after November 15, 2007. The initial adoption of SFAS No. 159 did not have a material impact on our consolidated results of operations or financial condition.
RECENTLY ISSUED ACCOUNTING STANDARDS
In March 2008, the FASB issued SFAS No. 161,Disclosures about Derivative Instruments and Hedging Activities, an amendment to FASB Statement No. 133. SFAS No. 161 amends and expands the disclosure
40
Table of Contents
requirements of Statement 133 in order to provide users of financial statements with enhanced disclosures about an entity’s derivative and hedging activities and thereby improving the transparency of financial reporting. To meet these objectives, SFAS No. 161 requires qualitative disclosure about objectives and strategies for using derivatives, quantitative disclosures about fair value amounts of and gains and losses on derivative instruments, and disclosures about credit-risk-related contingent features in derivative agreements. SFAS No. 161 is effective for financial statements issued for fiscal years and interim periods beginning after November 15, 2008, with early application encouraged. We do not expect SFAS No. 161 to have a material impact on our consolidated results of operations or financial condition.
In February 2008, the FASB issued FASB Staff Position No. FAS 157-2,Effective Date of FASB Statement No. 157 (FSP 157-2), which delays the effective date of SFAS No. 157 for non-financial assets and non-financial liabilities, except for items that are recognized or disclosed at fair value in the financial statements on a recurring basis, at least annually to fiscal years beginning after November 15, 2008. Any amounts recognized upon adoption as a cumulative effect will be recorded to the opening balance of retained earnings in the year of adoption. We do not expect the adoption of FSP 157-2 to have a material impact on our consolidated results of operations or financial condition.
In December 2007, the FASB issued SFAS No. 141R,Business Combinations, which requires most identifiable assets, liabilities, non-controlling interests, and goodwill acquired in a business combination to be recorded at full fair value. SFAS No. 141R also requires, among other things, the acquisition costs to be expensed in the periods they are incurred, the contingent considerations resulting from events after the acquisition date to be measured and recognized at the acquisition date fair value with subsequent changes recognized in earnings, and the change in deferred tax benefit that are recognizable because of a business combination to be recognized either in income or directly in contributed capital in the period of business combination. SFAS No. 141R is effective for business combinations occurring after December 15, 2008. If we have business combinations after that date, SFAS No. 141R could have a material impact in the future on our consolidated results of operations or financial condition.
41
Table of Contents
RESULTS OF OPERATIONS
The following table sets forth the components of consolidated statements of income as a percentage of total revenues and certain operational information for the periods indicated (in thousands).
| Year Ended December 31, | ||||||||||||
| 2008 | 2007 | 2006 | ||||||||||
Revenues | ||||||||||||
Net premiums earned | 79.6 | % | 79.2 | % | 80.7 | % | ||||||
Commission income and fees | 17.6 | 17.6 | 17.1 | |||||||||
Net investment income | 3.1 | 3.3 | 2.4 | |||||||||
Net realized losses | (2.4 | ) | (0.1 | ) | (0.2 | ) | ||||||
Other income | 2.1 | — | — | |||||||||
Total revenues | 100.0 | 100.0 | 100.0 | |||||||||
Expenses | ||||||||||||
Losses and loss adjustment expenses | 61.1 | 57.9 | 51.9 | |||||||||
Selling, general and administrative expenses | 32.1 | 32.5 | 42.2 | |||||||||
Depreciation and amortization | 2.1 | 2.3 | 1.2 | |||||||||
Impairment of intangible assets | 1.0 | — | — | |||||||||
Interest expense | 4.1 | 5.0 | 1.2 | |||||||||
Total expenses | 100.4 | 97.7 | 96.5 | |||||||||
Income (loss) before income tax expense (benefit) | (0.4 | ) | 2.3 | 3.5 | ||||||||
Income tax expense (benefit) | (0.7 | ) | 0.4 | 0.8 | ||||||||
Net income | 0.3 | % | 1.9 | % | 2.7 | % | ||||||
Operational Information | ||||||||||||
Gross premiums written | $ | 385,059 | $ | 442,700 | $ | 286,180 | ||||||
Net premiums written | 340,388 | 407,567 | 284,807 | |||||||||
Percentage retained | 88.4 | % | 92.1 | % | 99.5 | % | ||||||
Loss ratio | 76.8 | % | 73.2 | % | 64.3 | % | ||||||
Expense ratio | 20.9 | 21.5 | 32.6 | |||||||||
Combined ratio | 97.7 | % | 94.7 | % | 96.9 | % | ||||||
Effective tax rate (benefit) | (174.3 | )% | 17.9 | % | 21.3 | % | ||||||
We are an insurance holding company engaged in the underwriting, servicing and distributing of non-standard personal automobile insurance policies and related products and services. We distribute our products through three distinct distribution channels: our owned retail stores, independent agents and unaffiliated managing general agencies. We generate earned premiums and fees from policyholders through the sale of our insurance products. In addition, through our owned retail stores, we sell insurance policies of third-party insurers and other products or services of unaffiliated third-party providers and thereby earn commission income from those third-party providers and insurers and fees from the customers.
As part of our corporate strategy, we treat our owned retail stores as independent agents, encouraging them to sell to their individual customers whatever products are most appropriate for and affordable to those customers. We believe that this offers our retail customers the best combination of service and value, developing stronger customer loyalty and improving customer retention. In practice, this means that in our owned retail stores, the relative proportion of the sales of our own insurance products as compared to the sales of the third-party policies will vary depending upon the competitiveness of our insurance products in the marketplace during the period. This reflects our intention of maintaining the margins in our insurance company subsidiaries, which may occur even at the cost of business lost to third-party carriers.
42
Table of Contents
The market conditions that existed for the past several years continued in 2008 putting downward pressure on industry rate levels. Our insurance company subsidiaries have continued developing and introducing new and better segmented products to serve our target markets during the past twelve months. In the aggregate, our rate level during 2008 modestly increased, as we continued to focus on seeking an appropriate balance between competitive positioning and profitability.
In the independent agency distribution channel and the unaffiliated underwriting agency distribution channel, the effect of competitive conditions is the same as in our owned retail store distribution channel. As in our retail stores, independent agents (either working directly with us or through unaffiliated underwriting agencies) not only offer our products but also offer their customers a selection of products by third-party carriers. Therefore, our insurance products must be competitive in pricing, features, commission rates and ease of sale or the independent agents will sell the products of those third-parties instead of our products. We believe that we are generally competitive in the markets we serve, and we constantly evaluate our products relative to those of other carriers.
Total revenues for 2008 decreased $51.1 million, or 10.2%, to $448.9 million from $500.0 million for 2007.
Premiums.One measurement of our performance is the level of gross premiums written and a second measurement is the relative proportion of premiums written through our three distribution channels. The following table displays our gross premiums written by distribution channel for the years ended December 31, 2008, 2007 and 2006 (in thousands):
| Year Ended December 31, | ||||||||||
| 2008 | 2007 | 2006 | ||||||||
Our underwriting agencies: | ||||||||||
Our retail agencies | $ | 233,967 | $ | 247,620 | $ | 86,760 | ||||
Independent agencies | 120,704 | 156,085 | 158,790 | |||||||
Subtotal | 354,671 | 403,705 | 245,550 | |||||||
Unaffiliated underwriting agencies | 30,389 | 38,990 | 40,588 | |||||||
Other | (1 | ) | 5 | 42 | ||||||
Total | $ | 385,059 | $ | 442,700 | $ | 286,180 | ||||
Total gross premiums written for 2008 decreased $57.6 million, or 13.0%, compared with 2007. The decrease was primarily due to macroeconomic effects and the insurance industry continued to experience a soft market. In our retail distribution channel, gross premiums written consist of premiums written for our affiliated insurance carriers’ products only and do not include premiums written for third-party insurance carriers in our retail and franchised stores. We earn commission income and fees in our retail distribution channel for sales of third-party insurance policies. Gross premiums written in our retail distribution channel decreased $13.6 million, or 5.5%, from 2007. In our independent agency distribution channel, gross premiums written for 2008 decreased $35.4 million, or 22.7%, compared with 2007. Gross premiums written by our unaffiliated agencies in 2008 decreased $8.6 million, or 22.1%, compared with 2007. For strategic reasons, we have chosen to reduce our emphasis on growth in the unaffiliated underwriting agencies distribution channel.
43
Table of Contents
The following table displays our gross premiums written by state for the years ended December 31, 2008, 2007 and 2006 (in thousands):
| Year Ended December 31, | |||||||||
| 2008 | 2007 | 2006 | |||||||
Louisiana | $ | 140,270 | $ | 144,576 | $ | — | |||
Texas | 66,006 | 69,397 | 79,084 | ||||||
Illinois | 52,604 | 66,650 | 66,826 | ||||||
California | 29,905 | 37,663 | 37,996 | ||||||
Alabama | 27,353 | 22,701 | — | ||||||
Florida | 20,619 | 29,744 | 21,150 | ||||||
Michigan | 16,292 | 22,940 | 19,689 | ||||||
Indiana | 9,848 | 13,126 | 18,027 | ||||||
Missouri | 9,514 | 15,842 | 12,184 | ||||||
South Carolina | 8,599 | 13,927 | 19,000 | ||||||
New Mexico | 3,565 | 4,802 | 9,590 | ||||||
Arizona | 258 | 826 | 1,594 | ||||||
Georgia | 226 | 372 | 551 | ||||||
Utah | — | 129 | 449 | ||||||
Other | — | 5 | 40 | ||||||
Total | $ | 385,059 | $ | 442,700 | $ | 286,180 | |||
The following table displays our net premiums written by distribution channel for 2008, 2007 and 2006 (in thousands):
| Year Ended December 31, | ||||||||||||
| 2008 | 2007 | 2006 | ||||||||||
Our underwriting agencies: | ||||||||||||
Retail agencies — gross premiums written | $ | 233,967 | $ | 247,620 | $ | 86,760 | ||||||
Ceded reinsurance | (41,881 | ) | (29,922 | ) | — | |||||||
Subtotal retail agencies net premiums written | 192,086 | 217,698 | 86,760 | |||||||||
Independent agencies — gross premiums written | 120,704 | 156,085 | 158,790 | |||||||||
Ceded reinsurance | (1,856 | ) | (3,583 | ) | (783 | ) | ||||||
Subtotal independent agencies net premiums written | 118,848 | 152,502 | 158,007 | |||||||||
Unaffiliated underwriting agencies — gross premiums written | 30,389 | 38,990 | 40,588 | |||||||||
Ceded reinsurance | (226 | ) | (372 | ) | (551 | ) | ||||||
Subtotal unaffiliated underwriting agencies net premium written | 30,163 | 38,618 | 40,037 | |||||||||
Catastrophe and contingent coverages with various reinsurers | (708 | ) | (1,183 | ) | — | |||||||
Other, net | (1 | ) | (68 | ) | 3 | |||||||
Total net premiums written | $ | 340,388 | $ | 407,567 | $ | 284,807 | ||||||
The following table sets forth net premiums earned by distribution channel for 2008, 2007 and 2006 (in thousands):
| Year Ended December 31, | |||||||||
| 2008 | 2007 | 2006 | |||||||
Our underwriting agencies | $ | 325,595 | $ | 356,064 | $ | 247,933 | |||
Unaffiliated underwriting agencies | 31,706 | 39,979 | 40,177 | ||||||
Net premiums earned | $ | 357,301 | $ | 396,043 | $ | 288,110 | |||
44
Table of Contents
The largest component of revenues is net premiums earned on our insurance policies. Net premiums earned for 2008 decreased $38.7 million, or 9.8%, compared with 2007. Since insurance premiums are earned over the life of the policies, the revenue in the current period includes premiums earned on insurance products written through our three distribution channels in both current and previous periods. This decline was due to the decline in gross written premiums. Net premiums earned during 2008 on policies sold through our affiliated underwriting agencies (including retail and independent agencies) decreased by $30.5 million, or 8.6%. Net premiums earned on insurance products sold through the unaffiliated underwriting agencies distribution channel decreased by $8.3 million, or 20.7%, compared with 2007.
Net premiums earned during 2007 on policies sold through our affiliated underwriting agencies (including retail and independent agencies) increased by $108.1 million, or 43.6%. This increase was due to the acquisition of USAgencies. Excluding USAgencies, which was acquired effective January 1, 2007, earned premiums declined by $14.2 million, or 5%, in 2007. Net premiums earned on insurance products sold through the unaffiliated underwriting agencies distribution channel decreased by $0.2 million, or 0.5%, compared with 2006.
Reinsurance. The following table reflects the premiums ceded and assumed under reinsurance agreements in our consolidated financial statements for the years ended December 31, 2008, 2007 and 2006 (in thousands):
| Year Ended December 31, | ||||||||||||
| 2008 | 2007 | 2006 | ||||||||||
Direct premiums written | $ | 324,826 | $ | 379,518 | $ | 201,132 | ||||||
Assumed premiums | 60,233 | 63,182 | 85,048 | |||||||||
Gross premiums written | 385,059 | 442,700 | 286,180 | |||||||||
Ceded premiums written | (44,671 | ) | (35,133 | ) | (1,373 | ) | ||||||
Net premiums written | $ | 340,388 | $ | 407,567 | $ | 284,807 | ||||||
In connection with the completion of the acquisition of USAgencies, we reevaluated their reinsurance program in light of the capital structure and risk management programs of the larger combined operations. As a result, terms were renegotiated with the reinsurer and a new quota-share reinsurance agreement was made effective April 1, 2007, under which the net retention increased from 30% to 75% in Louisiana and from 25% to 75% in Alabama on policies issued in those two states. Concurrently, we exercised our option to terminate the prior quota-share contracts on a cut-off basis. In April 2007, we received $31.0 million to settle the unearned premiums less return ceding commissions. Effective January 1, 2009, we terminated our quota-share reinsurance contract on a cut-off basis and received $7.8 million of returned unearned premiums net of returned ceding commissions.
Our quota-share ceding commission rate structure varies based on loss experience. The estimates of loss experience are continually reviewed and adjusted, and the resulting adjustments to ceding commissions are reflected in current operations.
The amount of recoveries pertaining to quota-share reinsurance contracts that were deducted from losses and loss adjustment expenses incurred during 2008 was approximately $31.3 million. The amount of loss reserves and unearned premium we would remain liable for in the event our reinsurers are unable to meet their obligations is as follows for the years ended December 31, 2008, 2007 and 2006 (in thousands):
| Year Ended December 31, | |||||||||
| 2008 | 2007 | 2006 | |||||||
Loss and loss adjustment expense | $ | 40,667 | $ | 46,854 | $ | 21,590 | |||
Unearned premiums | 11,037 | 11,371 | 1,221 | ||||||
Total | $ | 51,704 | $ | 58,225 | $ | 22,811 | |||
45
Table of Contents
The following table summarizes the ceded incurred losses and loss adjustment expenses (consisting of ceded paid losses and loss adjustment expenses and change in reserves for loss and loss adjustment expenses ceded) to various reinsurers for the years ended December 31, 2008, 2007 and 2006 (in thousands):
| Year Ended December 31, | |||||||||||
| 2008 | 2007 | 2006 | |||||||||
Paid losses and loss adjustment expenses ceded | $ | 37,445 | $ | 60,121 | $ | 6,518 | |||||
Change in loss and loss adjustment expense reserves ceded | (6,112 | ) | (18,406 | ) | 2,419 | ||||||
Incurred losses and loss adjustment expenses ceded | $ | 31,333 | $ | 41,715 | $ | 8,937 | |||||
The Michigan Catastrophic Claims Association (MCCA) is a reinsurance facility that covers no-fault medical losses above a specific retention amount. For policies effective July 1, 2008 to June 30, 2009, the required retention is $0.4 million. As a writer of personal automobile policies in the state of Michigan, we cede premiums and claims to the MCCA. Funding for MCCA comes from assessments against automobile insurers based upon their proportionate market share of the state’s automobile liability insurance market. Insurers are allowed to pass along this cost to Michigan automobile policyholders. Our ceded premiums written to the MCCA were $1.9 million, $3.6 million and $1.8 million in 2008, 2007 and 2006, respectively. We did not issue policies in Michigan prior to 2006.
Effective August 1, 2005, we entered into novation agreements with several unaffiliated reinsurers who participated in a quota-share reinsurance agreement in which we also participated. Pursuant to these agreements, we were substituted in place of these reinsurers assuming all rights, interests, liabilities and obligations related to the original quota-share reinsurance agreement. As a result of these novation agreements, our participation in the original reinsurance agreement increased from 5% to 100% effective August 1, 2005. In consideration for our assumption of their liabilities, these reinsurers agreed to pay us an amount equal to their share of the liabilities under the original quota-share agreement as of July 31, 2005. The terms of this reinsurance agreement did not meet the risk transfer requirements according to SFAS No. 113; therefore, this contract was accounted for as deposits according to the guidelines of SOP 98-7,Deposit Accounting for Insurance and Reinsurance Contracts that do not Transfer Insurance Risk. If the estimated deposit liabilities are less than the recorded liabilities, we record excess deposit liabilities as income based on a percentage of actual paid losses. We believe that this methodology approximates the effective interest method prescribed in SOP 98-7. Changes in the carrying amount of the deposit liability should be reported as income or expense as appropriate. We received cash in the amount of $14.2 million in relation to this novation. The deferred gain initially totaled $1.8 million, of which we recognized $0.1 million, $0.4 million, and $0.7 million in income for the years ended December 31, 2008, 2007, and 2006, respectively.
The guidance used in determining whether reinsurance contracts contain elements of risk transfer necessary to use reinsurance accounting is stated in paragraph 9 of SFAS No. 113. This paragraph provides that a reinsurer shall not be considered to have assumed significant insurance risk under the reinsurance contract if the probability of a significant variation in either the amount or timing of payments by the reinsurer is remote. SFAS No. 113 specifically provides that whenever a reinsurance contract does not transfer risk, then that reinsurance contract must be accounted for as a deposit-type reinsurance contract.
We evaluated the transaction and concluded that we did not assume significant insurance risk because the probability of a significant variation in the amount of payments by the reinsurers was remote. This was primarily due to a sliding scale profit commission payable by the reinsurer to us should there be favorable loss development. This profit commission made the likelihood very remote that the reinsurer would have any significant additional gain or loss on this block of business. The reinsurers will ultimately make the same payments, either to us from profit commission or for the full amount of losses and loss adjustment expenses. The combined cost to the reinsurer is the same. Consequently, since no significant risk was transferred, the use of deposit accounting was required and the use of reinsurance accounting was impermissible under SFAS No. 113. At December 31, 2008, there were no deposit assets and $0.4 million of deposit liabilities recorded on the balance sheet for this contract.
46
Table of Contents
Quota-share reinsurance for business produced through unaffiliated underwriting agencies is specific to each unaffiliated underwriting agency. We maintain control of the selection of reinsurers and the terms and conditions of reinsurance contracts.
Historically, all of our initial quota-share reinsurance agreements contained provisions for sliding scale commissions under which the commission paid to us varies with the loss ratio results under each contract. The effect of this feature in the quota-share reinsurance agreements is to limit the reinsurers’ aggregate exposure to loss and thereby reduce the ultimate cost to us as the ceding company. These features also have the effect of reducing the amount of protection relative to the quota-share amount of premiums ceded by us. Before entering into these reinsurance agreements, and based on our prior operating history, we concluded that each agreement met the risk transfer test of SFAS No. 113 as the reinsurers assume significant risk and have a reasonable possibility of a significant loss.
Commission Income and Fees.The following sets forth the components of consolidated commission income and fees earned for the years ended December 31, 2008, 2007 and 2006 (in thousands):
| Year Ended December 31, | ||||||||||
| 2008 | 2007 | 2006 | ||||||||
Income related to sales of our insurance products: | ||||||||||
Policyholder fee income | $ | 45,155 | $ | 51,203 | $ | 42,169 | ||||
Premium finance revenue | 19,270 | 19,832 | — | |||||||
Agency fees | 2,894 | 1,624 | 2,029 | |||||||
Subtotal | 67,319 | 72,659 | 44,198 | |||||||
Income related to sales of third-party products: | ||||||||||
Commissions and fees | 10,587 | 10,780 | 12,416 | |||||||
Agency fees | 1,838 | 2,253 | 727 | |||||||
Subtotal | 12,425 | 13,033 | 13,143 | |||||||
Other, net | (818 | ) | 2,454 | 3,654 | ||||||
Total commission income and fees | $ | 78,926 | $ | 88,146 | $ | 60,995 | ||||
Commission income and fees consists of (a) policy, installment, premium finance, franchise, royalty and agency fees earned for business written or assumed by our insurance companies both through independent agents and our retail agencies and (b) the commission income earned on sales of unaffiliated, third-party companies’ insurance polices or other products sold by our retail agencies. These various types of commission income and fees are impacted in different ways by the decisions we make in pursuing our corporate strategy.
Policy, installment, premium finance, franchise, royalty and agency fees are earned for business written or assumed by our insurance companies both through independent agents and our retail agencies. Policy, installment and agency fees are fees charged to the customers in connection with their purchase of coverage from our insurance company subsidiaries. Generally, we can increase or decrease agency and installment fees subject to limited regulatory restrictions, but policy fees and interest rates must be approved by the applicable state’s department of insurance. Premium finance fees are financing fees, which were primarily earned by our premium finance subsidiaries, and consist of interest and origination fees on our carriers’ policies that customers choose to finance. In December 2007, we began issuing premium finance contracts to our customers that obtain coverage from third-party carriers. Franchise and royalty fees are earned from our franchised stores in Florida, but are not significant to our financial results.
Commissions are earned on sales of third-party companies’ products sold by our retail agencies. As described above, in our owned retail stores, there can be a shift in the relative proportion of the sales of third-party insurance products as compared to sales of our own carriers’ products due to the relative competitiveness of
47
Table of Contents
our insurance products that could result in an increase in our commission income and fees from non-affiliated third-party insurers. We negotiate commission rates with the various third-party carriers whose products we agree to sell in our retail stores. As a result, the level of third-party commission income will also vary depending upon the mix by carrier of third-party products that are sold. In addition, we earn fees from the sales of other products and services such as tax preparation services, auto club memberships and bond cards offered by unaffiliated companies.
Commission income and fees decreased $9.2 million, or 10.5%, in 2008 compared with 2007. The decrease was primarily due to a decline in policyholder fees due to the decline in premium production. Commission income and fees related to sales of third-party insurance policies and products decreased $0.6 million, or 4.7%, in 2008 compared to 2007. This decrease was primarily due to the macroeconomic and soft market conditions that affected the Company’s own premium production.
Commission income and fees increased $27.2 million, or 44.5%, in 2007 compared with 2006. The increase was primarily attributable to the addition of income from policyholder and premium finance fees from USAgencies. Commission income and fees related to sales of third-party insurance policies and products for 2007 decreased 1.0% compared with 2006. In the second quarter of 2006, we reduced or eliminated our agency fees in our retail stores to reduce the cost to the customer of purchasing coverage from us. This increased the overall level of sales and thereby increased our commission income (when the product sold is a third-party carrier’s coverage) and earned premiums (when the product sold is our insurance company subsidiaries’ coverage). In the fourth quarter of 2006, we reinstituted certain agency fees but at a moderate level compared with the first half of 2006.
Net Investment Income and Other Income.At December 31, 2008, our fixed-income investments were invested in the following: U.S. Government and agencies securities 11.1%, corporate securities 0.4%, mortgage-backed securities 2.4%, and tax-exempt securities 86.1%. As of December 31, 2008, all of our fixed-income securities were rated “A” or better by nationally recognized statistical rating organizations. We attempt to mitigate interest rate risk by managing the duration of our fixed-income portfolio to a target range of three years or less. As of December 31, 2008, the effective duration of our fixed-income investment portfolio was 1.58 years.
Our investment strategy is to conservatively manage our investment portfolio by investing in readily marketable, investment-grade, fixed-income securities. We currently do not invest in common equity securities and we have no exposure to foreign currency risk. The Investment Committee of our Board of Directors has established investment guidelines and periodically reviews portfolio performance for compliance with our guidelines.
Net investment income for 2008 decreased $2.7 million, or 16.4%, compared with 2007. The decrease was primarily due to a 8.1% decrease in total average invested assets to $305.2 million during 2008 from $332.2 million during 2007. The average investment yield was 3.44% (4.75% on a taxable equivalent basis) in 2008 as compared to 3.59% (5.05% on taxable equivalent basis) in 2007.
Net investment income for 2007 increased $7.6 million, or 86.2%, compared with 2006. The increase was primarily a result of a 45.4% increase in total average invested assets to $332.2 million during 2007 from $228.5 million during 2006, as a result of the acquisition of USAgencies. The average investment yield was 3.59% (5.05% on a taxable equivalent basis) for 2007 as compared to 3.70% (5.33% on a taxable equivalent basis) for 2006.
As of December 31, 2008, we held $51.3 million par value and $40.2 million fair value of auction-rate tax-exempt securities. Generally, the interest rates for these securities are determined by bidding every 7, 28 or 35 days. When there are more sellers than buyers, an auction fails and bondholders that want to sell are left holding the securities. Auctions for these securities began to fail in late January 2008. Issuers remain obligated to
48
Table of Contents
pay interest and principal when due when an auction fails. Rates at failed auctions are set at a level established in the terms of the debt. In mid-February 2008, investment banks stopped committing capital to the auctions and there have been widespread auctions failures since that time.
In August 2008, our broker announced settlements in principle with each of the Division Enforcement of the U.S. Securities and Exchange Commission (SEC), the New York Attorney General and other state agencies to purchase all of its clients’ auction-rate securities at par and several other items including fines. In October 2008, our broker filed a prospectus with the SEC, which published a legally-binding offer to all authorized holders of auction-rate securities in our broker’s accounts (“the settlement”). The majority of our auction-rate securities qualify under the terms of our broker’s prospectus. The time frames that our broker has set for buybacks have different start dates based upon the individual client’s size, which is determined by each client’s balance of investments held at our broker. For the majority of our auction-rate holdings, the buybacks are expected to occur between July 2010 and two years thereafter. In November 2008, the Company elected to participate in our broker’s offer to purchase our auction-rate securities at par. In November 2008, we classified our portfolio of auction-rate securities as trading and recorded a realized loss of $11.1 million for the difference in fair value and carrying amount. The fair value of the settlement was $9.6 million which we elected to report in other assets with changes in fair value reported in other income.
Losses and Loss Adjustment Expenses.Losses and loss adjustment expenses for 2008 decreased $15.3 million, or 5.3%, compared with 2007. The percentage of losses and loss adjustment expense to net premiums earned was 76.8% in 2008 compared with 73.2% in 2007. The following table displays the impact of hurricane loss and loss development related to prior periods’ business on our loss ratio for the years ended December 31, 2008, 2007 and 2006:
| Year Ended December 31, | |||||||||
| 2008 | 2007 | 2006 | |||||||
Loss ratio — current accident year, excluding hurricane losses | 75.1 | % | 74.5 | % | 68.2 | % | |||
Hurricane losses | 0.6 | — | — | ||||||
Adverse (favorable) loss ratio development — prior accident year | 1.1 | (1.3 | ) | (3.9 | ) | ||||
Reported loss ratio | 76.8 | % | 73.2 | % | 64.3 | % | |||
The loss ratio for the year (losses and loss adjustment expenses divided by net premiums earned) increased to 76.8% in 2008, compared with 73.2% in 2007, primarily due to increased losses from Florida policies. The Florida losses were the result of our decision to push the full coverage product in Florida in 2007 in response to the Personal Injury Protection (PIP) sunset in that state on October 1, 2007. Inadequate pricing and product management produced significantly higher losses than anticipated. We have drastically reduced the production of this product by restricting writings by agent, territory and coverage based on where significant loss ratio swings occurred. In addition, the Company had $2.5 million in losses in 2008 related to Hurricanes Gustav and Ike.
Our losses and loss adjustment expenses are a blend of the specific estimated and actual costs of providing the coverage contracted by the purchasers of our insurance policies. We maintain reserves to cover our estimated ultimate liability for losses and related loss adjustment expenses for both reported and unreported claims on the insurance policies issued by our insurance companies. The establishment of appropriate reserves is an inherently uncertain process, involving actuarial and statistical projections of what we expect to be the cost of the ultimate settlement and administration of claims based on historical claims information, estimates of future trends in claims severity and other variable factors such as inflation. Due to the inherent uncertainty of estimating reserves, reserve estimates can be expected to vary from period to period. To the extent that our reserves prove to be inadequate in the future, we would be required to increase our reserves for losses and loss adjustment expenses and incur a charge to earnings in the period during which such reserves are increased. The historic development of our reserves for losses and loss adjustment expenses is not necessarily indicative of future trends in the development of these amounts.
49
Table of Contents
If existing estimates of the ultimate liability for losses and related loss adjustment expenses are lowered, then that favorable development is recognized in the subsequent period in which the reserves are reduced. This has the effect of benefiting that subsequent period, when the aggregate losses and loss adjustment expenses (reflecting the favorable development related to previously reported earned premiums) are reduced relative to that period’s earned premium. Although the favorable development must be included in that subsequent period’s financial statements, it is appropriate for measurement purposes to compare only the losses and loss adjustment expenses related to any specific period’s earned premiums in evaluating performance during that particular period. Excluding the Florida policies previously mentioned, we experienced frequency indications that were flat compared to prior year selections and severity trends of low single digits on an aggregate basis. In a period of stable premium rates, these trends would have resulted in generally stable loss ratios (the ratio of losses and loss adjustment expenses to earned premiums).
The following table provides a reconciliation of the beginning and ending reserves for unpaid losses and loss adjustment expenses, for the periods indicated (in thousands):
| Year Ended December 31, | |||||||||||
| 2008 | 2007 | 2006 | |||||||||
Gross balance at beginning of year | $ | 227,947 | $ | 162,569 | $ | 142,977 | |||||
Less: Reinsurance recoverable | 46,854 | 21,590 | 19,169 | ||||||||
Less: Deposits | 349 | 2,558 | 7,699 | ||||||||
Net balance at beginning of year | 180,744 | 138,421 | 116,109 | ||||||||
Acquisition of USAgencies | — | 27,810 | — | ||||||||
Adjusted reserves, net of reinsurance | 180,744 | 166,231 | 116,109 | ||||||||
Incurred related to: | |||||||||||
Current year | 270,665 | 294,747 | 190,580 | ||||||||
Prior year | 3,726 | (5,023 | ) | (5,234 | ) | ||||||
Paid related to: | |||||||||||
Current year | 164,690 | 175,976 | 100,319 | ||||||||
Prior year | 126,991 | 99,235 | 62,715 | ||||||||
Net balance at the end of year | 163,454 | 180,744 | 138,421 | ||||||||
Reinsurance recoverable | 40,667 | 46,854 | 21,590 | ||||||||
Deposits | 516 | 349 | 2,558 | ||||||||
Gross balance at the end of year | $ | 204,637 | $ | 227,947 | $ | 162,569 | |||||
Our losses, loss adjustment expense reserves and deposit liabilities of $204.6 million on a gross basis and $163.5 million on a net basis are our best estimates as of December 31, 2008. The analysis provided by our internal valuation methods indicated that the expected range for the ultimate liability for our losses and loss adjustment expense reserves, as of December 31, 2008, was between $188.3 million and $217.6 million on a gross basis and between $154.3 million and $178.6 million on a net basis.
The following table presents the development of reserves for unpaid losses and loss adjustment expenses from 1998 through 2008 for our insurance company subsidiaries, net of reinsurance recoveries or recoverables. The first line of the table presents the reserves at December 31 for each indicated year. This represents the estimated amounts of losses and loss adjustment expenses for claims arising in that year and all prior years that are unpaid at the balance sheet date, including losses incurred but not reported to us. The upper portion of the table presents the cumulative amounts subsequently paid as of successive years with respect to those claims. The lower portion of the table presents an update of the estimated amount of the previously recorded reserves based upon the experience as of the end of each succeeding year. The estimates are revised as more information becomes known about the payments, frequency and severity of claims for individual years. A redundancy (deficiency) exists when the reestimated reserves at each December 31 is less (greater) than the prior reserve
50
Table of Contents
estimate. The cumulative redundancy (deficiency) depicted in the table, for any particular calendar year, represents the aggregate change in the initial estimates over all subsequent calendar years.
Our historical net liabilities for losses and loss adjustment expenses are impacted by our 100% quota-share reinsurance contract with VFIC. Beginning in 1997, our insurance companies reinsured 100% of the business they wrote to VFIC. During 1999 and 2000, one of our insurance companies retained a small book of business, but continued ceding a majority of its business to VFIC. For the years 2001, 2002 and 2003 we reinsured 100% of business written or assumed by our insurance companies to VFIC. The following table summarizes the development of reserves for unpaid losses and loss adjustment expenses (in thousands).
| 1998 | 1999 | 2000 | 2001 | 2002 | 2003 | 2004 | 2005 | 2006 | 2007 | 2008 | |||||||||||||||||||||||||
Net liability for unpaid losses and LAE: | |||||||||||||||||||||||||||||||||||
Originally estimated | $ | — | $ | 1,215 | $ | 3,493 | $ | — | $ | — | $ | — | $ | 55,500 | $ | 116,109 | $ | 138,421 | $ | 180,744 | $ | 163,454 | |||||||||||||
Reserve adjustment from acquisition of USAgencies | — | — | — | — | — | — | — | — | 27,810 | — | — | ||||||||||||||||||||||||
Adjusted reserves, net of reinsurance | — | 1,215 | 3,493 | — | — | — | 55,500 | 116,109 | 166,231 | 180,744 | 163,454 | ||||||||||||||||||||||||
Cumulative paid as of December 31, | |||||||||||||||||||||||||||||||||||
One year later | — | 1,210 | 3,493 | — | — | — | 17,396 | 62,715 | 99,235 | 126,991 | |||||||||||||||||||||||||
Two years later | — | 1,339 | 3,493 | — | — | — | 31,194 | 83,974 | 131,873 | ||||||||||||||||||||||||||
Three years later | — | 1,339 | 3,493 | — | — | — | 39,686 | 94,879 | |||||||||||||||||||||||||||
Four years later | — | 1,339 | 3,493 | — | — | — | 43,106 | ||||||||||||||||||||||||||||
Five years later | — | 1,339 | 3,493 | — | — | — | |||||||||||||||||||||||||||||
Six years later | — | 1,339 | 3,493 | — | — | ||||||||||||||||||||||||||||||
Seven years later | — | 1,339 | 3,493 | — | |||||||||||||||||||||||||||||||
Eight years later | — | 1,339 | 3,493 | ||||||||||||||||||||||||||||||||
Nine years later | — | 1,339 | |||||||||||||||||||||||||||||||||
Ten years later | |||||||||||||||||||||||||||||||||||
Liability re-estimated as of December 31, | |||||||||||||||||||||||||||||||||||
One year later | — | 1,339 | 3,493 | — | — | — | 46,948 | 110,875 | 161,208 | 184,470 | N/A | ||||||||||||||||||||||||
Two years later | — | 1,339 | 3,493 | — | — | — | 47,417 | 109,193 | 161,734 | ||||||||||||||||||||||||||
Three years later | — | 1,339 | 3,493 | — | — | — | 48,404 | 110,015 | |||||||||||||||||||||||||||
Four years later | — | 1,339 | 3,493 | — | — | — | 48,452 | ||||||||||||||||||||||||||||
Five years later | — | 1,339 | 3,493 | — | — | — | |||||||||||||||||||||||||||||
Six years later | — | 1,339 | 3,493 | — | — | ||||||||||||||||||||||||||||||
Seven years later | — | 1,339 | 3,493 | — | |||||||||||||||||||||||||||||||
Eight years later | — | 1,339 | 3,493 | ||||||||||||||||||||||||||||||||
Nine years later | — | 1,339 | |||||||||||||||||||||||||||||||||
Ten years later | |||||||||||||||||||||||||||||||||||
Net cumulative redundancy/ (deficiency) | $ | — | $ | (124 | ) | $ | — | $ | — | $ | — | $ | — | $ | 7,048 | $ | 6,094 | $ | 4,497 | $ | (3,726 | ) | N/A | ||||||||||||
51
Table of Contents
The following table is a reconciliation of our net liability to our gross liability for losses and loss adjustment expenses (in thousands):
| 1998 | 1999 | 2000 | 2001 | 2002 | 2003 | 2004 | 2005 | 2006 | 2007 | 2008 | |||||||||||||||||||||||||||
As originally estimated: | |||||||||||||||||||||||||||||||||||||
Net liability shown above | $ | — | $ | 1,215 | $ | 3,493 | $ | — | $ | — | $ | — | $ | 55,500 | $ | 116,109 | $ | 138,421 | $ | 180,744 | $ | 163,454 | |||||||||||||||
Add reinsurance recoverable | 71,338 | 65,693 | 46,818 | 43,345 | 64,677 | 58,507 | 43,363 | 19,169 | 21,590 | 46,854 | 40,667 | ||||||||||||||||||||||||||
Gross liability | 71,338 | 66,908 | 50,311 | 43,345 | 64,677 | 58,507 | 98,863 | 135,278 | 160,011 | 227,598 | 204,121 | ||||||||||||||||||||||||||
Adjusted for acquisition of USAgencies | — | — | — | — | — | — | — | — | 71,522 | — | — | ||||||||||||||||||||||||||
Adjusted gross liability | 71,338 | 66,908 | 50,311 | 43,345 | 64,677 | 58,507 | 98,863 | 135,278 | 231,533 | 227,598 | 204,121 | ||||||||||||||||||||||||||
As re-estimated as of December 31, 2008 | |||||||||||||||||||||||||||||||||||||
Net liability shown above | — | 1,339 | 3,493 | — | — | — | 48,452 | 110,015 | 161,734 | 184,470 | |||||||||||||||||||||||||||
Add reinsurance recoverable | 62,227 | 62,128 | 55,737 | 50,035 | 70,903 | 52,697 | 41,802 | 16,583 | 60,294 | 44,051 | |||||||||||||||||||||||||||
Gross liability | 62,227 | 63,467 | 59,230 | 50,035 | 70,903 | 52,697 | 90,254 | 126,598 | 222,028 | 228,521 | |||||||||||||||||||||||||||
Gross cumulative redundancy/(deficiency) | $ | 9,111 | $ | 3,441 | $ | (8,919 | ) | $ | (6,690 | ) | $ | (6,226 | ) | $ | 5,810 | $ | 8,609 | $ | 8,680 | $ | 9,505 | $ | (923 | ) | |||||||||||||
As a result of the 100% quota-share reinsurance contract with VFIC, all losses and loss adjustment expense reserves of our insurance companies as of December 31, 2003 were reinsured by VFIC. In addition, VFIC remains liable for all losses and loss adjustment expenses for losses occurring on or prior to December 31, 2003.
Selling, General and Administrative Expenses.Another measurement of our performance that addresses our overall efficiency is the level of selling, general and administrative expenses. We recognize that our customers are primarily motivated by low prices. As a result, we strive to keep our costs as low as possible to be able to keep our prices affordable and thus to maximize our sales while still maintaining profitability. Our selling, general and administrative expenses include not only the cost of acquiring the insurance policies through our insurance company subsidiaries (the amortization of the deferred acquisition costs) and managing our insurance company subsidiaries and the retail stores, but also the costs of the holding company. The largest component of selling, general and administrative expenses is personnel costs, including payroll, benefits and accrued bonus expenses.
Deferred policy acquisition costs represent the deferral of expenses that we incur in acquiring new business or renewing existing business. Policy acquisition costs, consisting of primarily commission, advertising, premium taxes, underwriting and retail agency expenses, are initially deferred and then charged against income ratably over the terms of the related policies through amortization of the deferred policy acquisition costs. Thus, the amortization of deferred acquisition costs is correlated with earned premium and the ratio of amortization of deferred acquisition costs to earned premium in an accounting period is another measurement of performance. The cost of policy acquisition (amortization of deferred policy acquisition costs) is the largest component of deferred acquisition costs.
52
Table of Contents
The following table sets forth the impact that amortization of deferred acquisition costs had on selling, general and administrative expenses and the change in deferred acquisition costs for the years ended December 31, 2008, 2007 and 2006 (in thousands):
| Year Ended December 31, | ||||||||||||
| 2008 | 2007 | 2006 | ||||||||||
Amortization of deferred acquisition costs | $ | 72,245 | $ | 70,182 | $ | 73,812 | ||||||
Other selling, general and administrative expenses | 72,024 | 92,034 | 76,728 | |||||||||
Total selling, general and administrative expenses | $ | 144,269 | $ | 162,216 | $ | 150,540 | ||||||
Total selling, general and administrative expenses as a percentage of net premiums earned | 40.4 | % | 41.0 | % | 52.3 | % | ||||||
Beginning deferred acquisition costs | $ | 24,536 | $ | 23,865 | $ | 24,453 | ||||||
Additions | 69,702 | 70,853 | 73,224 | |||||||||
Amortization | (72,245 | ) | (70,182 | ) | (73,812 | ) | ||||||
Ending deferred acquisition costs | $ | 21,993 | $ | 24,536 | $ | 23,865 | ||||||
Amortization of deferred acquisition costs as a percentage of net premiums earned | 20.2 | % | 17.7 | % | 25.6 | % | ||||||
The amortization of deferred acquisition costs as a percentage of net premiums earned increased in 2008 to 20.2% from 17.7% in 2007. The increase is primarily due to the impact of purchase accounting, related to the acquisition of USAgencies, reducing both the earned premiums and amortization of deferred acquisition costs in 2007. This was due to the deferred acquisition costs for policies in force at the date of acquisition being included in unearned premiums. Due to this accounting treatment in 2007, both premiums and amortization of deferred acquisition costs in 2008 were expected to increase compared with 2007 with no net impact on income.
Net expenses, defined as the sum of selling, general and administrative expenses and depreciation and amortization less commission income and fees, as a percentage of net premiums earned (the net expense ratio) decreased to 20.9% in 2008 compared with 21.5% in 2007. The decrease was primarily due to an 11.1% decrease in selling, general and administrative expenses. The following table sets forth the components of the net expenses and the computation of the net expense ratios for the years ended December 31, 2008, 2007 and 2006 (in thousands):
| Year Ended December 31, | ||||||||||||
| 2008 | 2007 | 2006 | ||||||||||
Selling, general and administrative expenses | $ | 144,269 | $ | 162,216 | $ | 150,540 | ||||||
Depreciation and amortization | 9,187 | 11,260 | 4,398 | |||||||||
Less: commission income and fees | (78,926 | ) | (88,146 | ) | (60,995 | ) | ||||||
Net expenses | $ | 74,530 | $ | 85,330 | $ | 93,943 | ||||||
Net premiums earned | $ | 357,301 | $ | 396,043 | $ | 288,110 | ||||||
Net expense ratio | 20.9 | % | 21.5 | % | 32.6 | % | ||||||
Selling, general and administrative expenses for 2008 decreased $17.9 million, or 11.1%, compared with 2007. The overall decrease in selling, general and administrative expenses was primarily due to a reduction in operating expenses primarily due to the decline in premium value and management’s efforts to reduce expenses in response to the premium decline.
Selling, general and administrative expenses for 2007 increased $11.7 million, or 7.8%, compared with 2006 largely due to the inclusion of USAgencies’ expenses in our operating results. In addition, other items affecting
53
Table of Contents
the comparability of the 2007 results to the 2006 results consisted of $1.9 million in IT costs in 2007 related to our strategic systems transformation project, $785,000 in IT expenses related to the migration of our data center and $280,000 for the write-off of software costs deemed to be of no future value. In addition, we expensed $11.5 million in 2007 in connection with the IT outsourcing contract. The combined total of the IT outsourcing expense (which excludes the transformation and data center migration costs) and our continuing IT operating expenses in 2007 exceeded the cost of our IT operations in 2006 by approximately $2.0 million. In the fourth quarter of 2007, a commission liability was reduced by $1.7 million to reflect the appropriate amount of the liability.
During 2006, we developed a comprehensive implementation plan and supporting business case to consolidate and transform our primary business applications onto a new strategic platform. This plan encompasses consolidating and migrating our multiple claims, point-of-sale and policy administration systems onto single strategic platforms, as well as deploying new premium finance, reporting and business analytics capabilities. For all components of this systems transformation plan, we have selected a software package that we will configure and integrate to meet our unique needs. We believe this systems transformation will position us to realize significant strategic benefits including: systemic pricing advantage in our marketplace via consolidated and streamlined systems and operations; faster product time to market; additional retail revenue via premium financing; improved claims and underwriting performance via increased automated application of best practice processing rules; a platform to simplify and hasten post-merger and acquisition integration-reducing integration costs and accelerating synergies realization; and improved customer focus and retention. Through December 31, 2008, we have capitalized $35.8 million of costs related to the transformation. The agency management and premium finance systems were fully implemented in the first quarter of 2008. The insurance systems began to be implemented in June 2008 with the claims system implemented to support all of our operations except for our Louisiana and Alabama operations in 2008. We are in the process of converting all remaining open claims from the legacy system to the new system. For the new policy administration system, we plan to operate the legacy systems through the policies’ renewal dates when they will be converted to the new system. This will result in additional operating expense until the legacy systems can be retired.
Depreciation and Amortization.Depreciation and amortization expenses for 2008 decreased $2.1 million, or 18.4%, compared with 2007. Depreciation expense increased by $2.0 million or 36.9%. The increase was primarily due to the implementation of the agency management, premium finance and insurance systems. Amortization expense decreased $4.1 million or 69.8% for the current period. The decrease is primarily a result of agreements that were fully amortized in 2007.
Depreciation and amortization expenses for 2007 increased $6.9 million, or 156.0%, compared with 2006. Depreciation expense increased by $2.5 million and amortization expense increased by $4.4 million for 2007, primarily as a result of the acquisition accounting for USAgencies. The USAgencies-related costs consisted of the amortization for the intangible costs of trade name, non-competition agreement and agency relationships determined as required by purchase accounting.
Other Intangible Asset Impairment Charges. The Company incurred an impairment charge of $4.6 million in the third quarter of 2008 resulting from its annual review of goodwill and other intangible assets. Based on its assessment, the Company concluded that the carrying value of other intangible assets exceeded its fair value for the Florida operations.
Interest Expense.Interest expense for 2008 decreased $6.7 million, or 26.6%, compared with 2007. The decrease in interest expense was due to the lower level of average debt outstanding. The average balance of our senior secured credit facility was $152.8 million during 2008, a decrease of $46.3 million, or 23.3%, from the average balance during 2007. In 2008, we repaid $66.3 million of the senior secured facility. In January 2008, we entered into an additional interest rate swap with a notional amount of $95.0 million that was also designated a hedge of variable cash flows associated with the senior term loan. The notional amount of the swap gradually declines to $40.0 million prior to its expiration. For this swap, we pay a fixed rate of 3.031% and receive a three-month LIBOR rate. In the second quarter of 2008, the notional amount of the swap was reduced by $5.0 million for a $60,000 gain.
54
Table of Contents
Interest expense for 2007 increased $20.7 million compared with 2006. The increase in interest expense was due to the debt we incurred for the acquisition of USAgencies.
Income Taxes.Income tax benefit for 2008 was $3.4 million, or an effective rate of 174.3%, compared with income tax expense of $2.1 million, or an effective rate of 17.9%, for 2007. The increase in the effective tax rate was due to the pretax loss in 2008 and the relatively high proportion of the investment income generated by the tax-exempt securities in our investment portfolio.
Income tax expense for 2007 was $2.1 million, or an effective rate of 17.9%, compared with income tax expense of $2.7 million, or an effective rate of 21.3%, for 2006. The lower effective tax rate for 2007 was primarily due to the relatively high proportion of the investment income generated by the tax-exempt securities in our investment portfolio.
Minority Interest.Minority interest, net of income tax expense, was $81.0 million for 2006. We purchased the remaining 27.0% interest in our Florida underwriting agency from the minority holders in March 2006.
LIQUIDITY AND CAPITAL RESOURCES
Sources and uses of funds.We are a holding company with no business operations of our own. Consequently, our ability to pay dividends to stockholders, meet our debt payment obligations and pay our taxes and administrative expenses is largely dependent on dividends or other distributions from our subsidiaries.
There are no restrictions on the payment of dividends by our non-insurance company subsidiaries other than state corporate laws regarding solvency. As a result, our non-insurance company subsidiaries generate revenues, profits and net cash flows that are generally unrestricted as to their availability for the payment of dividends and we have and expect to continue to use those revenues to service our corporate financial obligations, such as debt service and stockholder dividends. As of December 31, 2008, we had $2.9 million of cash and equivalents at the holding company level and $4.2 million of cash and cash equivalents at our non-insurance company subsidiaries.
State insurance laws restrict the ability of our insurance company subsidiaries to declare stockholder dividends. These subsidiaries may not make an “extraordinary dividend” until 30 days after the applicable commissioner of insurance has received notice of the intended dividend and has not objected in such time or until the commissioner has approved the payment of the extraordinary dividend within the 30-day period. In most states, an extraordinary dividend is defined as any dividend or distribution of cash or other property whose fair market value, together with that of other dividends and distributions made within the preceding 12 months, exceeds the greater of 10.0% of the insurance company’s surplus as of the preceding year-end or the insurance company’s net income for the preceding year, in each case determined in accordance with statutory accounting practices. In addition, dividends may only be paid from unassigned earnings and an insurance company’s remaining surplus must be both reasonable in relation to its outstanding liabilities and adequate to its financial needs. As of December 31, 2008, our insurance companies could not pay ordinary dividends to us without prior regulatory approval due to a negative unassigned surplus position. However, as mentioned previously, our nonregulated entities provide adequate cash flow to fund their own operations. Dividend payments of $7.3 million were received from our insurance company subsidiaries in 2008. In February 2009, we obtained approval from the New York Department of Insurance for one of our insurance subsidiaries to retire one million shares of its stock for $2.9 million and approved payment of an extraordinary dividend for $100,000.
The National Association of Insurance Commissioners’ model law for risk-based capital provides formulas to determine the amount of capital that an insurance company needs to ensure that it has an acceptable expectation of not becoming financially impaired. At December 31, 2008, each of our insurance subsidiaries maintained a risk-based capital level that was in excess of an amount that would require any corrective actions on our part.
55
Table of Contents
Our operating subsidiaries’ primary sources of funds are premiums received, commission and fee income, investment income and the proceeds from the sale and maturity of investments. Funds are used to pay claims and operating expenses, to purchase investments and to pay dividends to our holding company.
We believe that existing cash and investment balances, as well as new cash flows generated from operations and available borrowings under our other credit facilities, will be adequate to meet our capital and liquidity needs during the 12-month period following the date of this report at both the holding company and insurance company levels. We do not currently know of any events that could cause a material increase or decrease in our long-term liquidity needs other than the capital expenditures related to our strategic systems consolidation and transformation program and the debt service requirements of the senior secured credit facility to fund the acquisition of USAgencies.
Senior secured credit facility. In 2007, we entered into a $220.0 million senior secured credit facility (the facility) provided by a syndicate of lenders, that provide for a $200.0 million senior term loan facility and a revolving facility of up to $20.0 million, depending on our borrowing capacity. The principal amount of the term loan is payable in quarterly installments of $0.3 million, with the remaining balance due January 31, 2014. Beginning in 2008, we were also required to make additional annual principal payments that are calculated based upon our financial performance during the preceding fiscal year. In addition, certain events, such as the sale of material assets or the issuance of significant new equity, necessitate additional required principal repayments. During 2008, we made $66.3 million in principal payments. As of December 31, 2008, we had no borrowings under the revolving portion of the facility.
Our obligations under the facility are guaranteed by our material operating subsidiaries (other than our insurance companies) and are secured by a first lien security interest on all of our assets and the assets of our material operating subsidiaries (other than our insurance companies), including a pledge of 100% of the stock of AIC. The facility contained certain financial covenants, which included capital expenditure limitations, minimum interest coverage requirements, maximum leverage ratio requirements, minimum risk-based capital requirements, maximum combined ratio limitations, minimum fixed charge coverage ratios and a minimum consolidated net worth requirement, as well as other restrictive covenants. At December 31, 2008, we were in compliance with all of our financial and other covenants.
On March 27, 2009, we entered into an amendment to the facility. The amendment included the following changes:
| • | The leverage ratio covenant calculation has been changed to include only amounts borrowed under the facility. In addition, the quarterly requirements have been changed for the remaining term of the facility. |
| • | The interest coverage ratio covenant calculation has been changed to include only interest expense paid in cash. In addition, the quarterly requirements have been changed for the remaining term of the facility. |
| • | The combined ratio covenant has been replaced with a loss ratio covenant. |
| • | The fixed charge coverage ratio covenant calculation has been changed to include only interest expense paid in cash. In addition, the annual requirements have been changed for the remaining term of the facility. |
| • | The consolidated net worth covenant calculation has been changed to a covenant that excludes goodwill and includes subordinated debt. |
| • | Asset sales are now allowed for transactions with less than 80% of cash proceeds. Financing is limited to $5 million per transaction and $10 million in the aggregate. |
| • | A sale and leaseback transaction of capitalized technology assets is allowed for up to $30 million. |
56
Table of Contents
| • | The pricing under the agreement has been changed as follows: |
| ¡ | A LIBOR floor of 3.0% has been established. |
| ¡ | Pricing depends on the amount of the leverage ratio. If the leverage ratio is greater than 2.0, the pricing is LIBOR plus 6.25%. If the leverage ratio is greater than 1.5 and less than or equal to 2.0, the pricing is LIBOR plus 6.00%. If the leverage ratio is less than or equal to 1.5, the pricing is LIBOR plus 5.75%. |
| • | Common stock dividends are permitted only if the leverage ratio is less than or equal to 1.5. |
| • | The revolving facility was reduced from $20 million to $10 million. |
In addition, we paid 0.50% to all lenders that approved the amendment. The amendment will increase our interest costs for the facility in the future.
Contractual Obligations
The following table summarizes our contractual obligations at December 31, 2008 (in thousands):
| 2009 | 2010 | 2011 | 2012 | 2013 | Thereafter | Total | |||||||||||||||
Operating leases(1) | $ | 10,057 | $ | 6,688 | $ | 3,748 | $ | 2,491 | $ | 1,966 | $ | 5,641 | $ | 30,591 | |||||||
Notes payable(2) | — | — | — | — | — | 76,909 | 76,909 | ||||||||||||||
Senior secured credit facility(3) | 1,395 | 1,395 | 1,395 | 1,395 | 1,395 | 129,702 | 136,677 | ||||||||||||||
Interest on notes payable(2) | 5,340 | 4,269 | 3,949 | 3,949 | 3,950 | 83,545 | 105,002 | ||||||||||||||
Interest on senior secured credit facility(3) | 10,704 | 10,309 | 8,053 | 6,982 | 6,682 | 571 | 43,301 | ||||||||||||||
Data processing services(4) | 3,858 | — | — | — | — | — | 3,858 | ||||||||||||||
Reserves for loss and loss adjustment expense(5) | 139,694 | 44,323 | 15,087 | 4,563 | 970 | — | 204,637 | ||||||||||||||
Total | $ | 171,048 | $ | 66,984 | $ | 32,232 | $ | 19,380 | $ | 14,963 | $ | 296,368 | $ | 600,975 | |||||||
| (1) | As of December 31, 2008, we leased an aggregate of approximately 426,070 square feet of office space for our agencies, insurance companies and retail stores in various locations throughout the United States. These amounts represent our minimum future operating lease commitments. |
| (2) | All of the outstanding notes payable at December 31, 2008 are redeemable in whole or in part after five years of issuance. For this disclosure, it is assumed that none of these notes will be redeemed before their contractual maturities and interest rates on these notes will remain at their current levels. Difference between future cash payments and the carrying value of the notes represents fair value adjustment at the date of acquisition of USAgencies that is being amortized into interest expense over the notes outstanding period. |
| (3) | The principal amount of the Borrowing is payable in quarterly installments of $348,665, with the remaining balance due on the seventh anniversary of the closing of the facility. Beginning in 2008, we are also required to make additional annual principal payments that are to be calculated based upon our financial performance during the preceding fiscal year. In addition, certain events, such as the sale of material assets or the issuance of significant new equity, necessitate additional required principal repayments. |
| (4) | In October 2006, we entered into an IT outsourcing contract with a data processing services provider under which we outsourced substantially all of our IT operations, including our data center, field support and application management. The initial term of the agreement is ten years, although it may be terminated for convenience by us at any time upon six month’s notice after the first two years, subject to the payment of certain stranded costs and other termination fees. These amounts represent our minimum future IT outsourcing commitments. |
| (5) | The payout pattern for reserves for losses and loss adjustment expenses is based upon historical payment patterns and does not represent actual contractual obligations. The timing and amount ultimately paid can and will vary from these estimates. |
57
Table of Contents
| Item 7A. | QUANTITATIVE AND QUALITATIVE DISCLOSURE ABOUT MARKET RISK |
We are principally exposed to two types of market risk: interest rate risk and credit risk.
Interest rate risk. Our investment portfolio consists of investment-grade, fixed-income securities classified as available-for-sale investment securities and auction-rate securities classified as trading. Accordingly, the primary market risk exposure to our debt securities is interest rate risk. In general, the fair market value of a portfolio of fixed-income securities increases or decreases inversely with changes in market interest rates, while net investment income realized from future investments in fixed-income securities increases or decreases along with interest rates. In addition, some of our fixed-income securities have call or prepayment options. This could subject us to reinvestment risk should interest rates fall and issuers call their securities and we reinvest at lower interest rates. We attempt to mitigate this interest rate risk by investing in securities with varied maturity dates and by managing the duration of our investment portfolio (excluding our auction-rate tax-exempt securities) to a defined range of less than three years. The fair value of our fixed-income securities as of December 31, 2008 was $259.1 million. The effective average duration of the portfolio as of December 31, 2008 was 1.58 years. If market interest rates increase 1.0%, our fixed-income investment portfolio would be expected to decline in market value by 1.58%, or $4.1 million, representing the effective average duration multiplied by the change in market interest rates. Conversely, a 1.0% decline in interest rates would result in a 1.58%, or $4.1 million, increase in the market value of our fixed-income investment portfolio.
Our senior term loan is also subject to interest rate risk. The interest rate is determined at the beginning of each interest period based on the alternative base rate (ABR) or the adjusted LIBOR rate as defined in the credit agreement. The ABR is the greater of (a) the prime rate plus 2.50% or (b) the federal funds rate plus 3.00%. The adjusted LIBOR rate is the one, two, three or six month LIBOR rate plus a margin of 3.50%. Effective April 30, 2007, we entered into an interest rate swap with a notional amount of $50.0 million that was designated as a hedge of variable cash flows associated with that portion of the facility. This derivative instrument requires quarterly settlements whereby we pay a fixed rate of 4.993% and receive a three-month Libor rate. The derivative expires on April 30, 2011. In January 2008, we entered into an additional interest rate swap with a notional amount of $95.0 million that was also designated a hedge of variable cash flows associated with the senior term loan. The notional amount of the swap gradually declines to $40.0 million prior to its expiration and was $85.0 million as of December 31, 2008. For this swap, we pay a fixed rate of 3.031% and receive a three-month LIBOR rate. The derivative expires on February 28, 2011.
Credit risk. An additional exposure to our fixed-income securities portfolio is credit risk. We attempt to manage our credit risk by investing only in investment-grade securities and limiting our exposure to a single issuer. At December 31, 2008, our fixed-income investments were invested in the following: U.S. Government and agencies securities 11.1%, corporate securities 0.4%, mortgage-backed securities 2.4% and tax-exempt securities 86.1%. At December 31, 2008, all of our fixed-income securities were rated “A” or better by nationally recognized statistical rating organizations. The average quality of our portfolio was “AA” at December 31, 2008.
We invest our insurance portfolio funds in highly-rated, fixed-income securities. Information about our investment portfolio is as follows ($ in thousands):
| As of December 31, | ||||||||
| 2008 | 2007 | |||||||
Total invested assets | $ | 259,143 | $ | 390,109 | ||||
Tax-equivalent book yield | 4.75 | % | 5.33 | % | ||||
Effective average duration in years | 1.58 | 1.06 | ||||||
Average S&P rating | AA | AA+ | ||||||
We are subject to credit risks with respect to our reinsurers. Although a reinsurer is liable for losses to the extent of the coverage which it assumes, our reinsurance contracts do not discharge our insurance companies from primary liability to each policyholder for the full amount of the applicable policy, and consequently our
58
Table of Contents
insurance companies remain obligated to pay claims in accordance with the terms of the policies regardless of whether a reinsurer fulfills or defaults on its obligations under the related reinsurance agreement. In order to mitigate credit risk to reinsurance companies, we attempt to select financially strong reinsurers with an A.M. Best rating of “A-” or better and continue to evaluate their financial condition. Our only significant external quota-share reinsurance agreement is with a reinsurer currently rated A- by A.M. Best.
The table below presents the total amount of receivables due from reinsurance as of December 31, 2008 and 2007, respectively (in thousands):
| As of December 31, | ||||||
| 2008 | 2007 | |||||
Quota-share reinsurer for Louisiana and Alabama business | $ | 28,951 | $ | 36,221 | ||
Vesta Insurance Group | 14,223 | 13,519 | ||||
Michigan Catastrophic Claims Association | 15,989 | 12,384 | ||||
Other | 4,168 | 4,715 | ||||
Total reinsurance recoverable | $ | 63,331 | $ | 66,839 | ||
Under the reinsurance agreement with Vesta Insurance Group (VIG), including primarily Vesta Fire Insurance Corporation (VFIC), Affirmative Insurance Company (AIC) had the right, under certain circumstances, to require VFIC to provide a letter of credit or establish a trust account to collateralize the gross amount due AIC and Insura Property and Casualty Insurance Company from VFIC under the reinsurance agreement. Accordingly, AIC, Insura and VFIC entered into a Security Fund Agreement effective September 1, 2004. On August 30, 2005, AIC received a letter from VFIC’s President that irrevocably confirmed VFIC’s duty and obligation under the Security Fund Agreement to provide security sufficient to satisfy VFIC’s gross obligations under the reinsurance agreement (the VFIC Trust). At December 31, 2008, the VFIC Trust held $17.1 million (after cumulative withdrawals of $7.4 million through December 31, 2008) to collateralize the $17.1 million gross recoverable from VFIC.
At December 31, 2008, $12.4 million was included in reserves for losses and loss adjustment expenses that represented the amounts owed from AIC and Insura under reinsurance agreements with the VIG affiliated companies, including Hawaiian Insurance and Guaranty Company, Ltd (Hawaiian). Affirmative established a trust account to collateralize this payable, which currently holds $22.9 million (including accrued interest), in securities (the AIC Trust). The AIC Trust has not been drawn upon by the Special Deputy Receiver (SDR) in Texas or the SDR in Hawaii. It is the expectation that the terms for withdrawal of funds from the AIC Trust will be similar to those we expect to be agreed to with regard to the VFIC Trust.
As part of the terms of the acquisition of AIC and Insura, VIG has indemnified us for any losses due to uncollectible reinsurance related to reinsurance agreements entered into with unaffiliated reinsurers prior to December 31, 2003. As of December 31, 2008, all such unaffiliated reinsurers had A.M. Best ratings of “A-” with a reinsurance recoverable of $3.4 million.
59
Table of Contents
| Item 8. | FINANCIAL STATEMENTS AND SUPPLEMENTARY DATA |
Index to Consolidated Financial Statements
| Page | ||
| 61 | ||
| 63 | ||
| 64 | ||
| 65 | ||
| 65 | ||
| 66 | ||
| 67 | ||
60
Table of Contents
Report of Independent Registered Public Accounting Firm
The Board of Directors and Stockholders
Affirmative Insurance Holdings, Inc.:
We have audited the accompanying consolidated balance sheets of Affirmative Insurance Holdings, Inc. and subsidiaries (the Company) as of December 31, 2008 and 2007, and the related consolidated statements of income, stockholders’ equity, comprehensive income (loss), and cash flows for each of the years in the three-year period ended December 31, 2008. These consolidated financial statements are the responsibility of the Company’s management. Our responsibility is to express an opinion on these consolidated financial statements based on our audits.
We conducted our audits in accordance with the standards of the Public Company Accounting Oversight Board (United States). Those standards require that we plan and perform the audit to obtain reasonable assurance about whether the financial statements are free of material misstatement. An audit includes examining, on a test basis, evidence supporting the amounts and disclosures in the financial statements. An audit also includes assessing the accounting principles used and significant estimates made by management, as well as evaluating the overall financial statement presentation. We believe that our audits provide a reasonable basis for our opinion.
In our opinion, the consolidated financial statements referred to above present fairly, in all material respects, the financial position of the Affirmative Insurance Holdings, Inc. and subsidiaries as of December 31, 2008 and 2007, and the results of their operations and their cash flows for each of the years in the three-year period ended December 31, 2008, in conformity with U.S. generally accepted accounting principles.
We also have audited, in accordance with the standards of the Public Company Accounting Oversight Board (United States), Affirmative Insurance Holdings, Inc. and subsidiaries’ internal control over financial reporting as of December 31, 2008, based on criteria established in Internal Control — Integrated Frameworkissued by the Committee of Sponsoring Organizations of the Treadway Commission (COSO), and our report dated March 31, 2009 expressed an unqualified opinion on the effectiveness of the Company’s internal control over financial reporting.
/s/ KPMG LLP
Dallas, Texas
March 31, 2009
61
Table of Contents
Report of Independent Registered Public Accounting Firm
The Board of Directors and Stockholders
Affirmative Insurance Holdings, Inc.:
We have audited Affirmative Insurance Holdings, Inc. and its subsidiaries’ (the Company) internal control over financial reporting as of December 31, 2008, based on criteria established inInternal Control — Integrated Framework issued by the Committee of Sponsoring Organizations of the Treadway Commission (COSO).The Company’s management is responsible for maintaining effective internal control over financial reporting and for its assessment of the effectiveness of internal control over financial reporting, included in the accompanying Management’s Report on Internal Control over Financial Reporting. Our responsibility is to express an opinion on the Company’s internal control over financial reporting based on our audit.
We conducted our audit in accordance with the standards of the Public Company Accounting Oversight Board (United States). Those standards require that we plan and perform the audit to obtain reasonable assurance about whether effective internal control over financial reporting was maintained in all material respects. Our audit included obtaining an understanding of internal control over financial reporting, assessing the risk that a material weakness exists, and testing and evaluating the design and operating effectiveness of internal control based on the assessed risk. Our audit also included performing such other procedures as we considered necessary in the circumstances. We believe that our audit provides a reasonable basis for our opinion.
A company’s internal control over financial reporting is a process designed to provide reasonable assurance regarding the reliability of financial reporting and the preparation of financial statements for external purposes in accordance with generally accepted accounting principles. A company’s internal control over financial reporting includes those policies and procedures that (1) pertain to the maintenance of records that, in reasonable detail, accurately and fairly reflect the transactions and dispositions of the assets of the company; (2) provide reasonable assurance that transactions are recorded as necessary to permit preparation of financial statements in accordance with generally accepted accounting principles, and that receipts and expenditures of the company are being made only in accordance with authorizations of management and directors of the company; and (3) provide reasonable assurance regarding prevention or timely detection of unauthorized acquisition, use, or disposition of the company’s assets that could have a material effect on the financial statements.
Because of its inherent limitations, internal control over financial reporting may not prevent or detect misstatements. Also, projections of any evaluation of effectiveness to future periods are subject to the risk that controls may become inadequate because of changes in conditions, or that the degree of compliance with the policies or procedures may deteriorate.
In our opinion, the Company maintained, in all material respects, effective internal control over financial reporting as of December 31, 2008, based on criteria established inInternal Control — Integrated Framework issued by the Committee of Sponsoring Organizations of the Treadway Commission.
We also have audited, in accordance with the standards of the Public Company Accounting Oversight Board (United States), the consolidated balance sheets of the Company as of December 31, 2008 and 2007, and the related consolidated statements of income, stockholders’ equity, comprehensive income (loss), and cash flows for each of the years in the three-year period ended December 31, 2008, and our report dated March 31, 2009 expressed an unqualified opinion on those consolidated financial statements.
/s/ KPMG LLP
Dallas, Texas
March 31, 2009
62
Table of Contents
AFFIRMATIVE INSURANCE HOLDINGS, INC. AND SUBSIDIARIES
CONSOLIDATED BALANCE SHEETS
(in thousands, except share data)
| December 31, | ||||||||
| 2008 | 2007 | |||||||
Assets | ||||||||
Investment securities, at fair value | ||||||||
Trading securities | $ | 40,155 | $ | — | ||||
Available-for-sale securities | 218,988 | 390,109 | ||||||
Cash and cash equivalents | 66,513 | 44,048 | ||||||
Fiduciary and restricted cash | 20,109 | 13,591 | ||||||
Accrued investment income | 3,106 | 3,736 | ||||||
Premiums and fees receivable | 57,805 | 69,154 | ||||||
Premium finance receivable, net | 40,987 | 34,208 | ||||||
Commissions receivable | 1,840 | 2,156 | ||||||
Receivable from reinsurers, net | 63,331 | 66,839 | ||||||
Deferred acquisition costs | 21,993 | 24,536 | ||||||
Deferred tax assets | 16,459 | 10,973 | ||||||
Federal income taxes receivable | 1,316 | 5,562 | ||||||
Investment in real property, net | 5,848 | 5,964 | ||||||
Property and equipment, net | 42,143 | 29,444 | ||||||
Goodwill | 163,650 | 163,462 | ||||||
Other intangible assets, net | 17,255 | 23,623 | ||||||
Prepaid expenses | 8,967 | 11,011 | ||||||
Other assets, net of allowance for doubtful accounts of $7,213 for 2008 and 2007 (includes other receivables of $9,647) | 11,586 | 2,221 | ||||||
Total assets | $ | 802,051 | $ | 900,637 | ||||
Liabilities and Stockholders’ Equity | ||||||||
Liabilities: | ||||||||
Reserves for losses, loss adjustment expenses and deposits | $ | 204,637 | $ | 227,947 | ||||
Unearned premium | 109,097 | 126,289 | ||||||
Amounts due reinsurers | 5,146 | 3,606 | ||||||
Deferred revenue | 5,943 | 6,922 | ||||||
Senior secured credit facility | 136,677 | 196,966 | ||||||
Notes payable | 76,909 | 76,930 | ||||||
Other liabilities | 47,159 | 44,932 | ||||||
Total liabilities | 585,568 | 683,592 | ||||||
Stockholders’ equity: | ||||||||
Common stock, $0.01 par value; 75,000,000 shares authorized, 17,768,721 shares issued and 15,415,358 shares outstanding at December 31, 2008; 17,768,721 shares issued and 15,415,358 shares outstanding at December 31, 2007 | 178 | 178 | ||||||
Additional paid-in capital | 163,707 | 162,603 | ||||||
Treasury stock, at cost (2,353,363 shares at December 31, 2008 and 2007) | (32,880 | ) | (32,880 | ) | ||||
Accumulated other comprehensive income (loss) | (1,849 | ) | 22 | |||||
Retained earnings | 87,327 | 87,122 | ||||||
Total stockholders’ equity | 216,483 | 217,045 | ||||||
Total liabilities and stockholders’ equity | $ | 802,051 | $ | 900,637 | ||||
See accompanying Notes to Consolidated Financial Statements.
63
Table of Contents
AFFIRMATIVE INSURANCE HOLDINGS, INC. AND SUBSIDIARIES
CONSOLIDATED STATEMENTS OF INCOME
(in thousands, except per share data)
| Year Ended December 31, | ||||||||||||
| 2008 | 2007 | 2006 | ||||||||||
Revenues | ||||||||||||
Net premiums earned | $ | 357,301 | $ | 396,043 | $ | 288,110 | ||||||
Commission income and fees | 78,926 | 88,146 | 60,995 | |||||||||
Net investment income | 13,749 | 16,444 | 8,829 | |||||||||
Net realized losses | (10,700 | ) | (599 | ) | (822 | ) | ||||||
Other income | 9,647 | — | — | |||||||||
Total revenues | 448,923 | 500,034 | 357,112 | |||||||||
Expenses | ||||||||||||
Losses and loss adjustment expenses | 274,391 | 289,724 | 185,346 | |||||||||
Selling, general and administrative expenses | 144,269 | 162,216 | 150,540 | |||||||||
Depreciation and amortization | 9,187 | 11,260 | 4,398 | |||||||||
Impairment of intangible assets | 4,609 | — | — | |||||||||
Interest expense | 18,404 | 25,060 | 4,342 | |||||||||
Total expenses | 450,860 | 488,260 | 344,626 | |||||||||
Income (loss) before income tax expense (benefit) and minority interest | (1,937 | ) | 11,774 | 12,486 | ||||||||
Income tax expense (benefit) | (3,375 | ) | 2,105 | 2,661 | ||||||||
Minority interest, net of income taxes | — | — | 81 | |||||||||
Net income | $ | 1,438 | $ | 9,669 | $ | 9,744 | ||||||
Net income per common share: | ||||||||||||
Basic | $ | 0.09 | $ | 0.63 | $ | 0.64 | ||||||
Diluted | $ | 0.09 | $ | 0.63 | $ | 0.63 | ||||||
Weighted average common shares outstanding: | ||||||||||||
Basic | 15,415 | 15,371 | 15,295 | |||||||||
Diluted | 15,415 | 15,382 | 15,345 | |||||||||
Dividends declared per common share | $ | 0.08 | $ | 0.08 | $ | 0.08 | ||||||
See accompanying Notes to Consolidated Financial Statements.
64
Table of Contents
AFFIRMATIVE INSURANCE HOLDINGS, INC. AND SUBSIDIARIES
CONSOLIDATED STATEMENTS OF STOCKHOLDERS’ EQUITY
(in thousands, except share data)
| 2008 | 2007 | 2006 | ||||||||||||||||
| Shares | Amounts | Shares | Amounts | Shares | Amounts | |||||||||||||
Common stock | ||||||||||||||||||
Balance at January 1 | 17,768,721 | $ | 178 | 17,707,938 | $ | 177 | 17,483,520 | $ | 175 | |||||||||
Exercise of stock options | — | — | 53,510 | 1 | 109,418 | 1 | ||||||||||||
Issuance of restricted stock awards | — | — | 7,273 | — | 115,000 | 1 | ||||||||||||
Balance at December 31 | 17,768,721 | 178 | 17,768,721 | 178 | 17,707,938 | 177 | ||||||||||||
Additional paid-in capital | ||||||||||||||||||
Balance at January 1 | 162,603 | 160,862 | 158,904 | |||||||||||||||
Exercise of stock options | — | 503 | 1,317 | |||||||||||||||
Issuance of restricted stock awards | — | — | (1 | ) | ||||||||||||||
Stock-based compensation expense | 1,104 | 1,238 | 595 | |||||||||||||||
Tax benefit on stock options exercised | — | — | 47 | |||||||||||||||
Balance at December 31 | 163,707 | 162,603 | 160,862 | |||||||||||||||
Retained earnings | ||||||||||||||||||
Balance at January 1 | 87,122 | 78,682 | 70,158 | |||||||||||||||
Net income | 1,438 | 9,669 | 9,744 | |||||||||||||||
Dividends declared | (1,233 | ) | (1,229 | ) | (1,220 | ) | ||||||||||||
Balance at December 31 | 87,327 | 87,122 | 78,682 | |||||||||||||||
Treasury stock | ||||||||||||||||||
Balance at January 1 | 2,353,363 | (32,880 | ) | 2,353,363 | (32,880 | ) | 2,050,963 | (28,746 | ) | |||||||||
Purchases of treasury stock | — | — | — | — | 302,400 | (4,134 | ) | |||||||||||
Balance at December 31 | 2,353,363 | (32,880 | ) | 2,353,363 | (32,880 | ) | 2,353,363 | (32,880 | ) | |||||||||
Accumulated other comprehensive income (loss) | ||||||||||||||||||
Balance at January 1 | 22 | (448 | ) | (529 | ) | |||||||||||||
Unrealized gain on available-for-sale investment securities, net of tax | 853 | 1,604 | 81 | |||||||||||||||
Unrealized loss on cash flow hedges | (2,724 | ) | (1,134 | ) | — | |||||||||||||
Balance at December 31, net of tax | (1,849 | ) | 22 | (448 | ) | |||||||||||||
Total stockholders’ equity | $ | 216,483 | $ | 217,045 | $ | 206,393 | ||||||||||||
CONSOLIDATED STATEMENTS OF COMPREHENSIVE INCOME (LOSS)
(in thousands)
| Year Ended December 31, | |||||||||||
| 2008 | 2007 | 2006 | |||||||||
Net income | $ | 1,438 | $ | 9,669 | $ | 9,744 | |||||
Other comprehensive income (loss): | |||||||||||
Unrealized gain on available-for-sale investment securities, net of tax | 853 | 1,604 | 81 | ||||||||
Unrealized loss on cash flow hedges, net of tax | (2,724 | ) | (1,134 | ) | — | ||||||
Other comprehensive income (loss), net | (1,871 | ) | 470 | 81 | |||||||
Total comprehensive income (loss) | $ | (433 | ) | $ | 10,139 | $ | 9,825 | ||||
See accompanying Notes to Consolidated Financial Statements.
65
Table of Contents
AFFIRMATIVE INSURANCE HOLDINGS, INC. AND SUBSIDIARIES
CONSOLIDATED STATEMENTS OF CASH FLOWS
(in thousands)
| Year Ended December 31, | ||||||||||||
| 2008 | 2007 | 2006 | ||||||||||
Cash flows from operating activities | ||||||||||||
Net income | $ | 1,438 | $ | 9,669 | $ | 9,744 | ||||||
Adjustments to reconcile net income to net cash provided by (used in) operating activities: | ||||||||||||
Depreciation and amortization | 9,187 | 11,260 | 4,398 | |||||||||
Stock-based compensation expense | 1,117 | 1,238 | 595 | |||||||||
Amortization of debt issuance cost | 1,326 | 942 | — | |||||||||
Realized loss on trading securities | 11,140 | — | — | |||||||||
Other income | (9,647 | ) | — | — | ||||||||
Loss on disposal of assets | (440 | ) | 599 | 822 | ||||||||
Amortization of premiums and discounts on investments | 2,551 | 2,720 | 1,521 | |||||||||
Provision for doubtful premiums receivable | — | — | 7,213 | |||||||||
Write-down of information systems | — | 455 | — | |||||||||
Other intangible assets impairment | 4,609 | — | — | |||||||||
Change in operating assets and liabilities: | ||||||||||||
Fiduciary and restricted cash | (6,518 | ) | 22,111 | (5,893 | ) | |||||||
Premiums, fees and commissions receivable | 11,665 | 7,906 | 4,608 | |||||||||
Reserves for losses and loss adjustment expenses | (23,310 | ) | (6,144 | ) | 19,592 | |||||||
Amounts due from reinsurers, net | 5,048 | 40,018 | (284 | ) | ||||||||
Premium finance receivable, net (related to our insurance premiums) | 659 | 3,127 | — | |||||||||
Deferred revenue | (979 | ) | (9,799 | ) | (3,187 | ) | ||||||
Unearned premium | (17,192 | ) | (11,298 | ) | (5,220 | ) | ||||||
Deferred acquisition costs | 2,543 | (671 | ) | 588 | ||||||||
Deferred tax assets | (4,479 | ) | 5,149 | 5,942 | ||||||||
Federal income taxes receivable | 4,246 | 1,566 | (283 | ) | ||||||||
Other | (124 | ) | 10,988 | (5,412 | ) | |||||||
Net cash provided by (used in) operating activities | (7,160 | ) | 89,836 | 34,744 | ||||||||
Cash flows from investing activities | ||||||||||||
Proceeds from sales of available-for-sale securities | 150,564 | 116,058 | 161,781 | |||||||||
Proceeds from maturities of available-for-sale securities | 73,681 | 61,995 | 236,367 | |||||||||
Cost of investments acquired | (105,230 | ) | (268,065 | ) | (410,954 | ) | ||||||
Premium finance receivable, net (related to third-party insurance premiums) | (7,438 | ) | (65 | ) | — | |||||||
Purchases of property and equipment | (20,221 | ) | (20,881 | ) | (8,847 | ) | ||||||
Net cash paid for acquisitions | (188 | ) | (176,750 | ) | (4,608 | ) | ||||||
Net cash provided by (used in) investing activities | 91,168 | (287,708 | ) | (26,261 | ) | |||||||
Cash flows from financing activities | ||||||||||||
Principal payments under capital lease obligations | — | (162 | ) | — | ||||||||
Borrowings under senior secured credit facility | 6,000 | 200,000 | — | |||||||||
Principal payments on senior secured credit facility | (66,289 | ) | (3,034 | ) | — | |||||||
Principal payments on notes payable | (21 | ) | — | — | ||||||||
Debt issuance costs paid | — | (6,643 | ) | — | ||||||||
Proceeds from exercise of stock options | — | 504 | 1,318 | |||||||||
Treasury stock purchased | — | — | (4,134 | ) | ||||||||
Dividends paid | (1,233 | ) | (1,229 | ) | (1,220 | ) | ||||||
Net cash provided by (used in) financing activities | (61,543 | ) | 189,436 | (4,036 | ) | |||||||
Net increase (decrease) in cash and cash equivalents | 22,465 | (8,436 | ) | 4,447 | ||||||||
Cash and cash equivalents at beginning of year | 44,048 | 52,484 | 48,037 | |||||||||
Cash and cash equivalents at end of year | $ | 66,513 | $ | 44,048 | $ | 52,484 | ||||||
Supplemental disclosure of cash flow information: | ||||||||||||
Cash paid for interest | $ | 17,804 | $ | 22,625 | $ | 4,212 | ||||||
Cash paid for income taxes | 293 | 3,417 | 7,930 | |||||||||
See accompanying Notes to Consolidated Financial Statement.
66
Table of Contents
AFFIRMATIVE INSURANCE HOLDINGS, INC. AND SUBSIDIARIES
NOTES TO CONSOLIDATED FINANCIAL STATEMENTS
1. General
Affirmative Insurance Holdings, Inc., formerly known as Instant Insurance Holdings, Inc., was incorporated in Delaware in June 1998. We are a distributor and producer of non-standard personal automobile insurance policies and related products and services for individual consumers in targeted geographic areas. We are currently active in offering insurance directly to individual consumers through retail stores in 10 states (Louisiana, Texas, Illinois, Alabama, Florida, Missouri, Indiana, South Carolina, Kansas and Wisconsin) including our franchised stores in Florida and distributing our own insurance policies through 8,000 independent agents or brokers in 10 states (Louisiana, Texas, Illinois, California, Michigan, Florida, Missouri, Indiana, South Carolina and New Mexico).
2. Summary of Significant Accounting Policies
Basis of Presentation •Our consolidated financial statements have been prepared in accordance with U.S. Generally Accepted Accounting Principles (GAAP) and include our accounts and the accounts of our operating subsidiaries. All intercompany accounts and transactions have been eliminated in consolidation.
Certain prior year amounts have been reclassified to conform to the current presentation. The reclassifications primarily affected the presentation of certain ceding commissions as reductions of policy acquisition expenses rather than reductions of loss adjustment expenses.
Use of Estimates • Our preparation of financial statements in conformity with GAAP requires us to make estimates and assumptions that affect our reported amounts of assets and liabilities and disclosure of contingent assets and liabilities at the date of our financial statements and our reported amounts of revenues and expenses during the reporting period. Actual results could differ materially from those estimates. These estimates and assumptions are particularly important in determining revenue recognition, reserves for losses and loss adjustment expenses, deferred policy acquisition costs, reinsurance receivables, impairment of assets and purchase price allocations.
Cash and Cash Equivalents• Cash and cash equivalents are highly liquid investments with an original maturity of ninety days or less and include principally money market funds, repurchase agreements, and other bank deposits.
Fiduciary and Restricted Cash• In our capacity as an insurance agency, we collect premiums from insureds and, after deducting our authorized commissions, remit these premiums to the appropriate insurance companies. Unremitted insurance premiums are held in a fiduciary capacity until disbursed by us. In certain states where we operate, the use of investment alternatives for these funds is regulated by various state agencies. We invest these unremitted funds only in cash and money market accounts and report such amounts as restricted cash on our consolidated balance sheets. We report the unremitted liability of these funds as amounts due reinsurers on our consolidated balance sheets. Interest income earned on these unremitted funds is reported as investment income in our consolidated statements of income.
Investments • Investment securities are classified as either available-for-sale investment securities or trading securities and are reported at fair value, generally based on quoted prices in active markets or third-party valuation sources when observable market prices are not available. Unrealized gains and losses are excluded from earnings and reported as a separate component of stockholders’ equity, net of deferred income taxes for available-for-sale investment securities. For trading securities, unrealized gains and losses are reported in the current period’s earnings.
Gains and losses realized on the disposition of investment securities are determined on the specific identification basis and credited or charged to income. Premium and discount on investment securities are amortized and accreted using the interest method and charged or credited to investment income.
67
Table of Contents
AFFIRMATIVE INSURANCE HOLDINGS, INC. AND SUBSIDIARIES
NOTES TO CONSOLIDATED FINANCIAL STATEMENTS—(Continued)
Investments are considered to be impaired when a decline in fair value is judged to be other-than-temporary. On a quarterly basis, we consider available quantitative and qualitative evidence in evaluating potential impairment of our investments. If the cost of an investment exceeds its fair value, we evaluate, among other factors, general market conditions, the duration and extent to which the fair value is less than cost, and our intent and ability to hold the investment to maturity. We also consider potential adverse conditions related to the financial health of the issuer based on rating agency actions. Once a decline in fair value is determined to be other-than-temporary, an impairment charge is recorded in earnings and a new cost basis in the investment is established.
On January 1, 2008, we adopted the provisions of Statement of Financial Accounting Standards (SFAS) No. 157,Fair Value Measurements. SFAS No. 157 defines fair value to be the price that would be received to sell an asset or paid to transfer a liability in an orderly transaction between market participants at the measurement date and emphasizes that fair value is a market-based measurement, not an entity-specific measurement. SFAS No. 157 establishes a fair value hierarchy and expands disclosures about fair value measurements in both interim and annual periods. SFAS No. 157 is effective for fiscal years beginning after November 15, 2007 and interim periods within those fiscal years. In February 2008, the Financial Accounting Standards Board (FASB) issued FASB Staff Position No. FAS 157-1Applications of FASB Statement No. 157 to FASB Statement No. 13 and Other Accounting Pronouncements That Address Fair Value Measurements for Purpose of Lease Classification or Measurement under Statement 13(FSP 157-1) which removes leasing transactions from the scope of SFAS No. 157. FSP 157-1 is effective upon adoption of SFAS No. 157. In October 2008, the FASB issued FASB Staff Position 157-3,Determining the Fair Value of a Financial Asset When the Market for That Asset Is Not Active (FSP 157-3). FSP 157-3 clarifies the application of SFAS 157 in an inactive market and illustrates how an entity would determine fair value when the market for a financial asset is not active. FSP 157-3 is effective upon issuance and any revisions resulting from a change in valuation technique or its application will be accounted for as a change in accounting estimate. The adoption of SFAS No. 157, FSP 157-1 and FSP 157-3 did not have a material impact on our consolidated results of operations or financial condition.
On January 1, 2008, we also adopted the provisions of SFAS No. 159,Establishing the Fair Value Option for Financial Assets and Liabilities. SFAS No. 159 permits entities to choose to measure many financial instruments and certain other items at fair value. The objective is to improve financial reporting by providing entities with the opportunity to mitigate volatility in reported earnings caused by measuring related assets and liabilities differently without having to apply complex hedge accounting provisions. This statement is expected to expand the use of fair value measurement, which is consistent with the FASB’s long term measurement objectives for accounting for financial instruments. SFAS No. 159 applies to all entities and most of the provisions apply only to entities that elect the fair value option. SFAS No. 159 is effective for fiscal years beginning after November 15, 2007. The initial adoption of SFAS No. 159 did not have a material impact on our consolidated results of operations or financial condition.
On January 1, 2007, we adopted the provisions of Statement of Financial Accounting Standard (SFAS) No. 155,Accounting for Certain Hybrid Financial Instruments — an amendment of Financial Accounting Standards Board (FASB) Statements No. 133 and 140, which permits the fair value remeasurement of any hybrid financial instrument that contains an embedded derivative that otherwise would require bifurcation under SFAS No. 133,Accounting for Derivative Instruments and Hedging Activities; clarifies which interest-only strips and principal-only strips are not subject to the requirements of SFAS No. 133; establishes a requirement to evaluate interests in securitized financial assets to identify interests that are freestanding derivatives or hybrid financial instruments that contain an embedded derivative requiring bifurcation and clarifies that concentrations of credit risk in the form of subordination are not embedded derivatives. The adoption of SFAS No. 155 did not have a material impact on our consolidated financial statements.
68
Table of Contents
AFFIRMATIVE INSURANCE HOLDINGS, INC. AND SUBSIDIARIES
NOTES TO CONSOLIDATED FINANCIAL STATEMENTS—(Continued)
Amounts Due from/to Reinsurers • We collect premiums from insureds and after deducting our authorized commissions, we remit these premiums to the appropriate insurance and reinsurance companies. Our obligation to remit these premiums is recorded as amounts due reinsurers in our consolidated balance sheet. We record the amounts we expect to receive from reinsurers as an asset on our balance sheet. Our insurance companies report as assets the estimated reinsurance recoverable on paid losses and unpaid losses, including an estimate for losses incurred but not reported.
Premium Finance Receivable • We recognize interest and origination fees from finance receivables over the term of the finance contract. Late fee revenue is recognized when received.
Deferred Policy Acquisition Costs • Deferred policy acquisition costs represent the deferral of expenses that we incur acquiring new business or renewing existing business. Policy acquisition costs, consisting of primarily commission, advertising, premium taxes, underwriting and agency expenses, are deferred and charged against income ratably over the terms of the related policies. We regularly review the categories of acquisition costs that are deferred and assess the recoverability of this asset. A premium deficiency, and a corresponding charge to income is recognized, if the sum of the expected losses and loss adjustment expenses, unamortized acquisition costs, and maintenance costs exceeds related unearned premiums and anticipated investment income. Amounts received as expense allowances on reinsurance contracts that represent reimbursement of acquisition costs are recorded as reductions of deferred acquisition costs.
Property and Equipment • Property and equipment is stated at cost, less accumulated depreciation. Depreciation is computed for property and equipment, excluding leasehold improvements, using the straight-line method over the estimated useful lives of our assets, typically ranging from three to five years. Leasehold improvements are depreciated using the straight-line method over the shorter of the useful life or the remainder of the lease term.
Goodwill and Other Intangible Assets • We account for business combinations using the purchase method of accounting and accordingly, the assets and liabilities of the acquired entities are recorded at their estimated fair values at the date of acquisition. Goodwill represents the excess of the purchase price over the fair value of net assets, including the amount assigned to identifiable intangible assets. Identifiable intangible assets consist of brand names, agency relationships and non-competition agreements. Identifiable intangible assets that are determined to have a finite life are amortized over their useful lives, which range from two to twenty years. The results of operations of acquired businesses are included in our Consolidated Financial Statements from the respective dates of acquisition.
Goodwill and other intangible assets having an indefinite useful life are tested for impairment annually or more frequently if events or changes in circumstances indicate that the assets might be impaired. Intangible assets with finite lives are amortized over their useful lives and are periodically reviewed to ensure that no conditions exist indicating the recorded amount is not recoverable from future undiscounted cash flows.
At least annually, we evaluate goodwill and indefinite life intangibles for impairment. Goodwill impairment is based upon: (1) historical financial performance; (2) the most recent financial performance; (3) our financial forecast; (4) information regarding publicly available financial terms of recent transactions in the industry; and (5) other publicly available information.
We reviewed the USAgencies tradename and determined that it had an indefinite useful life. As a result, we no longer amortize the USAgencies tradename. We will test for impairment annually or more frequently if events or changes in circumstances indicate that the asset might be impaired.
69
Table of Contents
AFFIRMATIVE INSURANCE HOLDINGS, INC. AND SUBSIDIARIES
NOTES TO CONSOLIDATED FINANCIAL STATEMENTS—(Continued)
Other Assets • In November 2008, we elected to participate in a settlement agreement with our broker related to auction-rate securities. We elected to report this settlement as a financial asset at fair value in other assets with changes in fair value reported in other income in accordance with SFAS No. 159.
Treasury Stock • We record treasury stock purchases under the cost method, whereby the entire cost of the acquired stock is recorded as treasury stock. When reissued, shares of treasury stock will be removed from the treasury stock account at the average purchase price per share of the aggregate treasury shares held.
Revenue Recognition •Premium income — Premium, net of premiums ceded, is earned over the life of a policy on a pro rata basis. Unearned premiums represent that portion of premiums written that is applicable to the unexpired terms of policies in force. Premiums receivable are recorded net of an estimated allowance for uncollectible amounts.
Commission income — Commission income and related policy fees, written for unaffiliated insurance companies, are recognized, net of an allowance for estimated policy cancellation, at the date the customer is initially billed or as of the effective date of the insurance policy, whichever is later. Commissions on premium endorsements are recognized when premiums are processed. Our allowance for estimated third-party cancellations is periodically evaluated and adjusted as necessary.
Profit sharing commissions, which enable us to collect commission income and fees in excess of provisional commissions, are recorded when we conclude it is probable that estimates of loss ratios will be below the levels stated in our agency contracts. Provisional commissions may be reduced when we conclude it is probable that estimates of loss ratios will be above the levels stated in our agency contract.
Fee Income— Policy origination fees, agency and installment fees compensate us for the costs of providing installment payment plans, as well as late payment, policy cancellation, policy rewrite and reinstatement fees. We recognize policy origination fees over the underlying policy terms and recognize other fees on a collected basis when services are provided. Premium finance and origination fees are recognized over the term of the finance contracts.
Claims processing fees — Claims processing fees are received from insurance companies over the premium earning period of the underlying policies. The fees are recognized as revenue over the expected period during which processing services are performed and in amounts appropriate to the processing effort and related costs. The service period and related revenues are based upon historical and expected claims settlement data.
Losses and Loss Adjustment Expenses • We maintain reserves in the amount of the estimated ultimate liability for unpaid losses and loss adjustment expenses related to incurred claims and our estimate of unreported claims. Our estimation of the ultimate liability for unpaid losses and loss adjustment expenses is based on projections developed by our actuaries using analytical methodology commonly used in the property-casualty insurance industry. Our liabilities stated for unpaid claims and for expenses of investigation and adjustment of unpaid claims are based on: (1) the accumulation of estimates of individual claims for losses reported prior to the close of the accounting period; (2) estimates received from ceding companies, reinsurers and insurance pools and associations; (3) estimates of unreported losses based on past experience; (4) estimates based on past experience of expenses for investigating and adjusting claims; and (5) estimates of subrogation and salvage collections. We periodically adjust our losses and loss adjustment expense reserves for changes in product mix, underwriting standards, loss cost trends and other factors. Our losses and loss adjustment expense reserves may also be impacted by factors such as the rate of inflation, claims settlement patterns, litigation and legislative activities. Unpaid losses and loss adjustment expenses have not been reduced for reinsurance recoverable. Changes in estimates of our liabilities for unpaid losses and loss adjustment expenses are reflected in our consolidated statement of income in the period in which determined. Ultimately, our actual losses and loss adjustment expenses may differ materially from the estimates we have recorded.
70
Table of Contents
AFFIRMATIVE INSURANCE HOLDINGS, INC. AND SUBSIDIARIES
NOTES TO CONSOLIDATED FINANCIAL STATEMENTS—(Continued)
Accounting and Reporting for Reinsurance • Pursuant to SFAS No. 113,Accounting and Reporting for Reinsurance of Short-Duration and Long-Duration Contracts, we are required to review the contractual terms of all our reinsurance purchases to ensure compliance with that statement. The statement establishes the conditions required for a contract with a reinsurer to be accounted for as reinsurance and prescribes accounting and reporting standards for those contracts. For all reinsurance transactions, immediate recognition of gains is precluded unless our liability to our policyholders is extinguished. SFAS No. 113 also requires us to disclose the nature, purpose and effect of reinsurance transactions, including the premium amounts associated with reinsurance assumed and ceded. It also requires disclosure of concentrations of credit risk associated with reinsurance receivables and prepaid reinsurance premiums. Contracts that do not result in the reasonable possibility that the reinsurer may realize a significant loss from the insurance risk assumed generally do not meet the conditions for reinsurance accounting and must be accounted for as deposits according to the guidelines of Statement of Position (SOP) 98-7,Deposit Accounting for Insurance and Reinsurance Contracts that do not Transfer Insurance Risk. Under Deposit Accounting, the amount of the deposit asset or liability is adjusted at subsequent reporting dates by calculating the effective yield on the deposit to reflect actual payments to date and expected future payments, with a corresponding credit or charge to interest income or expense.
Stock-Based Compensation • Under SFAS No. 123R,Share-Based Payment, we use the modified prospective method and, accordingly, we have not restated prior periods. We recognize stock-based compensation expense using the straight-line method.
Income Taxes • Deferred federal income taxes reflect the future tax differences between the tax basis of assets and liabilities and amounts recorded for financial reporting purposes. Recorded amounts will be adjusted to reflect changes in income tax rates for the period in which the change is enacted.
Beginning January 1, 2007, we have accounted for uncertainty in income taxes recognized in the financial statements in accordance with FASB Interpretation No. 48,Accounting for Uncertainty in Income Taxes (FIN 48). FIN 48 requires that a more-likely-than-not threshold be met before the benefit of a tax position may be recognized in the financial statements and prescribes how such benefit should be measured. It also provides guidance on derecognition, classification, accrual of interest and penalties, accounting in interim periods, disclosure and transition. It requires that the standard be applied to the balances of assets and liabilities as of the beginning of the period of adoption and that a corresponding adjustment be made to the opening balance of retained earnings. As a result of the adoption, we recognized no additional liability or reduction in deferred tax asset for unrecognized tax benefits. We are no longer subject to federal, state, local or non-US income tax examinations by tax authorities for years prior to 2004. While we typically do not incur significant interest or penalties on income tax liabilities, our policy is to classify those amounts as administrative expense. We did not change our policy on classification of interest and penalties on income tax liabilities upon adoption of FIN 48.
Net Income Per Share • Basic net income per share is computed by dividing net income available to common stockholders by the weighted average number of common shares outstanding during the year. Diluted net income per share is computed by giving effect to the potential dilution that could occur if securities or other contracts to issue common shares were exercised and converted into common shares during the year. Shares issued under our restricted stock awards are included in basic shares upon issuance of the awards even though the vesting of shares will occur over time.
Fair Value of Financial Instruments • We disclose the fair values of financial instruments for which it is practicable to estimate the value. Fair value disclosures exclude certain financial assets such as premium receivables, commission receivables, and premium payables as carrying values approximate fair value.
71
Table of Contents
AFFIRMATIVE INSURANCE HOLDINGS, INC. AND SUBSIDIARIES
NOTES TO CONSOLIDATED FINANCIAL STATEMENTS—(Continued)
Segment Reporting • Our business is the design, sale, underwriting and servicing of non-standard personal automobile insurance policies. Our parent company is a holding company, with no revenues and only interest expense on corporate debt. Our subsidiaries consist of several types of legal entities: insurance companies, underwriting agencies, retail agencies, and a service company where all employees are paid. Our insurance companies possess the certificates of authority and capital necessary to transact insurance business and issue policies, but they rely on both affiliated and unaffiliated underwriting agencies to design, distribute and service those policies. Our underwriting agencies primarily design, distribute and service policies issued or reinsured by our insurance companies and that are distributed by our retail entities and by independent agents. Given the homogeneity of our products, the regulatory environments in which we operate, the nature of our customers and our distribution channels, we monitor, control and manage our business lines as an integrated entity offering non-standard personal automobile insurance products through multiple distribution channels.
Statutory accounting practices • We are required to report our results of operations and financial position to insurance regulatory authorities based upon statutory accounting practices (SAP). One significant difference between SAP and GAAP is that under SAP, we are required to expense all sales and other policy acquisition costs as they are incurred rather than capitalizing and amortizing them over the expected life of the policy as required by GAAP. The immediate charge off of sales and acquisition expenses and other conservative valuations under SAP generally cause a lag between the sale of a policy and the emergence of reported earnings. Since this lag can reduce our income from operations on a SAP basis, it can have the effect of reducing the amount of funds available for dividends from insurance companies. A second significant difference is that under SAP, certain assets are designated as “nonadmitted” and are charged directly to unassigned surplus, whereas under GAAP, such assets are included in the balance sheet net of an appropriate valuation reserve. A third significant difference between SAP and GAAP is that SAP requires available-for-sale investments be carried at amortized book value while GAAP requires available-for-sale investments be carried at fair value.
Recently Issued Accounting Standards• In March 2008, the FASB issued SFAS No. 161,Disclosures about Derivative Instruments and Hedging Activities, an amendment to FASB Statement No. 133. SFAS No. 161 amends and expands the disclosure requirements of Statement 133 in order to provide users of financial statements with enhanced disclosures about an entity’s derivative and hedging activities and thereby improving the transparency of financial reporting. To meet these objectives, SFAS No. 161 requires qualitative disclosure about objectives and strategies for using derivatives, quantitative disclosures about fair value amounts of and gains and losses on derivative instruments, and disclosures about credit-risk-related contingent features in derivative agreements. SFAS No. 161 is effective for financial statements issued for fiscal years and interim periods beginning after November 15, 2008, with early application encouraged. We do not expect SFAS No. 161 to have a material impact on our consolidated results of operations or financial condition.
In February 2008, the FASB issued FASB Staff Position No. FAS 157-2,Effective Date of FASB Statement No. 157 (FSP 157-2), which delays the effective date of SFAS No. 157 for non-financial assets and non-financial liabilities, except for items that are recognized or disclosed at fair value in the financial statements on a recurring basis, at least annually to fiscal years beginning after November 15, 2008. Any amounts recognized upon adoption as a cumulative effect will be recorded to the opening balance of retained earnings in the year of adoption. We do not expect the adoption of FSP 157-2 to have a material impact on our consolidated results of operations or financial condition.
In December 2007, the FASB issued SFAS No. 141R,Business Combinations, which requires most identifiable assets, liabilities, non-controlling interests, and goodwill acquired in a business combination to be recorded at full fair value. SFAS No. 141R also requires, among other things, the acquisition costs to be expensed in the periods they are incurred, the contingent considerations resulting from events after the
72
Table of Contents
AFFIRMATIVE INSURANCE HOLDINGS, INC. AND SUBSIDIARIES
NOTES TO CONSOLIDATED FINANCIAL STATEMENTS—(Continued)
acquisition date to be measured and recognized at the acquisition date fair value with subsequent changes recognized in earnings, and the change in deferred tax benefit that are recognizable because of a business combination to be recognized either in income or directly in contributed capital in the period of business combination. SFAS No. 141R is effective for business combinations occurring after December 15, 2008. If we have business combinations after that date, SFAS No. 141R could have a material impact in the future on our consolidated results of operations or financial condition.
3. Acquisitions
USAgencies• On January 31, 2007, we completed the acquisition of USAgencies through a fully-financed all cash transaction valued at approximately $199.1 million. Goodwill of $97.8 million was recognized and represents future significant cash flows. The purchase of USAgencies was financed through $200.0 million in borrowings under a $220.0 million senior secured credit facility that was entered into concurrently with the completion of the acquisition. For accounting purposes, the transaction was effective as of January 1, 2007. The operating results of USAgencies have been included in our consolidated financial statements since that effective date.
The estimated fair values and useful lives of assets acquired and liabilities assumed are based on management’s valuation. We completed a valuation study to determine the allocation of the total purchase price to the various assets acquired and liabilities assumed. The final purchase price allocations did not result in material differences in allocations for tangible and intangible assets.
73
Table of Contents
AFFIRMATIVE INSURANCE HOLDINGS, INC. AND SUBSIDIARIES
NOTES TO CONSOLIDATED FINANCIAL STATEMENTS—(Continued)
The following table summarizes the allocation of the purchase price (in thousands):
Assets acquired: | |||
Cash and cash equivalents | $ | 22,749 | |
Investments | 79,164 | ||
Receivable from reinsurers | 83,545 | ||
Premium finance receivable | 37,270 | ||
Investment in real property | 6,080 | ||
Property and equipment | 4,303 | ||
Goodwill | 97,808 | ||
Other intangible assets | 11,500 | ||
Deferred tax assets | 7,494 | ||
Other assets | 4,090 | ||
Total assets acquired | 354,003 | ||
Liabilities assumed: | |||
Accounts payable and accrued liabilities | 8,617 | ||
Notes payable | 20,262 | ||
Reserve for losses and loss adjustment expenses | 71,522 | ||
Unearned premium | 45,463 | ||
Deferred revenue | 8,844 | ||
Capital leases | 162 | ||
Total liabilities assumed | 154,870 | ||
Total purchase price | 199,133 | ||
Less: Cash and cash equivalents acquired | 22,749 | ||
Net cash paid for acquisition | $ | 176,384 | |
Included in the purchase price allocation are intangible assets subject to amortization totaling $9.8 million, consisting of $1.0 million for a non-competition agreement, $4.7 million of customer relationships, $3.9 million of trade name and $200,000 of lease interest. As of December 31, 2008, these intangible assets had a carrying value of $3.1 million. Goodwill recorded in connection with the acquisition is not deductible for tax purposes. Other intangible assets related to state licenses of $1.7 million are not subject to amortization.
The following table presents unaudited pro forma financial information incorporating the historical (pre-acquisition) financial results of USAgencies (in thousands, except per share amounts). This information has been prepared as if the acquisition of USAgencies had been completed on January 1, 2006 as opposed to the actual date that the acquisition occurred. The unaudited pro forma information is based upon data currently available and certain estimates and assumptions made by management. As a result, this information is not necessarily indicative of the financial results had the transactions actually occurred on this date. Likewise, the unaudited pro forma information is not necessarily indicative of future results.
| December 31, 2006 | |||
| (Unaudited) | |||
Total revenues | $ | 442,388 | |
Net income | 16,147 | ||
Net income per common share | 1.06 | ||
Other Acquisitions • In March 2008, we paid $188,000 for the purchase of one of our franchise stores.
74
Table of Contents
AFFIRMATIVE INSURANCE HOLDINGS, INC. AND SUBSIDIARIES
NOTES TO CONSOLIDATED FINANCIAL STATEMENTS—(Continued)
In March 2006, we completed the acquisition of the 27% minority ownership interest of Space Coast Holdings, Inc. We paid approximately $3.2 million to the minority owners and recorded $3.2 million in goodwill. Consequently, our current ownership interest in Space Coast is 100%.
During 2007 and 2006, we paid $366,000 and $1.1 million, respectively, in contingent purchase price adjustments related to prior acquisitions. In 2006, we also paid $225,000 for the acquisition of two retail stores and $64,000 for the purchase of a franchise.
4. Trading Investment Securities
Our trading investment portfolio consists of fixed-income securities, which are carried at fair value with realized gains and losses reported in the current period’s earnings. The Investment Committee periodically reviews investment portfolio results and evaluates strategies to maximize yields, to match maturity durations with anticipated needs, and to maintain compliance with investment guidelines.
The amortized cost, realized losses and estimated fair value of our trading securities at December 31, 2008, are as follows (in thousands):
| Amortized Cost | Realized Losses | Fair Value | ||||||||
Trading securities | $ | 51,295 | $ | (11,140 | ) | $ | 40,155 | |||
As of December 31, 2008, we held $51.3 million par value and $40.2 million fair value of auction-rate tax-exempt securities. Generally, the interest rates for these securities are determined by bidding every 7, 28 or 35 days. When there are more sellers than buyers, an auction fails and bondholders that want to sell are left holding the securities. Auctions for these securities began to fail in late January 2008. Issuers remain obligated to pay interest and principal when due when an auction fails. Rates at failed auctions are set at a level established in the terms of the debt. In mid-February 2008, investment banks stopped committing capital to the auctions and there have been widespread auctions failures since that time.
In August 2008, our broker announced settlements in principle with each of the Division Enforcement of the U.S. Securities and Exchange Commission (SEC), the New York Attorney General and other state agencies to purchase all of its clients’ auction-rate securities at par and several other items including fines. In October 2008, our broker filed a prospectus with the SEC, which published a legally-binding offer to all authorized holders of auction-rate securities in our broker’s accounts (“the settlement”). The majority of our auction-rate securities qualify under the terms of our broker’s prospectus. The time frames that our broker has set for buybacks have different start dates based upon the individual client’s size, which is determined by each client’s balance of investments held at our broker. For the majority of our auction-rate holdings, the buybacks are expected to occur between July 2010 and two years thereafter. In November 2008, the Company elected to participate in our broker’s offer to purchase our auction-rate securities at par. In November 2008, we classified our portfolio of auction-rate securities as trading and recorded a realized loss of $11.1 million for the difference in fair value and carrying amount. The fair value of the settlement was $9.6 million which we elected to report in other assets with changes in fair value reported in other income.
Expected maturities may differ from contractual maturities because certain borrowers may have the right to call or prepay obligations with or without penalties. Our amortized cost and estimated fair value of trading securities at December 31, 2008 by contractual maturity are as follows (in thousands):
| Amortized Cost | Fair Value | |||||
Due after one year through five years | $ | 51,295 | $ | 40,155 | ||
75
Table of Contents
AFFIRMATIVE INSURANCE HOLDINGS, INC. AND SUBSIDIARIES
NOTES TO CONSOLIDATED FINANCIAL STATEMENTS—(Continued)
5. Available-for-sale Investment Securities
Our investment portfolio consists of fixed-income securities, which are classified as available-for-sale investment securities. Our available-for-sale investment securities are carried at fair value with unrealized gains and losses reported in our financial statements as a separate component of stockholders’ equity on an after-tax basis. The Investment Committee periodically reviews investment portfolio results and evaluates strategies to maximize yields, to match maturity durations with anticipated needs, and to maintain compliance with investment guidelines.
The amortized cost, gross unrealized gains (losses), and estimated fair value of our investments at December 31 are as follows (in thousands):
| Amortized Cost | Gross Unrealized Gains | Gross Unrealized Losses | Fair Value | ||||||||||
2008 | |||||||||||||
U.S. Government and agencies | $ | 28,482 | $ | 416 | $ | (107 | ) | $ | 28,791 | ||||
Mortgage-backed securities | 5,829 | 337 | — | 6,166 | |||||||||
Tax-exempt securities | 180,601 | 2,712 | (237 | ) | 183,076 | ||||||||
Corporate and other | 986 | — | (31 | ) | 955 | ||||||||
Total | $ | 215,898 | $ | 3,465 | $ | (375 | ) | $ | 218,988 | ||||
2007 | |||||||||||||
U.S. Government and agencies | $ | 7,546 | $ | 157 | $ | (5 | ) | $ | 7,698 | ||||
Mortgage-backed securities | 8,345 | 136 | (1 | ) | 8,480 | ||||||||
Tax-exempt securities | 366,178 | 1,555 | (26 | ) | 367,707 | ||||||||
Corporate and other | 6,262 | — | (38 | ) | 6,224 | ||||||||
Total | $ | 388,331 | $ | 1,848 | $ | (70 | ) | $ | 390,109 | ||||
Expected maturities may differ from contractual maturities because certain borrowers may have the right to call or prepay obligations with or without penalties. Our amortized cost and estimated fair value of fixed-income securities at December 31, 2008 by contractual maturity are as follows (in thousands):
| Amortized Cost | Fair Value | |||||
Due in one year or less | $ | 77,419 | $ | 78,037 | ||
Due after one year through five years | 117,320 | 119,127 | ||||
Due after five years through ten years | 9,409 | 9,652 | ||||
Due after ten years | 5,921 | 6,006 | ||||
Mortgage-backed securities | 5,829 | 6,166 | ||||
Total | $ | 215,898 | $ | 218,988 | ||
At December 31, 2008, we owned approximately $25.4 million of pre-refunded municipal bonds. These pre-refunded municipal bonds have contractual maturities in excess of ten years. However, due to pre-refunding, these securities will be called by the issuer generally within three years or less. Pre-refunded municipal bonds are created when municipalities issue new debt to refinance debt issued when interest rates were higher. Once the refinancing is completed, the issuer uses the proceeds to purchase U.S. Treasury securities and places these securities in an escrow account. These proceeds are then used to pay interest and principal on the original debt until the bond is called.
76
Table of Contents
AFFIRMATIVE INSURANCE HOLDINGS, INC. AND SUBSIDIARIES
NOTES TO CONSOLIDATED FINANCIAL STATEMENTS—(Continued)
Our amortized cost and estimated fair value of pre-refunded municipal bonds at December 31, 2008 by contractual maturity are as follows (in thousands):
| Amortized Cost | Fair Value | |||||
Due in one year or less | $ | 2,114 | $ | 2,092 | ||
Due after one year through five years | 16,011 | 16,135 | ||||
Due after five years through ten years | 4,158 | 4,196 | ||||
Due after ten years | 2,935 | 2,950 | ||||
Total | $ | 25,218 | $ | 25,373 | ||
Major categories of net investment income for the years ended December 31 are summarized as follows (in thousands):
| 2008 | 2007 | 2006 | ||||||||||
Available-for-sale investment securities | $ | 12,442 | $ | 14,745 | $ | 8,554 | ||||||
Trading securities | 161 | — | — | |||||||||
Rental income on real estate held for investment | 2,400 | 2,203 | — | |||||||||
Cash and cash equivalents | 210 | 966 | 450 | |||||||||
| 15,213 | 17,914 | 9,004 | ||||||||||
Less investment expense | (1,464 | ) | (1,470 | ) | (175 | ) | ||||||
Net investment income | $ | 13,749 | $ | 16,444 | $ | 8,829 | ||||||
Proceeds from sales, maturities, and principal receipts of investment securities were $224.2 million, $178.1 million, and $398.1 million for the years ended December 31, 2008, 2007, and 2006, respectively. Proceeds from investments sold prior to maturity were $150.5 million, $116.1 million, and $161.8 million for the years ended December 31, 2008, 2007, and 2006, respectively. Proceeds from investments sold at maturity were $73.7 million, $62.0 million, and $236.3 million for the years ended December 31, 2008, 2007, and 2006, respectively.
Gross realized gains and losses on investments for the years ended December 31 are summarized as follows (in thousands):
| 2008 | 2007 | 2006 | ||||||||||
Gross gains | $ | 585 | $ | 58 | $ | 82 | ||||||
Gross losses | (145 | ) | (657 | ) | (904 | ) | ||||||
Total | $ | 440 | $ | (599 | ) | $ | (822 | ) | ||||
77
Table of Contents
AFFIRMATIVE INSURANCE HOLDINGS, INC. AND SUBSIDIARIES
NOTES TO CONSOLIDATED FINANCIAL STATEMENTS—(Continued)
The following table shows our investments with gross unrealized losses and fair value, aggregated by investment category and length of time that individual securities have been in a continuous unrealized loss position at December 31, 2008 and 2007 (in thousands):
| December 31, 2008 | |||||||||||||||||||||
| Less Than Twelve Months | Over Twelve Months | Total | |||||||||||||||||||
| Gross Unrealized Losses | Fair Value | Gross Unrealized Losses | Fair Value | Gross Unrealized Losses | Fair Value | ||||||||||||||||
U.S. Government and agencies | $ | (107 | ) | $ | 6,861 | $ | — | $ | — | $ | (107 | ) | $ | 6,861 | |||||||
Tax-exempt securities | (213 | ) | 22,241 | (23 | ) | 940 | (236 | ) | 23,181 | ||||||||||||
Corporate and other | (32 | ) | 954 | — | — | (32 | ) | 954 | |||||||||||||
Total | $ | (352 | ) | $ | 30,056 | $ | (23 | ) | $ | 940 | $ | (375 | ) | $ | 30,996 | ||||||
| December 31, 2007 | |||||||||||||||||||||
| Less Than Twelve Months | Over Twelve Months | Total | |||||||||||||||||||
| Gross Unrealized Losses | Fair Value | Gross Unrealized Losses | Fair Value | Gross Unrealized Losses | Fair Value | ||||||||||||||||
U.S. Government and agencies | $ | (2 | ) | $ | 323 | $ | (3 | ) | $ | 322 | $ | (5 | ) | $ | 645 | ||||||
Mortgage-backed | — | 7 | (1 | ) | 1,012 | (1 | ) | 1,019 | |||||||||||||
Tax-exempt securities | (12 | ) | 8,015 | (14 | ) | 3,297 | (26 | ) | 11,312 | ||||||||||||
Corporate and other | (38 | ) | 5,923 | — | — | (38 | ) | 5,923 | |||||||||||||
Total | $ | (52 | ) | $ | 14,268 | $ | (18 | ) | $ | 4,631 | $ | (70 | ) | $ | 18,899 | ||||||
Our portfolio contains primarily only highly-rated, fixed-income securities. For fixed-income securities with unrealized losses due to market conditions, we have the positive intent and ability to hold the investment for a period of time sufficient to allow a market recovery or to maturity. Management did not believe any unrealized losses represent an other-than-temporary impairment based on our evaluation of available evidence at December 31, 2008.
At both December 31, 2008 and 2007, investments in fixed-maturity securities with an approximate carrying value of $1.9 million were on deposit with regulatory authorities as required by insurance regulations.
6. Reinsurance
In the ordinary course of business, we place reinsurance with other insurance companies in order to provide greater diversification of our business and limit the potential for losses arising from large risks. In addition, we assume reinsurance from other insurance companies.
78
Table of Contents
AFFIRMATIVE INSURANCE HOLDINGS, INC. AND SUBSIDIARIES
NOTES TO CONSOLIDATED FINANCIAL STATEMENTS—(Continued)
The effect of reinsurance on premiums written and earned was as follows (in thousands):
| Year Ended December 31, | ||||||||||||||||||||||||
| 2008 | 2007 | 2006 | ||||||||||||||||||||||
| Written | Earned | Written | Earned | Written | Earned | |||||||||||||||||||
Direct | $ | 324,826 | $ | 343,778 | $ | 379,518 | $ | 385,424 | $ | 201,132 | $ | 190,251 | ||||||||||||
Reinsurance assumed | 60,233 | 58,519 | 63,182 | 68,507 | 85,048 | 101,148 | ||||||||||||||||||
Reinsurance ceded | (44,671 | ) | (44,996 | ) | (35,133 | ) | (57,888 | ) | (1,373 | ) | (3,289 | ) | ||||||||||||
Total | $ | 340,388 | $ | 357,301 | $ | 407,567 | $ | 396,043 | $ | 284,807 | $ | 288,110 | ||||||||||||
Under certain of our reinsurance transactions, we have received ceding commissions. The ceding commission rate structure varies based on loss experience. The estimates of loss experience are continually reviewed and adjusted, and the resulting adjustments to ceding commissions are reflected in current operations. The ceding commissions recognized were reflected as a reduction of the following expenses (in thousands):
| Year Ended December 31, | ||||||
| 2008 | 2007 | |||||
Selling, general and administrative expenses | $ | 14,984 | $ | 17,897 | ||
Loss adjustment expenses | 389 | 480 | ||||
Total | $ | 15,373 | $ | 18,377 | ||
The amount of loss reserves and unearned premium we would remain liable for in the event our reinsurers are unable to meet their obligations was as follows (in thousands):
| Year Ended December 31, | ||||||
| 2008 | 2007 | |||||
Loss and loss adjustment expense | $ | 40,667 | $ | 46,854 | ||
Unearned premium | 11,037 | 11,371 | ||||
Total | $ | 51,704 | $ | 58,225 | ||
On April 1, 2007, we exercised our option to terminate certain quota-share contracts on a “cut-off” basis. In April 2007, we received $31.0 million to settle the unearned premiums less return ceding commissions. Effective January 1, 2009, we terminated our quota-share reinsurance contract on a cut-off basis. On January 29, 2009, we received $7.8 million of returned unearned premiums net of returned ceding commissions.
The following table summarizes the ceded incurred losses and loss adjustment expenses (consisting of ceded paid losses and loss adjustment expenses and change in reserves for loss and loss adjustment expenses ceded) to various reinsurers for the years ended December 31, 2008, 2007 and 2006 (in thousands):
| 2008 | 2007 | 2006 | |||||||||
Paid losses and loss adjustment expenses ceded | $ | 37,445 | $ | 60,121 | $ | 6,518 | |||||
Change in reserves for loss and loss adjustment expenses ceded | (6,112 | ) | (18,406 | ) | 2,419 | ||||||
Incurred losses and loss adjustment expenses ceded | $ | 31,333 | $ | 41,715 | $ | 8,937 | |||||
79
Table of Contents
AFFIRMATIVE INSURANCE HOLDINGS, INC. AND SUBSIDIARIES
NOTES TO CONSOLIDATED FINANCIAL STATEMENTS—(Continued)
The Michigan Catastrophic Claims Association (MCCA) is a reinsurance facility that covers no-fault medical losses above a specific retention amount. For policies effective July 1, 2008 to June 30, 2009, the required retention is $0.4 million. As a writer of personal automobile policies in the state of Michigan, we cede premiums and claims to the MCCA. Funding for MCCA comes from assessments against automobile insurers based upon their proportionate market share of the state’s automobile liability insurance market. Insurers are allowed to pass along this cost to Michigan automobile policyholders. Our ceded premiums written to the MCCA were $1.9 million, $3.6 million and $1.8 million in 2008, 2007 and 2006, respectively. We did not issue policies in Michigan prior to 2006.
At December 31, 2008, our total receivables from reinsurers were $63.3 million, consisting of $28.9 million from a quota-share reinsurer (rated A- by A.M. Best) for business reinsured in Louisiana and Alabama, $14.2 million net receivable (net of $2.9 million payable) from subsidiaries of Vesta Insurance Group (VIG), including primarily Vesta Fire Insurance Corporation (VFIC), $16.0 million receivable from the Michigan Catastrophic Claims Association, the mandatory reinsurance association in Michigan and $4.2 million receivables from other reinsurers. Under the reinsurance agreement with VFIC, AIC had the right, under certain circumstances, to require VFIC to provide a letter of credit or establish a trust account to collateralize the gross amount due AIC and Insura Property and Casualty Insurance Company from VFIC under the reinsurance agreement. Accordingly, AIC, Insura and VFIC entered into a Security Fund Agreement effective September 1, 2004. On August 30, 2005, AIC received a letter from VFIC’s President that irrevocably confirmed VFIC’s duty and obligation under the Security Fund Agreement to provide security sufficient to satisfy VFIC’s gross obligations under the reinsurance agreement (the VFIC Trust). At December 31, 2008, the VFIC Trust held $17.1 million (after AIC’s withdrawals of $7.4 million from the VFIC Trust since the fourth quarter of 2007) to collateralize the $17.1 million gross recoverable from VFIC.
In June 2006, the Texas Department of Insurance (TDI) placed VFIC, along with several of its affiliates, into rehabilitation and subsequently into liquidation (except for VIG which remains in rehabilitation). In accordance with the TDI liquidation orders, all VIG subsidiary reinsurance agreements were terminated. Prior to the termination, we assumed various quota-share percentages according to which managing general agents (MGAs) produced the business. With respect to business produced by certain MGAs, we assumed 100% of the contracts. For business produced by other MGAs, our assumption was net after VIG cession to other reinsurers. For this latter assumed business, the other reinsurers and their participation varied by MGA. Prior to the termination of the VIG subsidiary reinsurance agreements, the agreements contained no maximum loss limit other than the underlying policy limits. The ceding company’s retention was zero and these agreements could be terminated at the end of any calendar quarter by either party with prior written notice of not less than 90 days.
Our other significant assumed reinsurance agreement is with a Texas county mutual insurance company (the county mutual) whereby we have assumed 100% of the policies issued by the county mutual for business produced by our owned MGAs. The county mutual does not retain any of this business and there are no loss limits other than the underlying policy limits. The county mutual reinsurance agreement may be terminated by either party upon prior written notice of not less than 90 days. In the event of such termination, the MGA agrees that for ten years the MGA shall produce automobile insurance business in the State of Texas solely for the benefit of the county mutual. The county mutual reinsurance agreement automatically terminates on January 1, 2014. AIC has established a trust to secure our obligation under this reinsurance contract with a balance of $24.8 million as of December 31, 2008.
80
Table of Contents
AFFIRMATIVE INSURANCE HOLDINGS, INC. AND SUBSIDIARIES
NOTES TO CONSOLIDATED FINANCIAL STATEMENTS—(Continued)
Assumed written premiums by ceding insurer were as follows (in thousands):
| Year Ended December 31, | |||||||||||
| 2008 | 2007 | 2006 | |||||||||
VIG Subsidiaries: | |||||||||||
Vesta Fire | $ | — | $ | — | $ | 704 | |||||
Vesta Insurance Corporation | — | — | 2,139 | ||||||||
Hawaiian Insurance & Guaranty Co. | — | (5 | ) | 7,806 | |||||||
Shelby | — | — | 1 | ||||||||
Subtotal | — | (5 | ) | 10,650 | |||||||
County mutual insurance company | 60,256 | 63,187 | 74,398 | ||||||||
Others | (23 | ) | — | — | |||||||
Total | $ | 60,233 | $ | 63,182 | $ | 85,048 | |||||
At December 31, 2008, $12.4 million was included in reserves for losses and loss adjustment expenses that represented the amounts owed from AIC and Insura under reinsurance agreements with the VIG affiliated companies, including Hawaiian Insurance and Guaranty Company, Ltd (Hawaiian). Affirmative established a trust account to collateralize this payable, which currently holds $22.9 million (including accrued interest) in securities (the AIC Trust). The AIC Trust has not been drawn upon by the SDR in Texas or the SDR in Hawaii. It is the expectation that the terms for withdrawal of funds from the AIC trust will be similar to those we expect to be agreed to in regards to the VFIC Trust.
Effective August 1, 2005, we entered into novation agreements with several unaffiliated reinsurers who participated in a quota-share reinsurance agreement in which we also participated. Pursuant to these agreements, we were substituted in place of these reinsurers assuming all rights, interests, liabilities and obligations related to the original quota-share reinsurance agreement. As a result of these novation agreements, our participation in the original reinsurance agreement increased from 5% to 100% effective August 1, 2005. In consideration for our assumption of their liabilities, these reinsurers agreed to pay us an amount equal to their share of the liabilities under the original quota-share agreement as of July 31, 2005. The terms of this reinsurance agreement did not meet the risk transfer requirements according to SFAS No. 113; therefore, this contract was accounted for as deposits according to the guidelines of SOP 98-7,Deposit Accounting for Insurance and Reinsurance Contracts that do not Transfer Insurance Risk. If the estimated deposit liabilities are less than the recorded liabilities, we record excess deposit liabilities as income based on a percentage of actual paid losses. We believe that this methodology approximates the effective interest method prescribed in SOP 98-7. Changes in the carrying amount of the deposit liability should be reported as income or expense as appropriate. We received cash in the amount of $14.2 million in relation to this novation. The deferred gain initially totaled $1.8 million, of which we recognized $0.1 million, $0.4 million, and, $0.7 million in income for the years ended December 31, 2008, 2007, and 2006, respectively.
The guidance used in determining whether reinsurance contracts contain elements of risk transfer necessary to use reinsurance accounting is stated in paragraph 9 of SFAS No. 113. This paragraph provides that a reinsurer shall not be considered to have assumed significant insurance risk under the reinsurance contract if the probability of a significant variation in either the amount or timing of payments by the reinsurer is remote. SFAS No. 113 specifically provides that whenever a reinsurance contract does not transfer risk, then that reinsurance contract must be accounted for as a deposit-type reinsurance contract.
We evaluated the transaction and concluded that we did not assume significant insurance risk because the probability of a significant variation in the amount of payments by the reinsurers was remote. This was primarily
81
Table of Contents
AFFIRMATIVE INSURANCE HOLDINGS, INC. AND SUBSIDIARIES
NOTES TO CONSOLIDATED FINANCIAL STATEMENTS—(Continued)
due to a sliding scale profit commission payable by the reinsurer to us should there be favorable loss development. This profit commission made the likelihood very remote that the reinsurer would have any significant additional gain or loss on this block of business. The reinsurers will ultimately make the same payments, either to us from profit commission or for the full amount of losses and loss adjustment expenses. The combined cost to the reinsurer is the same. Consequently, since no significant risk was transferred, the use of deposit accounting was required and the use of reinsurance accounting was impermissible under SFAS No. 113. At December 31, 2008, there were no deposit assets and $0.4 million of deposit liabilities recorded on the balance sheet for this contract.
7. Premium Finance Receivable
Finance receivables, which are secured by unearned premiums from the underlying insurance policies, consisted of the following at December 31, 2008 and 2007 (in thousands):
| 2008 | 2007 | |||||||
Premium finance contracts | $ | 44,364 | $ | 37,353 | ||||
Unearned finance charges | (2,972 | ) | (2,595 | ) | ||||
Allowance for credit losses | (405 | ) | (550 | ) | ||||
Total | $ | 40,987 | $ | 34,208 | ||||
8. Policy Acquisition Expenses
Policy acquisition costs, consisting of primarily commission, advertising, premium taxes, underwriting and agency expenses, are deferred and charged against income ratably over the terms of the related policies. The components of deferred policy acquisition costs and the related policy acquisition expenses amortized to expense were as follows (in thousands):
| Year Ended December 31, | ||||||||
| 2008 | 2007 | |||||||
Beginning balance | $ | 24,536 | $ | 23,865 | ||||
Additions | 69,702 | 70,853 | ||||||
Amortization | (72,245 | ) | (70,182 | ) | ||||
Ending balance | $ | 21,993 | $ | 24,536 | ||||
9. Property and Equipment
A summary of property and equipment at December 31, 2008 and 2007 were as follows (in thousands):
| 2008 | 2007 | |||||||
Data processing equipment | $ | 6,933 | $ | 6,420 | ||||
Furniture and office equipment | 4,896 | 4,507 | ||||||
Computer software | 42,323 | 8,992 | ||||||
Leasehold improvements | 8,512 | 7,887 | ||||||
Work in progress | 4,423 | 17,293 | ||||||
Automobiles | 606 | 322 | ||||||
| 67,693 | 45,421 | |||||||
Accumulated depreciation | (25,550 | ) | (15,977 | ) | ||||
Property and equipment, net | $ | 42,143 | $ | 29,444 | ||||
82
Table of Contents
AFFIRMATIVE INSURANCE HOLDINGS, INC. AND SUBSIDIARIES
NOTES TO CONSOLIDATED FINANCIAL STATEMENTS—(Continued)
Depreciation expense was $7.4 million, $5.4 million, and $2.9 million for the years ended December 31, 2008, 2007 and 2006, respectively.
In 2008, we recognized a realized gain on disposal of assets of $12,000. In 2007 and 2006, we recognized realized losses on disposal of assets of $146,000 and $432,000, respectively.
10. Goodwill and Other Intangible Assets
As of September 30, 2008, the Company completed its annual goodwill and other intangible asset impairment analysis. Consistent with prior assessments, the fair value of goodwill and intangibles was determined using an internally developed discounted cash flow methodology and other relevant indicators of value available in the market place such as market transactions and trading values of similar companies. Based upon the results of the assessment, the Company concluded that the carrying value of other intangible assets related to the Company’s Florida operations exceeded fair value, resulting in an impairment loss of $4.4 million for non-amortizable other intangible assets and $0.2 million for amortizable other intangible assets. The impairment loss is included in impairment of intangible assets in the income statement.
Changes in the carrying value of goodwill for the year ended December 31, 2008 and 2007 were as follows (in thousands):
| Year Ended December 31, | ||||||
| 2008 | 2007 | |||||
Beginning balance | $ | 163,462 | $ | 65,288 | ||
Acquisitions | 188 | 97,808 | ||||
Contingent considerations paid for prior acquisitions | — | 366 | ||||
Ending balance | $ | 163,650 | $ | 163,462 | ||
Other intangible assets at December 31, 2008 and 2007 were as follows (in thousands):
| 2008 | 2007 | |||||||||||||||||||||||
| Cost | Impairment | Accumulated Amortization | Net | Cost | Accumulated Amortization | Net | ||||||||||||||||||
Amortizable intangible assets: | ||||||||||||||||||||||||
Non-competition agreements | $ | 5,354 | $ | — | $ | (5,354 | ) | $ | — | $ | 5,354 | $ | (4,854 | ) | $ | 500 | ||||||||
Agency and customer relationships | 8,207 | (212 | ) | (5,349 | ) | 2,646 | 8,207 | (4,090 | ) | 4,117 | ||||||||||||||
Trade names | — | — | — | — | 3,900 | (1,300 | ) | 2,600 | ||||||||||||||||
Leases | 200 | — | (200 | ) | — | 200 | (200 | ) | — | |||||||||||||||
Non-amortizable intangible assets: | ||||||||||||||||||||||||
Trade names and licenses | 20,306 | (4,397 | ) | (1,300 | ) | 14,609 | 16,406 | — | 16,406 | |||||||||||||||
Total | $ | 34,067 | $ | (4,609 | ) | $ | (12,203 | ) | $ | 17,255 | $ | 34,067 | $ | (10,444 | ) | $ | 23,623 | |||||||
83
Table of Contents
AFFIRMATIVE INSURANCE HOLDINGS, INC. AND SUBSIDIARIES
NOTES TO CONSOLIDATED FINANCIAL STATEMENTS—(Continued)
Amortization expense for the intangible assets was as follows (in thousands):
Amortization expense for the years ended December 31: | |||
2008 | $ | 1,759 | |
2007 | 5,832 | ||
2006 | 1,452 | ||
Estimated future amortization expense for the years ending December 31: | |||
2009 | $ | 559 | |
2010 | 272 | ||
2011 | 158 | ||
2012 | 158 | ||
2013 | 158 | ||
Amortization expense will be recognized over a weighted-average period of approximately 11.4 years.
11. Losses and Loss Adjustment Expenses
The following table provides a reconciliation of the beginning and ending reserves for unpaid losses and loss adjustment expenses for the periods indicated (in thousands):
| Year Ended December 31, | |||||||||||
| 2008 | 2007 | 2006 | |||||||||
Gross balance at beginning of year | $ | 227,947 | $ | 162,569 | $ | 142,977 | |||||
Less: Reinsurance recoverable | 46,854 | 21,590 | 19,169 | ||||||||
Less: Deposits | 349 | 2,558 | 7,699 | ||||||||
Net balance at beginning of year | 180,744 | 138,421 | 116,109 | ||||||||
Acquisition of USAgencies | — | 27,810 | — | ||||||||
Adjusted reserves, net of reinsurance | 180,744 | 166,231 | 116,109 | ||||||||
Incurred related to: | |||||||||||
Current year | 270,665 | 294,747 | 190,580 | ||||||||
Prior years | 3,726 | (5,023 | ) | (5,234 | ) | ||||||
Paid related to: | |||||||||||
Current year | 164,690 | 175,976 | 100,319 | ||||||||
Prior years | 126,991 | 99,235 | 62,715 | ||||||||
Net balance at the end of year | 163,454 | 180,744 | 138,421 | ||||||||
Reinsurance recoverable | 40,667 | 46,854 | 21,590 | ||||||||
Deposits | 516 | 349 | 2,558 | ||||||||
Gross balance at the end of year | $ | 204,637 | $ | 227,947 | $ | 162,569 | |||||
We had adverse reserve development relating to prior year losses of $3.7 million in 2008 and favorable development of $5.0 million and $5.2 million in 2007 and 2006, respectively. These reserve changes resulted from revisions to the estimates of the ultimate liability for losses and related loss adjustment expense for claims reported in previous periods.
84
Table of Contents
AFFIRMATIVE INSURANCE HOLDINGS, INC. AND SUBSIDIARIES
NOTES TO CONSOLIDATED FINANCIAL STATEMENTS—(Continued)
12. Notes Payable
Our long-term debt instruments and balances outstanding at December 31, 2008 and 2007 were as follows (in thousands):
| 2008 | 2007 | |||||
Notes payable due 2035 | $ | 30,928 | $ | 30,928 | ||
Notes payable due 2035 | 25,774 | 25,774 | ||||
Notes payable due 2035 | 20,207 | 20,228 | ||||
Total notes payable | $ | 76,909 | $ | 76,930 | ||
The $30.9 million notes payable due 2035 are redeemable in whole or in part by the issuer after five years. The notes were issued in December 2004 and bear an initial interest rate of 7.545 percent until December 15, 2009, at which time the securities will adjust quarterly to the three-month LIBOR rate plus 3.6 percent.
The $25.8 million notes payable due 2035 are redeemable in whole or in part by the issuer after five years. The notes were issued in June 2005 and bear an initial interest rate of 7.792% until June 15, 2010, at which time they will adjust quarterly to the three-month LIBOR rate plus 3.55 percent.
The $20.2 million notes payable due 2035 are redeemable in whole or in part anytime after March 15, 2010. Prior to March 15, 2010, the notes may only be redeemed in whole or in part subject to certain specific restrictions and prepayment penalties pursuant to the indenture agreement. The notes were issued in March 2005 and bear an initial interest rate of the three-month Libor rate plus 3.95 percent not exceeding 12.5 percent through March 2010 with no limit thereafter.
13. Senior Secured Credit Facility
In 2007, we entered into a $220.0 million senior secured credit facility (the facility) provided by a syndicate of lenders that provide for a $200.0 million senior term loan facility, which we immediately borrowed under a term loan, and a revolving facility of up to $20.0 million, depending on our borrowing capacity. As of December 31, 2008, we have no borrowings under the revolving portion of the facility. Our obligations under the facility are guaranteed by our material operating subsidiaries (other than our insurance companies) and are secured by a first lien security interest on all of our assets and the assets of our material operating subsidiaries (other than our insurance companies), including a pledge of 100% of the stock of AIC. The facility contains certain financial covenants, which include capital expenditure limitations, minimum interest coverage requirements, maximum leverage ratio requirements, minimum risk-based capital requirements, maximum combined ratio limitations, minimum fixed charge coverage ratios and a minimum consolidated net worth requirement, as well as other restrictive covenants. As time passes, certain of the financial covenants become increasingly more restrictive. At December 31, 2008, we were in compliance with all of our financial and other covenants.
In connection with entering into the facility, we paid $6.6 million in deferred debt acquisition costs that is being amortized over the seven-year term of the facility.
85
Table of Contents
AFFIRMATIVE INSURANCE HOLDINGS, INC. AND SUBSIDIARIES
NOTES TO CONSOLIDATED FINANCIAL STATEMENTS—(Continued)
The following table summarizes our term loan scheduled payments (in thousands):
2009 | $ | 1,395 | |
2010 | 1,395 | ||
2011 | 1,395 | ||
2012 | 1,395 | ||
2013 | 1,395 | ||
Thereafter | 129,702 | ||
Total | $ | 136,677 | |
The principal amount of the term loan is payable in quarterly installments of $348,665, with the remaining balance due on the seventh anniversary of the closing of the facility. Beginning in 2008, we were also required to make additional annual principal payments that are to be calculated based upon our financial performance during the preceding fiscal year. In addition, certain events, such as the sale of material assets or the issuance of significant new equity, necessitate additional required principal repayments.
The interest rate is determined at the beginning of each interest period based on the Alternative Base Rate (ABR) or the Adjusted Libor Rate as defined in the credit agreement. The ABR is the greater of (a) the prime rate plus 2.50% or (b) the federal funds rate plus 3.00%. The Adjusted Libor Rate is the one, two, three or six month Libor rate plus a margin of 3.50%. The interest rate on the borrowings under the facility at December 31, 2008 was 6.12%, as determined by using the applicable Libor rates plus a margin of 3.50%.
In April 2007, we entered into an interest rate swap with a notional amount of $50.0 million that was designated as a hedge of variable cash flows associated with that portion of the facility. This derivative instrument requires quarterly settlements whereby we pay a fixed rate of 4.993% and receive a three-month Libor rate. The derivative expires in April 2011. In January 2008, we entered into an additional interest rate swap with a notional amount of $95.0 million that was also designated a hedge of variable cash flows associated with the senior term loan. The notional amount of the swap gradually declines to $40.0 million prior to its expiration and was $85.0 million as of December 31, 2008. For this swap, we pay a fixed rate of 3.031% and receive a three-month LIBOR rate. The derivative expires in February 2011. We utilize the hypothetical derivative methodology for the measurement of ineffectiveness. Derivative gains and losses not effective in hedging the expected cash flows are recognized immediately in earnings. There were no components of the derivative instrument that were excluded from the assessment of hedge effectiveness.
We have designated this derivative instrument as a cash flow hedge in accordance with SFAS No. 133,Accounting for Derivative Instruments and Hedging Activities, as subsequently amended by SFAS No. 138,Accounting for Certain Derivative Instruments and Certain Hedging Activities —an amendment of SFAS No. 133. The credit risk associated with this contract is limited to the uncollected interest payments and the fair market value of the derivative to the extent it has become favorable to us.
On March 27, 2009, we entered into an amendment to the facility. The amendment included the following changes:
| • | The leverage ratio covenant calculation has been changed to include only amounts borrowed under the facility. In addition, the quarterly requirements have been changed for the remaining term of the facility. |
| • | The interest coverage ratio covenant calculation has been changed to include only interest expense paid in cash. In addition, the quarterly requirements have been changed for the remaining term of the facility. |
86
Table of Contents
AFFIRMATIVE INSURANCE HOLDINGS, INC. AND SUBSIDIARIES
NOTES TO CONSOLIDATED FINANCIAL STATEMENTS—(Continued)
| • | The combined ratio covenant has been replaced with a loss ratio covenant. |
| • | The fixed charge coverage ratio covenant calculation has been changed to include only interest expense paid in cash. In addition, the annual requirements have been changed for the remaining term of the facility. |
| • | The consolidated net worth covenant calculation has been changed to a covenant that excludes goodwill and includes subordinated debt. |
| • | Asset sales are now allowed for transactions with less than 80% of cash proceeds. Financing is limited to $5 million per transaction and $10 million in the aggregate. |
| • | A sale and leaseback transaction of capitalized technology assets is allowed for up to $30 million. |
| • | The pricing under the agreement has been changed as follows: |
| ¡ | A LIBOR floor of 3.0% has been established. |
| ¡ | Pricing depends on the amount of the leverage ratio. If the leverage ratio is greater than 2.0, the pricing is LIBOR plus 6.25%. If the leverage ratio is greater than 1.5 and less than or equal to 2.0, the pricing is LIBOR plus 6.00%. If the leverage ratio is less than or equal to 1.5, the pricing is LIBOR plus 5.75%. |
| • | Common stock dividends are permitted only if the leverage ratio is less than or equal to 1.5. |
| • | The revolving facility was reduced from $20 million to $10 million. |
In addition, we paid 0.50% to all lenders that approved the amendment. The amendment will increase our interest costs for the facility in the future.
14. Income Taxes
The provision for income taxes for the years ended December 31 consisted of the following (in thousands):
| 2008 | 2007 | 2006 | ||||||||||
Current tax expense (benefit) | $ | 1,104 | $ | (2,673 | ) | $ | (3,281 | ) | ||||
Deferred tax expense (benefit) | (4,479 | ) | 4,778 | 5,942 | ||||||||
Net income taxes (benefit) | $ | (3,375 | ) | $ | 2,105 | $ | 2,661 | |||||
Our effective tax rate differed from the statutory rate of 35% for the years ended December 31 as follows:
| 2008 | 2007 | 2006 | |||||||
Statutory federal income tax rate | (35.0 | )% | 35.0 | % | 35.0 | % | |||
Increases (reductions) resulting from: | |||||||||
Tax-exempt interest | (137.6 | ) | (22.8 | ) | (15.9 | ) | |||
State income taxes | 4.1 | 3.9 | 1.5 | ||||||
Other | (5.8 | ) | 1.8 | 0.7 | |||||
Net income taxes (benefit) | (174.3 | )% | 17.9 | % | 21.3 | % | |||
87
Table of Contents
AFFIRMATIVE INSURANCE HOLDINGS, INC. AND SUBSIDIARIES
NOTES TO CONSOLIDATED FINANCIAL STATEMENTS—(Continued)
Tax effects of temporary differences that give rise to significant portions of our deferred tax assets and deferred tax liabilities at December 31, 2008 and 2007 were as follows (in thousands):
| 2008 | 2007 | |||||
Deferred tax assets: | ||||||
Unearned and advance premiums | $ | 6,864 | $ | 8,613 | ||
Net operating loss carryforward | 9,353 | 8,045 | ||||
Discounted unpaid losses | 2,588 | 1,698 | ||||
Deferred revenue | 2,756 | 3,014 | ||||
Allowance for doubtful accounts | 2,666 | 2,717 | ||||
Capital loss carryforward | 1,008 | 896 | ||||
Depreciation on fixed assets | 643 | 545 | ||||
Unrealized losses | 996 | — | ||||
Alternative minimum tax and work opportunity credits | 979 | — | ||||
Other | 4,825 | 3,057 | ||||
Total deferred tax assets | 32,678 | 28,585 | ||||
Deferred tax liabilities: | ||||||
Deferred acquisition costs | 7,698 | 9,037 | ||||
Unrealized gains | — | 11 | ||||
Goodwill | 7,513 | 7,667 | ||||
Other | — | 1 | ||||
Total deferred tax liabilities | 15,211 | 16,716 | ||||
Deferred tax assets, net, before valuation allowance | 17,467 | 11,869 | ||||
Valuation allowance | 1,008 | 896 | ||||
Deferred tax assets, net | $ | 16,459 | $ | 10,973 | ||
In assessing the realizability of deferred tax assets, we consider whether it is more likely than not that some portion or all of our deferred tax assets will not be realized. Our ultimate realization of deferred tax assets is dependent upon our generation of future taxable income during the periods in which those temporary differences become deductible. We have not established a valuation allowance against deferred tax assets, other than discussed below, as we believe it is more likely than not the net deferred tax asset will be realized.
As of December 31, 2008, we have available for income tax purposes approximately $26.7 million in federal net operating loss carryforwards (NOLs), which may be used to offset future taxable income. Our NOLs expire as follows (in thousands):
2020 | $ | 7,444 | |
2021 | 5,952 | ||
2022 | 90 | ||
2023 | 3 | ||
2024 | 2,140 | ||
2027 | 5,026 | ||
2028 | 6,068 | ||
| $ | 26,723 | ||
88
Table of Contents
AFFIRMATIVE INSURANCE HOLDINGS, INC. AND SUBSIDIARIES
NOTES TO CONSOLIDATED FINANCIAL STATEMENTS—(Continued)
At December 31, 2008, we have available approximately $2.9 million of capital loss carryforward resulting primarily from sales of securities executed in 2006 and 2007 to adjust the duration of our investment portfolio. This capital loss carryforward, which may be carried forward for five years, may only be used to offset future realized capital gains. We recorded a valuation allowance for the full amount of the deferred tax asset resulting from this capital loss carryforward. We believe the available objective evidence, principally the capital loss carryforward being utilizable to offset only future capital gains, our current investment strategy, and a lack of significant historical realized capital gains creates sufficient uncertainty regarding the realizability of our capital loss carryforward.
Our capital loss carryforwards expire as follows (in thousands):
2011 | $ | 2,086 | |
2012 | 794 | ||
| $ | 2,880 | ||
15. Commitments
In October 2006, we entered into an IT outsourcing contract with a data processing services provider under which we outsourced substantially all of our IT operations, including our data center, field support and application management. The initial term of the agreement was ten years, although it may be terminated for convenience by us at any time upon six month’s notice after the first two years, subject to the payment of certain stranded costs and other termination fees. Our IT outsourcing expenses were $12.7 million, $11.5 million and $6.6 million for the years ended December 31, 2008, 2007 and 2006, respectively.
As of December 31, 2008, we leased office space for our agencies, insurance companies and retail stores in various locations throughout the United States. Our operating lease rental expenses were $9.6 million, $10.2 million and $8.9 million for the years ended December 31, 2008, 2007 and 2006, respectively.
The following table summarizes our minimum future IT outsourcing and operating lease commitments at December 31, 2008 (in thousands):
2009 | $ | 13,915 | |
2010 | 6,688 | ||
2011 | 3,748 | ||
2012 | 2,491 | ||
2013 | 1,966 | ||
Thereafter | 5,641 | ||
Total | $ | 34,449 | |
16. Legal and Regulatory Proceedings
We and our subsidiaries are named from time to time as parties in various legal actions arising in the ordinary course of our business and arising out of or related to claims made in connection with our insurance policies and claims handling. We believe that the resolution of these legal actions will not have a material adverse effect on our financial position or results of operations. However, the ultimate outcome of these matters is uncertain.
89
Table of Contents
AFFIRMATIVE INSURANCE HOLDINGS, INC. AND SUBSIDIARIES
NOTES TO CONSOLIDATED FINANCIAL STATEMENTS—(Continued)
In December 2003, InsureOne Independent Agency, LLC (InsureOne), American Agencies General Agency, Inc. and Affirmative Insurance Holdings, Inc. brought action in the Circuit Court of Cook County, Illinois to enforce non-compete and non-solicitation agreements entered into with James Hallberg, the former president of InsureOne, a wholly-owned subsidiary, and eight former employees of InsureOne and two of Hallberg’s family trusts. On November 21, 2008, the Court entered a Memorandum Order and Judgment, which was amended on January 20, 2009, entering judgment in favor of InsureOne Independent Agency, LLC, American Agencies General Agency, Inc. and Affirmative Insurance Holdings, Inc., awarding us $7.7 million, plus reasonable attorneys’ fees and costs. The Court also entered judgment in favor of James Hallberg on a counterclaim, awarding him $130,168, plus attorneys’ fees and costs.
In October 2002, the named plaintiff Nickey Marsh filed suit in the Fourth Judicial District Court of Louisiana against USAgencies alleging that certain adjustments to the actual cash value of his total loss automobile claim were improper. In October 2003, the action was amended to a class action and the court certified the class in August 2006. On March 3, 2009, we executed a settlement agreement with the plaintiff which, subject to class notice and final court approval, will resolve this proceeding. Pursuant to the terms of the Acquisition Agreement between us and USAgencies, the selling parties are bound to indemnify us from any and all losses attendant to claims arising out of the Marsh litigation out of a sum placed into escrow specifically for such purpose.
From time to time, we and our subsidiaries are subject to random compliance audits from federal and state authorities regarding various operations within our business that involve collecting and remitting taxes in one form or another. In 2006, two of our owned underwriting agencies were subject to a sales and use tax audit conducted by the State of Texas. The examiner for the State of Texas completed his audit report and delivered an audit assessment asserting that, for the period from January 2002 to December 2005, we should have collected and remitted approximately $2.9 million in sales tax derived from claims services performed by our underwriting agencies for policies sold by these underwriting agencies and issued by an affiliated county mutual insurance company through a fronting arrangement. Our insurance companies reinsured 100% of these policies. The assessment included an additional $0.4 million for accrued interest and penalty for a total assessment of $3.3 million. We believe that these services are not subject to sales tax and are vigorously contesting the assertions made by the state and exercising all available rights and remedies available to us. In October 2006, we responded to the assessment by filing petitions with the Comptroller of Public Accounts for the State of Texas requesting a re-determination of the tax due and a hearing to present written and oral evidence and legal arguments to contest the imposition of the asserted taxes. As a result of the timely filing of these petitions, an administrative appeal process has commenced and the date for payment is delayed until the completion of the appeal process. Such appeals routinely take up to three years and much longer for complex cases. As such, the outcome of this tax assessment will not be known for a commensurate amount of time. At this time, we are uncertain of the probability of the outcome of our appeal and therefore cannot reasonably estimate the ultimate liability. We have not made an accrual for this potential liability as of December 31, 2008.
Affirmative Insurance Company is a party to a 100% quota-share reinsurance agreement with Hawaiian Insurance and Guaranty Company, Ltd (Hawaiian), which is ultimately a wholly-owned subsidiary of VIG. In November 2004, Hawaiian was named among a group of four other named defendants and twenty unnamed defendants in a complaint filed in the Superior Court of the State of California for the County of Los Angeles alleging causes of action as follows: enforcement of coverage under Hawaiian’s policy of an underlying default judgment plaintiff obtained against Hawaiian’s former insured, who was denied a defense in the underlying lawsuit due to his failure to timely pay the Hawaiian policy premium; ratification and waiver of policy lapse and declaratory relief against Hawaiian; breach of implied covenant of good faith and fair dealing against Hawaiian with the plaintiff as the assignee of the insured; intentional misconduct as to the defendant SCJ Insurance
90
Table of Contents
AFFIRMATIVE INSURANCE HOLDINGS, INC. AND SUBSIDIARIES
NOTES TO CONSOLIDATED FINANCIAL STATEMENTS—(Continued)
Services (SCJ); and professional negligence as to the defendants Prompt Insurance Services, Paul Ruelas, and Anthony David Medina. SCJ, Prompt Insurance Services, Paul Ruelas, and Anthony David Medina are not affiliated with AIC. The plaintiff sought to enforce an underlying default judgment obtained against Hawaiian’s insured in September 2004 in the amount of $35.0 million and additional bad faith damages including punitive damages in the amount of $35.0 million. In August 2005, plaintiff served a copy of its Second Amended Complaint, which added a cause of action for fraud and deceit against all defendants, and a cause of action for negligent misrepresentation against Hawaiian and SCJ.
In January 2006, Judge Bigelow absolved Hawaiian and SCJ of all counts plaintiff filed against them in this litigation on the trial court level by virtue of court order on motions for summary judgment that were submitted by both Hawaiian and SCJ. A partial dismissal without prejudice was entered as to defendant Paul Ruelas. Plaintiff filed a notice of appeal in April 2006. In September 2006, Hawaiian moved to stay appellate proceedings pursuant to an Order of Liquidation entered in August 2006, in the Circuit Court for the State of Hawaii.
In October 2006, The Court of Appeal of the State of California, Second Appellate District, Division Five, granted the stay order requested by Hawaiian. In December 2006, the court modified its October 2006 stay order by lifting it as to SCJ, causing the suit to proceed with SCJ as the sole defendant. Hawaiian filed a status update with the court in March 2007, indicating that the liquidation proceeding for Hawaiian remained pending and in full force and effect. On March 15, 2007, plaintiff moved the Court of Appeal to lift the stay and that motion was denied. On March 27, 2007, plaintiff filed a petition with the Supreme Court of California for review of the Court of Appeal’s order denying plaintiff’s motion to lift the stay, and in July 2007, the Supreme Court of California denied that petition. At this time, we are uncertain of the probability of the outcome of plaintiff’s appeal and therefore cannot reasonably estimate the ultimate liability.
17. Net Income per Share
The following table sets forth the reconciliation of numerators and denominators for the basic and diluted earnings per share computation for each of the years ended December 31, 2008, 2007 and 2006 (in thousands, except per share amounts):
| 2008 | 2007 | 2006 | |||||||
Numerator: | |||||||||
Net income available to common stockholders | $ | 1,438 | $ | 9,669 | $ | 9,744 | |||
Denominator: | |||||||||
Weighted average basic shares — | |||||||||
Weighted average common shares outstanding | 15,415 | 15,371 | 15,295 | ||||||
Weighted average diluted shares — | |||||||||
Weighted average common shares outstanding | 15,415 | 15,371 | 15,295 | ||||||
Effect of diluted stock options | — | 11 | 50 | ||||||
Total weighted average diluted shares | 15,415 | 15,382 | 15,345 | ||||||
Net income per share: | |||||||||
Basic | $ | 0.09 | $ | 0.63 | $ | 0.64 | |||
Diluted | $ | 0.09 | $ | 0.63 | $ | 0.63 | |||
91
Table of Contents
AFFIRMATIVE INSURANCE HOLDINGS, INC. AND SUBSIDIARIES
NOTES TO CONSOLIDATED FINANCIAL STATEMENTS—(Continued)
18. Stock-Based Compensation
In May 2004, our board of directors adopted and our stockholders approved the 2004 Stock Incentive Plan (2004 Plan) to enable us to attract, retain and motivate eligible employees, directors and consultants through equity-based compensatory awards, including stock options, stock bonus awards, restricted and unrestricted stock awards, performance stock awards, stock appreciation rights and dividend equivalent rights. The maximum number of shares of common stock reserved for issuance under the 2004 Plan, as amended, is 3,000,000, subject to adjustment to reflect certain corporate transactions or changes in our capital structure. At December 31, 2008, 1,064,410 shares were reserved for future grants under the 2004 Plan.
Under the 2004 Plan, the board or committee may fix the term and vesting schedule of each stock option, but no incentive stock option will be exercisable more than ten years after the date of grant. Vested stock options generally remain exercisable for up to three months after a participant’s termination of service or up to 12 months after a participant’s death or disability. Typically, the exercise price of each incentive stock option must not be less than 100% of the fair market value of our common stock on the grant date, and the exercise price of a nonqualified stock option must not be less than 20% of the fair market value of our common stock on the grant date. In the event that an incentive stock option is granted to a 10% stockholder, the term of such stock option may not be more than five years and the exercise price may not be less than 110% of the fair market value on the grant date. The exercise price of each stock option granted under the 2004 Plan may be paid in cash or in other forms of consideration in certain circumstances, including shares of common stock, deferred payment arrangements or pursuant to cashless exercise programs. A stock option award may provide that if shares of our common stock are used to pay the exercise price, additional stock options will be granted to the participant to purchase that number of shares used to pay the exercise price. Generally, stock options are not transferable except by will or the laws of descent and distribution, unless the board or committee provides that a nonqualified stock option may be transferred.
We have a 1998 Omnibus Incentive Plan (1998 Plan) under which we may grant options to employees, directors and consultants for up to 803,169 shares of common stock. The exercise prices are determined by the board of directors, but shall not be less than 100% of the fair market value on the grant date or, in the case of any employee who is deemed to own more than 10% of the voting power of all classes of our stock, not less than 110% of the fair market value. The terms of the options are also determined by the board of directors, but shall never exceed ten years or, in the case of any employee who is deemed to own more than 10% of the voting power of all classes of our common stock, shall not exceed five years. We do not expect to grant any further equity awards under the 1998 Plan, but intend to make all future awards under the 2004 Plan. While all awards previously granted under the 1998 Plan will remain outstanding, 1998 Plan shares will not be available for re-grant if these outstanding awards are forfeited or cancelled.
Stock Options • We used the modified Black-Scholes model to estimate the value of employee stock options on the date of grant that used the assumptions noted below. The risk-free rate is based on the U.S. Treasury bill yield curve in effect at the time of grant for the expected term of the option. The expected term of options granted represents the period of time that the options are expected to be outstanding. Expected volatilities are based on historical volatilities of our common stock. The dividend yield was based on expected dividends at the time of grant.
There were no stock options issued in 2008.
| 2007 | 2006 | |||||
Weighted-average risk-free interest rate | 4.0 | % | 4.6 | % | ||
Expected term of option in years | 5.00 | 4.97 | ||||
Weighted-average volatility | 23 | % | 25 | % | ||
Dividend yield | 0.6 | % | 0.5 | % |
92
Table of Contents
AFFIRMATIVE INSURANCE HOLDINGS, INC. AND SUBSIDIARIES
NOTES TO CONSOLIDATED FINANCIAL STATEMENTS—(Continued)
A summary of the stock option activities for each of the three years ended December 31 was as follows (shares in thousands):
| 2008 | 2007 | 2006 | ||||||||||||||||
| Shares | Weighted Average Exercise Price | Shares | Weighted Average Exercise Price | Shares | Weighted Average Exercise Price | |||||||||||||
Outstanding at beginning of year | 1,795 | $ | 18.73 | 1,995 | $ | 18.68 | 1,548 | $ | 16.35 | |||||||||
Granted | — | — | 231 | 15.43 | 915 | 21.13 | ||||||||||||
Exercised | — | — | (54 | ) | 9.41 | (109 | ) | 12.05 | ||||||||||
Forfeited | (71 | ) | 17.82 | (377 | ) | 18.08 | (359 | ) | 16.96 | |||||||||
Outstanding at end of year | 1,724 | 18.77 | 1,795 | 18.73 | 1,995 | 18.68 | ||||||||||||
We recognized total compensation expense related to the stock options of $727,000, $863,000 and $549,000 during 2008, 2007 and 2006, respectively. Compensation expense is included in selling, general and administrative expenses in the consolidated statement of income. Total unrecognized compensation expense related to unvested stock options was $1.4 million at December 31, 2008, which will be recognized over a weighted-average period of approximately 2.7 years.
Stock options outstanding and exercisable at December 31, 2008 were as follows (shares in thousands):
Options Outstanding | Options Exercisable | |||||||||||
Range of Exercise Prices | Number Outstanding | Weighted Average Exercise Price | Weighted Average Years of Remaining Contractual Life | Number Exercisable | Weighted Average Exercise Price | |||||||
$ 7.59 to $15.00 | 497 | $ | 14.00 | 6.67 | 351 | $ | 14.32 | |||||
$15.01 to $22.00 | 787 | 17.55 | 7.57 | 191 | 17.38 | |||||||
$22.01 to $30.00 | 440 | 26.34 | 7.65 | 103 | 26.12 | |||||||
$ 7.59 to $30.00 | 1,724 | 18.77 | 7.33 | 645 | 17.11 | |||||||
The stock options outstanding and exercisable at December 31, 2008 had aggregate intrinsic values of zero as the aggregate exercise price was greater than the aggregate market value. No stock options were exercised during 2008. Stock options exercised during 2007 and 2006 had an aggregate intrinsic value of $110,000 and $456,000, respectively.
Restricted Stock Awards • A summary of activity for our restricted stock grants for each of the years ended December 31 was as follows (shares in thousands):
| 2008 | 2007 | 2006 | ||||||||||||||||
| Restricted Shares | Weighted Average Grant Date Fair Value | Restricted Shares | Weighted Average Grant Date Fair Value | Restricted Shares | Weighted Average Grant Date Fair Value | |||||||||||||
Outstanding at beginning of year | 99 | $ | 15.52 | 115 | $ | 15.44 | 8 | $ | 14.05 | |||||||||
Granted | — | — | 7 | 16.50 | 115 | 15.44 | ||||||||||||
Vested | (24 | ) | 15.39 | (23 | ) | 15.44 | (8 | ) | 14.05 | |||||||||
Forfeited | — | — | — | — | — | — | ||||||||||||
Outstanding at end of year | 75 | 15.52 | 99 | 15.52 | 115 | 15.44 | ||||||||||||
93
Table of Contents
AFFIRMATIVE INSURANCE HOLDINGS, INC. AND SUBSIDIARIES
NOTES TO CONSOLIDATED FINANCIAL STATEMENTS—(Continued)
The outstanding vested restricted stock awards had an aggregate intrinsic value of $213,000 at December 31, 2008.
We recognized total compensation expense related to the restricted stock awards of $377,000, $375,000 and $46,000 during 2008, 2007 and 2006, respectively. Compensation expense is included in selling, general and administrative expenses in the consolidated statement of income. As of December 31, 2008, there was approximately $908,000 of total unrecognized compensation cost related to unvested restricted stock awards which will be recognized over a weighted average period of approximately 2.8 years.
19. Employee Benefit Plan
We sponsor a defined contribution retirement plan under Section 401(k) of the Internal Revenue Code. The plan covers substantially all employees who meet specified service requirements. Under the plan, we may, at our discretion, match 100% of each employee’s contribution, up to 3% of the employee’s earnings, plus 50% of each employee’s contribution for the next 2% of the employee’s salary. Our total contributions to the 401(k) plan were $1.0 million in 2008, 2007 and 2006.
20. Related Party Transactions
As part of the terms of the acquisition of AIC and Insura, VIG has indemnified us for any losses due to uncollectible reinsurance related to reinsurance agreements entered into with unaffiliated reinsurers prior to December 31, 2003. As of December 31, 2008, all such unaffiliated reinsurers had A.M. Best ratings of “A-” or better with a reinsurance recoverable of $3.4 million.
We lease nine of our Insure One retail stores in Illinois from ATR Investments, LLC or entities controlled by ATR Investments. The former president of our retail division, Alan T. Rasof, is the sole owner and manager of ATR Investments. These nine leases have terms ranging from 2 months to 3 years and expiration dates ranging from 2009 to 2011 with total rent due of approximately $678,000. The leases provide for monthly rental ranging from $2,700 to $6,300. During 2007, we made total related party rental payments to ATR Investments of an insignificant amount due to Mr. Rasof’s resignation on March 6, 2007 from Affirmative Insurance, at which time Mr. Rasof was no longer a related party. During 2006, we made total rent payments to ATR Investments of approximately $137,000. In some instances, we also engaged Captain Management Services, Ltd. to remodel our retail store locations. Captain Management is wholly-owned by Mr. Rasof. For the years ended December 31, 2007 and 2006, we paid Captain Management an insignificant amount and approximately $352,000, respectively, relating to remodeling and build out services performed for 15 of our retail locations in Illinois and Indiana. We were a party to a consulting agreement with ATR Investments from June 1, 2006 through October 8, 2006 pursuant to which ATR Investments provided us with certain consulting services, including, without limitation, marketing, management and operational services relating to new and existing and competitor retail store locations and developing retail location site selection criteria. We did not pay ATR Investments and Captain Management Services any consulting fees in 2008 and an insignificant amount in 2007. In 2006, we paid ATR Investments and Captain Management Services an aggregate amount of $135,000 for consulting services.
In January 2007, 227 West Monroe Street, Inc., as landlord (Landlord) executed a Consent to Assignment among the Landlord, KR Callahan & Company, LLC (KRCC), an entity whose sole member and manager is Kevin R. Callahan, our Chairman and Chief Executive Officer, and Affirmative Property Holdings, Inc. (Affirmative Property), an indirect wholly-owned subsidiary of ours, and approved the assignment (the Assignment) of the leasehold interest held by KRCC to Affirmative Property with effect from December 2006. Pursuant to the Assignment, KRCC assigned to Affirmative Property all of its right, title and interest in and
94
Table of Contents
AFFIRMATIVE INSURANCE HOLDINGS, INC. AND SUBSIDIARIES
NOTES TO CONSOLIDATED FINANCIAL STATEMENTS—(Continued)
to the Lease (the Lease), dated May 8, 2006, between KRCC, as tenant, and the Landlord, and Affirmative Property agreed with KRCC to assume all obligations of KRCC, as tenant, under the Lease. The Lease relates to office space in Chicago, Illinois that will be used by our Claims Staff Counsel. The Lease continues until July 31, 2016 and provides for an average monthly rent of approximately $9,690. In addition, Affirmative Property will be responsible for the payment of taxes, common area maintenance charges and other customary occupancy costs.
In connection with the Lease, KRCC had procured a Letter of Credit in favor of the Landlord in the amount of $293,257 as a security deposit against KRCC’s obligations under the Lease. In connection with the Assignment, Affirmative Property agreed to replace KRCC’s Letter of Credit at a future date with a Letter of Credit of like amount issued in favor of the Landlord on Affirmative Property’s behalf. In May 2007, Affirmative Insurance Holdings, Inc. entered into an irrevocable Letter of Credit in favor of the Landlord in the amount of $293,257 as a replacement for the KRCC Letter of Credit.
21. Regulatory Restrictions
We are subject to comprehensive regulation and supervision by government agencies in Illinois, Louisiana, Michigan, and New York, the states in which our insurance company subsidiaries are domiciled, as well as in the states where our subsidiaries sell insurance products, issue policies, handle claims and finance premiums. Certain states impose restrictions or require prior regulatory approval of certain corporate actions, which may adversely affect our ability to operate, innovate, obtain necessary rate adjustments in a timely manner or grow our business profitably. These regulations provide safeguards for policy owners and are not intended to protect the interests of stockholders. Our ability to comply with these laws and regulations, and to obtain necessary regulatory action in a timely manner, is and will continue to be critical to our success.
Our insurance company subsidiaries are subject to risk-based capital standards and other minimum capital and surplus requirements imposed under applicable state laws, including the laws of their state of domicile. The risk-based capital standards, based upon the Risk-Based Capital Model Act adopted by the National Association of Insurance Commissioners, or NAIC, require our insurance company subsidiaries to report their results of risk-based capital calculations to state departments of insurance and the NAIC.
Any failure by one of our insurance company subsidiaries to meet the applicable risk-based capital or minimum statutory capital requirements imposed by the laws of Illinois, Louisiana, Michigan, and New York or other states where we do business could subject it to further examination or corrective action imposed by state regulators, including limitations on our writing of additional business, state supervision or liquidation. Any changes in existing risk-based capital requirements or minimum statutory capital requirements may require us to increase our statutory capital levels, which we may be unable to do. As of December 31, 2008, each of our insurance company subsidiaries maintained a risk-based capital level in excess of an amount that would require any corrective actions.
State insurance laws restrict the ability of our insurance company subsidiaries to declare stockholder dividends. These subsidiaries may not make an “extraordinary dividend” until 30 days after the applicable commissioner of insurance has received notice of the intended dividend and has not objected in such time or until the commissioner has approved the payment of the extraordinary dividend within the 30-day period. In most states, an extraordinary dividend is defined as any dividend or distribution of cash or other property whose fair market value, together with that of other dividends and distributions made within the preceding 12 months, exceeds the greater of 10.0% of the insurance company’s surplus as of the preceding year-end or the insurance company’s net income for the preceding year, in each case determined in accordance with statutory accounting
95
Table of Contents
AFFIRMATIVE INSURANCE HOLDINGS, INC. AND SUBSIDIARIES
NOTES TO CONSOLIDATED FINANCIAL STATEMENTS—(Continued)
practices. In addition, dividends may only be paid from unassigned earnings and an insurance company’s remaining surplus must be both reasonable in relation to its outstanding liabilities and adequate to its financial needs. As of December 31, 2008, our insurance companies could not pay ordinary dividends to us without prior regulatory approval due to a negative unassigned surplus position. However, as mentioned previously, our nonregulated entities provide adequate cash flow to fund their own operations. Dividend payments of $7.3 million were received from our insurance company subsidiaries in 2008. In February 2009, we obtained approval from the New York Department of Insurance for one of our insurance subsidiaries to retire one million shares of its stock for $2.9 million and approved payment of an extraordinary dividend for $100,000.
22. Business Concentrations
The majority of our commission income and fees are directly related to the premiums written through our insurance subsidiaries from policies sold to individuals located in certain states. Accordingly, we could be adversely affected by economic downturns, natural disasters, and other conditions that may occur from time-to-time in these states.
The following table identifies the states in which we operate and the gross premiums written by state (in thousands):
| Year Ended December 31, | |||||||||
| 2008 | 2007 | 2006 | |||||||
Louisiana | $ | 140,270 | $ | 144,576 | $ | — | |||
Texas | 66,006 | 69,397 | 79,084 | ||||||
Illinois | 52,604 | 66,650 | 66,826 | ||||||
California | 29,905 | 37,663 | 37,996 | ||||||
Alabama | 27,353 | 22,701 | — | ||||||
Florida | 20,619 | 29,744 | 21,150 | ||||||
Michigan | 16,292 | 22,940 | 19,689 | ||||||
Indiana | 9,848 | 13,126 | 18,027 | ||||||
Missouri | 9,514 | 15,842 | 12,184 | ||||||
South Carolina | 8,599 | 13,927 | 19,000 | ||||||
New Mexico | 3,565 | 4,802 | 9,590 | ||||||
Arizona | 258 | 826 | 1,594 | ||||||
Georgia | 226 | 372 | 551 | ||||||
Utah | — | 129 | 449 | ||||||
Other | — | 5 | 40 | ||||||
Total | $ | 385,059 | $ | 442,700 | $ | 286,180 | |||
23. Fair Value of Financial Instruments
Effective January 1, 2008, the Company adopted SFAS No. 157 which defines fair value, expands disclosure requirements, and specifies a hierarchy of valuation techniques. The disclosure of fair value estimates in the FAS 157 hierarchy is based on whether the significant inputs into the valuation are observable. In determining the level of hierarchy in which the estimate is disclosed, the highest priority is given to unadjusted quoted prices in active markets and the lowest priority to unobservable inputs that reflect the Company’s significant market assumptions. The Company measures certain assets and liabilities at fair value on a recurring basis, including investment securities classified as available-for-sale or trading, cash equivalents, other
96
Table of Contents
AFFIRMATIVE INSURANCE HOLDINGS, INC. AND SUBSIDIARIES
NOTES TO CONSOLIDATED FINANCIAL STATEMENTS—(Continued)
receivables and interest rate swaps. Following is a brief description of the type of valuation information (“inputs”) that qualifies a financial asset for each level:
Level 1 — Unadjusted quoted market prices for identical assets or liabilities in active markets which are accessible by the Company.
Level 2 — Observable prices in active markets for similar assets or liabilities. Prices for identical or similar assets or liabilities in markets that are not active. Directly observable market inputs for substantially the full term of the asset or liability, e.g., interest rates and yield curves at commonly quoted intervals, volatilities, prepayment speeds, default rates, and credit spreads. Market inputs that are not directly observable but are derived from or corroborated by observable market data.
Level 3 — Unobservable inputs based on the Company’s own judgment as to assumptions a market participant would use, including inputs derived from extrapolation and interpolation that are not corroborated by observable market data.
The Company evaluates the various types of financial assets and liabilities to determine the appropriate fair value hierarchy based upon trading activity and the observability of market inputs. The Company employs control processes to validate the reasonableness of the fair value estimates of its assets and liabilities, including those estimates based on prices and quotes obtained from independent third-party sources. The Company’s procedures generally include, but are not limited to, initial and on going evaluation of methodologies used by independent third-parties and monthly analytical reviews of the prices against current pricing trends and statistics.
Where possible, the Company utilizes quoted market prices to measure fair value. For assets and liabilities that have quoted market prices in active markets, the Company uses the quoted market prices as fair value and includes these prices in the amounts disclosed in Level 1 of the hierarchy. When quoted market prices in active markets are unavailable, the Company determines fair values based on independent external valuation information, which utilizes various models and valuation techniques based on a range of inputs including pricing models, quoted market price of publicly traded securities with similar duration and yield, time value, yield curve, prepayment speeds, default rates and discounted cash flow. In most cases, these estimates are determined based on independent third-party valuation information, and the amounts are disclosed as Level 2 or Level 3 of the fair value hierarchy depending on the level of observable market inputs.
97
Table of Contents
AFFIRMATIVE INSURANCE HOLDINGS, INC. AND SUBSIDIARIES
NOTES TO CONSOLIDATED FINANCIAL STATEMENTS—(Continued)
Financial assets and financial liabilities measured at fair value on a recurring basis
The following table provides information as of December 31, 2008 about the Company’s financial assets and liabilities measured at fair value on a recurring basis:
| December 31, 2008 | Quoted Prices in Active Markets (Level 1) | Significant Other Observable Inputs (Level 2) | Significant Unobservable Inputs (Level 3) | |||||||||
Assets: | ||||||||||||
U.S. Government and agencies securities | $ | 28,791 | $ | 28,791 | $ | — | $ | — | ||||
Mortgage-backed securities | 6,166 | — | 6,166 | — | ||||||||
Tax-exempt securities | 183,077 | — | 183,077 | — | ||||||||
Corporate and other securities | 954 | 954 | — | — | ||||||||
Auction-rate tax-exempt securities | 40,155 | — | 1,025 | 39,130 | ||||||||
Total investment securities | 259,143 | 29,745 | 190,268 | 39,130 | ||||||||
Cash and cash equivalents | 66,513 | 66,513 | — | — | ||||||||
Fiduciary and restricted cash | 20,109 | 20,109 | — | — | ||||||||
Other receivables | 9,647 | — | — | 9,647 | ||||||||
Total assets | $ | 355,412 | $ | 116,367 | $ | 190,268 | $ | 48,777 | ||||
Liabilities: | ||||||||||||
Interest rate swaps | $ | 5,935 | $ | — | $ | — | $ | 5,935 | ||||
Total liabilities | $ | 5,935 | $ | — | $ | — | $ | 5,935 | ||||
Level 1 Financial assets
Financial assets classified as Level 1 in the fair value hierarchy include U.S. Government bonds and certain government agencies securities, corporate bonds, and cash or cash equivalents. U.S. Government bonds and corporate bonds are traded on a daily basis and the Company estimates the fair value of these securities using unadjusted quoted market prices. Cash and cash equivalents primarily consist of highly liquid money market funds, which are reflected within Level 1 of the fair value hierarchy.
Level 2 Financial assets
Financial assets classified as Level 2 in the fair value hierarchy include mortgage-backed securities, tax-exempt securities, and certain auction-rate securities that have auctions on a regular basis that do not fail. The fair value of these securities is determined based on observable market inputs provided by independent third-party pricing services and the Company discloses the fair values of these investments in Level 2 of the fair value hierarchy. To date, the Company has not experienced a circumstance where it has determined that an adjustment is required to a quote or price received from independent third-party pricing sources. To the extent the Company determines that a price or quote is inconsistent with actual trading activity observed in that investment or similar investments, the Company would determine a fair value using this observable market information and disclose the occurrence of this circumstance. All of the fair values of securities disclosed in Level 2 are estimated based on independent third-party pricing services.
Level 3 Financial assets and liabilities
The Company’s Level 3 financial assets include certain illiquid auction-rate securities. Observable market inputs for certain auction-rate securities that have experienced failed auctions as a result of liquidity issues in the
98
Table of Contents
AFFIRMATIVE INSURANCE HOLDINGS, INC. AND SUBSIDIARIES
NOTES TO CONSOLIDATED FINANCIAL STATEMENTS—(Continued)
global credit and capital market are not readily available. The fair value of these securities is estimated using third-party valuation sources.
The Company’s Level 3 financial assets also include other receivables related to a purchase agreement entered into during November 2008 with our broker to liquidate certain of our auction-rate securities. Under the terms of the agreement, our broker will purchase our eligible auction-rate securities for full par value on or prior to June 30, 2012. As of December 31, 2008, we held $51.3 million (par value) of auction-rate securities that are eligible for such settlement. We have elected to record the settlement as a financial asset at fair value in accordance with SFAS No. 159. Fair value for the settlement was determined using third-party valuation sources and is recorded as other receivables in Level 3 of the fair value hierarchy.
The Company’s Level 3 financial liabilities are interest rate swaps. The fair value of these swaps are determined by quotes from brokers that are not considered binding.
Fair value measurements for assets in category Level 3 as of December 31, 2008 were as follows (in thousands):
| Fair Value Measurements Using Significant Unobservable Inputs (Level 3) Auction-Rate Tax- Exempt Securities | Fair Value Measurements Using Significant Unobservable Inputs (Level 3) Other Receivable | ||||||
Balance at January 1, 2008 | $ | — | $ | — | |||
Transfers in and/or out of Level 3 | 50,270 | — | |||||
Total gains or (losses) (realized/unrealized): | |||||||
Included in earnings | (11,140 | ) | 9,647 | ||||
Included in other comprehensive income | — | — | |||||
Purchases, issuances, and settlements | — | — | |||||
| �� | |||||||
Balance at December 31, 2008 | $ | 39,130 | $ | 9,647 | |||
Fair value measurements for liabilities in category Level 3 as of December 31, 2008 were as follows (in thousands):
| Fair Value Measurements Using Significant Unobservable Inputs (Level 3) Interest Rate Swaps | |||
Balance at January 1, 2008 | $ | 1,745 | |
Transfers into Level 3 | — | ||
Total losses (realized/unrealized): | |||
Included in earnings (or changes in net liabilities) | — | ||
Included in other comprehensive income | 4,190 | ||
Purchases, issuances, and settlements | — | ||
Balance at December 31, 2008 | $ | 5,935 | |
99
Table of Contents
AFFIRMATIVE INSURANCE HOLDINGS, INC. AND SUBSIDIARIES
NOTES TO CONSOLIDATED FINANCIAL STATEMENTS—(Continued)
Gains and losses (realized and unrealized) for Level 3 assets and liabilities included in earnings for the period ended December 31, 2008, are reported in net investment income and other comprehensive income as follows:
| Net Investment Income | Other Income | Other Comprehensive Income | |||||||||
Assets | |||||||||||
Total gains (losses) realized in earnings | $ | (11,140 | ) | $ | 9,647 | $ | — | ||||
Change in unrealized gains (losses) | — | — | — | ||||||||
Liabilities | |||||||||||
Total gains (losses) realized in earnings | — | — | — | ||||||||
Change in unrealized gains (losses) | — | — | (4,190 | ) | |||||||
Total for the period ended December 31, 2008 | (11,140 | ) | 9,647 | (4,190 | ) | ||||||
Fair values represent our best estimates and may not be substantiated by comparisons to independent markets and, in many cases, could not be realized in immediate settlement of the instruments. Certain financial instruments and all non-financial instruments are not required to be disclosed. Therefore, the aggregate fair value amounts presented do not purport to represent our underlying value. Certain nonfinancial assets and nonfinancial liabilities have not been disclosed at their fair values. The following financial liabilities are not required to be recorded at fair value but their fair value is being disclosed.
Notes payable — The fair value of the notes payable based on third-party valuation sources is estimated to be $26.3 million.
Senior secured credit facility — The fair value of the senior secured credit facility based on third-party valuation sources is estimated to be $94.9 million.
24. Statutory Financial Information and Accounting Policies
Our insurance subsidiaries are required to file statutory-basis financial statements with state insurance departments in all states where they are licensed. These statements are prepared in accordance with accounting practices prescribed or permitted by the applicable state of domicile. Each state of domicile requires that insurance companies domiciled in those states prepare their statutory-basis financial statements in accordance with the National Association of Insurance Commissioners Accounting Principles and Procedures Manual subject to any deviations prescribed or permitted by the insurance commissioner in each state of domicile.
Insura, AIC of Michigan and Casualty are wholly-owned subsidiaries of AIC and are included as common stock investments on AIC’s balance sheet in its statutory surplus. The following table summarizes selected statutory information of our insurance subsidiaries ended December 31 (in thousands):
| December 31, | |||||||||
| 2008 | 2007 | 2006 | |||||||
Statutory capital and surplus: | |||||||||
Affirmative Insurance Company (AIC) | $ | 150,973 | $ | 180,139 | $ | 133,409 | |||
Insura Property and Casualty Insurance Company (Insura) | 25,906 | 25,204 | 24,572 | ||||||
Affirmative Insurance Company of Michigan (AIC of Michigan) | 9,341 | 9,072 | 9,204 | ||||||
USAgencies Casualty Insurance Company, Inc (Casualty). | 48,916 | 45,622 | — | ||||||
USAgencies Direct Insurance Company (Direct) | 7,162 | 9,523 | — | ||||||
100
Table of Contents
AFFIRMATIVE INSURANCE HOLDINGS, INC. AND SUBSIDIARIES
NOTES TO CONSOLIDATED FINANCIAL STATEMENTS—(Continued)
| Year Ended December 31, | ||||||||||
| 2008 | 2007 | 2006 | ||||||||
Statutory net income (loss): | ||||||||||
Affirmative Insurance Company | $ | (2,167 | ) | $ | 11,200 | $ | 10,057 | |||
Insura Property and Casualty Insurance Company | 611 | 690 | 636 | |||||||
Affirmative Insurance Company of Michigan | 247 | 293 | 204 | |||||||
USAgencies Casualty Insurance Company, Inc. | 3,248 | 2,397 | — | |||||||
USAgencies Direct Insurance Company | (10 | ) | 1,138 | — | ||||||
25. Unaudited Quarterly Financial Data
The following is a summary of our unaudited quarterly consolidated results of operations for the years ended December 31, 2008 and 2007 (in thousands, except per share data):
| Quarter Ended | |||||||||||||
| March 31 | June 30 | September 30 | December 31 | ||||||||||
2008: | |||||||||||||
Net premiums earned | $ | 94,868 | $ | 93,523 | $ | 87,511 | $ | 81,399 | |||||
Total revenues | 120,934 | 117,104 | 109,502 | 101,383 | |||||||||
Losses and loss adjustment expenses | 71,361 | 70,217 | 70,576 | 62,237 | |||||||||
Net income (loss) | 4,628 | 2,341 | (6,617 | ) | 1,086 | ||||||||
Diluted net income (loss) per share | 0.30 | 0.15 | (0.43 | ) | 0.07 | ||||||||
Diluted weighted-average common shares | 15,415 | 15,415 | 15,415 | 15,415 | |||||||||
2007: | |||||||||||||
Net premiums earned | $ | 82,770 | $ | 113,257 | $ | 103,850 | $ | 96,166 | |||||
Total revenues | 109,567 | 139,958 | 129,577 | 120,932 | |||||||||
Losses and loss adjustment expenses | 61,232 | 82,799 | 75,333 | 70,360 | |||||||||
Net income | 2,246 | 1,118 | 4,842 | 1,463 | |||||||||
Diluted net income per share | 0.15 | 0.07 | 0.31 | 0.10 | |||||||||
Diluted weighted-average common shares | 15,467 | 15,436 | 15,392 | 15,382 | |||||||||
26. Franchises
At December 31, 2008, we served as the franchisor for thirty-three operating franchise stores located in Florida under the Fed USA brand name. Our franchising operations generate minimal revenues and therefore do not have a significant impact on our consolidated operating results. We are engaged in our franchise business primarily for the purpose of creating additional sales locations for the generation of insurance and ancillary product revenues, as opposed to seeking revenues from franchise or royalty fees. We include initial franchise fees and royalty payments that we collect and receive from our franchisees as part of our reported revenues relating to commission income and fees in our financial statements.
101
Table of Contents
AFFIRMATIVE INSURANCE HOLDINGS, INC. AND SUBSIDIARIES
NOTES TO CONSOLIDATED FINANCIAL STATEMENTS—(Continued)
27. Parent Company Financials
The condensed financial information of the parent company, Affirmative Insurance Holdings, Inc. as of December 31, 2008 and 2007, and for each of the three years ended December 31, 2008, 2007 and 2006 is presented as follows (in thousands, except share data):
Condensed Balance Sheets
| 2008 | 2007 | |||||||
Assets | ||||||||
Cash and cash equivalents | $ | 2,927 | $ | 1,269 | ||||
Restricted cash | 307 | 293 | ||||||
Available-for-sale investment securities | — | 11,400 | ||||||
Investment in subsidiaries | 469,577 | 467,739 | ||||||
Deferred tax asset | 13,482 | 10,180 | ||||||
Federal income taxes receivable | 1,874 | 3,785 | ||||||
Property and equipment, net | — | 4 | ||||||
Goodwill | 9,755 | 9,755 | ||||||
Other tangible assets, net | 273 | 273 | ||||||
Affiliate loan receivable | 5,030 | — | ||||||
Other assets | 7,660 | 9,060 | ||||||
Total assets | $ | 510,885 | $ | 513,758 | ||||
Liabilities and Stockholders’ Equity | ||||||||
Liabilities | ||||||||
Payable to subsidiaries | $ | 93,091 | $ | 38,176 | ||||
Notes payable | 56,702 | 56,702 | ||||||
Senior secured credit facility | 136,677 | 196,966 | ||||||
Interest rate swaps | 5,935 | 1,745 | ||||||
Other liabilities | 1,997 | 3,124 | ||||||
Total liabilities | 294,402 | 296,713 | ||||||
Stockholders’ Equity | ||||||||
Common stock, $0.01 par value; 75,000,000 shares authorized; 17,768,721 shares issued and 15,415,358 outstanding at December 31, 2008; 17,768,721 shares issued and 15,415,358 outstanding at December 31, 2007 | 178 | 178 | ||||||
Additional paid-in capital | 163,707 | 162,603 | ||||||
Treasury stock, at cost; 2,353,363 shares at December 31, 2008 and 2007 | (32,880 | ) | (32,880 | ) | ||||
Accumulated other comprehensive income (loss) | (1,849 | ) | 22 | |||||
Retained earnings | 87,327 | 87,122 | ||||||
Total stockholders’ equity | 216,483 | 217,045 | ||||||
Total liabilities and stockholders’ equity | $ | 510,885 | $ | 513,758 | ||||
102
Table of Contents
AFFIRMATIVE INSURANCE HOLDINGS, INC. AND SUBSIDIARIES
NOTES TO CONSOLIDATED FINANCIAL STATEMENTS—(Continued)
Condensed Statements of Income
| Year Ended December 31, | |||||||||||
| 2008 | 2007 | 2006 | |||||||||
Revenues | |||||||||||
Dividends from subsidiaries | $ | 7,323 | $ | 13,100 | $ | 11,500 | |||||
Net investment income | 233 | 69 | 163 | ||||||||
Other income | 53 | — | — | ||||||||
Total revenues | 7,609 | 13,169 | 11,663 | ||||||||
Expenses | |||||||||||
Operating expenses | 1,325 | 1,238 | — | ||||||||
Interest expense | 16,967 | 23,267 | 4,342 | ||||||||
Total expenses | 18,292 | 24,505 | 4,342 | ||||||||
Income (loss) before income taxes and equity interest in subsidiaries | (10,683 | ) | (11,336 | ) | 7,321 | ||||||
Income tax benefit | 2,563 | 4,585 | 891 | ||||||||
Equity interest in undistributed earnings of subsidiaries | 9,558 | 16,420 | 1,532 | ||||||||
Net income | $ | 1,438 | $ | 9,669 | $ | 9,744 | |||||
Condensed Statements of Cash Flows
| Year Ended December 31, | ||||||||||||
| 2008 | 2007 | 2006 | ||||||||||
Net cash provided by (used in) operating activities | $ | 44,457 | $ | (7,478 | ) | $ | (2,547 | ) | ||||
Cash flows from investing activities | ||||||||||||
Dividends received from subsidiaries | 7,323 | 13,100 | 11,500 | |||||||||
Proceeds from other invested assets | 11,400 | — | — | |||||||||
Purchases of other invested assets | — | (11,400 | ) | — | ||||||||
Purchases of property and equipment | — | — | (14 | ) | ||||||||
Cash paid for acquisitions | — | (199,499 | ) | (170 | ) | |||||||
Net cash provided by (used in) investing activities | 18,723 | (197,799 | ) | 11,316 | ||||||||
Cash flows from financing activities | ||||||||||||
Proceeds from issuance of notes payable | — | — | — | |||||||||
Borrowings under senior secured credit facility | 6,000 | 200,000 | — | |||||||||
Principal payments on senior secured credit facility | (66,289 | ) | (3,034 | ) | — | |||||||
Debt acquisition costs paid | — | (6,643 | ) | — | ||||||||
Proceeds from exercise of stock options | — | 504 | 1,318 | |||||||||
Purchases of treasury shares | — | — | (4,134 | ) | ||||||||
Dividends paid | (1,233 | ) | (1,229 | ) | (1,220 | ) | ||||||
Net cash provided by (used in) financing activities | (61,522 | ) | 189,598 | (4,036 | ) | |||||||
Net increase (decrease) in cash and cash equivalents | 1,658 | (15,679 | ) | 4,733 | ||||||||
Cash and cash equivalents at beginning of year | 1,269 | 16,948 | 12,215 | |||||||||
Cash and cash equivalents at end of year | $ | 2,927 | $ | 1,269 | $ | 16,948 | ||||||
103
Table of Contents
| Item 9. | Changes in and Disagreements with Accountants on Accounting and Financial Disclosure |
None.
| Item 9A. | Controls and Procedures |
Evaluation of Disclosure Controls and Procedures
We maintain disclosure controls and procedures that are designed to ensure that information required to be disclosed by us in the reports that we file or submit under the Securities Exchange Act of 1934 (Exchange Act) is recorded, processed, summarized and reported within the time periods specified in the United States Securities and Exchange Commission rules and forms, and that such information is accumulated and communicated to our management, including our principal executive officer and principal financial officer, as appropriate, to allow timely decisions regarding required disclosure.
As of the end of the period covered by this report, we carried out an evaluation, under the supervision and with the participation of our Disclosure Committee and management, including the principal executive officer and the principal financial officer, of the effectiveness of the design and operation of our disclosure controls and procedures pursuant to Exchange Act Rules 13a-15(b) and 15d-15(b). Based upon this evaluation, the principal executive officer and the principal financial officer concluded that our disclosure controls and procedures were effective as of December 31, 2008, the end of the period covered by this Annual Report on Form 10-K.
Management’s Report on Internal Control over Financial Reporting
Our management is responsible for establishing and maintaining adequate internal control over financial reporting as defined in Exchange Act Rules 13a-15(f) and 15d-15(f). Our internal control over financial reporting is a process designed to provide reasonable assurance regarding the reliability of financial reporting and the preparation of financial statements for external purposes in accordance with generally accepted accounting principles.
Management assessed the effectiveness of our internal control over financial reporting as of December 31, 2008. In making this assessment, management used the criteria described in “Internal Control — Integrated Framework” issued by the Committee of Sponsoring Organizations of the Treadway Commission. Because of its inherent limitations, internal control over financial reporting may not prevent or detect misstatements. Also, projections of any evaluation of effectiveness to future periods are subject to the risk that controls may become inadequate because of changes in conditions, or that the degree of compliance with policies and procedures may deteriorate. Based on this evaluation, management determined that, as of December 31, 2008, we maintained effective internal control over financial reporting.
Changes in Internal Control over Financial Reporting
There were no changes in our internal control over financial reporting that occurred during the quarter ended December 31, 2008 that have materially affected, or are reasonably likely to materially affect, our internal control over financial reporting.
| Item 9B. | Other Information |
None.
104
Table of Contents
PART III
| Item 10. | Directors, Executive Officers and Corporate Governance |
The information relating to this Item 10 is incorporated by reference to the disclosure in the sections headed “Item 1 — Election of Directors,” “Executive Officers,” “Section 16(a) Beneficial Ownership Reporting Compliance” and “Corporate Governance” in the Proxy Statement for our 2009 Annual Meeting of Stockholders, which will be filed with the Securities and Exchange Commission no later than 120 days after December 31, 2008.
| Item 11. | Executive Compensation |
The information relating to this Item 11 is incorporated by reference to the disclosure in the sections headed “Compensation Discussion and Analysis,” “Compensation Committee Report” and “ Executive Compensation” in the Proxy Statement for our 2009 Annual Meeting of Stockholders, which will be filed with the Securities and Exchange Commission no later than 120 days after December 31, 2008.
| Item 12. | Security Ownership of Certain Beneficial Owners and Management and Related Stockholder Matters |
The information relating to this Item 12 is incorporated by reference to the disclosure in the sections headed “Equity Compensation Plan Information” and “Security Ownership of Certain Beneficial Owners and Management” in the Proxy Statement for our 2009 Annual Meeting of Stockholders, which will be filed with the Securities and Exchange Commission no later than 120 days after December 31, 2008.
Securities Authorized for Issuance Under Equity Compensation Plans
The following table sets forth information as of December 31, 2008 about all of our equity compensation plans. All plans have been approved by our stockholders.
| Number of Securities to be Issued Upon Exercise of Outstanding Options, Warrants and Rights (a) | Weighted-Average Exercise Price of Outstanding Options, Warrants and Rights (b) | Number of Securities Remaining Available for Future Issuance Under Equity Compensation Plan (Excluding Securities Reflected in Column (a)) (c) | |||||
1998 Omnibus Incentive Plan | 18,951 | $ | 7.59 | — | |||
2004 Stock Incentive Plan | 1,705,580 | 18.90 | 1,064,410 | ||||
Total | 1,724,531 | $ | 18.77 | 1,064,410 | |||
There were no repurchases of our common stock during the fourth quarter of 2008.
| Item 13. | Certain Relationships and Related Transactions, and Director Independence |
The information relating to this Item 13 is incorporated by reference to the disclosure in the section headed “Certain Relationships and Related Transactions” in the Proxy Statement for our 2009 Annual Meeting of Stockholders, which will be filed with the Securities and Exchange Commission no later than 120 days after December 31, 2008.
| Item 14. | Principal Accounting Fees and Services |
The information relating to this Item 14 is incorporated by reference to the disclosure in the section headed “Corporate Governance — Audit Committee — Fees Paid to Independent Auditor” and “Corporate Governance — Audit Committee — Approval of Audit and Non-Audit Services” in the Proxy Statement for our 2009 Annual Meeting of Stockholders, which will be filed with the Securities and Exchange Commission no later than 120 days after December 31, 2008.
105
Table of Contents
PART IV
| Item 15. | Exhibits and Financial Statement Schedules |
| (a) | Financial Statements: See “Index to Consolidated Financial Statements” in Part II, Item 8 of this Form 10-K. |
| (b) | Exhibits: The exhibits listed in the accompanying index to exhibits are filed or incorporated by reference as part of this Form 10-K. |
106
Table of Contents
Pursuant to the requirements of Sections 13 or 15(d) of the Securities Exchange Act of 1934, the registrant has duly caused this report to be signed on its behalf by the undersigned, thereunto duly authorized.
| AFFIRMATIVE INSURANCE HOLDINGS, INC. | ||
| By: | /s/ KEVIN R. CALLAHAN | |
| Kevin R. Callahan | ||
| Chairman and Chief Executive Officer | ||
Date: March 31, 2009
Pursuant to the requirements of the Securities Exchange Act of 1934, this report has been signed below by the following persons on behalf of the registrant and in the capacities indicated below.
Signature | Title | Date | ||
/s/ KEVIN R. CALLAHAN Kevin R. Callahan | Chairman of Board of Directors and Chief Executive Officer | March 31, 2009 | ||
/s/ MICHAEL J. MCCLURE Michael J. McClure | Executive Vice President and Chief Financial Officer | March 31, 2009 | ||
/s/ EARL R. FONVILLE Earl R. Fonville | Senior Vice President and Chief Accounting Officer | March 31, 2009 | ||
/s/ THOMAS C. DAVIS Thomas C. Davis | Director | March 31, 2009 | ||
/s/ NIMROD T. FRAZER Nimrod T. Frazer | Director | March 31, 2009 | ||
/s/ AVSHALOM Y. KALICHSTEIN Avshalom Y. Kalichstein | Director | March 31, 2009 | ||
/s/ SUZANNE T. PORTER Suzanne T. Porter | Director | March 31, 2009 | ||
/s/ DAVID I. SCHAMIS David I. Schamis | Director | March 31, 2009 | ||
/s/ J. CHRISTOPHER TEETS J. Christopher Teets | Director | March 31, 2009 | ||
/s/ PAUL J. ZUCCONI Paul J. Zucconi | Director | March 31, 2009 | ||
107
Table of Contents
EXHIBIT INDEX
The following documents are filed as a part of this report. Those exhibits previously filed and incorporated herein by reference are identified by reference to prior filings. Exhibits not required for this report have been omitted.
Exhibit | Description | |
| 2.1 | Purchase and Sale Agreement, dated October 3, 2006 and effective as of October 12, 2006, by and among the equityholders of USAgencies, L.L.C. and Affirmative Insurance Holdings, Inc. (incorporated by reference to Exhibit 2.1 to our Current Report on Form 8-K filed with the SEC on October 18, 2006, File No. 000-50795). | |
| 3.1 | Amended and Restated Certificate of Incorporation of Affirmative Insurance Holdings, Inc. (incorporated by reference to Exhibit 3.1 to our Registration Statement on Form S-1 filed with SEC on March 22, 2004, File No. 333-113793). | |
| 3.2 | Amended and Restated Bylaws of Affirmative Insurance Holdings, Inc. (incorporated by reference to Exhibit 3.2 to our Current Report on Form 8-K filed with the SEC on November 24, 2008, File No. 000-50795). | |
| 4.1 | Form of Common Stock Certificate (incorporated by reference to Exhibit 4.1 to our Annual Report on Form 10-K filed with the SEC on March 17, 2008, File No. 000-50795). | |
| 4.2 | Form of Registration Rights Agreement between Affirmative Insurance Holdings, Inc. and Vesta Insurance Group, Inc. (incorporated by reference to Exhibit 4.2 to Amendment No. 2 to our Registration Statement on Form S-1 filed with the SEC on May 27, 2004, File No. 333-113793). | |
| 10.1+ | Affirmative Insurance Holdings, Inc. 1998 Omnibus Incentive Plan, as amended (incorporated by reference to Exhibit 10.1 to our Registration Statement on Form S-1 filed with the SEC on March 22, 2004, File No. 333-113793). | |
| 10.2+ | Affirmative Insurance Holdings, Inc. 2004 Stock Incentive Plan (incorporated by reference to Exhibit 10.2 to Amendment No. 2 to our Registration Statement on Form S-1 filed with the SEC on May 27, 2004, File No. 333-113793). | |
| 10.3+ | Affirmative Insurance Holdings, Inc. Amended and Restated 2004 Stock Incentive Plan (incorporated by reference to our Information Statement on Form DEF 14-C filed with the SEC on December 30, 2005, File No. 000-50795). | |
| 10.4+ | First Amendment to the Amended and Restated Affirmative Insurance Holdings, Inc. 2004 Stock Incentive Plan (incorporated by reference to Annex A to our Definitive Proxy Statement on Form DEF 14A filed with the SEC on April 28, 2006, File No. 000-50795). | |
| 10.5+ | Form of Stock Option Agreement (incorporated by reference to Exhibit 10.1 to our Current Report on Form 8-K filed with the SEC on March 1, 2005, File No. 000-50795). | |
| 10.6+ | Form of Restricted Stock Agreement (incorporated by reference to Exhibit 10.2 to our Current Report on Form 8-K filed with the SEC on March 1, 2005, File No. 000-50795). | |
| 10.7+ | Affirmative Insurance Holdings, Inc. Performance-Based Annual Incentive Plan, effective January 1, 2007 (incorporated by reference to Appendix A to our Definitive Proxy Statement on Form DEF 14A filed with the SEC on April 5, 2007, File No. 000-50795). | |
| 10.8+ | Employment Agreement, dated as of November 23, 2005, between Affirmative Insurance Holdings, Inc. and M. Sean McPadden (incorporated by reference to Exhibit 10.1 to our Current Report on Form 8-K filed with the SEC on November 30, 2005, File No. 000-50795). | |
| 10.9+ | Employment Agreement, dated March 14, 2008, between Affirmative Services, Inc. and Michael J. McClure (incorporated by reference to Exhibit 10.9 to our Annual Report on Form 10-K filed with the SEC on March 17, 2008, File No. 000-50795). | |
108
Table of Contents
Exhibit | Description | |
| 10.10+ | Description of Non-Employee Director Compensation (incorporated by reference to Exhibit 10.3 to our Quarterly Report on Form 10-Q filed with the SEC on May 16, 2005, File No. 000-50795). | |
| 10.11 | Quota Share Reinsurance Agreement between Old American County Mutual Fire Insurance Company and Affirmative Insurance Company dated as of January 1, 2005, for the business written through A-Affordable Management General Agency, Inc. (incorporated by reference to Exhibit 10.4 to our Quarterly Report on Form 10-Q filed with the SEC on May 16, 2005, File No. 000-50795). | |
| 10.12 | Quota Share Reinsurance Agreement between Old American County Mutual Fire Insurance Company and Affirmative Insurance Company dated as of January 1, 2005, for the business written through American Agencies General Agency, Inc. (incorporated by reference to Exhibit 10.5 to our Quarterly Report on Form 10-Q filed with the SEC on May 16, 2005, File No. 000-50795). | |
| 10.13 | Amended and Restated 100% Quota Share Reinsurance Contract between the Shelby Insurance Company, Affirmative Insurance Company, Insura Property and Casualty Insurance Company and VFIC Insurance Corporation, with Addendum No. 1 thereto, effective December 31, 2003 (incorporated by reference to Exhibit 10.7 to our Registration Statement on Form S-1 filed with the SEC on March 22, 2004, File No. 333-113793). | |
| 10.14 | Addendum No. 2 to the Amended and Restated 100% Quota Share Reinsurance Contract between Affirmative Insurance Company, Insura Property & Casualty Insurance Company and VFIC Insurance Corporation dated May 10, 2004 (incorporated by reference to Exhibit 10.17 to Amendment No. 2 to our Registration Statement on Form S-1 filed with the SEC on May 27, 2004, File No. 333-113793). | |
| 10.15 | 100% Quota Share Reinsurance Contract between VFIC Insurance Corporation, Vesta Insurance Corporation, Insura Property & Casualty Insurance Company, Shelby Casualty Insurance Company, The Hawaiian Insurance & Guaranty Company, Ltd. And Affirmative Insurance Company, effective December 31, 2003 (incorporated by reference to Exhibit 10.8 to our Registration Statement on Form S-1 filed with the SEC on March 22, 2004, File No. 333-113793). | |
| 10.16 | Form of Separation Agreement between Affirmative Insurance Holdings, Inc. and Vesta Insurance Group, Inc. (incorporated by reference to Exhibit 10.16 to Amendment No. 2 to our Registration Statement on Form S-1 filed with the SEC on May 27, 2004, File No. 333-113793). | |
| 10.17 | Private Passenger Automobile Quota Share Reinsurance Contract between Affirmative Insurance Company, USAgencies Casualty Insurance Company, and USAgencies Direct Insurance Company, and the Interests and Liabilities Agreement of Motors Insurance Corporation by GMAC Re Corporation with respect to the same, effective April 1, 2007 (incorporated by reference to Exhibit 10.18 to our Annual Report on Form 10-K filed with the SEC on March 17, 2008, File No. 000-50795). | |
| 10.18 | Addendum No. 1 (effective April 1, 2007), to the Interests and Liabilities Agreement of Motors Insurance Corporation by GMAC Re Corporation with respect to the Private Passenger Automobile Quota Share Reinsurance Contract of April 1, 2007, as issued to Affirmative Insurance Company, USAgencies Casualty Insurance Company and USAgencies Direct Insurance Company (incorporated by reference to Exhibit 10.19 to our Annual Report on Form 10-K filed with the SEC on March 17, 2008, File No. 000-50795). | |
| 10.19+ | Form of Change of Control Agreement (incorporated by reference to Exhibit 10.1 to our Current Report on Form 8-K filed with the SEC on July 22, 2005, File No. 000-50795). | |
| 10.20 | First Amendment to Credit Agreement and waiver of Defaults between Affirmative Insurance Holdings, Inc. and The Frost National Bank dated August 12, 2005 (incorporated by reference to Exhibit 10.3 to our Quarterly Report on Form 10-Q filed with the SEC on August 15, 2005, File No. 000-50795). | |
109
Table of Contents
Exhibit | Description | |
| 10.21 | Second Amendment to Credit Agreement and waiver of Defaults between Affirmative Insurance Holdings, Inc. and The Frost National Bank dated September 30, 2005 (incorporated by reference to Exhibit 10.4 to our Quarterly Report on Form 10-Q filed with the SEC on November 14, 2005, File No. 000-50795). | |
| 10.22 | Master Services Agreement, dated as of October 16, 2006, between Affirmative Insurance Holdings, Inc. and Accenture LLP (incorporated by reference to Exhibit 10.27 to our Current Report on Form 8-K filed with the SEC on October 20, 2006, File No. 000-50795). | |
| 10.23 | Third Amendment to Credit Agreement between Affirmative Insurance Holdings, Inc. and The Frost National Bank, dated March 28, 2006 (incorporated by reference to Exhibit 10.1 to our Current Report on Form 8-K filed with the SEC on March 31, 2006, File No. 000-50795). | |
| 10.24 | Third Amendment to Credit Agreement between Affirmative Insurance Holdings, Inc. and The Frost National Bank dated as of August 7, 2006 (incorporated by reference to Exhibit 10.1 to our Quarterly Report on Form 10-Q filed with the SEC on August 9, 2006, File No. 000-50795). | |
| 10.25+* | First Amended and Restated Executive Employment Agreement, dated as of March 30, 2009, between Affirmative Insurance Holdings, Inc. and Kevin R. Callahan. | |
| 10.26+* | First Amended and Restated Executive Employment Agreement, effective as of March 30, 2009, between Affirmative Insurance Holdings, Inc. and Robert A. Bondi. | |
| 10.27 | $220,000,000 Credit Agreement dated as of January 31, 2007, among Affirmative Insurance Holdings, Inc. as Borrower, the Lenders party thereto, Credit Suisse, Cayman Islands Branch as Administrative Agent and Collateral Agent and Credit Suisse Securities (USA) LLC, as Sole Bookrunner and Sole Lead Arranger (incorporated by reference to Exhibit 10.32 to our Annual Report on Form 10-K filed with the SEC on March 16, 2007, File No. 000-50795). | |
| 10.28 | First Amendment to Credit Agreement and Guarantee and Collateral Agreement, dated as of March 8, 2007, among Affirmative Insurance Holdings, Inc. as Borrower, the lenders party thereto, Credit Suisse, Cayman Islands Branch, as Administrative Agent, Collateral Agent, Outgoing Issuing Bank and Outgoing Swingline Lender and The Frost National Bank as Incoming Issuing Bank and Incoming Swingline Lender (incorporated by reference to Exhibit 10.32 to our Annual Report on Form 10-K filed with the SEC on March 16, 2007, File No. 000-50795). | |
| 10.29 | Second Amendment to Credit Agreement and Guarantee and Collateral Agreement, dated as of February 4, 2008, among Affirmative Insurance Holdings, Inc. as Borrower, the lenders party thereto, Credit Suisse, Cayman Islands Branch, as Administrative Agent, Collateral Agent, Outgoing Issuing Bank and Outgoing Swingline Lender and The Frost National Bank as Incoming Issuing Bank and Incoming Swingline Lender (incorporated by reference to Exhibit 10.30 to our Annual Report on Form 10-K filed with the SEC on March 17, 2008, File No. 000-50795). | |
| 10.30 | Consent to Assignment, dated January 10, 2007, among Affirmative Property Holdings, Inc., KR Callahan & Company, LLC and 227 West Monroe Street, Inc. with respect to the Assignment of Lease, effective as of January 10, 2007, between Affirmative Property Holdings, Inc. and KR Callahan & Company, LLC (incorporated by reference to Exhibit 10.34 to our Annual Report on Form 10-K filed with the SEC on March 16, 2007, File No. 000-50795). | |
| 10.31 | Lease, dated as of May 8, 2006, between KR Callahan & Company, LLC, as tenant, and 227 West Monroe Street, Inc., as landlord (incorporated by reference to Exhibit 10.35 to our Annual Report on Form 10-K filed with the SEC on March 16, 2007, File No. 000-50795). | |
| 10.32* | Auction Rate Securities Option Rights Agreements between UBS Financial Services, Inc. and Comerica Bank & Trust, N.A. (the custodian for auction-rate securities accounts beneficially owned by three of our insurance company subsidiaries: Affirmative Insurance Company of Michigan, Insura Property and Casualty Insurance Company and Affirmative Insurance Company), dated October 8, 2008, November 4, 2008 and November 4, 2008, respectively. | |
110
Table of Contents
Exhibit | Description | |
| 10.33* | Auction Rate Securities Option Rights Agreement between UBS Financial Services, Inc. and our subsidiary, USAgencies Casualty Insurance Company, Inc. dated October 8, 2008. | |
| 10.34* | Auction Rate Securities Option Rights Agreement between UBS Financial Services, Inc. and Comerica Bank & Trust, N.A. (as trustee of an auction-rate securities account maintained pursuant to that certain Quota Share Reinsurance Agreement between our subsidiary, Affirmative Insurance Company (as grantor) and Old American County Mutual Fire Insurance Company), dated November 24, 2008. | |
| 10.35+* | Amended and Restated Executive Employment Agreement, dated as of March 30, 2009, between Affirmative Insurance Holdings, Inc. and Joseph G. Fisher. | |
| 10.36* | Third Amendment to Credit Agreement and Guarantee and Collateral Agreement, dated as of March 27, 2009, among Affirmative Insurance Holdings, Inc., as Borrower, the lenders party thereto, Credit Suisse, Cayman Islands Branch, as Administrative Agent, Collateral Agent, Outgoing Issuing Bank and Outgoing Swingline Lender and The Frost National Bank as Incoming Issuing Bank and Incoming Swingline Lender. | |
| 10.37* | Letter Agreement dated March 27, 2009, by and between Credit Suisse, Cayman Islands Branch, The Frost National Bank, JP Morgan Chase Bank, N.A. and Affirmative Insurance Holdings, Inc. | |
| 21.1* | Subsidiaries of Affirmative Insurance Holdings, Inc. as of March 27, 2009. | |
| 23.1* | Consent of KPMG LLP. | |
| 31.1* | Certification of Kevin R. Callahan, Chief Executive Officer, pursuant to Section 302 of the Sarbanes-Oxley Act of 2002. | |
| 31.2* | Certification of Michael J. McClure, Chief Financial Officer, pursuant to Section 302 of the Sarbanes-Oxley Act of 2002. | |
| 32.1* | Certification of Kevin R. Callahan, Chief Executive Officer, pursuant to Section 906 of the Sarbanes-Oxley Act of 2002. | |
| 32.2* | Certification of Michael J. McClure, Chief Financial Officer, pursuant to Section 906 of the Sarbanes-Oxley Act of 2002. | |
| * | Filed herewith |
| + | Management contract, compensatory plan or arrangement |
111