SECURITIES AND EXCHANGE COMMISSION
Washington, D.C. 20549
FORM 10-K
(Mark one)
x ANNUAL REPORT PURSUANT TO SECTION 13 OR 15(d) OF THE SECURITIES EXCHANGE ACT OF 1934
For the Fiscal Year Ended December 31, 2005
Or
o TRANSITION REPORT PURSUANT TO SECTION 13 OR 15(d) OF THE SECURITIES EXCHANGE ACT OF 1934
For the transition period from to
Commission file number 1-32340
AAMES INVESTMENT CORPORATION
(Exact name of Registrant as specified in its charter)
Maryland |
| 34-1981408 |
(State or other jurisdiction of incorporation) |
| (I.R.S. Employer Identification No.) |
350 S. Grand Avenue, Los Angeles, California |
| 90071 |
(Address of principal executive offices) |
| (Zip Code) |
Registrant’s telephone number, including area code: (323) 210-5000
Securities registered pursuant to Section 12(b) of the Act:
Title of each Class |
| Name of each exchange on which registered |
Common stock, par value $.01 per share |
| New York Stock Exchange |
Securities registered pursuant to Section 12(g) of the Act:
None
Indicate by check mark if the Registrant is a well-known seasoned issuer, as defined in Rule 405 of the Securities Act. Yes o No x
Indicate by check mark if the Registrant is not required to file reports pursuant to Section 13 or Section 15(d) of the Act. Yes o No x
Indicate by check mark whether the Registrant (1) has filed all reports required to be filed by Section 13 or 15(d) of the Securities Exchange Act of 1934 during the preceding 12 months (or for such shorter period that the Registrant was required to file such reports), and (2) has been subject to such filing requirements for the past 90 days. Yes x No o
Indicate by check mark if disclosure of delinquent filers pursuant to Item 405 of Regulation S-K is not contained herein, and will not be contained, to the best of the Registrant’s knowledge, in definitive proxy or information statements incorporated by reference in Part III of this Form 10-K or any amendment to this Form 10-K. o
Indicate by check mark whether the registrant is a large accelerated filer, an accelerated filer or a non-accelerated filer (as defined in Rule 12b-2 of the Act).
Large accelerated filer o |
| Accelerated filer x |
| Non-accelerated filer o |
Indicate by check mark whether the registrant is a shell company (as defined in Rule 12b-2 of the Act). Yes o No x
Based on the closing price for shares of common stock as of June 30, 2005, the last business day of the registrant’s most recently completed second fiscal quarter, the aggregate market value of common stock held by non-affiliates was $459,164,762.
At March 24, 2006 there were 61,877,547 shares of the common stock of Registrant outstanding.
Documents Incorporated by Reference
None
AAMES INVESTMENT CORPORATION
DECEMBER 31, 2005 FORM 10-K
TABLE OF CONTENTS
Item No. |
|
|
| Page No. |
| ||
|
|
|
|
|
|
| |
|
|
| 1 |
|
| ||
|
|
|
| 1 |
|
| |
|
|
|
| 1 |
|
| |
|
|
|
| 2 |
|
| |
|
|
|
| 3 |
|
| |
|
|
|
| 3 |
|
| |
|
|
|
| 5 |
|
| |
|
|
|
| 6 |
|
| |
|
|
|
| 14 |
|
| |
|
|
|
| 18 |
|
| |
|
|
|
| 21 |
|
| |
|
|
|
| 23 |
|
| |
|
|
|
| 30 |
|
| |
|
|
|
| 30 |
|
| |
|
|
|
| 31 |
|
| |
|
|
|
| 31 |
|
| |
|
|
|
| 34 |
|
| |
|
|
| 34 |
|
| ||
|
|
| 34 |
|
| ||
|
|
| 34 |
|
| ||
|
|
| 35 |
|
| ||
|
|
| 35 |
|
| ||
|
|
|
|
|
|
| |
|
|
| 36 |
|
| ||
|
|
| 37 |
|
| ||
| Management’s Discussion and Analysis of Financial Condition and Results of Operations |
|
| 42 |
|
| |
|
|
| 42 |
|
| ||
|
|
| 82 |
|
| ||
|
|
| 83 |
|
| ||
On March 15, 2006, Aames Investment Corporation (“Aames Investment”), which elected to qualify as a mortgage real estate investment trust, or REIT, for U.S. federal income tax purposes for the six months ended December 31, 2004 and for the year ended December 31, 2005, announced that it intends to alter its structure so that it would no longer be required to pay out at least 90% of its taxable earnings to its stockholders as dividends, but rather, would retain its capital for internal growth. On March 24, 2006, Aames Investment’s Board of Directors approved a corporate reorganization to achieve that goal. In the reorganization, the following would occur:
1. Aames Financial Corporation (“Aames Financial”), Aames Investment’s current taxable REIT subsidiary or TRS, would form a wholly owned REIT subsidiary, to acquire, hold and service mortgage loans.
2. If approved by the stockholders, Aames Investment would merge with the REIT subsidiary, which would result in: (i) Aames Financial becoming the new parent of Aames Investment, (ii) common stockholders of Aames Investment exchanging their shares for common shares of Aames Financial, and (iii) Aames Investment becoming a subsidiary of Aames Financial.
3. Since Aames Investment, the REIT, would be a subsidiary of Aames Financial, it would distribute its taxable income, including income from the REIT portfolio, to Aames Financial, rather than to public stockholders. This would enable Aames Financial to retain the earnings on the REIT portfolio for internal capital growth. In addition, by reorganizing Aames Investment as a subsidiary of Aames Financial, Aames Investment’s taxable earnings, including the earnings from the REIT portfolio, would be subject to shelter from taxation through utilization of Aames Financial’s historical net operating loss carryforwards (“NOLs”) until fully utilized. The taxable income generated by Aames Financial is subject to regular corporate income tax. However, as of December 31, 2005, Aames Financial had approximately $304.1 million of NOLs for U.S. federal income tax purposes that expire from 2017 through 2025. We believe that Aames Financial will be able to use these NOLs to offset its future income, subject to annual limitations and, as a result, Aames Financial will have substantially lower effective tax rates than statutory rates.
On March 27, 2006, the Company announced that it is in the process of closing two of its five wholesale operations centers, in Deerfield, Florida and Parsippany, New Jersey, and consolidating the functions previously performed in those centers into its centers located in Irvine, California, Jacksonville, Florida and Dallas, Texas. The Company has also eliminated 100 positions in the wholesale channel. The Company expects to record a charge to income of from $2.0 million to $3.0 million during the three months ended March 31, 2006 in connection with these steps. The combined annual savings from these actions are currently estimated at $10.0 million.
Aames Investment was formed in February 2004 to build and manage a portfolio of high yielding, subprime residential mortgage loans to offer its stockholders the opportunity for attractive dividend yields and earnings growth. In November 2004, we completed an initial public offering, and, concurrently with that offering, a reorganization with Aames Financial, formerly our parent company. As a result of the reorganization, Aames Financial became a wholly owned subsidiary of ours.
Aames Financial is a national mortgage banking company, founded in 1954, which focuses primarily on originating, selling and servicing residential mortgage loans through both wholesale and retail channels
1
under the name “Aames Home Loan.” Our strategy is to use our equity capital and funds borrowed under revolving warehouse and repurchase facilities to finance our mortgage loan originations, and to use those financing sources, together with on-balance sheet securitizations, to finance our REIT portfolio of mortgage loans. We retain in our REIT portfolio a portion of our mortgage loan originations, largely hybrid/adjustable rate mortgage loans. We sell the remainder, including a majority of the fixed-rate mortgage loans that we originate, on a whole loan servicing-released basis to third parties.
As a REIT, we generally are not subject to U.S. federal income tax on the REIT income that we distribute to our stockholders. During the six months ended December 31, 2004 and the year ended December 31, 2005 we distributed at least 90% of the earnings from our REIT portfolio of mortgage loans to our stockholders, while retaining a portion of Aames Financial’s earnings.
Our goal is to maximize stockholder value and increase earnings by:
· Generating internal capital through the retention of earnings from both our REIT portfolio and mortgage loan originations, sales and servicing;
· Managing our portfolio of high yielding subprime residential mortgage loans and our equity leverage to maximize the return on our REIT portfolio of mortgage loans and our returns, while at the same time managing our financing costs and the increased risk of loss associated with our leverage. Under the reorganization, the REIT portfolio would be held by a REIT subsidiary of Aames Financial;
· Continuing to improve our efficiency and loan quality and serving as a highly efficient originator. We intend to accomplish this by increasing the use of technology to streamline further our loan origination and underwriting processes. We intend to rigorously apply and continuously improve our underwriting criteria and processes in order to minimize defaults and losses and by collecting comprehensive performance data on our REIT portfolio to refine our underwriting guidelines and risk-based pricing;
· Growing our loan originations by improving market penetration in our existing markets, and building the “Aames Home Loan” brand. In addition, we will continue to originate loan products that are less sensitive to increases in interest rates than rate-term refinance mortgage loans, such as purchase money mortgage loans and cash-out refinance loans, which we believe makes our originations less vulnerable to declines resulting from increases in interest rates;
· Selling a portion of Aames Financial’s mortgage loan production on a whole loan, servicing-released basis into the secondary markets so as to maximize its earnings. We will sell the loans we do not retain for our REIT portfolio to third parties to capture gain on sale income from these loans and grow our equity capital on a consolidated basis; and
· �� Servicing our loans to enhance the performance of our REIT portfolio, and growing our servicing operation with our REIT portfolio which will lower our per loan servicing costs through economies of scale.
The strategies discussed above contain forward-looking statements. Such statements are based on current expectations and are subject to risks, uncertainties and assumptions, including those discussed under “Item 7. Management’s Discussion and Analysis of Financial Condition and Results of Operations—Risk Factors.” Should one or more of these risks or uncertainties materialize, or should underlying assumptions prove incorrect, actual results may vary materially from those anticipated, estimated or projected. Thus, no assurance can be given that we will be able to accomplish the above strategies.
2
We believe that we have the following competitive advantages:
· Large Scale Originations Through Multiple Loan Origination Channels. Aames Financial originates mortgage loans through both retail and wholesale channels, which provides us with a more diverse origination platform than many of our competitors. Aames Financial’s retail channel, with 76 branches across the United States, puts us in direct contact with many of our customers. This enables us to generate loan origination fee income and provides us with the opportunity to create customer loyalty that we believe makes our retail customers less interest-rate sensitive than our wholesale customers. In addition, originating loans through both retail and wholesale channels gives us the stability of a retail franchise, together with the ability of a wholesale operations channel to respond more quickly to changes in the marketplace.
· Aames Financial Has $304.1 Million of Historical NOLs Available to Offset Future Income. As a result of these NOLs, subject to certain annual limitations, Aames Financial will have substantially lower effective tax rates than statutory rates. Under the reorganization, the earnings of the REIT portfolio would be subject to shelter from taxation through the use of these NOLs.
· Disciplined Underwriting Guidelines and Efficient Supporting Processes and Technology. Our use of technology to integrate sophisticated risk management models, maintain credit decision consistency and drive loss mitigation efforts has increased underwriting efficiency and lowered our costs. Combined with our results-oriented compensation program based on a combination of volume, profitability, efficiency and quality, we believe we are able to efficiently produce profitable loans.
· Quality Customer Service. Our loan officers and account executives work closely with our customers and customer-focused processing and underwriting teams to provide quick loan approvals and quality service, and to be responsive to borrowers’ and brokers’ needs, including funding to meet our customers’ timelines. We believe this focus on service, quality, and efficiency results in increased originations through referrals from borrowers and repeat business from brokers that are highly satisfied with our underwriting and funding process.
· A Developed and Scalable Servicing Platform and Experienced Servicing Personnel. We currently have in place a subprime residential mortgage loan servicing team with over 100 servicing employees at December 31, 2005 and a scalable servicing platform. Aames Financial’s servicing platform has received a SQ3 rating from Moody’s and an RPS3- rating from Fitch. Additionally, S&P has included us on their list of approved servicers. We had a servicing portfolio, including loans held for investment and loans held for sale, of approximately $6.1 billion at December 31, 2005.
· Seasoned Management Team. Our CEO and most of our senior management team have been with us for over five years and our CEO and most of our senior executives had significant prior experience with large commercial banks and mortgage banks and other financial service industry professionals with experience investing in and managing portfolios of residential mortgage loans and residential mortgage-backed securities.
MORTGAGE LOAN PORTFOLIO MANAGEMENT
We invest in subprime one-to-four family, residential mortgage loans, operating as a long-term portfolio investor. We purchase loans originated by Aames Financial that we anticipate holding on our balance sheet in our REIT portfolio, largely hybrid/adjustable rate mortgage loans. Aames Financial services the loans in our REIT portfolio.
To provide us with long-term financing for our REIT portfolio of mortgage loans, we securitize substantially all of those loans through on-balance sheet securitization transactions structured as financings, rather than sales, for both tax and financial accounting purposes. Accordingly, these loans will
3
remain on our consolidated balance sheet as an asset and reported as “Loans held for investment, net,” while the underlying bonds issued through the securitization will be reported as a liability as “Financings on loans held for investment.” During the year ended December 31, 2005, we securitized $3.7 billion of mortgage loans through the completion of four on-balance sheet transactions, and during the year ended December 31, 2004, we securitized $1.2 billion of mortgage loans through the completion of one on-balance sheet transaction.
We record interest income on the mortgage loans and interest expense on the bonds issued in the securitization over the life of the securitization and do not recognize gain or loss upon the completion of the securitization for financial reporting purposes. This accounting treatment more closely matches the recognition of income with our actual receipt of cash payments, which we believe provides us with more stable results of operations compared to companies that structure their securitizations as sales. We expect net interest income from our portfolio of mortgage loans to generate a substantial portion of our earnings.
We generate taxable earnings from the loans that we securitize or retain in our REIT portfolio primarily through:
· net interest income, which is the difference between the:
· interest income received from the mortgage loans; and
· interest paid to the holders of the mortgage-backed bonds issued in securitizations,
· net of:
· losses due to defaults and delinquencies on the loans; and
· servicing fees and expenses.
During the year ended December 31, 2005, we purchased a majority of Aames Financial’s mortgage loan originations to build our REIT portfolio. We have not established a limit on the amount of leverage we may incur, but we generally intend to maintain a REIT portfolio that is approximately 12 to 15 times the amount of our consolidated stockholders’ equity. Going forward, we anticipate purchasing a smaller portion of Aames Financial’s originations to maintain our target leverage ratio. Aames Financial will then sell the remainder of its loan originations, including a portion of its hybrid/adjustable rate mortgage loans, to third parties in the secondary market.
A significant risk to our operations that relates to our REIT portfolio management is the risk that our net interest income will decline because interest rates on our assets will not adjust at the same time or amount as the rates on our liabilities adjust. This is because the interest on the underlying hybrid/adjustable rate mortgage loans is based on fixed rates payable on the underlying loans for the first two or three years from origination, while the holders of the applicable bonds issued in securitization are generally paid based on an adjustable one-month LIBOR-based yield. Moreover, even after the initial fixed period, our loans generally adjust every six months and are subject to periodic rate caps, whereas the bonds adjust monthly based primarily on one-month LIBOR. Therefore, an increase in one-month LIBOR generally reduces the net interest income we receive from our securitized loan portfolio. We attempt to mitigate a portion of this net interest margin variability during the first two years after loan origination by purchasing derivative financial instruments referred to as interest rate cap agreements.
We do not use formalized hedge accounting for our derivative financial instruments, currently interest rate cap agreements, as set forth in generally accepted accounting principles in the United States. Instead, we are required to record the change in the value of the derivatives as a component of earnings even though they may reduce our interest risk. In times where short-term rates drop significantly, the value of our interest rate cap agreements will decrease; in times where short-term rates increase, the value of the interest rate cap agreements will increase. The interest rate cap agreements are designed to exchange the cost of our variable rate liabilities to fixed rates for the first two years of their estimated duration, thereby
4
better matching our interest-earning hybrid/adjustable rate mortgage loans during the initial fixed rate period.
Another significant risk to our net interest income is the risk that the net interest income we receive from securitizations will be reduced if there are a significant amount of loan defaults or loan prepayments, especially on loans with interest rates that are high relative to the rest of the securitized mortgage loan pool.
INVESTMENT AND OPERATIONAL POLICIES
Our investment strategy is subject to change if and when our board of directors determines that a change is in our stockholders’ best interest. Neither stockholder approval nor notification is required prior to changing our investment strategy.
If we change our investment strategy, the new strategy may entail more risk than our current investment strategy. Alternative strategies that our board of directors may choose to put in place include:
· purposefully exposing the value of our holdings to changes in interest rates or changes in the difference between short- and long-term rates; or
· holding mortgage-backed securities with a credit rating lower than AAA or mortgage-backed securities collateralized by mortgage loans originated by and purchased from third parties.
In general, our strategy is to maintain a portfolio of mortgage loans primarily originated by Aames Financial. Our mortgage loans are generally underwritten in accordance with the categories and criteria described in our underwriting guidelines. See “Underwriting Standards.”
Our current REIT portfolio generally consists of mortgage loans originated by Aames Financial that collateralize mortgage-backed bonds and that will collateralize future mortgage-backed securitizations. From time to time, we may acquire and hold mortgage-backed securities issued by third parties to satisfy certain asset and income tests applicable to REITs. The mortgage-backed securities are expected to be backed primarily by first mortgages on one- to four-family dwellings and are expected to be rated by S&P or Moody’s. We have not previously acquired or held any third-party mortgage-backed securities in our investment portfolio.
We employ a leverage strategy by securitizing existing mortgages in transactions that we believe will be treated as borrowings for accounting and tax purposes. We generally intend to maintain a REIT portfolio that is approximately 12 to 15 times the amount of our consolidated stockholders’ equity.
To mitigate the adverse effects from interest rate increases on our mortgage loans held for sale or investment, we use several tools and risk management strategies to monitor and address interest rate risk. We believe that these tools allow us to monitor and evaluate our exposure to interest rates and to manage the risk profile of our mortgage loan portfolio in response to changes in market conditions. As part of our interest rate risk management process, we have used derivative financial instruments, such as interest rate cap agreements, interest rate swap agreements, Treasury futures and options on interest rates. Hedging strategies also involve transaction and other costs. Because we use derivative financial instruments more than we did prior to the REIT reorganization, the aggregate costs to us of entering into contracts for these instruments is significantly higher than in the past.
5
The derivative financial instruments that we currently use are interest rate cap agreements. These derivative instruments have an active secondary market and are intended to provide supplemental income and cash flow to offset potential reduced interest income and cash flow in certain interest rate environments. It is not our policy to use derivatives to speculate on interest rates. We report our derivative financial instruments on our consolidated balance sheets at their fair value, with any changes in fair value recorded as either a gain or loss to the consolidated statement of operations.
We may raise funds through additional equity offerings, debt financings, retention of cash flow, or a combination of these methods subject to Internal Revenue Code provisions regarding distribution requirements and taxability of undistributed REIT taxable income. If our board of directors decides to raise additional equity capital, it has the authority to issue additional shares of common or preferred stock, in any manner and on terms it deems appropriate, up to the amount authorized in our articles of incorporation without stockholder approval.
On November 4, 2005, our Form S-3 shelf registration statement, filed for the purpose of selling our common stock, preferred stock, debt securities or other securities in one or more offerings up to an aggregate dollar amount of $500.0 million, was declared effective by the Securities and Exchange Commission (“SEC”). Depending on our liquidity needs and market conditions, we may issue one or more of these securities in different amounts and at different times. We intend to use the proceeds from any sale of these securities for general corporate purposes, which includes continuing to build a portfolio of self-originated mortgage loans, for general working capital purposes and to reduce short-term indebtedness. As part of the Form S-3 filing, we also registered 5.0 million shares of common stock to be issued in connection with our Dividend Reinvestment and Direct Stock Purchase Plan.
Currently, our borrowings consist primarily of funds borrowed under revolving warehouse and repurchase facilities and financings on loans held for investment. In addition, we have a revolving facility collateralized by subordinated mortgage-backed bonds we have retained in our on-balance sheet securitizations. Future borrowings may be in the form of bank borrowings, secured or unsecured, and publicly or privately placed debt instruments, purchase money obligations to the sellers of assets, long-term, tax-exempt bonds or other publicly or privately placed debt instruments, financing from banks, institutional investors or other lenders, and securitizations, including collateralized debt obligations, any of which may be unsecured or secured by mortgages or other interests in the assets. This indebtedness may entail recourse to all or any part of our assets or may be limited to the particular assets to which the indebtedness relates.
We enter into collateralized borrowings only with institutions that we believe are financially sound and that are rated investment grade by at least one nationally recognized statistical rating organization.
We purchase subprime, one-to-four family residential mortgage loans that Aames Financial originates. These loan originations are significant to our financial results because they are the primary source of the loans that we hold in our on-balance sheet REIT portfolio of loans held for investment, and of the loans that we sell to the secondary markets. The loans originated that are not retained in our REIT portfolio are sold to the secondary markets. From time to time, depending on market conditions and attractiveness of terms, we may supplement our loan production by purchasing mortgage loans from secondary market sellers.
Our principal market is borrowers whose financing needs are not being met by traditional mortgage lenders for a variety of reasons, including the need for specialized loan products or credit histories that may limit such borrowers’ access to credit. These types of borrowers generally pay higher mortgage loan
6
origination fees and interest rates than those charged by conventional lending sources. We believe these borrowers continue to present an opportunity for us to earn a return commensurate with the risk assumed. Our residential mortgage loans, which include fixed and hybrid/adjustable rate mortgage loans, or ARMS, are generally used by borrowers to consolidate indebtedness, finance other consumer needs, or purchase homes. We believe that while our loan origination volume is affected by general levels of interest rates, because a majority of our loan originations are cash-out refinancings and purchase money loans, our loan origination volume is generally less cyclical than conventional mortgage lending, which has a higher percentage of rate/term refinance loans.
As of December 31, 2005, Aames Financial originated loans in 47 states through its retail and wholesale channels. Its retail channel had a network of 76 retail branch offices directly serving borrowers throughout the United States. Its wholesale channel operated five regional wholesale operations centers throughout the United States and originated loans through a nationwide network of approximately 3,700 independent mortgage brokers who submit mortgage loans to it.
The following table shows our total originations by retail and wholesale channels for the periods indicated (dollars in thousands):
|
| Years Ended |
| Six Months Ended |
| Years Ended |
| ||||||||||||
|
| 2005 |
| 2004 |
| 2004 |
| 2003 |
| 2004 |
| 2003 |
| ||||||
Loans Funded: |
|
|
|
|
|
|
|
|
|
|
|
|
| ||||||
Retail |
| $ | 2,746,321 |
| $ | 2,421,525 |
| $ | 1,189,707 |
| $ | 1,168,675 |
| $ | 2,400,493 |
| $ | 1,795,447 |
|
Wholesale |
| 4,008,207 |
| 4,998,120 |
| 2,397,841 |
| 1,988,222 |
| 4,588,501 |
| 2,650,733 |
| ||||||
Total |
| $ | 6,754,528 |
| $ | 7,419,645 |
| $ | 3,587,548 |
| $ | 3,156,897 |
| $ | 6,988,994 |
| $ | 4,446,180 |
|
% of Total: |
|
|
|
|
|
|
|
|
|
|
|
|
| ||||||
Retail |
| 40.7 | % | 32.6 | % | 33.2 | % | 37.0 | % | 34.3 | % | 40.4 | % | ||||||
Wholesale |
| 59.3 | % | 67.4 | % | 66.8 | % | 63.0 | % | 65.7 | % | 59.6 | % | ||||||
Total |
| 100.0 | % | 100.0 | % | 100.0 | % | 100.0 | % | 100.0 | % | 100.0 | % | ||||||
A significant risk to our mortgage originations operations is liquidity risk—the risk that we will not have the financing facilities and cash available to fund and hold loans prior to their sale or securitization. We maintain committed borrowing facilities with large banking and investment institutions to reduce this risk.
Our Retail Channel
We generate applications for loans through our retail loan office network principally through a direct response marketing program, which relies primarily on the use of direct mailings to homeowners, telemarketing and Internet generated leads, and through referrals from our customers, real estate agents and others. We generate customer leads for the retail network based upon models that we have derived and commercially developed customer lists. Our direct mail invites prospective borrowers to call us to apply for a loan. We also generate leads through several commercially available Internet sites as well as through our own retail Internet web site “Aames.com.” We believe that our marketing efforts establish name recognition and serve to distinguish us from our competitors. We continually monitor the source of our applications to determine the most effective methods and manner of marketing. Whether generated through direct mail or the Internet, leads are generally followed up with telephone calls to potential customers. Our loan officers at the local retail loan office pre-qualify a potential customer and if the customer is interested, take an application over the telephone or schedule an appointment with the customer at the retail loan office most conveniently located to the customer or in the customer’s home, depending on the customer’s needs.
7
The retail loan officer assists the applicant in completing the loan application, arranges for an appraisal, orders a credit report from an independent, nationally recognized credit reporting agency and performs various other tasks in connection with the completion of the loan package. The loan package is underwritten for loan approval on a centralized basis. If we approve the loan package, the loan is funded. Our loan officers are trained to structure loans that meet the applicant’s needs while satisfying our lending guidelines.
We continually monitor our retail operations in the markets in which we operate and evaluate existing and potential retail offices on the basis of selected demographic statistics, marketing analyses and other criteria that we have developed in order to further enhance our mortgage loan production capabilities. As part of this evaluation process, we have closed retail branches in markets where it was not financially feasible to continue to service the market area in this manner. However, we continue to service many of these areas through our wholesale channel and the Internet.
During the year ended December 31, 2005, we originated loans through our network of approximately 3,700 independent wholesale mortgage brokers throughout the United States, none of which accounted for more than 5.0% of total wholesale originations.
The broker’s role is to identify the applicant, assist in completing the loan application, gather necessary information and documents, submit the application requesting the interest rate and terms of the loan, and serve as our liaison with the borrower through the lending process. We review and underwrite the applications submitted by the broker in accordance with our underwriting guidelines and then approve or deny the application. If the loan is approved, we approve or counter the requested interest rate and other terms of the loan and, upon acceptance by the borrower and satisfaction of all conditions imposed by us, we fund the loan. Because brokers conduct their own marketing and employ their own personnel to complete loan applications and maintain contact with borrowers, originating loans through our wholesale network allows us to increase our loan volume without incurring the higher marketing and employee costs associated with retail originations.
Because mortgage brokers generally submit loan files to several prospective lenders simultaneously, competitive pricing, consistent underwriting, quick response times, and personal service are critical to successfully producing loans through independent mortgage brokers. To meet these requirements, we strive to respond to the loan application within 24 hours. In addition, the loans are processed and underwritten in regional offices, and loan consultants, loan processors, and underwriters are available to answer questions, assist in the loan application process, and facilitate ultimate funding of the loan.
8
The following table presents certain information about our mortgage loan production at or during the periods indicated:
|
| Years Ended |
| Six Months Ended |
| Years Ended |
| ||||||||||||
|
| 2005 |
| 2004 |
| 2004 |
| 2003 |
| 2004 |
| 2003 |
| ||||||
Retail: |
|
|
|
|
|
|
|
|
|
|
|
|
| ||||||
Total dollar amount (in thousands) |
| $ | 2,746,321 |
| $ | 2,421,525 |
| $ | 1,189,707 |
| $ | 1,168,675 |
| $ | 2,400,493 |
| $ | 1,795,447 |
|
Number of loans |
| 18,496 |
| 19,088 |
| 9,324 |
| 9,077 |
| 18,841 |
| 15,325 |
| ||||||
Average loan amount |
| $ | 148,482 |
| $ | 126,861 |
| $ | 127,596 |
| $ | 128,751 |
| $ | 127,408 |
| $ | 117,158 |
|
Average initial LTV |
| 75.63 | % | 76.77 | % | 76.15 | % | 76.56 | % | 76.93 | % | 77.21 | % | ||||||
Weighted average interest rate(1) |
| 7.42 | % | 7.38 | % | 7.47 | % | 7.27 | % | 7.27 | % | 7.67 | % | ||||||
Retail branch offices at period end |
| 76 |
| 96 |
| 96 |
| 95 |
| 99 |
| 93 |
| ||||||
Wholesale(2): |
|
|
|
|
|
|
|
|
|
|
|
|
| ||||||
Total dollar amount (in thousands) |
| $ | 4,008,207 |
| $ | 4,998,120 |
| $ | 2,397,841 |
| $ | 1,988,222 |
| $ | 4,588,501 |
| $ | 2,650,733 |
|
Number of loans |
| 28,023 |
| 34,140 |
| 16,563 |
| 13,977 |
| 31,554 |
| 19,009 |
| ||||||
Average loan amount |
| $ | 143,033 |
| $ | 146,401 |
| $ | 144,771 |
| $ | 142,250 |
| $ | 145,417 |
| $ | 139,446 |
|
Average initial LTV |
| 81.37 | % | 81.42 | % | 81.18 | % | 82.00 | % | 81.59 | % | 80.10 | % | ||||||
Weighted average interest rate(1) |
| 7.70 | % | 7.37 | % | 7.52 | % | 7.69 | % | 7.43 | % | 7.96 | % | ||||||
Regional wholesale operations centers at period end |
| 5 | (3) | 5 |
| 5 |
| 5 |
| 5 |
| 4 |
| ||||||
Total: |
|
|
|
|
|
|
|
|
|
|
|
|
| ||||||
Total dollar amount (in thousands) |
| $ | 6,754,528 |
| $ | 7,419,645 |
| $ | 3,587,548 |
| $ | 3,156,897 |
| $ | 6,988,994 |
| $ | 4,446,180 |
|
Number of loans |
| 46,519 |
| 53,228 |
| 25,887 |
| 23,054 |
| 50,395 |
| 34,334 |
| ||||||
Average loan amount |
| $ | 145,199 |
| $ | 139,394 |
| $ | 138,585 |
| $ | 136,935 |
| $ | 138,684 |
| $ | 129,498 |
|
Average initial LTV |
| 79.03 | % | 79.90 | % | 79.51 | % | 79.99 | % | 79.99 | % | 78.93 | % | ||||||
Weighted average interest rate(1) |
| 7.59 | % | 7.37 | % | 7.50 | % | 7.53 | % | 7.38 | % | 7.84 | % | ||||||
(1) Calculated with respect to the interest rate at the time we originated or purchased the mortgage loan.
(2) Wholesale originations include the purchases of closed loans from correspondents of $51.7 million, $4.1 million, $4.2 million, and $19.3 million during the year ended December 31, 2005, six months ended December 31, 2003, and the years ended June 30, 2004 and 2003, respectively. No such loans were purchased during the year ended December 31, 2004 and the six months ended December 31, 2004.
(3) On March 27, 2006, the Company announced the closure of two regional wholesale operations centers and the consolidation of their operations into the remaining three centers.
9
The following tables show the changes in our total production, number of loans and average loan amount for the periods indicated:
|
| Years Ended |
| Six Months Ended |
| Years Ended |
| |||||||||
|
| Amount |
| % |
| Amount |
| % |
| Amount |
| % |
| |||
Increase (Decrease) in Total Production: |
|
|
|
|
|
|
|
|
|
|
|
|
| |||
(in thousands) |
|
|
|
|
|
|
|
|
|
|
|
|
| |||
Retail |
| $ | 324,796 |
| 13.4 | % | $ | 21,032 |
| 1.8 | % | $ | 605,046 |
| 33.7 | % |
Wholesale |
| (989,913 | ) | (19.8 | )% | 409,619 |
| 20.6 | % | 1,937,768 |
| 73.1 | % | |||
Total |
| $ | (665,117 | ) | (9.0 | )% | $ | 430,651 |
| 13.6 | % | $ | 2,542,814 |
| 57.2 | % |
Increase (Decrease) in Number of Loans: |
|
|
|
|
|
|
|
|
|
|
|
|
| |||
Retail |
| (592 | ) | (3.1 | )% | 247 |
| 2.7 | % | 3,516 |
| 22.9 | % | |||
Wholesale |
| (6,117 | ) | (17.9 | )% | 2,586 |
| 18.5 | % | 12,545 |
| 66.0 | % | |||
Total |
| (6,709 | ) | (12.6 | )% | 2,833 |
| 12.3 | % | 16,061 |
| 46.8 | % | |||
Increase (Decrease) in Average Loan Amount: |
|
|
|
|
|
|
|
|
|
|
|
|
| |||
Retail |
| $ | 21,621 |
| 17.0 | % | $ | (1,155 | ) | (0.9 | )% | $ | 10,250 |
| 8.7 | % |
Wholesale |
| (3,368 | ) | (2.3 | )% | 2,521 |
| 1.8 | % | 5,971 |
| 4.3 | % | |||
Total |
| 5,805 |
| 4.2 | % | 1,650 |
| 1.2 | % | 9,186 |
| 7.1 | % | |||
Total loan production declined by $665.1 million, or 9.0%, to $6.8 billion during the year ended December 31, 2005 compared to $7.4 billion during the year ended December 31, 2004. The decrease was primarily due to competitive and interest rate pressures in the marketplace due to increases in short-term interest rates. Many subprime lenders responded to these increases in short-term interest rates by offering interest-only loans and negative amortization loans in an attempt to minimize increases in borrowers’ monthly payments. We did not originate negative amortization loans and limited our production of interest-only loans, which negatively impacted our originations, especially in wholesale, for the year ended December 31, 2005.
Total loan production during the six months ended December 31, 2004 grew by $430.7 million, or 13.6%, to $3.6 billion over the $3.2 billion of loan production during the six months ended December 31, 2003. This growth was primarily due to continued demand for subprime products and improved geographic diversification in the wholesale and retail channels despite a generally increasing mortgage interest rate environment prevailing in the marketplace.
Total loan production during the year ended June 30, 2004 grew by $2.5 billion, or 57.2%, to $7.0 billion from $4.4 billion for the year ended June 30, 2003. This growth was due to a combination of our adoption of new mortgage loan product guidelines, continued strong demand for subprime products in the generally favorable mortgage interest rate environment prevailing in the marketplace, growth in the number of sales staff in the retail channel, and improved geographic diversification in the wholesale channel.
Total retail loan production increased by $324.8 million, or 13.4%, to $2.7 billion during the year ended December 31, 2005 compared to $2.4 billion during the year ended December 31, 2004. This growth was primarily due to an increase in average loan size of $21,621, or 17.0%, partially offset by a 3.1% decrease in the number of loans. This reflected the retail channel’s reduction of 20 branches to 76 branches at December 31, 2005, compared to 96 branches at December 31, 2004, pursuant to our retail strategy of closing branches in smaller markets with smaller average loan amounts, focusing its loan origination efforts in larger markets with larger average loan amounts, and expanding staffing and loan origination capacity in certain larger retail branches, which we refer to as “Super Branches,” in those areas.
10
Total retail production was $1.2 billion during the six months ended December 31, 2004, an increase of $21.0 million, or 1.8%, over total retail production during the comparable six-month period in 2003. Retail production grew slightly during the six months ended December 31, 2004 over the comparable period in 2003, primarily due to a 2.7% increase in the number of loans originated, partially offset by a 0.9% decline in average loan size. The growth in the number of loans was primarily due to our decision to expand larger “Super Branches” during the six months ended December 31, 2004, partially offset by increased competitive pressures in the December 2004 quarter due to the increased interest rate environment.
Total retail loan production increased by $605.0 million, or 33.7%, to $2.4 billion during the year ended June 30, 2004 over the $1.8 billion during the year ended June 30, 2003.
Total wholesale loan production decreased by $989.9 million, or 19.8%, to $4.0 billion during the year ended December 31, 2005 compared to $5.0 billion during the year ended December 31, 2004. This decline was primarily due to a 17.9% decrease in the number of loans originated, as well as a decrease in average loan size of $3,368, or 2.3%. This decrease was due in part to management’s decision not to offer negative amortization loans and to limit the production of interest-only loans in a rising short-term interest rate environment, where consumer demand increased for these products. In addition, during 2005, our wholesale pricing was at times higher than several other subprime lenders, which negatively affected wholesale loan production.
Total wholesale production grew by $409.6 million, or 20.6%, to $2.4 billion during the six months ended December 31, 2004 over $2.0 billion of total wholesale production during the six months ended December 31, 2003. The increase was due primarily to an 18.5% increase in the number of loans originated coupled with a 1.8% increase in average loan size.
Total wholesale production increased by $1.9 billion, or 73.1%, during the year ended June 30, 2004 over the $2.7 billion during the year ended June 30, 2003. In November 2003, we added a regional wholesale operations center in the Northeastern United States, which enabled us to increase our production in that region.
The following table summarizes certain information about our mortgage loan production by purpose for the periods indicated (dollars in thousands):
|
| Years Ended |
| Six Months Ended |
| Years Ended |
| ||||||||||||||
|
| December 31, |
| December 31, |
| June 30, |
| ||||||||||||||
Purpose |
|
|
| 2005 |
| 2004 |
| 2004 |
| 2003 |
| 2004 |
| 2003 |
| ||||||
Loans Funded: |
|
|
|
|
|
|
|
|
|
|
|
|
| ||||||||
Cash-out refinance |
| $ | 3,906,641 |
| $ | 4,423,226 |
| $ | 2,104,690 |
| $ | 1,907,737 |
| $ | 4,222,127 |
| $ | 2,822,770 |
| ||
Purchase money |
| 2,618,182 |
| 2,674,084 |
| 1,354,148 |
| 994,513 |
| 2,326,930 |
| 1,044,557 |
| ||||||||
Rate/term refinance |
| 229,705 |
| 322,335 |
| 128,710 |
| 254,647 |
| 439,937 |
| 578,853 |
| ||||||||
Total |
| $ | 6,754,528 |
| $ | 7,419,645 |
| $ | 3,587,548 |
| $ | 3,156,897 |
| $ | 6,988,994 |
| $ | 4,446,180 |
| ||
% of Total: |
|
|
|
|
|
|
|
|
|
|
|
|
| ||||||||
Cash-out refinance |
| 57.8 | % | 59.6 | % | 58.7 | % | 60.4 | % | 60.4 | % | 63.5 | % | ||||||||
Purchase money |
| 38.8 | % | 36.0 | % | 37.7 | % | 31.5 | % | 33.3 | % | 23.5 | % | ||||||||
Rate/term refinance |
| 3.4 | % | 4.4 | % | 3.6 | % | 8.1 | % | 6.3 | % | 13.0 | % | ||||||||
Total |
| 100.0 | % | 100.0 | % | 100.0 | % | 100.0 | % | 100.0 | % | 100.0 | % | ||||||||
11
The following table summarizes certain information about our mortgage loan production by property type for the periods indicated (dollars in thousands):
|
| Years Ended |
| Six Months Ended |
| Years Ended |
| ||||||||||||||
|
| December 31, |
| December 31, |
| June 30, |
| ||||||||||||||
Property Type |
|
|
| 2005 |
| 2004 |
| 2004 |
| 2003 |
| 2004 |
| 2003 |
| ||||||
Loans Funded: |
|
|
|
|
|
|
|
|
|
|
|
|
| ||||||||
Single-family |
| $ | 5,883,238 |
| $ | 6,498,417 |
| $ | 3,156,159 |
| $ | 2,789,292 |
| $ | 6,131,440 |
| $ | 3,943,157 |
| ||
Multi-family |
| 494,107 |
| 507,426 |
| 233,770 |
| 198,728 |
| 472,405 |
| 262,968 |
| ||||||||
Condominiums |
| 377,183 |
| 413,802 |
| 197,539 |
| 168,767 |
| 385,039 |
| 230,994 |
| ||||||||
All other |
| — |
| — |
| 80 |
| 110 |
| 110 |
| 9,061 |
| ||||||||
Total |
| $ | 6,754,528 |
| $ | 7,419,645 |
| $ | 3,587,548 |
| $ | 3,156,897 |
| $ | 6,988,994 |
| $ | 4,446,180 |
| ||
% of Total: |
|
|
|
|
|
|
|
|
|
|
|
|
| ||||||||
Single-family |
| 87.1 | % | 87.6 | % | 88.0 | % | 88.4 | % | 87.7 | % | 88.7 | % | ||||||||
Multi-family |
| 7.3 | % | 6.8 | % | 6.5 | % | 6.3 | % | 6.8 | % | 5.9 | % | ||||||||
Condominiums |
| 5.6 | % | 5.6 | % | 5.5 | % | 5.3 | % | 5.5 | % | 5.2 | % | ||||||||
All other |
| NM |
| NM |
| NM |
| NM |
| NM |
| 0.2 | % | ||||||||
Total |
| 100.0 | % | 100.0 | % | 100.0 | % | 100.0 | % | 100.0 | % | 100.0 | % | ||||||||
NM = Not meaningful
12
The following table shows our loan originations by geographic region (i.e. state of mortgage property) for the periods indicated (dollars in thousands):
|
| Years Ended |
| Six Months Ended |
| Years Ended |
| ||||||||||||
|
| December 31, |
| December 31, |
| June 30, |
| ||||||||||||
|
| 2005 |
| 2004 |
| 2004 |
| 2003 |
| 2004 |
| 2003 |
| ||||||
Loans Funded: |
|
|
|
|
|
|
|
|
|
|
|
|
| ||||||
California |
| $ | 1,592,215 |
| $ | 2,393,732 |
| $ | 1,108,837 |
| $ | 1,182,972 |
| $ | 2,414,835 |
| $ | 1,529,113 |
|
Florida |
| 1,623,052 |
| 1,444,562 |
| 710,630 |
| 526,703 |
| 1,208,872 |
| 571,078 |
| ||||||
New York |
| 493,117 |
| 529,251 |
| 234,692 |
| 171,029 |
| 511,642 |
| 281,167 |
| ||||||
Texas |
| 535,525 |
| 505,165 |
| 262,508 |
| 219,096 |
| 473,088 |
| 340,896 |
| ||||||
Other Western States |
| 594,704 |
| 749,268 |
| 359,223 |
| 335,406 |
| 734,040 |
| 538,699 |
| ||||||
Midwestern States |
| 413,789 |
| 638,506 |
| 307,090 |
| 280,019 |
| 621,881 |
| 504,786 |
| ||||||
Other Northeastern States |
| 890,394 |
| 683,193 |
| 356,107 |
| 259,839 |
| 604,197 |
| 378,363 |
| ||||||
Other Southeastern States |
| 611,732 |
| 475,968 |
| 248,461 |
| 181,833 |
| 420,439 |
| 302,078 |
| ||||||
Total |
| $ | 6,754,528 |
| $ | 7,419,645 |
| $ | 3,587,548 |
| $ | 3,156,897 |
| $ | 6,988,994 |
| $ | 4,446,180 |
|
% of Total: |
|
|
|
|
|
|
|
|
|
|
|
|
| ||||||
California |
| 23.6 | % | 32.3 | % | 30.9 | % | 37.5 | % | 34.6 | % | 34.4 | % | ||||||
Florida |
| 24.0 | % | 19.5 | % | 19.8 | % | 16.7 | % | 17.3 | % | 12.8 | % | ||||||
New York |
| 7.3 | % | 7.1 | % | 6.6 | % | 5.4 | % | 7.3 | % | 6.3 | % | ||||||
Texas |
| 7.9 | % | 6.8 | % | 7.3 | % | 6.9 | % | 6.8 | % | 7.7 | % | ||||||
Other Western States |
| 8.8 | % | 10.1 | % | 10.0 | % | 10.6 | % | 10.5 | % | 12.1 | % | ||||||
Midwestern States |
| 6.1 | % | 8.6 | % | 8.6 | % | 8.9 | % | 8.9 | % | 11.4 | % | ||||||
Other Northeastern States |
| 13.2 | % | 9.2 | % | 9.9 | % | 8.2 | % | 8.6 | % | 8.5 | % | ||||||
Other Southeastern States |
| 9.1 | % | 6.4 | % | 6.9 | % | 5.8 | % | 6.0 | % | 6.8 | % | ||||||
Total. |
| 100.0 | % | 100.0 | % | 100.0 | % | 100.0 | % | 100.0 | % | 100.0 | % | ||||||
13
The following table summarizes certain information by interest rate about our mortgage loan production for the periods indicated (dollars in thousands):
|
| Years Ended |
| Six Months Ended |
| Years Ended |
| ||||||||||||
|
| December 31, |
| December 31, |
| June 30, |
| ||||||||||||
|
| 2005 |
| 2004 |
| 2004 |
| 2003 |
| 2004 |
| 2003 |
| ||||||
Loans Funded: |
|
|
|
|
|
|
|
|
|
|
|
|
| ||||||
Hybrid: |
|
|
|
|
|
|
|
|
|
|
|
|
| ||||||
Traditional |
| $ | 3,878,815 |
| $ | 5,382,666 |
| $ | 2,598,326 |
| $ | 2,147,990 |
| $ | 4,932,500 |
| $ | 2,531,580 |
|
Interest Only |
| 763,666 |
| 274,180 |
| 180,870 |
| N/A |
| 93,308 |
| N/A |
| ||||||
40/30 |
| 553,830 |
| N/A |
| N/A |
| N/A |
| N/A |
| N/A |
| ||||||
|
| 5,196,311 |
| 5,656,846 |
| 2,779,196 |
| 2,147,990 |
| 5,025,808 |
| 2,531,580 |
| ||||||
Fixed rate: |
|
|
|
|
|
|
|
|
|
|
|
|
| ||||||
Traditional |
| 1,511,773 |
| 1,762,799 |
| 808,352 |
| 1,008,907 |
| 1,963,186 |
| 1,914,600 |
| ||||||
40/30 |
| 46,444 |
| N/A |
| N/A |
| N/A |
| N/A |
| N/A |
| ||||||
|
| 1,558,217 |
| 1,762,799 |
| 808,352 |
| 1,008,907 |
| 1,963,186 |
| 1,914,600 |
| ||||||
Total |
| $ | 6,754,528 |
| $ | 7,419,645 |
| $ | 3,587,548 |
| $ | 3,156,897 |
| $ | 6,988,994 |
| $ | 4,446,180 |
|
% of Total: |
|
|
|
|
|
|
|
|
|
|
|
|
| ||||||
Hybrid: |
|
|
|
|
|
|
|
|
|
|
|
|
| ||||||
Traditional |
| 57.4 | % | 72.5 | % | 72.4 | % | 68.0 | % | 70.6 | % | 56.9 | % | ||||||
Interest Only |
| 11.3 | % | 3.7 | % | 5.1 | % | — |
| 1.3 | % | — |
| ||||||
40/30 |
| 8.2 | % | — |
| — |
| — |
| — |
| — |
| ||||||
|
| 76.9 | % | 76.2 | % | 77.5 | % | 68.0 | % | 71.9 | % | 56.9 | % | ||||||
Fixed rate: |
|
|
|
|
|
|
|
|
|
|
|
|
| ||||||
Traditional |
| 22.4 | % | 23.8 | % | 22.5 | % | 32.0 | % | 28.1 | % | 43.1 | % | ||||||
40/30 |
| 0.7 | % | — |
| — |
| — |
| — |
| — |
| ||||||
|
| 23.1 | % | 23.8 | % | 22.5 | % | 32.0 | % | 28.1 | % | 43.1 | % | ||||||
Total |
| 100.0 | % | 100.0 | % | 100.0 | % | 100.0 | % | 100.0 | % | 100.0 | % | ||||||
N/A = Not Applicable
We underwrite each mortgage loan that we originate in both our wholesale and retail channels in accordance with our underwriting guidelines or the guidelines of specific third party purchasers of our loans. We have developed underwriting processes and criteria that we believe generate quality loans and give us the ability to approve and fund loans quickly. Our underwriting guidelines are designed to help us evaluate a borrower’s history of payments on his prior mortgage credit history, capacity, willingness, and ability to repay the loan, and the value and adequacy of the collateral. We review the borrower’s credit history from all three nationally recognized credit bureaus. In addition, we review credit scores derived from the borrower’s credit history by one or more nationally recognized credit scoring models.
Our underwriting policy is to analyze the overall situation of the borrower and to take into account compensating factors that may be used to offset certain areas of weakness. These compensating factors include proposed reductions in the borrower’s debt service expense, employment stability, number of years in residence and net disposable income. Based upon this analysis, we can determine loan terms and conditions to produce loans that we believe are appropriately priced, meet our quality standards, and are profitable. Our underwriting process and guidelines require a rigorous application review and documentation designed to determine the borrower’s ability to repay the loan and maximize the value of our mortgage loans. We also evaluate each loan that we originate to ensure that it provides a benefit to the borrower in accordance with regulatory requirements.
14
Our on-staff underwriting personnel underwrite all of our loans. We do not delegate underwriting authority to any broker or third party. We regularly train our underwriters on emerging trends in production, and believe that our originators and underwriters are highly qualified and experienced and are familiar with our underwriting guidelines. We believe that our regionalized underwriting process in wholesale provides us with the ability to fund loans quickly and that the experience of our loan originators and branch managers, our information systems, and our rigorous quality control process ensure the continued quality of our loans.
A critical function of our underwriting process is to identify the level of credit risk associated with each applicant for a mortgage loan. We have established six principal classifications with respect to the credit profile of potential borrowers, and have assigned a rating to each loan based upon these classifications. We assign credit grades and pricing by analyzing mortgage payment history, consumer credit history, credit score, and bankruptcy history. Debt-to-income ratios are evaluated to ascertain borrower’s ability to repay their obligation. If an individual loan application does not meet our formal written underwriting guidelines, our underwriters can make underwriting exceptions up to certain limits within our formal exception policies and approval authorities. We may, from time to time, apply underwriting criteria that are either more stringent or more flexible depending upon the economic conditions of a particular geographic market.
We obtain credit scores in connection with mortgage loan applications to help assess a borrower’s creditworthiness. Credit scores are obtained from credit reports provided by various reputable credit reporting organizations, each of which may employ differing computer models and methodologies. The credit score is designed to assess a borrower’s credit history at a single point in time, using objective information currently on file for the borrower at a particular credit reporting organization. Information utilized to create a credit score may include, among other things, payment history, delinquencies on accounts, level of outstanding indebtedness, length of credit history, types of credit, and bankruptcy experience.
Credit scores generally range from approximately 400 to approximately 800, with higher scores indicating an individual with a more favorable credit history compared to an individual with a lower score. However, a credit score purports only to be a measurement of the relative degree of risk a borrower represents to a lender; that is, a borrower with a higher score is statistically expected to be less likely to default on a loan payment than a borrower with a lower score. Moreover, credit scores were developed to indicate a level of default probability over the period of the next two years, which does not correspond to the life of a mortgage loan. Furthermore, credit scores were not developed specifically for use in connection with mortgage loans, but for consumer loans in general. Therefore, a credit score does not take into consideration the differences between mortgage loans and consumer loans, generally, or the specific characteristics of the related mortgage loan including, for example, the LTV or CLTV (defined below), the collateral for the mortgage loan, or the debt-to-income ratio. There can be no assurance that the credit scores of the mortgagors will be accurate predictors of the likelihood of repayment of the related mortgage loans.
An assessment of the adequacy of the real property as collateral for the loan is primarily based upon an appraisal of the property and a calculation of the loan-to-value ratios, or LTV, of the loan applied for and of all mortgages existing on the property, including the loan applied for (the combined loan-to-value
15
ratio, or CLTV) to the appraised value of the property at the time of origination. Appraisers determine a property’s value by reference to the sales prices of comparable properties recently sold, adjusted to reflect the condition of the property as determined through inspection.
We require title insurance coverage issued on an American Land Title Association (or similar) form of title insurance on all residential properties securing mortgage loans we originate. The loan originator and its assignees are generally named as the insured. Title insurance policies indicate the lien position of the mortgage loan and protect us against loss if the title or lien position is not as indicated. The applicant is also required to maintain hazard and, in certain instances, flood insurance, in an amount sufficient to cover the new loan and any senior mortgage, subject to the maximum amount available under the National Flood Insurance Program.
As a lender that generally specializes in loans made to credit impaired borrowers, we make home equity mortgage loans to borrowers with credit histories or other factors that might disqualify them from consideration for a loan from traditional financial institutions. Our underwriting guidelines for such credit impaired borrowers may, in certain instances, allow for higher combined loan-to-value ratios than would typically be the case if the borrower could qualify for a loan from a traditional financial institution, and at generally higher interest rates than the borrower could qualify for from a traditional financial institution.
The underwriting of a mortgage loan to be originated by us generally includes a review of the completed loan package, which includes the loan application, a current appraisal, a preliminary title report and a credit report. All loan applications and all closed loans offered to us for purchase must be approved by us in accordance with our underwriting criteria. We regularly review our underwriting guidelines and make changes when appropriate to respond to market conditions, the performance of loans representing a particular loan product, or changes in laws or regulations.
Our current underwriting guidelines, called Super Aim, became effective October 1, 2003 and generally require a minimum credit score of 500, although a higher credit score is often required to qualify for the maximum LTV under the program.
16
The following chart generally outlines the parameters of the credit grades of the Super Aim underwriting guidelines:
| “A+” |
| “A” |
| “A-” |
| “B” |
| “C” |
| “C-” | |
12 Month Mortgage History |
| 0 x 30 |
| 1 x 30 |
| 3 x 30 |
| 1 x 60 |
| 1 x 90 |
| 1 x 120 |
Minimum Credit Score |
| 500 |
| 500 |
| 500 |
| 500 |
| 500 |
| 500 |
BK/NOD/FC(1) |
| 24 months |
| 24 months |
| 24 months |
| 18 months |
| 12 months |
| No current BK/NOD |
Full Documentation Plus, Owner Occupied Max LTV |
| 80% |
| 80% |
| 80% |
| 80% |
| 75% |
| 70% |
Full Documentation, |
| 80% |
| 80% |
| 80% |
| 80% |
| 75% |
| 70% |
Limited Documentation, Owner Occupied Max LTV |
| 80% |
| 80% |
| 80% |
| 80% |
| 75% |
| 70% |
Stated Income, |
| 80% |
| 80% |
| 75% |
| 75% |
| 70% |
| Not available |
(1) Bankruptcy, notice of default and foreclosure
Our underwriting guidelines include several levels of documentation used to verify the borrower’s income:
· Full Documentation Plus: The highest level of income documentation based upon S&P’s full income documentation guidelines. Generally, a stable, two-year history of income is required. A wage-earner may document income by a verification of employment together with either of the following: the borrower’s most recent two years of W-2 forms and a current pay-stub reflecting year-to-date income; or the borrower’s most recent two years of IRS Form 1040 and a current pay-stub reflecting year-to-date income. A self-employed borrower may document income with the most recent two years of IRS Form 1040 and current year-to-date statement of profit and loss if the loan application is dated more than 120 days after the end of the business’s fiscal year.
· Full Documentation: Generally, a stable, one-year history of income is required. A wage-earner may document income by a verification of employment together with any of the following: the borrower’s most recent W-2 form and a current pay-stub reflecting year-to-date income; the borrower’s most recent IRS Form 1040 and a current pay-stub reflecting year-to-date income; or the borrower’s most recent 12-month personal (or 12-months multiple account holder personal) bank statements showing average monthly deposits sufficient to support the qualifying income. A
17
self-employed borrower may document income with either the most recent two years of IRS Form 1040 and current year-to-date statement of profit and loss if the loan application is dated more than 120 days after the end of the business’s fiscal year; or the borrower’s most recent 12 months of personal or business (or 24 months of commingled personal and business) bank statements showing average monthly deposits sufficient to support the qualifying income.
· Limited Documentation: For borrowers who have less than a one-year history of stable income or who otherwise cannot meet the requirements of the full documentation program. This program generally requires a two-year history in the same profession, together with last year’s IRS Form 1099(s), plus year-to-date bank statements, business bank statements, corporate, partnership, or multiple account holder business bank statements.
· Stated Income: The borrower’s income used to qualify for the loan is taken from the borrower’s signed application and must be reasonable for the borrower’s line of work or profession. All self-employed borrowers must provide satisfactory evidence of existence of the business and show a history of two years of employment in the same profession on the loan application. In some cases, but not in all, the assets of the borrower will be verified.
LOAN PRODUCTION BY BORROWER RISK CLASSIFICATION
The following tables set forth our loan production under the Super Aim guidelines for the periods indicated (dollars in thousands):
|
| Year Ended December 31, 2005 |
| |||||||||||||||||
|
| Loans |
| % of |
| Average |
| Weighted |
| Weighted |
| |||||||||
Credit Grade: |
|
|
|
|
|
|
|
|
|
|
|
|
|
|
|
|
|
|
| |
A+ |
| 5,261,418 |
|
| 78 | % |
|
| 631 |
|
|
| 7.5 | % |
|
| 80 | % |
| |
A |
| 718,788 |
|
| 11 | % |
|
| 599 |
|
|
| 7.5 | % |
|
| 76 | % |
| |
A- |
| 274,979 |
|
| 4 | % |
|
| 565 |
|
|
| 8.0 | % |
|
| 75 | % |
| |
B |
| 324,318 |
|
| 5 | % |
|
| 559 |
|
|
| 8.5 | % |
|
| 75 | % |
| |
C |
| 140,722 |
|
| 2 | % |
|
| 551 |
|
|
| 9.0 | % |
|
| 70 | % |
| |
C- |
| 34,303 |
|
| 0 | % |
|
| 543 |
|
|
| 10.4 | % |
|
| 65 | % |
| |
Total |
| $ | 6,754,528 |
|
| 100 | % |
|
| 619 |
|
|
| 7.6 | % |
|
| 79 | % |
|
|
| Year Ended December 31, 2004 |
| |||||||||||||||||
|
| Loans |
| % of |
| Average |
| Weighted |
| Weighted |
| |||||||||
Credit Grade: |
|
|
|
|
|
|
|
|
|
|
|
|
|
|
|
|
|
|
| |
A+ |
| $ | 5,471,092 |
|
| 74 | % |
|
| 625 |
|
|
| 7.2 | % |
|
| 81 | % |
|
A |
| 882,050 |
|
| 12 | % |
|
| 589 |
|
|
| 7.4 | % |
|
| 79 | % |
| |
A- |
| 372,543 |
|
| 5 | % |
|
| 561 |
|
|
| 7.8 | % |
|
| 77 | % |
| |
B |
| 450,979 |
|
| 6 | % |
|
| 560 |
|
|
| 8.1 | % |
|
| 76 | % |
| |
C |
| 197,075 |
|
| 3 | % |
|
| 550 |
|
|
| 8.8 | % |
|
| 71 | % |
| |
C- |
| 45,906 |
|
| 0 | % |
|
| 541 |
|
|
| 9.9 | % |
|
| 66 | % |
| |
Total |
| $ | 7,419,645 |
|
| 100 | % |
|
| 611 |
|
|
| 7.4 | % |
|
| 80 | % |
|
18
|
| Six Months Ended December 31, 2004 |
| |||||||||||||||||
|
| Loans |
| % of |
| Average |
| Weighted |
| Weighted |
| |||||||||
Credit Grade: |
|
|
|
|
|
|
|
|
|
|
|
|
|
|
|
|
|
|
| |
A+ |
| $ | 2,660,434 |
|
| 74 | % |
|
| 624 |
|
|
| 7.4 | % |
|
| 81 | % |
|
A |
| 410,211 |
|
| 11 | % |
|
| 588 |
|
|
| 7.5 | % |
|
| 79 | % |
| |
A- |
| 172,076 |
|
| 5 | % |
|
| 559 |
|
|
| 8.0 | % |
|
| 77 | % |
| |
B |
| 218,169 |
|
| 6 | % |
|
| 559 |
|
|
| 8.2 | % |
|
| 75 | % |
| |
C |
| 101,717 |
|
| 3 | % |
|
| 549 |
|
|
| 8.8 | % |
|
| 70 | % |
| |
C- |
| 24,941 |
|
| 1 | % |
|
| 540 |
|
|
| 10.0 | % |
|
| 64 | % |
| |
Total |
| $ | 3,587,548 |
|
| 100 | % |
|
| 610 |
|
|
| 7.5 | % |
|
| 80 | % |
|
(1) Calculated with respect to the interest rate at the time the mortgage loan was originated or purchased.
The Super Aim underwriting guidelines became effective October 1, 2003. Because our underwriting guidelines prior to October 1, 2003 were different from the Super Aim guidelines, information concerning loan production by credit grade for prior periods would not be meaningful.
The following tables present certain information about our loan production by credit score range for the periods indicated (dollars in thousands):
|
| Year Ended December 31, 2005 |
| |||||||||||||
|
| Loans |
| % of |
| Weighted |
| Weighted |
| |||||||
Credit Score Range: |
|
|
|
|
|
|
|
|
|
|
|
|
|
|
| |
Above 700 |
| 527,453 |
|
| 8 | % |
|
| 6.9 | % |
|
| 78 | % |
| |
661-700 |
| 960,676 |
|
| 14 | % |
|
| 7.0 | % |
|
| 80 | % |
| |
621-660 |
| 1,863,080 |
|
| 28 | % |
|
| 7.3 | % |
|
| 81 | % |
| |
581-620 |
| 1,785,509 |
|
| 26 | % |
|
| 7.6 | % |
|
| 80 | % |
| |
541-580 |
| 931,290 |
|
| 14 | % |
|
| 8.1 | % |
|
| 78 | % |
| |
540 and below |
| 674,675 |
|
| 10 | % |
|
| 8.7 | % |
|
| 74 | % |
| |
Not available |
| 11,845 |
|
| NM |
|
|
| 8.0 | % |
|
| 78 | % |
| |
Total |
| $ | 6,754,528 |
|
| 100 | % |
|
| 7.6 | % |
|
| 79 | % |
|
|
| Year Ended December 31, 2004 |
| |||||||||||||
|
| Loans |
| % of |
| Weighted |
| Weighted |
| |||||||
Credit Score Range: |
|
|
|
|
|
|
|
|
|
|
|
|
|
|
| |
Above 700 |
| $ | 471,953 |
|
| 6 | % |
|
| 6.8 | % |
|
| 79 | % |
|
661-700 |
| 921,235 |
|
| 12 | % |
|
| 7.0 | % |
|
| 81 | % |
| |
621-660 |
| 1,912,280 |
|
| 26 | % |
|
| 7.2 | % |
|
| 81 | % |
| |
581-620 |
| 1,760,427 |
|
| 24 | % |
|
| 7.2 | % |
|
| 81 | % |
| |
541-580 |
| 1,387,968 |
|
| 19 | % |
|
| 7.7 | % |
|
| 80 | % |
| |
540 and below |
| 956,187 |
|
| 13 | % |
|
| 8.2 | % |
|
| 75 | % |
| |
Not available |
| 9,595 |
|
| NM |
|
|
| 7.6 | % |
|
| 81 | % |
| |
Total |
| $ | 7,419,645 |
|
| 100 | % |
|
| 7.4 | % |
|
| 80 | % |
|
19
|
| Six Months Ended December 31, 2004 |
| |||||||||||||
|
| Loans |
| % of |
| Weighted |
| Weighted |
| |||||||
Credit Score Range: |
|
|
|
|
|
|
|
|
|
|
|
|
|
|
| |
Above 700 |
| $ | 212,504 |
|
| 6 | % |
|
| 7.0 | % |
|
| 79 | % |
|
661-700 |
| 434,801 |
|
| 12 | % |
|
| 7.1 | % |
|
| 81 | % |
| |
621-660 |
| 954,240 |
|
| 27 | % |
|
| 7.3 | % |
|
| 81 | % |
| |
581-620 |
| 860,504 |
|
| 24 | % |
|
| 7.3 | % |
|
| 80 | % |
| |
541-580 |
| 651,915 |
|
| 18 | % |
|
| 7.8 | % |
|
| 80 | % |
| |
540 and below |
| 470,431 |
|
| 13 | % |
|
| 8.4 | % |
|
| 74 | % |
| |
Not available |
| 3,153 |
|
| NM |
|
|
| 7.9 | % |
|
| 79 | % |
| |
Total |
| $ | 3,587,548 |
|
| 100 | % |
|
| 7.5 | % |
|
| 80 | % |
|
|
| Six Months Ended December 31, 2003 |
| |||||||||||||
|
| Loans |
| % of |
| Weighted |
| Weighted |
| |||||||
Credit Score Range: |
|
|
|
|
|
|
|
|
|
|
|
|
|
|
| |
Above 700 |
| $ | 250,462 |
|
| 8 | % |
|
| 6.8 | % |
|
| 77 | % |
|
661-700 |
| 429,278 |
|
| 14 | % |
|
| 7.0 | % |
|
| 80 | % |
| |
621-660 |
| 798,133 |
|
| 25 | % |
|
| 7.4 | % |
|
| 81 | % |
| |
581-620 |
| 712,781 |
|
| 23 | % |
|
| 7.5 | % |
|
| 81 | % |
| |
541-580 |
| 551,302 |
|
| 17 | % |
|
| 8.0 | % |
|
| 81 | % |
| |
540 and below |
| 406,234 |
|
| 13 | % |
|
| 8.4 | % |
|
| 75 | % |
| |
Not available |
| 8,707 |
|
| NM |
|
|
| 9.4 | % |
|
| 88 | % |
| |
Total |
| $ | 3,156,897 |
|
| 100 | % |
|
| 7.5 | % |
|
| 80 | % |
|
|
| Year Ended June 30, 2004 |
| |||||||||||||
|
| Loans |
| % of |
| Weighted |
| Weighted |
| |||||||
Credit Score Range: |
|
|
|
|
|
|
|
|
|
|
|
|
|
|
| |
Above 700 |
| $ | 509,928 |
|
| 7 | % |
|
| 6.7 | % |
|
| 78 | % |
|
661-700 |
| 915,757 |
|
| 13 | % |
|
| 6.9 | % |
|
| 81 | % |
| |
621-660 |
| 1,756,147 |
|
| 25 | % |
|
| 7.2 | % |
|
| 81 | % |
| |
581-620 |
| 1,612,768 |
|
| 23 | % |
|
| 7.3 | % |
|
| 81 | % |
| |
541-580 |
| 1,287,346 |
|
| 18 | % |
|
| 7.8 | % |
|
| 81 | % |
| |
540 and below |
| 891,898 |
|
| 13 | % |
|
| 8.2 | % |
|
| 75 | % |
| |
Not available |
| 15,150 |
|
| NM |
|
|
| 8.6 | % |
|
| 86 | % |
| |
Total |
| $ | 6,988,994 |
|
| 100 | % |
|
| 7.4 | % |
|
| 80 | % |
|
20
|
| Year Ended June 30, 2003 |
| |||||||||||||
|
| Loans |
| % of |
| Weighted |
| Weighted |
| |||||||
Credit Score Range: |
|
|
|
|
|
|
|
|
|
|
|
|
|
|
| |
Above 700 |
| $ | 371,272 |
|
| 8 | % |
|
| 7.1 | % |
|
| 77 | % |
|
661-700 |
| 574,698 |
|
| 13 | % |
|
| 7.4 | % |
|
| 80 | % |
| |
621-660 |
| 1,153,490 |
|
| 26 | % |
|
| 7.7 | % |
|
| 81 | % |
| |
581-620 |
| 1,020,023 |
|
| 23 | % |
|
| 8.0 | % |
|
| 81 | % |
| |
541-580 |
| 776,959 |
|
| 18 | % |
|
| 8.5 | % |
|
| 78 | % |
| |
540 and below |
| 543,670 |
|
| 12 | % |
|
| 8.7 | % |
|
| 74 | % |
| |
Not available |
| 6,068 |
|
| NM |
|
|
| 9.2 | % |
|
| 74 | % |
| |
Total |
| $ | 4,446,180 |
|
| 100 | % |
|
| 7.9 | % |
|
| 79 | % |
|
(1) Calculated with respect to the interest rate at the time the loan was originated or purchased.
NM = Not Meaningful
Our quality control program is intended to monitor and improve the overall quality of loan production generated by our retail channel and wholesale channel and identify and communicate to management existing or potential underwriting and loan packaging problems or areas of concern. The quality control file review examines compliance with our underwriting guidelines and federal and state regulations. This is accomplished by focusing on:
· the accuracy of all credit and legal information;
· a collateral analysis;
· employment and/or income verification; and
· legal document review to ensure that the necessary documents are in place.
MORTGAGE LOAN SALES TO THIRD PARTIES AND SECURITIZATIONS
Aames Financial sells whole loans not retained for the REIT portfolio to third parties on a servicing-released basis, meaning that it sells the loans together with the servicing rights, in order to capture gain on sale income from these loans and to grow our equity capital base on a consolidated basis. Aames Financial does not currently sell loans in off-balance sheet securitizations; however, Aames Financial may in the future sell a portion of its loans in off-balance sheet securitizations depending on market conditions at that time. Aames Financial generally sells these loans within 45 days of funding and services these loans during the period between origination and transfer of servicing to the buyer, which is generally within 90 days after the sale of the loan. Aames Financial generates income primarily from:
· gain on sale income, which includes the premiums received on the sale of the loans;
· net interest income earned on its loans held prior to sale;
· points and fees charged to borrowers, less yield spread premiums paid to wholesale brokers, during the loan origination process; and
· loan servicing income earned on its loans held prior to sale, loans retained in our REIT portfolio, and loans owned by others.
Aames Financial uses the majority of the net proceeds of its loan sales to pay down its warehouse and repurchase facilities in order to increase capacity under these facilities for future fundings of mortgage
21
loans. Proceeds we receive from financings on loans held for investment are also used to pay down our warehouse and repurchase facilities.
During the fiscal years ended June 30, 2003 and prior, Aames Financial also sold loans to third parties in off-balance sheet securitizations. Historically, Aames Financial’s off-balance sheet securitizations were structured as sales for both tax and financial accounting purposes. In these securitizations, Aames Financial would sell a pool of mortgage loans into a trust, which would then issue securities or bonds collateralized by the mortgage loans. Aames Financial might retain or sell the servicing rights to the securitized mortgages, as well as retain an interest in the pool of mortgages, called a residual interest, that entitled it to the remaining interests in the loans, if any, after all of the obligations on the issued securities or bonds had been paid in full. Currently, Aames Financial sells us loans that we use to maintain our REIT portfolio of loans held for investment through the use of on-balance sheet securitizations.
The following table sets forth information regarding our whole loan sales to third parties and off-balance sheet securitizations for the periods indicated (in thousands):
|
| Years Ended |
| Six Months Ended |
| Years Ended |
| ||||||||||||
|
| 2005 |
| 2004 |
| 2004 |
| 2003 |
| 2004 |
| 2003 |
| ||||||
Whole loan sales |
| $ | 2,812,696 |
| $ | 5,924,743 |
| $ | 2,391,671 |
| $ | 2,900,798 |
| $ | 6,433,871 |
| $ | 4,188,678 |
|
Loans pooled and sold in off-balance sheet securitizations |
| — |
| — |
| — |
| — |
| — |
| 314,958 |
| ||||||
Total loans sold |
| $ | 2,812,696 |
| $ | 5,924,743 |
| $ | 2,391,671 |
| $ | 2,900,798 |
| $ | 6,433,871 |
| $ | 4,503,636 |
|
Our whole loan sales decreased by $3.1 billion, or 52.5%, to $2.8 billion during the year ended December 31, 2005 from $5.9 billion during the comparable period a year ago. This decline was due to our retaining a significant portion of our loan production to build a REIT portfolio of loans held for investment.
Our whole loan sales decreased by $509.1 million, or 17.6%, to $2.4 billion during the six months ended December 31, 2004 from $2.9 billion during the comparable six-month period in 2003. This decline was due to our retaining a significant portion of our loan production to build a REIT portfolio of loans held for investment.
During the fiscal years ended June 30, 2003 and prior, Aames Financial maximized opportunities in loan sale transactions by selling its loan production through a combination of off-balance sheet securitizations and whole loan sales, depending on market conditions, taking under consideration relative profitability and cash flows. Aames Financial generally realized higher gain on sale in off-balance sheet securitizations than in whole loan sales for cash. The higher gain on sale in off-balance sheet securitizations is attributable to the excess spread and mortgage servicing rights associated with retaining a residual interest and the servicing on the mortgage loans in the securitization, respectively, net of transactional costs. In an off-balance sheet securitization, we generally overcollateralize the underlying pass-through certificates or bonds by depositing mortgage loans with a principal balance exceeding the principal balance of the pass-through certificates or bonds. The up-front overcollateralization required in securitizations is generally cash flow negative to us in the early years of the securitization. In whole loan sales with servicing released, the gain on sale is generally lower than gains realized in securitizations, but we receive the gain in the form of cash.
Our total loan dispositions grew by $1.9 billion, or 42.9%, to $6.4 billion during the year ended June 30, 2004 from $4.5 billion during the year ended June 30, 2003. During the year ended June 30, 2004, we relied solely on whole loan sales to third parties as our loan disposition strategy due to attractive pricing conditions prevailing in the whole loan markets. During the year ended June 30, 2003, we also relied
22
predominantly on whole loan sales as our loan disposition strategy due primarily to favorable conditions in the whole loan market. In the off-balance sheet securitizations which closed during the year ended June 30, 2003, we sold for cash of $8.7 million the residual interests created in the securitizations through utilization of the Forward Residual Sale Facility (“Residual Facility”). We used the Residual Facility, which expired on March 31, 2003, to include off-balance sheet securitizations in our loan disposition strategy by reducing the negative cash flow aspects of securitization and by providing us with another source of cash through periodic sales of residual interests for cash. The Residual Facility was made available through Capital Z Investments, L.P., a Bermuda partnership (“CZI”), an affiliate of Specialty Finance Partners, our majority stockholder prior to our REIT reorganization.
Changes in the secondary mortgage markets, the current interest rate environment, and the current economic climate could affect our current strategy of selling loans to third parties in whole loan sales. Going forward, our evaluation of loan disposition strategies will include the negative cash flow considerations associated with the upfront overcollateralization required in securitizations compared to the positive cash flow considerations of whole loan sales for cash.
Aames Financial services residential mortgage loans held in its portfolio prior to sale, those held in our REIT portfolio, and to a much lesser extent, for others. Loan servicing remains an integral part of our business operation. We believe that maintaining contact with our borrowers is critical in managing credit risk and in borrower retention. Subprime borrowers are more likely to default on their obligations than conventional borrowers. By servicing our loans, we strive to identify problems with borrowers early and take quick action to address these problems. Borrowers may be more motivated to refinance their mortgage loans either by improving their personal credit or due to a decrease in interest rates. By keeping in close touch with borrowers, we can provide them with information about our loan products to encourage them to refinance with us. Mortgage servicing provides fee income for Aames Financial in the form of normal customer service and processing fees.
We currently have in place a subprime residential mortgage loan servicing team with over 100 servicing employees and a scalable servicing platform. Aames Financial’s servicing platform has received a SQ3 rating from Moody’s and a RPS3- rating from Fitch. Additionally, S&P has included us on their list of approved servicers. We have a servicing portfolio, including loans held for investment and loans held for sale, of approximately $6.1 billion at December 31, 2005.
In addition to our REIT portfolio, our servicing portfolio consists of loans serviced on an interim basis, including loans held for sale and loans sold to others and subserviced on an interim basis, and to a lesser extent, mortgage loans sold to others and subserviced on a long-term basis. Servicing includes collecting and remitting loan payments, accounting for principal and interest, contacting delinquent borrowers, managing borrower defaults, and liquidating foreclosed properties. In order to maximize profitability and cash flow, we do not retain servicing on loans we sell to third parties in whole loan sales for cash.
23
The following table sets forth information regarding our servicing portfolio at the dates indicated (in thousands):
|
| December 31, |
| June 30, |
| ||||||||
|
| 2005 |
| 2004 |
| 2004 |
| 2003 |
| ||||
Mortgage loans serviced: |
|
|
|
|
|
|
|
|
| ||||
Loans held for investment |
| $ | 4,077,448 |
| $ | 1,718,696 |
| $ | — |
| $ | — |
|
Loans serviced on an interim basis |
| 1,926,876 |
| 771,830 |
| 1,897,464 |
| 910,671 |
| ||||
Loans subserviced for others on a long-term basis |
| 92,213 |
| 129,016 |
| 160,371 |
| — |
| ||||
Loans in off-balance sheet securitization trusts |
| — |
| 224,345 |
| 229,308 |
| 741,132 |
| ||||
Total serviced in-house |
| 6,096,537 |
| 2,843,887 |
| 2,287,143 |
| 1,651,803 |
| ||||
Loans held for investment subserviced by others |
| 50,202 |
| — |
| — |
| — |
| ||||
Loans in off-balance sheet securitization trusts subserviced by others |
| — |
| — |
| 53,885 |
| 87,829 |
| ||||
Total servicing portfolio |
| $ | 6,146,739 |
| $ | 2,843,887 |
| $ | 2,341,028 |
| $ | 1,739,632 |
|
Percentage serviced in-house |
| 99.2 | % | 100.0 | % | 97.7 | % | 94.9 | % | ||||
Our total loan servicing portfolio at December 31, 2005 grew by $3.3 billion, to $6.1 billion, from $2.8 billion at December 31, 2004, due primarily to an increase of $2.4 billion in our REIT portfolio of loans held for investment, together with increases of $1.2 billion and $50.2 million in loans serviced on an interim basis and loans held for investment subserviced by others, respectively. Partially offsetting these increases were the elimination of $224.3 million in loans serviced in off-balance sheet securitization trusts due to our calling the seven remaining off-balance sheet securitization trusts in 2005 and a decrease of $36.8 million in loans subserviced for others on a long-term basis. The $1.2 billion increase in loans serviced on an interim basis reflects the increase in loans sold but not yet transferred to new servicers by whole loan buyers, and to a lesser extent, the increase in loans held for sale at December 31, 2005 from December 31, 2004. The $50.2 million increase in loans held for investment subserviced for others resulted from the purchase and subsequent on-balance sheet securitization of loans collateralized by single-family residences from a California-based, commercial bank. The decline in loans subserviced for others on a long-term basis was due to loan portfolio run-off. The servicing of these loans resulted from our sale of loans from older off-balance sheet securitization trusts called during the fiscal year ended June 30, 2004 for which we agreed to continue servicing on a long-term basis.
Our total loan servicing portfolio at December 31, 2004 increased by $502.9 million, to $2.8 billion, from $2.3 billion at June 30, 2004, reflecting a $1.7 billion increase in servicing of loans held for investment due to our conversion to a REIT in November 2004, partially offset by declines in loans serviced on an interim basis, loans subserviced for others on a long-term basis, and loans serviced in off-balance sheet securitization trusts, all of which decreased due to loan portfolio run-off. Our portfolio of mortgage loans serviced on an interim basis decreased by $1.1 billion to $771.8 million at December 31, 2004 from $1.9 billion at June 30, 2004, primarily due to the $1.2 billion transfer to servicing of loans held for investment resulting from the consummation of our on-balance sheet securitization in early December 2004.
On November 30, 2004, we assumed servicing of $45.3 million of mortgage loans in certain off-balance sheet securitization trusts that had previously been subserviced by others. As a result of assuming servicing on these mortgage loans, we remitted $5.9 million to the former subservicer for outstanding servicing advances and, in our role of servicer, re-assumed responsibility to make future servicing advances on loans in these off-balance sheet securitization trusts. At December 31, 2004, the servicing on such loans is included in “loans in off-balance sheet securitization trusts.”
24
Our portfolio of mortgage loans in off-balance sheet securitization trusts serviced in-house declined by $511.8 million, to $229.3 million at June 30, 2004 from $741.1 million at June 30, 2003 due primarily to our call of 10 off-balance sheet securitization trusts, which caused the portfolio of mortgage loans in securitization trusts to decline by $304.1 million and, to a lesser extent, portfolio run-off.
We receive a servicing fee for loans in our securitization trusts and for loans subserviced for others on a long-term basis. The servicing fee is based on a percentage of the unpaid principal balance of each loan serviced. We collect servicing fees out of the borrowers’ monthly payments. In addition, as servicer we generally receive all late fees and assumption charges paid by borrowers on loans that we service directly, as well as other miscellaneous fees for performing various loan servicing functions.
Our agreements with the securitization trusts typically require us, in our role as servicer, to advance interest (but not principal) on delinquent loans to the holders of the senior interests in the related securitization trusts. The agreements also require us to make certain servicing advances (e.g., for property taxes or hazard insurance) unless we determine that those advances would not be recoverable. Each agreement that we have entered into in connection with our securitizations requires either the overcollateralization of the trust or the establishment of a reserve account that may initially be funded by cash deposited by us. If delinquencies or losses exceed certain established limits, as applicable, additional credit-enhancement requirements of the trust are triggered. In a securitization credit-enhanced by a monoline insurance policy, losses in excess of the established overcollateralization amount by holders of the senior interests in the related trust will be paid by the insurer under such policy. To date, there have been no claims on any monoline insurance policy obtained in any of our securitizations.
In a senior/subordinated structure, losses in excess of the overcollateralization amount generally are allocated first to the holders of the subordinated interests and then to the holders of the senior interests of the trust. Realized losses on the loans are paid out of the related credit loss estimates established by us at the time of securitization or paid out of principal and interest payments or overcollateralized amounts as applicable, and if necessary, from the related monoline insurance policy or the subordinated interests. In the case of our senior/subordinated securitization transactions, holders of 51% of the certificates may terminate the servicer upon certain events of default generally relating to certain levels of loss experience, but not delinquency rates. No such events of default have occurred to date in our senior/subordinated securitizations.
In addition, the agreements governing securitizations credit-enhanced by monoline insurance typically provide that we may be terminated as servicer by the monoline insurance company (or by the trustee with the consent of the monoline insurance company) upon certain events of default, including our failure to perform our obligations under the servicing agreement, the rate of over 90-day delinquent loans (including properties acquired by foreclosure and not sold) exceeding specified limits, losses on liquidation of collateral exceeding certain limits, any payment being made by the monoline insurance company under its policy, and events of bankruptcy or insolvency. None of our servicing rights have been terminated.
Collections, Delinquencies and Foreclosures
We send borrowers a monthly billing statement approximately 10 days prior to the monthly payment due date. Although borrowers generally make loan payments within 10 to 15 days after the due date (the “grace period”), if a borrower fails to pay the monthly payment within this grace period, we begin collection efforts by notifying the borrower of the delinquency. In the case of borrowers with certain credit characteristics or with a poor payment history with us, collection efforts begin immediately after the due date. We continue to make contact with the borrower to determine the cause of the delinquency and to obtain a commitment to cure the delinquency at the earliest possible time.
25
As a general matter, if efforts to obtain payment have not been successful, a pre-foreclosure notice will be sent to the borrower immediately after the due date of the next subsequently scheduled installment (five days after the initial due date for loans with certain credit characteristics), providing 30 days’ notice of impending foreclosure action. During the 30-day notice period, collection efforts continue and we evaluate various legal options and remedies to protect the value of the loan, including arranging for extended repayment terms, accepting a deed-in-lieu of foreclosure, entering into a short sale (a sale for less than the outstanding principal amount) or commencing foreclosure proceedings. If no substantial progress has been made in collecting delinquent payments from the borrower, foreclosure proceedings will begin. Generally, we will begin foreclosure proceedings when a loan is 80 to 100 days delinquent, depending upon credit considerations, borrower bankruptcy status and state regulations.
We monitor our servicing and collection practices to insure that they comply with applicable laws and regulations and meet industry standards.
The following table illustrates the mix of credit scores in our servicing portfolio at December 31, 2005 based upon loan characteristics at the time of origination (dollars in thousands):
|
| December 31, 2005 |
| |||||||||||||
|
| Dollar |
| % of |
| Weighted |
| Weighted |
| |||||||
Credit Score Range: |
|
|
|
|
|
|
|
|
|
|
|
|
|
|
| |
Above 700 |
| $ | 427,669 |
|
| 7 | % |
|
| 77.3 | % |
|
| 6.8 | % |
|
661-700 |
| 794,950 |
|
| 13 | % |
|
| 79.8 | % |
|
| 6.9 | % |
| |
621-660 |
| 1,608,279 |
|
| 26 | % |
|
| 80.3 | % |
|
| 7.2 | % |
| |
581-620 |
| 1,591,255 |
|
| 26 | % |
|
| 79.4 | % |
|
| 7.5 | % |
| |
541-580 |
| 904,151 |
|
| 15 | % |
|
| 79.5 | % |
|
| 8.1 | % |
| |
540 and below |
| 653,791 |
|
| 10 | % |
|
| 74.3 | % |
|
| 8.7 | % |
| |
Not available |
| 166,644 |
|
| 3 | % |
|
| 71.1 | % |
|
| 10.3 | % |
| |
Total |
| $ | 6,146,739 |
|
| 100 | % |
|
| 78.8 | % |
|
| 7.6 | % |
|
(1) Calculated with respect to the interest rate at the time the mortgage loan was originated or purchased.
Subprime mortgage loans generally have higher delinquency rates than those prevailing in the mortgage industry. As a subprime mortgage lender, we have historically experienced delinquency rates that are higher than those prevailing in the mortgage industry due to the origination of lower credit grade mortgage loans. Delinquent loans are loans for which more than one payment is due.
Set forth below are our delinquency rates compared to delinquency rates for subprime mortgage loans (seasonally adjusted) and all mortgage loans (seasonally adjusted) according to the National Delinquency Survey of the Mortgage Bankers Association of America as of the dates indicated:
|
| December 31, |
| June 30, |
| ||||||
|
| 2005 |
| 2004 |
| 2004 |
| 2003 |
| ||
Aames Investment |
| 5.4 | % |
| 2.5 | % |
| 3.2 | % | 9.0 | % |
Subprime Mortgage Loans |
| NYA |
|
| 9.9 | % |
| 10.0 | % | 18.0 | % |
All Mortgage Loans |
| NYA |
|
| 4.2 | % |
| 4.4 | % | 5.0 | % |
NYA = Not yet announced
26
The following table sets forth delinquency information relating to our servicing portfolio as of the dates indicated:
|
| December 31, |
| June 30, |
| ||||
|
| 2005 |
| 2004 |
| 2004 |
| 2003 |
|
Percentage of dollar amount of delinquent loans serviced (period end)(1)(2): |
|
|
|
|
|
|
|
|
|
One month |
| 1.9 | % | 0.3 | % | 0.3 | % | 0.7 | % |
Two months |
| 0.9 | % | 0.2 | % | 0.2 | % | 0.3 | % |
Three or more months |
|
|
|
|
|
|
|
|
|
Not foreclosed(3) |
| 2.5 | % | 1.8 | % | 2.4 | % | 7.2 | % |
Foreclosed(4) |
| 0.1 | % | 0.2 | % | 0.3 | % | 0.8 | % |
|
| 5.4 | % | 2.5 | % | 3.2 | % | 9.0 | % |
Percentage of total dollar amount of delinquent loans in: |
|
|
|
|
|
|
|
|
|
Loans held for investment |
| 7.0 | % | 0.2 | % | N/A |
| N/A |
|
Loans serviced on an interim basis |
| 2.0 | % | 1.5 | % | 0.6 | % | 1.3 | % |
Loans subserviced for others on a long-term basis |
| 8.9 | % | 4.8 | % | 2.7 | % | N/A |
|
Loans in off-balance sheet securitization trusts serviced: |
|
|
|
|
|
|
|
|
|
In-house |
| N/A |
| 22.5 | % | 13.0 | % | 12.9 | % |
By others |
| N/A |
| N/A |
| 7.7 | % | 4.5 | % |
(1) Delinquent loans are loans for which more than one payment is due.
(2) The delinquency and foreclosure percentages are calculated on the basis of the total dollar amount of mortgage loans serviced by us including loans serviced on an interim basis.
(3) Represents loans which are in foreclosure but as to which foreclosure proceedings have not concluded.
(4) Represents properties acquired following a foreclosure sale and still serviced by us at period end.
N/A = Not Applicable
The following table summarizes the unpaid principal balance of delinquent loans in the total servicing portfolio as of the dates indicated (in thousands):
|
| December 31, |
| June 30, |
| ||||||||
|
| 2005 |
| 2004 |
| 2004 |
| 2003 |
| ||||
Loans held for investment |
| $ | 287,348 |
| $ | 2,856 |
| N/A |
| N/A |
| ||
Loans serviced on an interim basis |
| 38,437 |
| 11,459 |
| 11,937 |
| 12,151 |
| ||||
Loans subserviced for others on a long-term basis |
| 8,225 |
| 6,229 |
| 4,316 |
| — |
| ||||
Loans in off-balance sheet securitization trusts serviced: |
|
|
|
|
|
|
|
|
| ||||
In-house |
| N/A |
| 50,408 |
| 36,938 |
| 107,089 |
| ||||
By others |
| N/A |
| N/A |
| 21,725 |
| 37,214 |
| ||||
Total |
| $ | 334,010 |
| $ | 70,952 |
| $ | 74,916 |
| $ | 156,454 |
|
N/A = Not Applicable
Delinquent loans, by unpaid principal balance of the total servicing portfolio, increased to $334.0 million at December 31, 2005 from $71.0 million at December 31, 2004 due largely to the $2.4 billion growth in the principal balance of our REIT portfolio of loans held for investment. The delinquency rate grew to 5.4% at December 31, 2005 from 2.5% at December 31, 2004 and was primarily due to an increase in delinquencies in our on-balance sheet REIT portfolio of mortgage loans, which was attributable to seasoning of these loans. We expect the delinquency rate to increase in future periods due to these factors. The delinquency rate at December 31, 2005 was further negatively affected by the occurrence of hurricanes
27
Katrina, Rita, and Wilma during August, September and October of 2005, respectively, and their impact on the Southeastern United States.
Delinquent loans, by unpaid principal balance of the total servicing portfolio, decreased to $71.0 million at December 31, 2004 from $74.9 million at June 30, 2004 despite an increase of $502.9 million in the total servicing portfolio during the six months ended December 31, 2004. The delinquency rate declined to 2.5% at December 31, 2004 from 3.2% at June 30, 2004 due to the fact that the seasoned loans in our off-balance sheet securitization trusts, which contains the majority of delinquent loans, became a smaller part of our total servicing portfolio. The loans in our on-balance sheet REIT portfolio, together with loans serviced on an interim basis, consisting largely of newly originated loans, became the largest part of our servicing portfolio at December 31, 2004. A decline in delinquencies generally reduces our servicing advance obligations.
The following table sets forth foreclosure and loss information relating to our servicing portfolio as of or for the periods indicated (dollars in thousands):
|
| Years Ended |
| Six Months Ended |
| Years Ended |
| ||||||||||||
|
| 2005 |
| 2004 |
| 2004 |
| 2003 |
| 2004 |
| 2003 |
| ||||||
Percentage of dollar amount of loans foreclosed during the period to loans serviced (period end)(1)(2) |
| 0.3 | % | 0.4 | % | 0.1 | % | 0.3 | % | 0.5 | % | 1.3 | % | ||||||
Number of loans foreclosed during the period |
| 147 |
| 152 |
| 68 |
| 91 |
| 180 |
| 417 |
| ||||||
Principal amount of loans foreclosed during the period |
| $ | 16,317 |
| $ | 10,928 |
| $ | 3,585 |
| $ | 5,524 |
| $ | 11,667 |
| $ | 27,703 |
|
Number of loans liquidated during the period |
| 226 |
| 397 |
| 163 |
| 269 |
| 503 |
| 1,033 |
| ||||||
Net losses on liquidations during the period from(3): |
|
|
|
|
|
|
|
|
|
|
|
|
| ||||||
Loans held for investment |
| $ | 161 |
| $ | — |
| $ | — |
| $ | — |
| $ | — |
| $ | — |
|
Loans serviced on an interim basis |
| 5,494 |
| 2,960 |
| 1,224 |
| 1,970 |
| 3,707 |
| 4,558 |
| ||||||
Loans subserviced for others on a long-term basis |
| 38 |
| — |
| — |
| — |
| — |
| — |
| ||||||
Loans in off-balance sheet securitization trusts serviced: |
|
|
|
|
|
|
|
|
|
|
|
|
| ||||||
In-house |
| 2,850 |
| 12,009 |
| 5,554 |
| 5,286 |
| 9,884 |
| 25,991 |
| ||||||
By others |
| — |
| — |
| — |
| 2,924 |
| 4,780 |
| 5,120 |
| ||||||
Total net losses |
| $ | 8,543 |
| $ | 14,969 |
| $ | 6,778 |
| $ | 10,180 |
| $ | 18,371 |
| $ | 35,669 |
|
Percentage of annualized losses to servicing portfolio(1)(2) |
| 0.2 | % | 0.5 | % | 0.4 | % | 1.0 | % | 0.8 | % | 1.6 | % | ||||||
Servicing portfolio at period end |
| $ | 6,147,000 |
| $ | 2,844,000 |
| $ | 2,844,000 |
| $ | 2,334,000 |
| $ | 2,341,000 |
| $ | 1,740,000 |
|
(1) The delinquency and foreclosure percentages are calculated on the basis of the total dollar amount of mortgage loans serviced by us.
(2) The percentages were calculated to reflect the dollar volume of loans foreclosed or annualized losses, as the case may be, to the average dollar amount of mortgage loans serviced by us and any subservicer during the related periods indicated.
(3) Represents losses, net of gains, on properties sold through foreclosure or other default management activities during the periods indicated.
28
Loans serviced by us are secured by mortgages, deeds of trust, security deeds or deeds to collateralize debt, depending upon the prevailing practice in the state in which the property collateralizing the loan is located. Depending on local law, foreclosure is effected by judicial action or nonjudicial sale, and is subject to various notice and filing requirements. In general, the borrower, or any person having a junior encumbrance on the real estate, may cure a monetary default by paying the entire amount in arrears plus other designated costs and expenses incurred in enforcing the obligation during a statutorily prescribed reinstatement period. Generally, state law controls the amount of foreclosure expenses and costs, including attorneys’ fees, which may be recovered by a lender, the minimum time required to foreclose and the reinstatement or redemption rights of the borrower.
Although foreclosure sales are typically public sales, frequently no third-party purchaser bids in excess of the lender’s lien because of the difficulty of determining the exact status of title to the property, the possible deterioration of the property during the foreclosure proceedings, and a requirement that the purchaser pay for the property in cash or by cashier’s check. Thus, we often purchase the property from the trustee or referee through a credit bid in an amount up to the principal amount outstanding under the loan, accrued and unpaid interest, servicing advances and the expenses of foreclosure. Depending upon market conditions and other factors, including the condition of the property, the ultimate proceeds of the sale may not equal our investment in the property.
As alternatives to foreclosure, we may make special repayment arrangements, forestall foreclosure to enable a borrower to sell the mortgaged property, or accept the payoff of less than the full principal balance and accrued interest owing on a mortgage loan. We believe that such loss mitigation efforts reduce overall losses in loan liquidations. However, the loss on such mitigation efforts is realized earlier in the life of the mortgage loan.
During the year ended December 31, 2005, net losses on loan liquidations decreased to $8.5 million from $15.0 million during the year ended December 31, 2004. A majority of the foreclosures handled occurred in connection with delinquent mortgage loans in former off-balance sheet securitization trusts serviced by us. Of the $8.5 million of net losses on loan liquidations during the year ended December 31, 2005, $5.5 million and $2.9 million related to mortgage loans held for sale and mortgage loans in the off-balance sheet securitization trusts, respectively. We expect net losses on loan liquidations to increase in future periods once our on-balance sheet REIT portfolio of mortgage loans becomes more seasoned and fewer new loans are added to the REIT portfolio. Moreover, we expect net losses on loan liquidations in the Southeastern United States to increase in future periods due to the recent hurricanes.
Net losses on loan liquidations decreased by $17.3 million to $18.4 million during the year ended June 30, 2004 from $35.7 million during the year ended June 30, 2003, primarily due to the decrease in number of liquidated loans which corresponded to the decline in the size of our portfolio of mortgage loans in off-balance sheet securitization trusts. A majority of the foreclosures handled occurred in connection with delinquent mortgage loans in off-balance sheet securitization trusts serviced by us. Of the $18.4 million of net losses on loan liquidations during the year ended June 30, 2004, $14.7 million and $3.7 million related to mortgage loans in the off-balance sheet securitization trusts and to mortgage loans held for sale, respectively. Of the $35.7 million of net losses on loan liquidations during the year ended June 30, 2003, $31.1 million and $4.6 million related to mortgage loans in the off-balance sheet securitization trusts and to mortgage loans held for sale, respectively.
Because foreclosures and losses typically occur months or years after a loan is originated, data relating to delinquencies, foreclosures and losses as a percentage of the current portfolio can understate the risk of future delinquencies, losses or foreclosures.
29
We face intense competition in the business of originating, purchasing and selling mortgage loans. Our competitors in the industry include consumer finance companies, mortgage banking companies, commercial banks, credit unions, thrift institutions, credit card issuers, insurance companies and mortgage REITs. Many of these competitors are substantially larger and have considerably greater financial, technical and marketing resources than we do. Competition among industry participants takes many forms, including convenience in obtaining a loan, customer service, marketing and distribution channels, amount and term of the loan, loan origination fees and interest rates. Additionally, competition may lower the rates we can charge borrowers and increase the price we pay to purchase loans, which would potentially lower gain on future sales. If any of our competitors significantly expand their activities into our market, our operations could be materially adversely affected. Fluctuations in interest rates and general economic conditions may also affect competition. During periods of rising rates, competitors that have locked in lower rates to potential borrowers may have a competitive advantage. During periods of declining rates, competitors may solicit customers with loans in our servicing portfolio to refinance their loans.
Our business is regulated by federal, state and local government authorities and is subject to extensive federal, state and local laws, rules and regulations. We are also subject to judicial and administrative decisions that impose requirements and restrictions on our business. At the federal level, these laws and regulations include the:
· Equal Credit Opportunity Act and Regulation B;
· Federal Truth and Lending Act and Regulation Z;
· Home Ownership and Equity Protection Act;
· Real Estate Settlement Procedures Act and Regulation X;
· Fair Credit Reporting Act;
· Fair Debt Collection Practices Act;
· Home Mortgage Disclosure Act;
· Fair Housing Act;
· Telephone Consumer Protection Act;
· Gramm-Leach-Bliley Act;
· Sarbanes-Oxley Act of 2002;
· Fair and Accurate Credit Transactions Act; and
· USA PATRIOT Act.
These laws, rules and regulations, among other things:
· impose licensing obligations and financial requirements on us;
· limit the interest rates, finance charges, and other fees that we may charge;
· prohibit discrimination;
· impose underwriting requirements;
· mandate disclosures and notices to consumers;
· mandate the collection and reporting of statistical data regarding our customers;
· regulate our marketing techniques and practices;
30
· require us to safeguard non-public information about our customers;
· regulate our collection practices;
· require us to prevent money-laundering or doing business with suspected terrorists; and
· impose corporate governance, internal control and financial reporting obligations and standards.
Our failure to comply with these laws can lead to:
· civil and criminal liability;
· loss of mortgage lending licenses or exemptions;
· demands for indemnification or loan repurchases from buyers of our loans;
· class action lawsuits; and
· administrative enforcement actions.
COMPLIANCE, QUALITY CONTROL AND QUALITY ASSURANCE
We regularly monitor the laws, rules and regulations that apply to our business and analyze any changes to them. We integrate many legal and regulatory requirements into our automated loan origination system to reduce the potential of inadvertent non-compliance due to human error and to prevent fraud. We also maintain policies and procedures, and summaries and checklists to help our origination personnel comply with these laws.
We maintain a variety of pre-funding quality control procedures designed to detect compliance errors prior to funding. In addition, we subject a statistical sampling of our loans to post-funding quality assurance reviews and analyses. We track the results of the quality assurance reviews and report them back to the responsible origination units. Our loans and practices are reviewed regularly in connection with the due diligence that our loan buyers and lenders perform. Our state regulators also review our practices and loan files regularly and report their results back to us.
Federal and state legislators have adopted a variety of new or expanded regulations, particularly in the areas of privacy and consumer protection. These regulations are summarized below.
The Home Ownership and Equity Protection Act of 1994 (“HOEPA”) identifies a category of mortgage loans and subjects them to more stringent restrictions and disclosure requirements. In addition, liability for violations of applicable law for loans covered by HOEPA extends not only to the originator, but also to the purchaser of the loans. HOEPA generally covers loans with either (i) total points and fees upon origination in excess of the greater of eight percent of the loan amount or $499 (an annually adjusted dollar amount), or (ii) an annual percentage rate (APR) of more than eight percentage points higher than United States Treasury securities of comparable maturity on first mortgage loans, and ten percentage points above Treasuries of comparable maturity for junior mortgage loans.
We do not originate loans covered by HOEPA because of the higher legal risks as well as the potential negative perception of originating loans that are considered to be “high cost” under federal law.
Numerous state and local laws and regulations also place limitations on interest rates and charges, identify certain categories of mortgage loans as “high cost” and subject them to more stringent restrictions and disclosure requirements. In addition, some of these laws impose liability on assignees of mortgage loans such as loan buyers, lenders and securitization trusts. Such provisions may deter loan buyers from
31
purchasing loans covered by the applicable law. We have eliminated making loans that are deemed high cost under these laws, and remain able to finance or sell those loans we make.
There can be no assurance that other similar laws, rules or regulations, won’t be adopted in the future. Adoption of these laws and regulations could have a material adverse impact on our business by restricting our ability to charge rates and fees adequate to compensate us for the risk associated with certain loans and by substantially increasing the costs of compliance with a variety of inconsistent federal, state and local rules. Adoption of these laws could also have a material adverse effect on our loan origination volume, especially if our lenders and secondary market buyers elect not to finance or purchase loans covered by the new laws.
Efforts to Avoid Abusive Lending Practices
In an effort to prevent the origination of loans containing unfair terms or involving predatory practices, we have adopted many policies and procedures, including the following:
Product Policies
· We do not make “high cost loans” as defined by HOEPA or any state legislation or regulations.
· We do not make loans containing single premium credit life, disability or accident insurance.
· We do not make loans containing negative amortization, mandatory arbitration clauses or interest rate increases triggered by borrower default.
· We offer loans with and without prepayment charges. When a borrower opts for a loan with a prepayment charge, the borrower benefits from a lower interest rate or pays lower upfront fees.
· Our prepayment charges do not extend beyond three years from the origination date.
· We do not originate loans that pay off zero interest rate mortgages provided by charitable organizations or the government.
Loan Processing Policies
· We only approve loan applications that evidence a borrower’s ability to repay the loan.
· We consider whether the loan terms are in the borrower’s best interests.
· We price loans commensurate with risk.
· We use an electronic credit grading system to help ensure consistency.
· We do not ask appraisers to report a predetermined value or withhold disclosure of adverse features. Appraisers are paid for their work regardless of whether or not the loans are closed.
Customer Interaction and Education
· We market our loans with a view to encouraging a wide range of applicants strongly representative of racial, ethnic and economic diversity of the markets we serve throughout the nation.
· We provide a brochure to all loan applicants to educate them on the loan origination process, explain basic loan terms, help them obtain a loan that suits their needs and advise them on how to find a HUD-approved loan counselor.
32
· We distribute our fair lending and consumer “best practices” guidelines to all newly-hired employees and brokers and require them to acknowledge that they are knowledgeable about and will abide by fair lending laws.
· When appropriate, we also offer loss mitigation counseling to borrowers in default and provide opportunities to enter into mutually acceptable reasonable repayment plans.
· We report borrower monthly payment performance to major credit repositories.
Evaluation and Compliance
· We subject a statistical sampling of our loans to a rigorous quality assurance of borrower qualification and validity of information.
· We have an internal audit department that reviews our internal controls and operations to help ensure compliance with accepted federal and state lending regulations and practices.
· We adhere to high origination standards in order to sell our loan products in the secondary mortgage market.
· We treat all customer information as confidential and consider it to be nonpublic information. We maintain systems and procedures to ensure that access to nonpublic consumer information is granted only to legitimate and valid users.
· We believe that our commitment to responsible lending is good business.
· We put our commitment into action and will continue to look for ways to promote highly ethical standards throughout our industry.
As of December 31, 2005, we had licenses or were exempt from the licensing requirements by the relevant state banking or consumer credit agencies to originate mortgages in 47 states and the District of Columbia.
The federal Gramm-Leach-Bliley Act obligates us to safeguard the information we maintain on our borrowers. California has passed legislation known as the California Financial Information Privacy Act and the California On-Line Privacy Protection Act. Both pieces of legislation were effective July 1, 2004, and impose additional notification obligations on us that are not pre-empted by existing federal law. Similar regulations have been adopted by numerous states that affect our obligations to safeguard information and notify consumers of breaches of such safeguards. Such regulations increase our costs of compliance.
The Fair Credit Reporting Act provides federal preemption for lenders to share information with affiliates and certain third parties and to provide pre-approved offers of credit to consumers. Congress also amended the Fair Credit Reporting Act to place further restrictions on the use of information shared between affiliates, to provide new disclosures to consumers when risk based pricing is used in the credit decision, and to help protect consumers from identity theft. All of these new provisions impose additional regulatory and compliance costs on us and reduce the effectiveness of our marketing programs.
33
In 2002, the Federal Reserve Board adopted changes to Regulation C promulgated under the Home Mortgage Disclosure Act. Among other things, the new regulations require lenders to report pricing data on loans with annual percentage rates that exceed the yield on treasury bills with comparable maturities by 3%. The expanded reporting took effect in 2004 for reports filed in 2005. We anticipate that a majority of our loans will be subject to the expanded reporting requirements.
The expanded reporting does not provide for additional loan information such as credit risk, debt-to-income ratio, loan-to-value ratio, documentation level or other salient loan features. As a result, we are concerned that the reported information may lead to increased litigation as the information could be misinterpreted by third parties.
Telephone Consumer Protection Act and Telemarketing Consumer Fraud and Abuse Prevention Act
The Federal Communications Commission and the Federal Trade Commission adopted “do-not-call” registry requirements, which, in part, mandate that we maintain and regularly update lists of consumers who have chosen not to be called. These requirements also mandate that we not call consumers who have chosen to be on the list. Several states have also adopted similar laws, with which we also comply.
At December 31, 2005, we employed 2,240 persons. We believe we have satisfactory relations with our employees.
We have discussed the most significant factors that may adversely affect our business and operations in “Item 7A. Quantitative and Qualitative Disclosures About Market Risks Related To Our Business.”
Item 1B. Unresolved Staff Comments
None.
Our executive and administrative offices are located at 350 S. Grand Avenue, Los Angeles, California 90071, and consist of approximately 152,000 square feet, of which approximately 44,800 square feet are sublet. The lease and the sublease on these premises extend through March 2012. The monthly rental payment, including common area fees and charges, is currently $0.4 million per month, or approximately $4.8 million annually. Monthly sublease payments received from the sublessee, including common area fees and charges received from the sublessee, are currently $0.1 million per month, or approximately $1.2 million annually. We also lease approximately 39,000 square feet of office space at our former headquarters location at 3731 Wilshire Boulevard, Los Angeles, California, approximately 37,000 square feet of which is sublet through March 2006. As of April 1, 2006, approximately 18,000 square feet of office space will be sublet through December 2008. The master lease expires in December 2008.
We also have administrative offices located at 3347 and 3351 Michelson Drive, Irvine, California 92612, which consist of approximately 93,000 square feet under a lease that extends through November 30, 2008. The monthly rental payment, including common area fees and charges, is currently $0.2 million per month, or approximately $2.4 million annually.
We also lease space for retail branch and wholesale regional operations centers. These facilities aggregate approximately 403,000 square feet and are leased under terms that vary as to duration. In general, the leases expire between 2006 and 2012, and provide for rent escalations tied to either increases
34
in the lessors’ operating expenses or fluctuations in the consumer price index in the relevant geographical areas.
In July 2005, we were served with a putative class action complaint entitled Webb v. Aames Investment Corporation, et. al. brought in the United States District Court, Central District of California. In December 2005, we were served with a putative class action complaint entitled Cooper v. Aames Investment Corporation, et. al. brought in the United States District Court, Eastern District of Wisconsin. These complaints allege violations of the Fair Credit Reporting Act (“FCRA”) in connection with prescreened offers of credit, which we made to plaintiffs. Webb also alleges that our direct mail pieces failed to comply with the requirements of FCRA that the required notice be clear and conspicuous. The plaintiffs seek to recover on behalf of themselves and others similarly situated compensatory and punitive damages and attorneys’ fees. We filed a motion to dismiss the clear and conspicuous claims in connection with Webb and while we believe that a motion with leave to amend will be granted, an order has not yet been entered. We also filed a motion to transfer Cooper to the Central District of California where Webb is pending. There have been no rulings on the merits of the plaintiffs’ claims or the claims of the putative class in either matter, and no class has been certified. We intend to vigorously defend these matters but if a class is certified and prevails on the merits, the potential liability could have a material adverse affect on our business. The outcome of these cases and the amount of liability, if any, cannot be determined at this time.
In September 2004, we received a Civil Investigative Demand and Notice to Proceed from the Office of the Attorney General of Iowa, that, although not alleging any wrongdoing, sought documents and data relating to our business and lending practices in Iowa. We have cooperated and intend to continue to cooperate fully with the Office of the Attorney General of Iowa in this investigation. Because the investigation is at an early stage, we cannot predict the outcome of the investigation and its effect, if any, on our business in Iowa, which approximated 0.02% and 0.24% of total mortgage loan production during the years ended December 31, 2005 and 2004, respectively.
In April 2004, we received a civil investigative demand from the Federal Trade Commission, or the FTC, that, although not alleging any wrongdoing, sought documents and data relating to our business and lending practices. The demand was issued pursuant to an April 8, 2004 resolution of the FTC authorizing non-public investigations of various unnamed subprime lenders and loan brokers to determine whether there have been violations of certain consumer protection laws. We cooperated and intend to continue to cooperate fully with the FTC in this investigation. Because the investigation is at an early stage, we cannot predict the outcome of the investigation and its effect, if any, on our business.
In the ordinary course of business, we are defendants in or parties to a variety of legal actions. Certain of such actions involve claims relating to our loan origination and collection efforts, alleged violations of employment laws, unfair trade practices, and other federal and state laws. In our opinion, the resolution of any of these pending incidental matters is not expected to have a material adverse effect on our consolidated financial position or results of operations.
Item 4. Submission of Matters to Vote of Security Holders
None.
35
Item 5. Market for Registrant’s Common Equity, Related Stockholder Matters and Issuer Purchases of Equity Securities
Since our initial public offering on November 5, 2004, our common stock has been quoted on the New York Stock Exchange under the symbol “AIC”.
The following table sets forth the range of high and low closing sales prices on the New York Stock Exchange for our common stock and cash dividends per share declared during the periods indicated:
|
| Stock Price |
| Cash |
| |||||||
|
| High |
| Low |
| Declared(1) |
| |||||
Year Ended December 31, 2005 |
|
|
|
|
|
|
|
|
| |||
Quarter Ended: |
|
|
|
|
|
|
|
|
| |||
December 31, 2005(2) |
| $ | 6.75 |
| $ | 5.65 |
|
| $ | 0.69 |
|
|
September 30, 2005 |
| 10.20 |
| 6.02 |
|
| 0.34 |
|
| |||
June 30, 2005 |
| 9.90 |
| 7.75 |
|
| 0.27 |
|
| |||
March 31, 2005 |
| 11.30 |
| 8.01 |
|
| N/A |
|
| |||
Year Ended December 31, 2004 |
|
|
|
|
|
|
|
|
| |||
Quarter Ended: |
|
|
|
|
|
|
|
|
| |||
December 31, 2004 (from November 5, 2004) |
| $ | 11.95 |
| $ | 8.50 |
|
| $ | 0.06 |
|
|
(1) Represents cash dividends per share declared during the quarter.
(2) Includes dividends of $0.35 and $0.34 announced on October 18, 2005 and December 20, 2005, respectively.
N/A = Not Applicable
As of March 24, 2006, we had approximately 232 stockholders of record, which amount does not include stockholders whose shares are held in the name of their broker.
Our dividend policy during the six months ended December 31, 2004 and the year ended December 31, 2005, the period during which we elected to qualify as REIT, was to distribute all or substantially all of our REIT taxable earnings through quarterly cash dividends. Although the timing of the dividend distributions was at the discretion of the Board, we intended to have all quarterly dividends, including the fourth quarter dividend, declared and distributed to reflect a distribution of our taxable income in the relevant calendar year for tax purposes. On March 15, 2006, Aames Investment announced that it intends to alter its structure so that it would no longer be required to pay out at least 90% of its taxable earnings to its stockholders as dividends, but rather, would retain its capital for internal growth. As a result, all future dividend distributions will be at the discretion of our Board of Directors.
36
Item 6. Selected Financial Data
The selected consolidated financial data set forth below have been derived from our audited consolidated financial statements. The selected consolidated financial data should be read in conjunction with the consolidated financial statements and notes thereto and other financial information included herein (in thousands, except per share data).
|
| December 31, |
| June 30, |
| ||||||||||||||
|
| 2005 |
| 2004 |
| 2004 |
| 2003 |
| 2002 |
| 2001 |
| ||||||
Balance Sheet Data: |
|
|
|
|
|
|
|
|
|
|
|
|
| ||||||
Cash and cash equivalents |
| $ | 123,172 |
| $ | 37,780 |
| $ | 22,867 |
| $ | 23,860 |
| $ | 17,391 |
| $ | 27,583 |
|
Loans held for investment, net |
| 4,085,536 |
| 1,725,046 |
| — |
| — |
| — |
| — |
| ||||||
Loans held for sale, at lower of cost or market |
| 951,177 |
| 484,963 |
| 1,012,165 |
| 406,877 |
| 462,068 |
| 417,164 |
| ||||||
Derivative financial instruments, at estimated fair value |
| 58,147 |
| 31,947 |
| 6,316 |
| — |
| — |
| — |
| ||||||
Residual interests, at estimated fair value |
| — |
| 39,082 |
| 44,120 |
| 129,232 |
| 197,297 |
| 237,838 |
| ||||||
Other |
| 109,603 |
| 82,057 |
| 65,704 |
| 67,919 |
| 89,842 |
| 102,812 |
| ||||||
Total assets |
| $ | 5,327,635 |
| $ | 2,400,875 |
| $ | 1,151,172 |
| $ | 627,888 |
| $ | 766,598 |
| $ | 785,397 |
|
Financing on loans held for investment |
| $ | 3,623,188 |
| $ | 1,157,470 |
| $ | — |
| $ | — |
| $ | — |
| $ | — |
|
Revolving warehouse and repurchase facilities |
| 1,341,683 |
| 809,213 |
| 886,433 |
| 343,675 |
| 383,119 |
| 393,301 |
| ||||||
Borrowings: |
|
|
|
|
|
|
|
|
|
|
|
|
| ||||||
Short-term collateralized financing facility |
| 16,487 |
| — |
| — |
| — |
| — |
| — |
| ||||||
Financing Facility due March 2005 |
| — |
| 7,680 |
| 13,887 |
| 74,116 |
| — |
| — |
| ||||||
5.5% Convertible Subordinated Debentures due March 2006 |
| — |
| — |
| 64,396 |
| 64,396 |
| 113,970 |
| 113,970 |
| ||||||
9.125% Senior Notes due November 2003 |
| — |
| — |
| — |
| — |
| 150,000 |
| 150,000 |
| ||||||
10.5% Senior Notes due February 2002 |
| — |
| — |
| — |
| — |
| — |
| 5,750 |
| ||||||
Total borrowings |
| 16,487 |
| 7,680 |
| 78,283 |
| 138,512 |
| 263,970 |
| 269,720 |
| ||||||
Other |
| 76,773 |
| 68,886 |
| 55,845 |
| 92,727 |
| 82,324 |
| 76,491 |
| ||||||
Total liabilities |
| $ | 5,058,131 |
| $ | 2,043,249 |
| $ | 1,020,561 |
| $ | 574,914 |
| $ | 729,413 |
| $ | 739,512 |
|
Preferred stock, Series B |
| $ | — |
| $ | — |
| $ | 27 |
| $ | 27 |
| $ | 27 |
| $ | 27 |
|
Preferred stock, Series C |
| — |
| — |
| 20 |
| 20 |
| 20 |
| 20 |
| ||||||
Preferred stock, Series D |
| — |
| — |
| 60 |
| 60 |
| 60 |
| 59 |
| ||||||
Common stock |
| 618 |
| 614 |
| 7 |
| 7 |
| 6 |
| 6 |
| ||||||
Additional paid-in capital |
| 656,041 |
| 655,437 |
| 418,095 |
| 418,118 |
| 418,027 |
| 417,486 |
| ||||||
Retained deficit |
| (387,155 | ) | (298,425 | ) | (287,598 | ) | (365,258 | ) | (380,955 | ) | (371,713 | ) | ||||||
Total stockholders’ equity |
| $ | 269,504 |
| $ | 357,626 |
| $ | 130,611 |
| $ | 52,974 |
| $ | 37,185 |
| $ | 45,885 |
|
37
|
|
|
|
|
| Six Months |
|
|
|
|
|
|
|
|
| |||||||||||
|
| Years Ended |
| Ended |
| Years Ended |
| |||||||||||||||||||
|
| December 31, |
| December 31, |
| June 30, |
| |||||||||||||||||||
|
| 2005 |
| 2004 |
| 2004 |
| 2004 |
| 2003 |
| 2002 |
| 2001 |
| |||||||||||
|
|
|
| (unaudited) |
|
|
|
|
|
|
|
|
|
|
| |||||||||||
Statement of Operations Data: |
|
|
|
|
|
|
|
|
|
|
|
|
|
|
|
|
|
|
| |||||||
Interest income |
| $ | 340,515 |
|
| $ | 93,181 |
|
|
| $ | 56,103 |
|
| $ | 69,446 |
| $ | 69,186 |
| $ | 83,161 |
| $ | 86,477 |
|
Interest expense |
| 170,942 |
|
| 32,396 |
|
|
| 18,490 |
|
| 26,227 |
| 35,119 |
| 41,895 |
| 57,180 |
| |||||||
Net interest income |
| 169,573 |
|
| 60,785 |
|
|
| 37,613 |
|
| 43,219 |
| 34,067 |
| 41,266 |
| 29,297 |
| |||||||
Provision for losses on loans held for investment |
| 40,294 |
|
| 1,900 |
|
|
| 1,900 |
|
| — |
| — |
| — |
| — |
| |||||||
Net interest income after provision for loan losses |
| 129,279 |
|
| 58,885 |
|
|
| 35,713 |
|
| 43,219 |
| 34,067 |
| 41,266 |
| 29,297 |
| |||||||
Noninterest income: |
|
|
|
|
|
|
|
|
|
|
|
|
|
|
|
|
|
|
| |||||||
Gain on sale of loans |
| 30,277 |
|
| 177,607 |
|
|
| 59,960 |
|
| 261,801 |
| 174,710 |
| 139,167 |
| 120,865 |
| |||||||
Loan servicing |
| 6,330 |
|
| 6,634 |
|
|
| 3,070 |
|
| 7,829 |
| 8,896 |
| 12,462 |
| 14,989 |
| |||||||
Total noninterest income |
| 36,607 |
|
| 184,241 |
|
|
| 63,030 |
|
| 269,630 |
| 183,606 |
| 151,629 |
| 135,854 |
| |||||||
Net interest income after provision for loan losses and noninterest income |
| 165,886 |
|
| 243,126 |
|
|
| 98,743 |
|
| 312,849 |
| 217,673 |
| 192,895 |
| 165,151 |
| |||||||
Noninterest expense: |
|
|
|
|
|
|
|
|
|
|
|
|
|
|
|
|
|
|
| |||||||
Personnel |
| 91,217 |
|
| 120,608 |
|
|
| 62,660 |
|
| 160,169 |
| 117,547 |
| 102,451 |
| 98,404 |
| |||||||
Production |
| 35,351 |
|
| 36,504 |
|
|
| 17,165 |
|
| 35,113 |
| 25,849 |
| 21,322 |
| 19,034 |
| |||||||
General and administrative |
| 44,707 |
|
| 49,162 |
|
|
| 27,238 |
|
| 44,527 |
| 43,738 |
| 34,489 |
| 42,748 |
| |||||||
Write-down of residual interests |
| — |
|
| — |
|
|
| — |
|
| — |
| 34,923 |
| 27,000 |
| 33,600 |
| |||||||
Total noninterest expense |
| 171,275 |
|
| 206,274 |
|
|
| 107,063 |
|
| 239,809 |
| 222,057 |
| 185,262 |
| 193,786 |
| |||||||
Nonoperating income: |
|
|
|
|
|
|
|
|
|
|
|
|
|
|
|
|
|
|
| |||||||
Debt extinguishment income—Capital Z |
| — |
|
| — |
|
|
| — |
|
| — |
| 24,970 |
| — |
| — |
| |||||||
Debt extinguishment income—others |
| — |
|
| — |
|
|
| — |
|
| — |
| 6,741 |
| — |
| — |
| |||||||
Total nonoperating income |
| — |
|
| — |
|
|
| — |
|
| — |
| 31,711 |
| — |
| — |
| |||||||
Income (loss) before income taxes |
| (5,389 | ) |
| 36,852 |
|
|
| (8,320 | ) |
| 73,040 |
| 27,327 |
| 7,633 |
| (28,635 | ) | |||||||
Income tax provision (benefit) |
| 842 |
|
| (4,933 |
|
|
| (5,235 | ) |
| (17,674 | ) | (1,839 | ) | 3,087 |
| 1,889 |
| |||||||
Net income (loss) |
| $ | (6,231 |
|
| $ | 41,785 |
|
|
| $ | (3,085 | ) |
| $ | 90,714 |
| $ | 29,166 |
| $ | 4,546 |
| $ | (30,524 | ) |
38
|
| Years Ended |
| Six Months |
| Years Ended |
| |||||||||||||||||
|
| 2005 |
| 2004 |
| 2004 |
| 2004 |
| 2003 |
| 2002 |
| 2001 |
| |||||||||
|
|
|
| (unaudited) |
|
|
|
|
|
|
|
|
|
|
| |||||||||
Statement of Operations Data: |
|
|
|
|
|
|
|
|
|
|
|
|
|
|
|
|
| |||||||
Net income (loss) to common stockholders: |
|
|
|
|
|
|
|
|
|
|
|
|
|
|
|
|
| |||||||
Basic |
| $ | (6,231 | ) | $ | 32,085 |
|
| $ | (3,085 | ) |
| $ | 77,660 |
| $ | 15,697 |
| $ | (9,242 | ) | $ | (44,445 | ) |
Diluted |
| $ | (6,231 | ) | $ | 41,785 |
|
| $ | (3,085 | ) |
| $ | 92,804 |
| $ | 29,166 |
| $ | (9,242 | ) | $ | (44,445 | ) |
Net income (loss) per common share: |
|
|
|
|
|
|
|
|
|
|
|
|
|
|
|
|
| |||||||
Basic |
| $ | (0.10 | ) | $ | 0.52 |
|
| $ | (0.05 | ) |
| $ | 11.02 |
| $ | 2.39 |
| $ | (1.45 | ) | $ | (7.11 | ) |
Diluted |
| $ | (0.10 | ) | $ | 0.68 |
|
| $ | (0.05 | ) |
| $ | 0.89 |
| $ | 0.30 |
| $ | (1.45 | ) | $ | (7.11 | ) |
Dividends per common share—declared |
| $ | 1.30 |
| $ | 0.06 |
|
| $ | 0.06 |
|
| — |
| — |
| — |
| — |
| ||||
Weighted average number of common shares outstanding: |
|
|
|
|
|
|
|
|
|
|
|
|
|
|
|
|
| |||||||
Basic |
| 62,517 |
| 61,316 |
|
| 61,322 |
|
| 7,049 |
| 6,558 |
| 6,394 |
| 6,251 |
| |||||||
Diluted |
| 62,517 |
| 61,348 |
|
| 61,322 |
|
| 104,364 |
| 96,053 |
| 6,394 |
| 9,251 |
| |||||||
Cash Flow Data: |
|
|
|
|
|
|
|
|
|
|
|
|
|
|
|
|
| |||||||
Net cash provided by (used in) operating activities |
| $ | (450,756 | ) | $ | 255,422 |
|
| $ | 511,246 |
|
| $ | (415,458 | ) | $ | 141,692 |
| $ | 9,390 |
| $ | (5,936 | ) |
Net cash used in investing activities |
| (2,406,124 | ) | (1,730,704 | ) |
| (1,728,958 | ) |
| (3,905 | ) | (2,124 | ) | (4,192 | ) | (5,048 | ) | |||||||
Net cash provided by (used in) financing activities |
| 2,942,272 |
| 1,501,451 |
|
| 1,232,625 |
|
| 418,370 |
| (133,099 | ) | (15,390 | ) | 28,388 |
| |||||||
Net increase (decrease) in cash and cash equivalents |
| $ | 85,392 |
| $ | 26,169 |
|
| $ | 14,913 |
|
| $ | (993 | ) | $ | 6,469 |
| $ | (10,192 | ) | $ | 17,404 |
|
39
|
| Years Ended |
| Six Months |
| Years Ended |
| |||||||||||||||||||
|
| 2005 |
| 2004 |
| 2004 |
| 2004 |
| 2003 |
| 2002 |
| 2001 |
| |||||||||||
|
|
|
| (unaudited) |
|
|
|
|
|
|
|
|
|
|
| |||||||||||
Loan Activity: |
|
|
|
|
|
|
|
|
|
|
|
|
|
|
|
|
|
|
| |||||||
Loans originated or purchased: |
|
|
|
|
|
|
|
|
|
|
|
|
|
|
|
|
|
|
| |||||||
Retail |
| $ | 2,746,321 |
|
| $ | 2,421,525 |
|
|
| $ | 1,189,707 |
|
| $ | 2,400,493 |
| $ | 1,795,447 |
| $ | 1,609,875 |
| $ | 1,180,551 |
|
Wholesale(1) |
| 4,008,207 |
|
| 4,998,120 |
|
|
| 2,397,841 |
|
| 4,588,501 |
| 2,650,733 |
| 1,632,634 |
| 1,191,079 |
| |||||||
Total |
| $ | 6,754,528 |
|
| $ | 7,419,645 |
|
|
| $ | 3,587,548 |
|
| $ | 6,988,994 |
| $ | 4,446,180 |
| $ | 3,242,509 |
| $ | 2,371,630 |
|
Loans originated by interest rate type: |
|
|
|
|
|
|
|
|
|
|
|
|
|
|
|
|
|
|
| |||||||
Retail: |
|
|
|
|
|
|
|
|
|
|
|
|
|
|
|
|
|
|
| |||||||
Fixed rate |
| $ | 697,013 |
|
| $ | 678,858 |
|
|
| $ | 343,291 |
|
| $ | 832,425 |
| $ | 1,186,373 |
| $ | 996,191 |
| $ | 837,451 |
|
Hybrid/adjustable rate |
| 2,049,308 |
|
| 1,742,667 |
|
|
| 846,416 |
|
| 1,568,068 |
| 609,074 |
| 613,684 |
| 343,100 |
| |||||||
Total |
| $ | 2,746,321 |
|
| $ | 2,421,525 |
|
|
| $ | 1,189,707 |
|
| $ | 2,400,493 |
| $ | 1,795,447 |
| $ | 1,609,875 |
| $ | 1,180,551 |
|
Wholesale: |
|
|
|
|
|
|
|
|
|
|
|
|
|
|
|
|
|
|
| |||||||
Fixed rate |
| $ | 861,204 |
|
| $ | 1,083,941 |
|
|
| $ | 465,061 |
|
| $ | 1,130,761 |
| $ | 728,227 |
| $ | 226,585 |
| $ | 149,575 |
|
Hybrid/adjustable rate |
| 3,147,003 |
|
| 3,914,179 |
|
|
| 1,932,780 |
|
| 3,457,740 |
| 1,922,506 |
| 1,406,049 |
| 1,041,504 |
| |||||||
Total |
| $ | 4,008,207 |
|
| $ | 4,998,120 |
|
|
| $ | 2,397,841 |
|
| $ | 4,588,501 |
| $ | 2,650,733 |
| $ | 1,632,634 |
| $ | 1,191,079 |
|
Total: |
|
|
|
|
|
|
|
|
|
|
|
|
|
|
|
|
|
|
| |||||||
Fixed rate |
| $ | 1,558,217 |
|
| $ | 1,762,799 |
|
|
| $ | 808,352 |
|
| $ | 1,963,186 |
| $ | 1,914,600 |
| $ | 1,222,776 |
| $ | 987,026 |
|
Hybrid/adjustable rate |
| 5,196,311 |
|
| 5,656,846 |
|
|
| 2,779,196 |
|
| 5,025,808 |
| 2,531,580 |
| 2,019,733 |
| 1,384,604 |
| |||||||
Total |
| $ | 6,754,528 |
|
| $ | 7,419,645 |
|
|
| $ | 3,587,548 |
|
| $ | 6,988,994 |
| $ | 4,446,180 |
| $ | 3,242,509 |
| $ | 2,371,630 |
|
Loan originations by purpose: |
|
|
|
|
|
|
|
|
|
|
|
|
|
|
|
|
|
|
| |||||||
Cash-out refinance |
| 57.8 | % |
| 59.6 | % |
|
| 58.7 | % |
| 60.4 | % | 63.5 | % | 61.7 | % | 58.8 | % | |||||||
Purchase money |
| 38.8 | % |
| 36.0 | % |
|
| 37.7 | % |
| 33.3 | % | 23.5 | % | 18.1 | % | 23.9 | % | |||||||
Rate/term refinance |
| 3.4 | % |
| 4.4 | % |
|
| 3.6 | % |
| 6.3 | % | 13.0 | % | 20.2 | % | 17.3 | % | |||||||
Total |
| 100.0 | % |
| 100.0 | % |
|
| 100.0 | % |
| 100.0 | % | 100.0 | % | 100.0 | % | 100.0 | % | |||||||
Loan dispositions: |
|
|
|
|
|
|
|
|
|
|
|
|
|
|
|
|
|
|
| |||||||
Whole loan sales |
| $ | 2,812,696 |
|
| $ | 5,924,743 |
|
|
| $ | 2,391,671 |
|
| $ | 6,433,871 |
| $ | 4,188,678 |
| $ | 2,610,041 |
| $ | 1,102,465 |
|
Loans pooled and sold in securitizations |
| — |
|
| — |
|
|
| — |
|
| — |
| 314,958 |
| 584,964 |
| 1,231,464 |
| |||||||
Total |
| $ | 2,812,696 |
|
| $ | 5,924,743 |
|
|
| $ | 2,391,671 |
|
| $ | 6,433,871 |
| $ | 4,503,636 |
| $ | 3,195,005 |
| $ | 2,333,929 |
|
Total servicing portfolio at period end |
| $ | 6,146,739 |
|
| $ | 2,843,887 |
|
|
| $ | 2,843,887 |
|
| $ | 2,341,028 |
| $ | 1,739,632 |
| $ | 2,308,170 |
| $ | 2,716,781 |
|
40
|
| Years Ended |
| Six Months |
| Years Ended |
| ||||||||||||
|
| 2005 |
| 2004 |
| 2004 |
| 2004 |
| 2003 |
| 2002 |
| 2001 |
| ||||
|
|
|
| (unaudited) |
|
|
|
|
|
|
|
|
|
|
| ||||
Other Data: |
|
|
|
|
|
|
|
|
|
|
|
|
|
|
|
|
|
|
|
Weighted average points on retail loan originations(2) |
| 3.9 | % |
| 3.6 | % |
|
| 3.6 | % |
| 3.2 | % | 3.6 | % | 3.7 | % | 4.0 | % |
Weighted average yield spread premium, net, on wholesale loan originations(2) |
| (0.4 | )% |
| (0.5 | )% |
|
| (0.5 | )% |
| (0.5 | )% | (0.4 | )% | (0.3 | )% | (0.1 | )% |
Weighted average interest rate on loans produced(2) |
| 7.6 | % |
| 7.4 | % |
|
| 7.5 | % |
| 7.4 | % | 7.8 | % | 9.0 | % | 10.3 | % |
Weighted average initial combined loan-to-value ratio(2)(3): |
|
|
|
|
|
|
|
|
|
|
|
|
|
|
|
|
|
|
|
Retail |
| 76 | % |
| 77 | % |
|
| 76 | % |
| 77 | % | 77 | % | 76 | % | 75 | % |
Wholesale |
| 81 | % |
| 81 | % |
|
| 81 | % |
| 82 | % | 80 | % | 79 | % | 79 | % |
Weighted average credit score(2): |
|
|
|
|
|
|
|
|
|
|
|
|
|
|
|
|
|
|
|
Retail |
| 607 |
|
| 604 |
|
|
| 605 |
|
| 607 |
| 623 |
| 630 |
| 619 |
|
Wholesale |
| 628 |
|
| 614 |
|
|
| 613 |
|
| 615 |
| 611 |
| 600 |
| 598 |
|
Average gain on sale of loans |
| 1.2 | % |
| 3.0 | % |
|
| 2.5 | % |
| 3.2 | % | 3.0 | % | 3.0 | % | 3.2 | % |
At period end: |
|
|
|
|
|
|
|
|
|
|
|
|
|
|
|
|
|
|
|
Number of: |
|
|
|
|
|
|
|
|
|
|
|
|
|
|
|
|
|
|
|
Retail branches |
| 76 |
|
| 96 |
|
|
| 96 |
|
| 99 |
| 93 |
| 100 |
| 101 |
|
Regional wholesale operations centers |
| 5 |
|
| 5 |
|
|
| 5 |
|
| 5 |
| 4 |
| 4 |
| 5 |
|
Employees: |
|
|
|
|
|
|
|
|
|
|
|
|
|
|
|
|
|
|
|
Loan origination |
| 1,975 |
|
| 1,824 |
|
|
| 1,824 |
|
| 1,822 |
| 1,449 |
| 1,523 |
| 1,230 |
|
Loan servicing |
| 101 |
|
| 89 |
|
|
| 89 |
|
| 81 |
| 104 |
| 118 |
| 118 |
|
All other |
| 164 |
|
| 158 |
|
|
| 158 |
|
| 160 |
| 154 |
| 160 |
| 152 |
|
|
| 2,240 |
|
| 2,071 |
|
|
| 2,071 |
|
| 2,063 |
| 1,707 |
| 1,801 |
| 1,500 |
|
(1) Wholesale originations include the purchases of closed loans from correspondents of $51.7 million, $4.2 million, $19.3 million, $24.2 million and $40.4 million during the years ended December 31, 2005, June 30, 2004, 2003, 2002, and 2001, respectively. No such loans were purchased during the year ended December 31, 2004 and the six months ended December 31, 2004.
(2) Computed on loan production during the period presented.
(3) The weighted average initial combined loan-to-value ratio is determined by dividing the sum of all loans secured by the junior and/or senior mortgages on the property, by the appraised value at origination.
41
Item 7. Management’s Discussion and Analysis of Financial Condition and Results of Operations
The information required by this item relating to Management’s Discussion and Analysis of Financial Condition and Results of Operations for the years ended December 31, 2005 and 2004, six months ended December 31, 2004 and 2003, and years ended June 30, 2004 and 2003 is discussed below in “Item 7A. Quantitative and Qualitative Disclosures About Market Risk.”
Item 7A. Quantitative and Qualitative Disclosures About Market Risk
The following discussion includes Management’s Discussion and Analysis of Financial Condition and Results of Operations and Quantitative and Qualitative Disclosures about Market Risk. This section should be read in conjunction with “Item 6. Selected Financial Data” and “Item 8. Financial Statements and Supplementary Data.”
This report contains statements that may constitute forward-looking statements within the meaning of the Private Securities Litigation Reform Act of 1995, including statements relating to our ability to ramp up our loan portfolio and our ability to pay dividends. These statements are based on management’s current expectations and beliefs and are subject to a number of trends and uncertainties that could cause actual results to differ materially from those described in the forward-looking statements. We can give no assurance that our expectations will be attained. Such forward-looking statements speak only as of the date of this report. We expressly disclaim any obligation to release publicly any updates or revisions to any forward-looking statements contained herein to reflect any change in the our expectations with regard thereto or change in events, conditions or circumstances on which any statement is based.
In addition, we note that a variety of factors could cause our actual results and experiences to differ materially from the anticipated results or other expectations expressed in the forward-looking statements. The risks and uncertainties that may cause our performance to vary include (1) limited cash flow to fund operations, dependence on short-term financing facilities; (2) changes in overall economic conditions and interest rates; (3) increased delinquency rates in our portfolio; (4) inability to originate subprime hybrid/adjustable mortgage loans; (5) adverse changes in the securitization and whole loan market for mortgage loans; (6) decline in real estate values; (7) decreases in earnings from Aames Investment calling securitization trusts; (8) obligations to repurchase mortgage loans and indemnify investors; (9) concentration of operations in California, Florida, New York and Texas; (10) the occurrence of natural disasters, including the adverse impact of hurricanes Katrina, Rita and Wilma; (11) extensive government regulation; and an inability to comply with the federal tax requirements applicable to REITs and effectively operate within limitations imposed on REITs by federal tax rules. For a more complete discussion of these risks and uncertainties and information relating to the company, see “Risk Factors.” You should carefully review these factors and other documents we file from time to time with the SEC.
We elected to qualify as a REIT for U.S. federal income tax purposes for the six months ended December 31, 2004 and for the year ended December 31, 2005. Aames Financial has continued its operations as our primary mortgage origination and servicing subsidiary. To meet some of the REIT qualification requirements, we conduct our loan sales, as well as other servicing and origination functions, through Aames Financial, our taxable REIT subsidiary. All loans are sourced, underwritten and processed by Aames Financial. We purchase from Aames Financial the loans that we anticipate holding on our balance sheet in our REIT portfolio, largely hybrid/adjustable rate mortgage loans, and Aames Financial sells the remainder of the loans it originates, including a majority of its fixed-rate mortgage loans, to third
42
parties. We are required to purchase loans from Aames Financial at fair market value and Aames Financial is subject to corporate income tax on any taxable gain it recognizes on the sale.
U.S. federal income tax law requires that a REIT distribute annually to its stockholders at least 90% of its taxable income, excluding the retained earnings of any taxable REIT subsidiary it owns. During the six months ended December 31, 2004 and the year ended December 31, 2005, we distributed at least 90% of our taxable income to our stockholders, and were not subject to U.S. federal income tax and will not record an income tax provision with respect to the income we distributed. To qualify as a REIT, at least 75% or our assets must be qualified real estate assets, government securities, and cash and cash items, and no more than 20% of the value may be comprised of stock and other securities of Aames Financial or other taxable REIT subsidiaries.
Any taxable income generated by Aames Financial will be subject to regular corporate income tax and Aames Financial will continue to record an income tax provision. However, we anticipate that Aames Financial will have substantially lower effective income tax rates due to historical net operating loss carryforwards for U.S. federal income tax purposes. Subject to annual limitations, these losses are available to offset future income. Aames Financial may retain any income it generates, net of any tax liability it incurs on that income, without affecting the REIT distribution requirements. If Aames Financial chooses to pay a dividend to us, the dividend could be included in the REIT distribution. Any distributions that Aames Financial makes in the future will be at the discretion of its board of directors and will depend on, among other things, its actual results of operations and liquidity levels.
On March 15, 2006, Aames Investment announced that it intends to alter its structure so that it would no longer be required to pay out at least 90% of its taxable earnings to its stockholders as dividends, but rather, would retain its capital for internal growth. As a result, all future dividends distributions will be at the discretion of our Board of Directors.
The hybrid/adjustable rate mortgage loans in our REIT portfolio may have a fixed rate for two, three, or five years prior to their first adjustment, while the related on-balance sheet securitization bond debt may have rates that adjust monthly. As a result, our net interest income and cash flow could be negatively impacted by changes in short-term interest rates. To counteract this possibility, we may hedge the aggregate risk of interest rate fluctuations with respect to our borrowing index. We generally intend to hedge only the risk related to changes in the benchmark interest rate used in the variable rate index, usually a London Interbank Offered Rate, known as LIBOR, or a U.S. Treasury rate.
To reduce these risks, we may enter into interest rate cap agreements whereby, in exchange for a fee, we would be reimbursed for interest paid in excess of a certain capped rate. With respect to interest rate cap agreements, any net payments under, or fluctuations in the fair value of, these agreements will be recorded in current income.
Derivative financial instruments contain credit risk to the extent that the institutional counterparties may be unable to meet the terms of the agreements. We expect to minimize this risk by using multiple counterparties and limiting them to major financial institutions with good credit ratings. In addition, we regularly monitor the potential risk of loss with any one party resulting from this type of credit risk. Accordingly, we do not expect any material losses as a result of default by other parties.
Several of the critical accounting policies that are very important to the portrayal of our financial condition and results of operations require management to make difficult and complex judgments that rely on estimates about the effect of matters that are inherently uncertain due generally to the impact of
43
changing market conditions and/or borrower behavior. We believe our most critical accounting policies relate to (1) owning a portfolio of loans held for investment which is separate and distinct from a portfolio of loans held for sale, (2) our allowance for losses on mortgage loans held for investment, (3) gain on sale of loans held for sale and our secondary market related allowances and (4) income taxes.
Owning a Portfolio of Hybrid/Adjustable Rate Mortgage Loans. We have a portfolio of loans held for investment in addition to Aames Financial’s portfolio of loans held for sale. Accordingly, the presentation of interest income and expense on these two portfolios has been modified from that which Aames Financial shows in its historical consolidated financial statements. We differentiate our interest income and expense into two components: “Interest income—loans held for sale” and “Interest income—loans held for investment.” Interest expense is also differentiated between “Interest expense—loans held for sale” and “Interest expense—loans held for investment.” We also record a provision for loan losses on loans held for investment, which increases our allowance for loan losses, based on an estimate of probable and inherent losses in our portfolio of loans held for investment.
Our investment portfolio of loans is shown on our balance sheet as “Loans held for investment.” Prior to our REIT reorganization, all loans were shown as “Loans held for sale, at lower of cost or market.” Because Aames Financial intends to sell a portion of its loans, we continue to show these loans as “Loans held for sale, at lower of cost or market.” Bonds that we issue to finance our portfolio of loans held for investment are shown as “Financings on loans held for investment.” Warehouse financing of our loans held for sale and loans held for investment but not yet securitized are shown as “Revolving warehouse and repurchase facilities.”
Our portfolio of loans held for investment was created through on-balance sheet securitizations and must comply with the provisions of Financial Accounting Standards Board (“FASB”) Statement of Financial Accounting Standards No. 140 “Accounting for Transfers and Servicing of Financial Assets and Extinguishments of Liabilities” (“SFAS 140”). SFAS 140 sets forth the criteria applicable to determining whether a transfer of financial assets is to be treated as a sale or a secured financing under generally accepted accounting principles, or GAAP. We intend for our on-balance sheet securitizations to be treated as secured financings and, accordingly, one of our critical accounting policies is compliance with the SFAS 140 requirements necessary to obtain secured financing treatment for our securitizations. In addition, our strategy of retaining mortgage loans in our securitization pools on our balance sheet reduced the number of loans we sold during the year ended December 31, 2005, when we built our REIT portfolio, which reduced the total gain on sale of loans during the period. Our strategy of maintaining our leverage in our portfolio and growing our portfolio over time will continue to reduce the number of loans sold to third parties compared to periods prior to our REIT conversion.
Allowance for Losses on Mortgage Loans Held for Investment. For mortgage loans held for investment, we maintain an allowance for loan losses based on our estimate of losses inherent and probable as of the balance sheet date. We view our mortgage loans held for investment as a homogenous pool of loans which exhibit similar characteristics, including default probabilities and loss severities. When we evaluate the adequacy of this allowance, which is done quarterly, we give consideration to factors such as the current performance of the loans, delinquency status of the loans, historical performance of similar loans, credit characteristics of the portfolio, the value of the underlying collateral, and the general economic environment.
In order to estimate an appropriate allowance for losses on loans held for investment, we estimate losses using “static pooling,” which stratifies the loans held for investment into separately identified vintage pools. Using historic experience and taking into consideration the factors above, we estimate an allowance for loan losses, which we believe is adequate for probable and inherent losses in the portfolio of mortgage loans held for investment. Provisions for losses are charged to our consolidated statement of operations. Charge-offs of mortgage loans held for investment are charged to the allowance. While we use available
44
information to estimate losses on loans held for investment, future additions to the allowance may be necessary based on changes in estimates resulting from economic and other conditions.
Gain on Sale of Loans Held for Sale and Secondary Market Related Allowances. Our current loan disposition strategy relies on whole loan sales. We sell our loans in whole loan sale transactions on a cash basis. In whole loan sale transactions, the buyer acquires all future rights (including mortgage servicing rights) to the loans, without recourse, except for standard representations and warranties. Gains and losses on whole loan sales are recognized when we surrender control over the loans (generally on the settlement date) based upon the difference between the proceeds received and the net carrying amount of the loans, less the provision for representation, warranty, and other miscellaneous losses recorded on the settlement date to cover repurchases, if any, of loans that have a first or early payment default to the purchaser or otherwise breach representations and warranties.
As part of the normal course of business involving loans sold to the secondary market, we are occasionally required to repurchase loans or make payments to settle breaches of the standard representations and warranties made as part of our loan sales. The secondary market allowances include (1) a representation and warranty allowance for probable losses on repurchases arising from representation and warranty claims, and probable obligations related to disputes with investors and (2) a lower of cost or market valuation allowance for certain loans held for sale.
The level of the representation and warranty allowance is a function of expected losses based on actual pending claims and repurchase requests, historical experience, loan sales and the assessment of probable investor claims. An increase to this allowance is recorded as a reduction of the gain on sale of loans in our consolidated statements of operations and the corresponding allowance is recorded in accounts payable and accrued expenses in our consolidated balance sheets. At the time we repurchase a loan, the estimated loss on the loan is charged against this allowance and recorded as a reduction of the basis of the loan.
The lower of cost or market valuation allowance is maintained for loans held for sale that are severely delinquent, have suffered declines in market value, had credit deterioration, have significant collateral deficiencies or other attributes that reduce their sale potential. An increase to this valuation allowance is recorded as a reduction of gain on sale of loans in our consolidated statement of operations and the valuation allowance is recorded as an offset to loans held for sale in our consolidated balance sheets. At the time we sell a loan having the aforementioned attributes, the estimated loss on the loan is charged against this allowance.
The following discusses critical accounting policies which arise only in the context of off-balance sheet seuritization transactions in which we did not engage during the years ended December 31, 2005 and 2004 and June 30, 2004.
Accounting for Off-Balance Sheet Securitizations. During the years ended December 31, 2005 and 2004, and June 30, 2004, we did not dispose of any of our mortgage loans in off-balance sheet securitization transactions. During the year ended June 30, 2003, we sold $315.0 million of mortgage loans in off-balance sheet securitization transactions. The residual interests created in the2003 securitization were sold to an affiliate, CZI, for $8.7 million of cash under the Residual Facility. We retained the residual interests created in all of the $7.0 billion of off-balance sheet securitizations that closed prior to and during the year ended June 30, 2000.
We called the seven remaining securitization trusts in which we retained residual interests during the year ended December 31, 2005, with the last five securitization trusts having been called on June 15, 2005. No adjustments to the carrying values of the retained residual interests were deemed necessary as a result of calling these securitization trusts. In addition, during the period of January 1, 2005 through June 15, 2005, the actual performance of our retained residual interests as compared to the key assumptions and
45
estimates used to evaluate their carrying value (i.e., credit losses, rate of prepayment and discount rate) did not result in write-downs. Performing mortgage loan collateral received in the calls was placed into the portfolio of loans held for investment for inclusion in the securitizations that closed during the three months ended September 30, 2005.
In an off-balance sheet securitization, we convey loans to a special purpose entity (such as a trust) in exchange for cash proceeds and a residual interest in the trust. The cash proceeds are raised through an offering of the pass-through certificates or bonds evidencing the right to receive principal payments and interest on the certificate balance or on the bonds. The non-cash gain on sale of loans represents the difference between the proceeds (including premiums) from the sale, net of related transaction costs, and the allocated carrying amount of the loans sold. The allocated carrying amount is determined by allocating the original cost basis of the loans (including premiums paid on loans purchased) between the portion sold and any retained interests (residual interests), based on their relative fair values at the date of transfer. The residual interests represent the present value of the estimated cash flows over the estimated life of the loans. These cash flows are determined by the excess of the weighted average coupon on each pool of loans sold over the sum of the interest rate paid to investors, the contractual servicing fee, a monoline insurance fee, if any, and an estimate for credit losses. Each agreement that we have entered into in connection with our securitizations requires the overcollateralization of the trust that may initially be funded by cash deposited by us. The amount and timing of the cash flows expected to be released from the securitization trusts considers the impact of the applicable delinquency and credit loss limits specified in the securitization agreements.
We determine the present value of the cash flows at the time each securitization transaction closes using certain estimates made by management at the time the loans are sold. These estimates include: (i) future rate of prepayment; (ii) credit losses; and (iii) discount rate used to calculate present value. The future cash flows represent management’s best estimate. Management monitors the performance of the loans, and any changes in the estimates are reflected in earnings.
Rate of Prepayment. The estimated life of the securitized loans depends on the assumed annual prepayment rate which is a function of estimated voluntary (full and partial) and involuntary (liquidations) prepayments. The prepayment rate represents management’s expectations of future prepayment rates based on prior and expected loan performance, the type of loans in the relevant pool (fixed or adjustable rate), the production channel which produced the loan, prevailing interest rates, the presence of prepayment penalties, the loan-to-value ratios, and the credit grades of the loans included in the securitization and other industry data. The rate of prepayment may be affected by a variety of economic and other factors including, but not limited to, a declining mortgage interest rate environment.
Credit Losses. In determining the estimate for credit losses on loans securitized, we use assumptions that we believe are reasonable based on information from our prior securitizations, the loan-to-value ratios, and credit grades of the loans included in the securitizations, loss and delinquency information by origination channel, and information available from other market participants such as investment bankers, credit providers, and credit agencies. On a monthly basis, we re-evaluate our credit loss estimates.
Discount Rate. In order to determine the fair value of the cash flow from the residual interests, we discount the cash flows based upon rates prevalent in the market.
Our retained residual interests are recorded at estimated fair value and are marked to market through a charge (or credit) to earnings. On a quarterly basis, we review the fair value of our retained residual interests by analyzing our prepayment, credit loss and discount rate assumptions in relation to our actual experience and current rates of prepayment and credit loss prevalent in the industry. Additionally, on a quarterly basis we evaluate the effects, if any, that increasing or decreasing interest rates may have on the retained residual interests. We may adjust the value of our retained residual interests or take a charge to earnings related to the retained residual interests, as appropriate, to reflect a valuation or write-down,
46
respectively, of our retained residual interests based upon the actual performance of the retained residual interests as compared to our key assumptions and estimates used to determine fair value.
To estimate the effects of changes in interest rates on the coupon rates of the adjustable rate mortgage loans, we consider current underlying indices, periodic interest rate caps, lifetime interest rate caps and contractual interest rate floors. In determining the interest rates for the floating rate pass-through certificates in the securitization trusts, we use each certificates’ specific spread over the one-month LIBOR.
We previously disclosed that if actual credit losses and actual prepayments exceeded the credit loss and prepayment rate assumptions, we would be required to take a charge to earnings to reflect changes in estimates for credit loss and prepayment rate assumptions. The actual performance of our retained residual interests as compared to the key assumptions and estimates used to evaluate their carrying value did not result in write-downs during the years ended December 31, 2005, December 31, 2004, and June 30, 2004, but resulted in a write-down to the residual interests of $34.9 million during the year ended June 30, 2003.
Since January 1, 2000, all of our loan dispositions have been on a servicing released basis. However, upon sale or off-balance sheet securitization of servicing retained mortgages, we capitalize the fair value of mortgage servicing rights (“MSRs”) assets separate from the loans. We determine fair value based on the present value of estimated net future cash flows related to servicing income. The cost allocated to the servicing rights is amortized over the period of estimated net future servicing fee income.
Accounting for Income Taxes. We elected to qualify as a REIT for U.S. federal income tax purposes for the six months ended December 31, 2004 and for the year ended December 31, 2005. This means that generally we were not subject to U.S. federal income taxes on the REIT income that we distributed to our stockholders.
Aames Financial’s taxable income is subject to regular corporate income tax. Taxes are provided on substantially all income and expense items included in the earnings of Aames Financial, regardless of the period in which such items are recognized for tax purposes. We use an asset and liability approach that requires the recognition of deferred tax assets and liabilities for the expected future tax consequences of events that have been recognized in our financing statements or tax returns. In estimating future tax consequences, we generally consider all expected future events other than the enactment of changes in the tax law or rates.
Deferred income tax assets and liabilities are recognized by Aames Financial to reflect the future tax consequences of net operating loss carry forwards and differences between the tax basis and financial reporting basis of assets and liabilities. We have established a valuation allowance to reflect management’s determination that it is not more likely than not that certain deferred tax assets will be realized.
In determining the realization of deferred tax assets, we consider future taxable income from the following sources: (a) the reversal of taxable temporary differences, (b) future operations exclusive of reversing temporary differences, and (c) tax planning strategies that, if necessary, would be implemented to accelerate taxable income into periods in which net operating losses might otherwise expire. The realization of deferred tax assets is evaluated by management quarterly and changes in realizability are reflected in the income tax provision.
47
The following table sets forth information regarding our results of operations for the periods indicated (in thousands):
|
| Years Ended |
| Six Months Ended |
| Years Ended |
| ||||||||||||||||
|
| 2005 |
| 2004 |
| 2004 |
| 2003 |
| 2004 |
| 2003 |
| ||||||||||
|
|
|
| (unaudited) |
|
|
| (unaudited) |
|
|
|
|
| ||||||||||
Interest income |
| $ | 340,515 |
|
| $ | 93,181 |
|
| $ | 56,103 |
|
| $ | 32,596 |
|
| $ | 69,446 |
| $ | 69,186 |
|
Interest expense |
| 170,942 |
|
| 32,396 |
|
| 18,490 |
|
| 12,460 |
|
| 26,227 |
| 35,119 |
| ||||||
Net interest income |
| 169,573 |
|
| 60,785 |
|
| 37,613 |
|
| 20,136 |
|
| 43,219 |
| 34,067 |
| ||||||
Provision for loan losses |
| 40,294 |
|
| 1,900 |
|
| 1,900 |
|
| — |
|
| — |
| — |
| ||||||
Net interest income after provision for loan losses |
| 129,279 |
|
| 58,885 |
|
| 35,713 |
|
| 20,136 |
|
| 43,219 |
| 34,067 |
| ||||||
Noninterest income: |
|
|
|
|
|
|
|
|
|
|
|
|
|
|
|
|
| ||||||
Gain on sale of loans |
| 30,277 |
|
| 177,607 |
|
| 59,960 |
|
| 102,737 |
|
| 261,801 |
| 174,710 |
| ||||||
Loan servicing |
| 6,330 |
|
| 6,634 |
|
| 3,070 |
|
| 4,177 |
|
| 7,829 |
| 8,896 |
| ||||||
Total noninterest income |
| 36,607 |
|
| 184,241 |
|
| 63,030 |
|
| 106,914 |
|
| 269,630 |
| 183,606 |
| ||||||
Net interest income after provision for loan losses and noninterest income |
| 165,886 |
|
| 243,126 |
|
| 98,743 |
|
| 127,050 |
|
| 312,849 |
| 217,673 |
| ||||||
Noninterest expense: |
|
|
|
|
|
|
|
|
|
|
|
|
|
|
|
|
| ||||||
Personnel |
| 91,217 |
|
| 120,608 |
|
| 62,660 |
|
| 61,049 |
|
| 160,169 |
| 117,547 |
| ||||||
Production |
| 35,351 |
|
| 36,504 |
|
| 17,165 |
|
| 15,774 |
|
| 35,113 |
| 25,849 |
| ||||||
General and administrative |
| 44,707 |
|
| 49,162 |
|
| 27,238 |
|
| 22,360 |
|
| 44,527 |
| 43,738 |
| ||||||
Write-down of residual interests |
| — |
|
| — |
|
| — |
|
| — |
|
| — |
| 34,923 |
| ||||||
Total noninterest expense |
| 171,275 |
|
| 206,274 |
|
| 107,063 |
|
| 99,183 |
|
| 239,809 |
| 222,057 |
| ||||||
Nonoperating income: |
|
|
|
|
|
|
|
|
|
|
|
|
|
|
|
|
| ||||||
Debt extinguishment income—Capital Z |
| — |
|
| — |
|
| — |
|
| — |
|
| — |
| 24,970 |
| ||||||
Debt extinguishment income—others |
| — |
|
| — |
|
| — |
|
| — |
|
| — |
| 6,741 |
| ||||||
Total nonoperating income |
| — |
|
| — |
|
| — |
|
| — |
|
| — |
| 31,711 |
| ||||||
Income (loss) before income taxes |
| (5,389 | ) |
| 36,852 |
|
| (8,320 | ) |
| 27,867 |
|
| 73,040 |
| 27,327 |
| ||||||
Income tax provision (benefit) |
| 842 |
|
| (4,933 | ) |
| (5,235 | ) |
| (17,976 | ) |
| (17,674 | ) | (1,839 | ) | ||||||
Net income (loss) |
| $ | (6,231 | ) |
| $ | 41,785 |
|
| $ | (3,085 | ) |
| $ | 45,843 |
|
| $ | 90,714 |
| $ | 29,166 |
|
48
Interest Income and Interest Expense
Interest income. Interest income includes interest earned on loans held for investment and loans held for sale. To a lesser extent, interest income also includes interest on short-term overnight investments, prepayment penalty fees earned on loans held for investment, interest income on in-the-money interest rate cap agreements, amortization of net deferred loan origination costs on mortgage loans held for investment and, in prior periods when we held residual interests in off-balance sheet securitizations, discount accretion income recognized on our residual interests.
Pursuant to FASB Statement of Financial Accounting Standards No. 91, “Accounting for Nonrefundable Fees and Costs Associated with Originating or Acquiring Loans and Initial Direct Costs of Leases” (“SFAS 91”), net loan origination fees and costs related to mortgage loans originated and held for investment are deferred and amortized to interest income.
The following table summarizes the components of interest income for the periods indicated (in thousands):
|
| Years Ended |
| Six Months Ended |
| Years Ended |
| ||||||||||||||||
|
| 2005 |
| 2004 |
| 2004 |
| 2003 |
| 2004 |
| 2003 |
| ||||||||||
|
|
|
| (unaudited) |
|
|
| (unaudited) |
|
|
|
|
| ||||||||||
Interest earned on: |
|
|
|
|
|
|
|
|
|
|
|
|
|
|
|
|
| ||||||
Loans held for investment |
| $ | 246,887 |
|
| $ | 15,957 |
|
| $ | 15,957 |
|
| $ | — |
|
| $ | — |
| $ | — |
|
Loans held for sale |
| 44,208 |
|
| 75,288 |
|
| 39,435 |
|
| 28,970 |
|
| 64,824 |
| 52,411 |
| ||||||
Overnight investments |
| 2,673 |
|
| 281 |
|
| 281 |
|
| — |
|
| — |
| — |
| ||||||
Income from derivative financial instruments |
| 27,424 |
|
| 488 |
|
| 488 |
|
| — |
|
| — |
| — |
| ||||||
Prepayment penalty fees on loans held for investment |
| 23,701 |
|
| 88 |
|
| — |
|
| — |
|
| — |
| — |
| ||||||
Amortization of net deferred loan origination costs |
| (4,737 | ) |
| (200 | ) |
| (200 | ) |
| — |
|
| — |
| — |
| ||||||
Discount accretion on residual interests |
| — |
|
| 972 |
|
| — |
|
| 3,385 |
|
| 4,357 |
| 16,558 |
| ||||||
Other |
| 359 |
|
| 307 |
|
| 142 |
|
| 241 |
|
| 265 |
| 217 |
| ||||||
Total interest income |
| $ | 340,515 |
|
| $ | 93,181 |
|
| $ | 56,103 |
|
| $ | 32,596 |
|
| $ | 69,446 |
| $ | 69,186 |
|
In connection with our formation as a mortgage REIT in November of 2004, we began to build a portfolio of loans held for investment which, at December 31, 2005, was comprised of mortgage loans with an unpaid principal balance of $4.1 billion. We did not have a portfolio of loans held for investment prior to our REIT formation.
During the year ended December 31, 2005, our interest income grew by $247.3 million, to $340.5 million, from $93.2 million during the year ended December 31, 2004. This was primarily due to the increase of $230.9 million in interest income earned on the portfolio of loans held for investment. To a lesser extent, the growth in interest income was due to increases of $26.9 million, $23.6 million and $2.4 million in income from derivative financial instruments, prepayment penalty fees, and interest earned on overnight investments, respectively. The income from derivative financial instruments related to remittances to us from counterparties on in-the-money interest rate cap agreements used to hedge interest rate exposure on our REIT portfolio and related financings. Prepayment penalty fees were earned on early loan pay-offs in our portfolio of mortgage loans held for investment, which was not in place during most of the year ended December 31, 2004.
49
Partially offsetting the growth in interest income during the year ended December 31, 2005 over the year ended December 31, 2004 was a decline of $31.1 million in interest income on loans held for sale. Interest income earned on loans held for sale declined due to our strategy of building a portfolio of loans held for investment, which resulted in our holding a lower average balance of loans held for sale during the year ended December 31, 2005 when compared to the year ended December 31, 2004. This was partially offset by higher weighted average coupon rates on loans held for sale during the year ended December 31, 2005 compared to rates during the year ended December 31, 2004. We discontinued discount accretion on our residual interests during the second half of the year ended December 31, 2004 in light of our intention to call the remaining securitization trusts which was consummated during the year ended December 31, 2005.
During the year ended December 31, 2005, the amortization of net deferred loan origination costs was $4.7 million. There was only $0.2 million of such amortization during the previous year because we did not have a portfolio of loans held for investment for most of 2004.
Interest income grew by $23.5 million to $56.1 million during the six months ended December 31, 2004 over $32.6 million during the six months ended December 31, 2003. This was primarily due to increases of $16.0 million and $10.3 million in interest income on loans held for investment and interest income on loans held for sale, respectively. These increases were partially offset by a $3.4 million decline in discount accretion income during the six months ended December 31, 2004 when compared to the same six-month period in 2003. The $16.0 million growth in interest income on loans held for investment is attributable to our REIT portfolio of loans held for investment consisting of a $1.2 billion on-balance sheet securitization that closed during the three months ended December 31, 2004 and $0.5 billion of loans held for investment that were not yet securitized at December 31, 2004. During the comparable period in 2003, we did not have a portfolio of loans held for investment. Interest income on loans held for sale grew by $10.3 million, to $39.2 million, during the six months ended December 31, 2004 over $29.0 million during the six months ended December 31, 2003. This resulted from having higher average balances of loans held for sale outstanding coupled with higher weighted average coupon rates during the six months ended December 31, 2004 when compared to such balances and rates during the six months ended December 31, 2003.
Interest income grew by $0.2 million, to $69.4 million, during the year ended June 30, 2004 from $69.2 million during the year ended June 30, 2003. This was primarily due to a $12.4 million increase in interest income earned on loans held for sale, which resulted from higher average outstanding balances of loans held for sale, despite such loans having lower weighted average coupon rates. This was partially offset by a $12.2 million decline in discount accretion income on lower average residual interest balances during the year ended June 30, 2004 when compared to such balances during the year ended June 30, 2003.
Interest expense. Interest expense includes interest incurred on the outstanding balances of financings on loans held for investment, revolving warehouse and repurchase facilities, and borrowings. Interest expense also includes fair value adjustments to derivative financial instruments used to hedge interest rate risk on our financings of mortgage loans held for investment, amortization of debt issuance costs and debt discount on financings on mortgage loans held for investment and the amortization of commitment fees on revolving warehouse and repurchase facilities.
50
The following table summarizes the components of interest expense for the periods indicated (in thousands):
|
| Years Ended |
| Six Months Ended |
| Years Ended |
| ||||||||||||||||
|
| 2005 |
| 2004 |
| 2004 |
| 2003 |
| 2004 |
| 2003 |
| ||||||||||
|
|
|
| (unaudited) |
|
|
| (unaudited) |
|
|
|
|
| ||||||||||
Interest incurred on: |
|
|
|
|
|
|
|
|
|
|
|
|
|
|
|
|
| ||||||
Financings on loans held for investment |
| $ | 112,809 |
|
| $ | 2,912 |
|
| $ | 2,912 |
|
| $ | — |
|
| $ | — |
| $ | — |
|
Revolving warehouse and repurchase facilities |
| 47,246 |
|
| 24,753 |
|
| 15,777 |
|
| 6,846 |
|
| 15,823 |
| 13,796 |
| ||||||
Borrowings |
| 128 |
|
| 4,135 |
|
| 2,011 |
|
| 2,862 |
|
| 4,986 |
| 16,190 |
| ||||||
Amortization of commitment fees, debt issuance costs, and debt discount |
| 10,002 |
|
| 5,618 |
|
| 3,137 |
|
| 2,614 |
|
| 5,095 |
| 4,930 |
| ||||||
Mark to market (gain) loss on interest rate cap agreements designed to hedge interest rate risk on financings of loans held for investment |
| 143 |
|
| (6,344 | ) |
| (6,344 | ) |
| — |
|
| — |
| — |
| ||||||
Bank charges and other |
| 614 |
|
| 1,322 |
|
| 997 |
|
| 138 |
|
| 323 |
| 203 |
| ||||||
Total interest expense |
| $ | 170,942 |
|
| $ | 32,396 |
| �� | $ | 18,490 |
|
| $ | 12,460 |
|
| $ | 26,227 |
| $ | 35,119 |
|
During the year ended December 31, 2005, our interest expense grew by $138.5 million, to $170.9 million, from $32.4 million during the year ended December 31, 2004. This was primarily due to increases of $109.9 million, $22.5 million, and $4.4 million in interest expense on financing on loans held for investment, revolving warehouse and repurchase facilities, and amortization of commitment fees, debt issuance costs and debt discount, respectively. During the year ended December 31, 2005, we continued to fund the securitized portfolio of loans held for investment through financings which were not in place for most of the year ended December 31, 2004. Accordingly, interest expense on financings on loans held for investment increased during the year ended December 31, 2005 over the previous year. During the year ended December 31, 2005, average borrowings and interest rates associated with our revolving warehouse and repurchase facilities to fund our loans held for sale and loans held for investment not yet securitized were higher than such average balances and interest rates during the prior year. The increase in amortization of commitment fees, debt issuance costs and debt discount for the year ended December 31, 2005 compared to the year ended December 31, 2004 was primarily due to the growth in debt issuance costs and debt discount recorded in connection with our 2005 financings on loans held for investment. Additionally, the negative mark to fair value during the year ended December 31, 2005 on open interest rate cap agreements in place to hedge interest rate risk exposure on our financings on loans held for investment resulted in a charge to interest expense of $0.1 million, compared to a credit to interest expense of $6.3 million resulting from a positive mark to fair value during the year ended December 31, 2004.
Partially offsetting the growth in interest expense was a $4.0 million decrease in interest expense on borrowings primarily due to the Aames Financial residual financing facility being fully redeemed during the March 2005 quarter. Therefore, during the year ended December 31, 2005, borrowings outstanding were at lower levels than during the same period last year. Finally, bank charges and other decreased by $0.7 million during the year ended December 31, 2005 from the amount reported during the year ended December 31, 2004.
Interest expense grew by $6.0 million to $18.5 million during the six months ended December 31, 2004 over $12.5 million during the six months ended December 31, 2003. This was primarily due to higher
51
average borrowings and rates associated with our revolving warehouse and repurchase facilities used to fund the origination of mortgage loans prior to their disposition. To a lesser extent, the increase was due to the $1.2 billion of financing on loans held for investment created in the on-balance sheet securitization that closed during the three months ended December 31, 2004. These increases were partially offset by a $6.3 million positive mark to fair value at December 31, 2004 on open interest rate cap agreements, in place to hedge our financings on loans held for investment. In addition, interest expense declined due to lower average amounts outstanding under a nonrevolving financing facility secured by certain residual interests from off-balance sheet securitizations and certain servicing advances (the “Financing Facility”) at December 31, 2004 when compared to the average amount outstanding at December 31, 2003. Interest expense also includes the amortization of capitalized financing costs for revolving committed warehouse facilities we have entered into, and the amortization of debt issuance costs and debt discount. Such amortization was $3.1 million and $2.6 million during the six months ended December 31, 2004 and 2003, respectively.
Interest expense declined by $8.9 million, to $26.2 million, during the year ended June 30, 2004 from $35.1 million during the year ended June 30, 2003. The decrease resulted primarily from lower interest rates associated with our revolving warehouse and repurchase facilities used to fund the origination of mortgage loans prior to their disposition, despite increased average borrowings under the facilities during fiscal 2004 when compared to such rates and average borrowings during fiscal 2003. To a lesser extent, the decline in interest expense resulted from the full redemption of $150.0 million of our 9.125% Senior Notes due November 2003 (the “Senior Notes”) and a $49.6 million decrease in the 5.5% Convertible Subordinated Debentures due March 2006 (the “2006 Debentures”), during the year ended June 30, 2003. Our revolving warehouse and repurchase agreements bear interest rates that are indexed to the one-month LIBOR which, during the year ended June 30, 2004, was lower on average than levels during the year ended June 30, 2003. Amortization of commitment fees, debt issuance costs, and debt discount increased by $0.2 million during the year ended June 30, 2004 over the amount reported during the year ended June 30, 2003.
Interest expense is expected to increase in future periods due to our business strategy of financing our loans held for investment through on-balance sheet securitizations, our continued reliance on revolving warehouse and repurchase facilities to fund mortgage loan production, and expected continued upward pressure on the one-month LIBOR, the index used in our borrowing arrangements.
Provision for Loan Losses. The amounts provided for loan losses are determined based upon quarterly evaluations of the portfolio of loans held for investment. In our evaluation, we apply various judgments, assumptions and estimates concerning the impact certain factors might have on the amounts provided. Such factors include actual and past loan loss experience, loan portfolio composition and risk, delinquencies, underlying collateral value and current economic conditions that may affect a borrower’s ability to pay.
During the year ended December 31, 2005, the provision for loan losses was $40.3 million compared to $1.9 million during the year ended December 31, 2004 due to the increase in the portfolio of loans held for investment and to the seasoning of the portfolio since its inception in December 2004. The unpaid principal balance of the portfolio of loans held for investment was $4.1 billion at December 31, 2005, an increase of $2.4 billion from December 31, 2004.
Gain on Sale of Loans. Gain on sale of loans includes gain from whole loan sale transactions, realized loan origination fees and costs, provisions for representation, warranty and other miscellaneous losses, gains and losses on derivative financial instruments related to hedging interest rate risk on our inventory and pipeline of loans held for sale and miscellaneous costs related to loan sale activities. Gain on sale of
52
loans is impacted by the timing and mix of loan origination and sales as pursuant to SFAS 91. Net loan origination fees and costs related to mortgage loans originated and held for sale are deferred and recognized as a charge or credit to gain on sale of loans at the time the mortgage loans are sold. The deferral of net loan origination fees and costs was not material to our consolidated financial statements at and during the six months ended December 31, 2003 and year ended June 30, 2003.
The components of gain on sale of loans are summarized in the following table for the periods indicated (in thousands):
|
| Years Ended |
| Six Months Ended |
| Years Ended |
| ||||||||||||||||
|
| 2005 |
| 2004 |
| 2004 |
| 2003 |
| 2004 |
| 2003 |
| ||||||||||
|
|
|
| (unaudited) |
|
|
| (unaudited) |
|
|
|
|
| ||||||||||
Gain on whole loan sales |
| $ | 47,568 |
|
| $ | 212,495 |
|
| $ | 77,272 |
|
| $ | 101,122 |
|
| $ | 236,346 |
| $ | 153,556 |
|
Loan origination fees (costs), net |
| 6,601 |
|
| (6,214 | ) |
| (5,559 | ) |
| 12,592 |
|
| 53,354 |
| 39,137 |
| ||||||
Provision for representation, warranty and other miscellaneous losses |
| (22,444 | ) |
| (24,641 | ) |
| (8,140 | ) |
| (10,577 | ) |
| (27,078 | ) | (6,536 | ) | ||||||
Gains (losses) on interest rate cap agreements designed to hedge interest rate risk on loans held for sale |
| — |
|
| (3,293 | ) |
| (3,294 | ) |
| — |
|
| 1 |
| (10,871 | ) | ||||||
Other |
| (1,448 | ) |
| (740 | ) |
| (319 | ) |
| (400 | ) |
| (822 | ) | (576 | ) | ||||||
Total gain on sale of loans |
| $ | 30,277 |
|
| $ | 177,607 |
|
| $ | 59,960 |
|
| $ | 102,737 |
|
| $ | 261,801 |
| $ | 174,710 |
|
During the year ended December 31, 2005, gain on sale of loans decreased by $147.3 million, to $30.3 million, from $177.6 million during the year ended December 31, 2004. This was primarily due to a $164.9 million decline in gain on whole loan sales, which resulted from our strategy of retaining the majority of our hybrid/adjustable rate mortgage loan production in our REIT portfolio. This resulted in a 52.5% decrease, or $3.1 billion, to $2.8 billion in mortgage loan sales to third parties during the year ended December 31, 2005 from the same period last year. Gain on whole loan sales also declined due to lower gain on sale rates realized on loan sales during the year ended December 31, 2005 compared to such rates during the comparable 2004 period due to the fact that increases in interest rates on the mortgage loans we originated and sold during the period did not keep pace with increases in interest rates generally in a rising interest rate environment. In addition, because we retained a majority of our hybrid/adjustable rate mortgage loan production to build our REIT portfolio during the year ended December 31, 2005, many of the loans we sold during the period were fixed-rate, first lien and second lien loans which generally have lower gain rates than our hybrid/adjustable rate mortgage loan products.
Partially offsetting the decline in gain on whole loan sales during the year ended December 31, 2005 over the year ended December 31, 2004 was an increase of $12.8 million in loan origination fees and decreases of $2.2 million and $3.3 million in the provision for representation, warranty, and other miscellaneous losses and losses on interest rate cap agreements that were in place to hedge interest rate risk on loans held for sale, respectively. Due to a higher percentage of retail loans originated and sold during the year ended December 31, 2005 over the same period a year ago, realized net loan origination fees were $6.6 million during the year ended December 31, 2005 compared to realized net loan origination costs of $6.2 million during the year ended December 31, 2004.
During the year ended December 31, 2005, we charged $22.4 million to gain on sale of loans for estimated contractual representation and warranty obligations on loans previously sold and for loans held for sale that were delinquent, had collateral deficiencies, or other attributes that affected their sale
53
potential. This was $2.2 million lower than the $24.6 million provision for representation, warranty and other miscellaneous losses during the year ended December 31, 2004, and was due primarily to fewer loans having been sold in whole loan sales during the year ended December 31, 2005 when compared to the same period a year ago.
The $3.3 million of losses on loans held for sale hedges recorded during the year ended December 31, 2004 primarily resulted from losses on interest rate cap agreements which closed during the second half of the year. We had no such derivative financial instruments in place during the year ended December 31, 2005 to hedge interest rate risk exposure on our inventory and pipeline of loans held for sale, as we try to manage our interest rate risk exposure on loans held for sale through whole loan sale forward commitments.
Gain on sale of loans declined by $42.8 million, to $60.0 million, during the six months ended December 31, 2004 from the comparable six-month period in 2003. This was principally due to a $23.8 million decrease in gain on sale from whole loan sale transactions, a reduction of $18.1 million in net loan origination fees, and a $3.3 million increase in hedge losses, partially offset by a $2.4 million decrease in the provision for representation, warranty and other miscellaneous losses.
The $23.8 million decline in gain on whole loan sales was due primarily to the $509.1 million, or 17.6%, reduction in mortgage loan sales during the six months ended December 31, 2004 from mortgage loan sales during the comparable six-month period in 2003. To a lesser extent, gain on whole loan sales declined due to lower gain on sale rates realized on whole loan sales during the six months ended December 31, 2004 compared to such rates during the comparable 2003 period. During the six months ended December 31, 2004, net loan origination fees decreased by $18.1 million from amounts reported during the six months ended December 31, 2003 due to a higher percentage of wholesale loans originated and sold during the six months ended December 31, 2004. During the six months ended December 31, 2004, we recorded a $3.3 million charge to gain on sale of loans for losses on interest rate cap agreements that were in place during the six months ended December 31, 2004 to hedge interest rate risks to our loans held for sale. Substantially all of the $3.3 million charge related to realized losses recorded on interest rate cap agreements which closed during the first half of the six months ended December 31, 2004. Finally, during the six months ended December 31, 2004, we charged $8.1 million to gain on sale of loans for estimated contractual representation and warranty obligations on loans previously sold and for loans held for sale that are delinquent, have collateral deficiencies or have other attributes that effect their sale potential. This $2.4 million reduction from the $10.5 million provided during the six months ended December 31, 2003, was due principally to fewer loans having been sold in whole loan sales during the six months ended December 31, 2004 when compared to the same six- month period in 2003.
Gain on sale of loans during the year ended June 30, 2004 grew by $87.1 million, to $261.8 million, from $174.7 million during the year ended June 30, 2003. This resulted primarily from the $1.9 billion, or 42.9%, increase in total mortgage loan dispositions during the year ended June 30, 2004 over the year ended June 30, 2003, partially offset by the lower gain on sale rates we realized on whole loan sales during the year ended June 30, 2004, compared to the gain on sale rates realized on our mix of whole loan and off-balance sheet securitization dispositions during the year ended June 30, 2003. During the year ended June 30, 2004, we relied solely on whole loan sales for cash as our loan disposition strategy. In comparison, during the year ended June 30, 2003, we relied on a combination of off-balance sheet securitizations and whole loan sales for cash as our loan disposition strategy, which was based on our review of market conditions, profitability, and cash flow needs, and our ability to sell the residual interest created in the off-balance sheet securitizations to CZI under the Residual Facility.
At June 30, 2004, we had $550.0 million notional amount of interest rate cap agreements in place to hedge interest rate risk on loans held for sale. During the year ended June 30, 2004, there were no material adjustments to mark the interest rate cap agreements to market. At June 30, 2003, we had no derivative
54
financial instruments in place. Gain on sale of loans during the year ended June 30, 2003 was reduced by $10.9 million of hedge losses on closed hedge positions. Gain on sale of loans during the year ended June 30, 2003 includes $8.7 million of cash proceeds from the sale of residual interests to CZI under the Residual Facility. In addition, gain on sale of loans during the year ended June 30, 2003 includes $4.1 million of cash proceeds from the sale of mortgage servicing rights and the rights to prepayment fee income that were sold to an unaffiliated independent mortgage servicing company related to the securitization which closed during the period. During the year ended June 30, 2004, net loan fees increased by $14.2 million over amounts reported during the year ended June 30, 2003. Finally, gain on sale of loans during the year ended June 30, 2003 was reduced by the amortization of $0.7 million of capitalized costs related to obtaining the Residual Facility, substantially all of which related to amortization of the remaining capitalized facility fee paid to CZI. The Residual Facility with CZI expired on March 31, 2003.
Loan Servicing. Loan servicing revenue consists of late charges and other fees we earn in connection with our loan servicing activities. Loan servicing revenue also includes prepayment penalty fees on loans held for sale.
Loan servicing revenue declined by $0.3 million, to $6.3 million, during the year ended December 31, 2005 from $6.6 million during the year ended December 31, 2004. This was primarily due to a decrease of $2.0 million in servicing and beneficiary demand fees, partially offset by an increase of $1.8 million in net late and prepayment penalty fees earned on loans in off-balance sheet securitizations.
Loan servicing revenue declined by $1.1 million, to $3.1 million, during the six months ended December 31, 2004 from $4.2 million during the six months ended December 31, 2003. This was primarily due to a $0.6 million reduction in beneficiary demand fees coupled with a decrease in servicing, late and prepayment fees aggregating $0.7 million. These were partially offset by a $0.2 million reduction in MSR amortization and subservicing related expenses.
Loan servicing revenue declined by $1.1 million, to $7.8 million, during the year ended June 30, 2004 as compared to $8.9 million during the year ended June 30, 2003. This was primarily due to reductions in servicing, late, and prepayment penalty fees aggregating $3.7 million, partially offset by declines in subservicing related expenses and amortization of mortgage servicing rights in the aggregate amount of $2.6 million. The reductions in servicing, late, and prepayment penalty fees during the year ended June 30, 2004 were due to the $511.8 million decrease in mortgage loans in off-balance sheet securitization trusts serviced in-house during the year ended June 30, 2004, compared to such loans serviced in-house during the year ended June 30, 2003, together with a decline in prepayment penalty fees due to the aging of loans in the portfolio beyond the term of prepayment penalty fees. Subservicing expenses and related resolution, set-up, and reperformance expenses during the year ended June 30, 2004 were $0.2 million, down $0.2 million from the $0.4 million of such expenses during the year ended June 30, 2003. Amortization of mortgage servicing rights declined by $2.5 million to $0.2 million during the year ended June 30, 2004 from the $2.7 million during the year ended June 30, 2003. Our mortgage servicing rights were fully amortized at June 30, 2004.
We previously had in place two arrangements designed to reduce our servicing advance obligations. In the first arrangement, which expired on November 30, 2004, but which was in place during the years ended June 30, 2004 and 2003, a loan servicing company purchased certain advances and agreed to make future advances with respect to an original aggregate $388.0 million in principal amount of loans. In the second arrangement, which expired during the year ended June 30, 2003, an investment bank purchased certain servicing related advances and agreed to undertake the obligation to make a substantial portion of our advance obligations.
55
Noninterest Expense
Personnel. Personnel expense includes salaries, payroll taxes and medical and other employee benefits. Personnel expense also includes commissions that are generally related to our loan origination volume, as retail and broker account executives earn incentives on funded loans. Pursuant to SFAS 91, direct personnel costs incurred on mortgage loans originated but not yet sold are deferred and amortized to interest income over the estimated economic life of the loans. When the loans are sold, the deferred costs are recognized as a charge to gain on sale.
The following table summarizes the components of personnel expense for the periods indicated (in thousands):
| Years Ended |
| Six Months Ended |
| Years Ended |
| |||||||||||||||||
|
| December 31, |
| December 31, |
| June 30, |
| ||||||||||||||||
|
| 2005 |
| 2004 |
| 2004 |
| 2003 |
| 2004 |
| 2003 |
| ||||||||||
|
|
|
| (unaudited) |
|
|
| (unaudited) |
|
|
|
|
| ||||||||||
Compensation |
| $ | 165,033 |
|
| $ | 184,136 |
|
| $ | 98,222 |
|
| $ | 76,211 |
|
| $ | 162,126 |
| $ | 123,480 |
|
Deferred loan origination costs |
| (84,678 | ) |
| (75,878 | ) |
| (41,785 | ) |
| (19,844 | ) |
| (12,764 | ) | (14,061 | ) | ||||||
Medical and other benefits |
| 8,954 |
|
| 10,857 |
|
| 5,595 |
|
| 3,804 |
|
| 9,065 |
| 7,005 |
| ||||||
Other |
| 1,908 |
|
| 1,493 |
|
| 628 |
|
| 878 |
|
| 1,742 |
| 1,123 |
| ||||||
Total personnel expense |
| $ | 91,217 |
|
| $ | 120,608 |
|
| $ | 62,660 |
|
| $ | 61,049 |
|
| $ | 160,169 |
| $ | 117,547 |
|
Personnel expense declined by $29.4 million, to $91.2 million, during the year ended December 31, 2005 compared to $120.6 million during the year ended December 31, 2004. This was due to reductions of $19.1 million and $1.9 million in compensation and medical and other benefits, respectively, as well as an $8.8 million increase in deferred loan origination costs. These were partially offset by an increase of $0.4 million in other personnel costs.
The $19.1 million reduction in compensation was primarily due to $17.3 million of one-time compensation expense paid during the quarter ended December 31, 2004 in connection with the REIT reorganization that was not paid in 2005, a $3.7 million decline in REIT reorganization related incentives, a decrease of $0.4 million in commissions, bonuses, and incentives, a $0.3 million decline in temporary help costs, and a $0.2 million decrease in contract services expense. These reductions in compensation were partially offset by $2.3 million of compensation costs recorded in the year ended December 31, 2005 related to the issuance of restricted stock awards, as well as increases of $0.2 million and $0.5 million in salaries and payroll tax expense, respectively. The $17.3 million of REIT reorganization related compensation expense was comprised of a $10.9 million charge related to the issuance of restricted stock units and a $6.4 million charge related to the conversion of Series E Preferred Stock Options, both of which occurred as a result of the REIT reorganization. The $0.4 million decline in commissions, bonuses and incentives was primarily due to the $665.1 million, or 9.0%, decrease in total loan originations during the year ended December 31, 2005 compared to the same period last year.
The $1.9 million decrease in medical and other benefit costs was principally attributable to reductions of $0.7 million, $0.6 million, and $0.6 million in workers compensation and group insurance costs, employee relocation expenses, and the 401(k) company match, respectively. The $8.8 million increase in deferred personnel costs on mortgage loans originated was due primarily to a change in the mix in the composition of loans originated during 2005 to a higher percentage of retail production which has a higher incremental cost when compared to the mix in the composition of mortgage production during 2004 which was comprised of more wholesale production.
Personnel expense grew by $1.6 million, to $62.7 million, during the six months ended December 31, 2004 over the comparable six-month period in 2003. This was comprised of increases of $22.0 million and $1.8 million in compensation and medical and other benefits, respectively, partially offset by a
56
$21.9 million increase in deferred loan origination costs and a $0.3 million decline in other personnel costs. The $22.0 million growth in compensation was comprised of $17.3 million of compensation paid in connection with the REIT reorganization, as described above, and $5.3 million of increased compensation, partially offset by a $0.7 million decline in commissions, bonuses and incentives. The $5.3 million increase in compensation resulted from higher staffing levels, principally in the retail branches and wholesale operations centers, during the six months ended December 31, 2004 over those during the comparable six-month period in 2003. The $0.7 million decline in commissions, bonuses and incentives was due to a decrease in management incentives. The $21.9 million growth in deferred personnel costs on mortgage loans originated but not yet sold was due primarily to the mix in the composition of loans originated and sold during the 2004 period when compared to those originated and sold during the 2003 period. The $1.8 million increase in medical and other benefit costs was attributable to increased costs for such benefits and higher staff levels.
Personnel expense grew by $42.6 million, to $160.2 million, during the year ended June 30, 2004 compared to the year ended June 30, 2003. This growth was comprised of increases of $38.6 million, $2.1 million, and $0.6 million in compensation, medical and other benefits, and other personnel costs, respectively, coupled with a $1.3 million decrease in deferred loan origination costs. The $38.6 million growth in compensation expense was attributable primarily to a $25.6 million increase in commissions, bonus, and incentives, and, to a lesser extent, a $13.0 million increase in salaries, temporary and overtime expenses, and payroll taxes. The $25.6 million growth in commissions, bonus, and incentives was due primarily to a $22.7 million increase in commissions earned by retail and wholesale account executives and was attributable to the $2.5 billion, or 57.2%, increase in total loan production during the year ended June 30, 2004 over the year ended June 30, 2003. To a lesser extent, commissions, bonus, and incentives grew due to a $2.9 million increase in incentive compensation related to senior management during the year ended June 30, 2004 over the year ended June 30, 2003. The $13.0 million growth in salary related expense resulted from higher staffing levels due primarily to the impact on head count caused by the increase in retail branches and wholesale operations centers during the year ended June 30, 2004 over the year ended June 30, 2003.
The $2.1 million growth in medical and other benefit costs during the year ended June 30, 2004 over the amount reported the prior year was attributable to increased costs for such benefits and increased staff levels. Deferred personnel costs on mortgage loans originated but not yet sold decreased by $1.3 million during the year ended June 30, 2004 from those reported a year earlier due primarily to the mix in the composition of loans originated and sold during the 2004 period when compared to those originated and sold during the 2003 period.
Production. Production expense declined by $1.2 million, to $35.4 million, during the year ended December 31, 2005 compared to the year ended December 31, 2004. This was primarily due to decreases of $1.2 million, $0.7 million, $0.2 million, and $0.1 million in appraisal costs, sales incentives, credit investigation expenses, and travel and entertainment expenses, respectively, partially offset by a $1.2 million increase in advertising costs. The overall decline in production expense was primarily due to the $665.1 million, or 9.0%, decrease in total loan originations during the year ended December 31, 2005 compared to the same period last year.
Production expense, when expressed as a percentage of total loan origination volume, remained constant at 0.5% for the year ended December 31, 2005 compared to the year ended December 31, 2004, primarily due to the decrease in loan production tracking the decrease in production expense during the year ended December 31, 2005 compared to the year ended December 31, 2004.
Production expense grew by $1.4 million, to $17.2 million during the six months ended December 31, 2004 compared to the six months ended December 31, 2003. This was due primarily to a $1.0 million increase in advertising expense, coupled with a $0.4 million increase in sales incentives relative to the
57
$430.7 million, or 13.6%, increase in our loan production volumes during the six months ended December 31, 2004 over production volumes during the six months ended December 31, 2003.
Production expense, when expressed as a percentage of total loan origination volume, remained constant at 0.5% for the six months ended December 31, 2004 and 2003 primarily due to the increases in loan production and production expense during the six months ended December 31, 2004 over amounts reported during the six months ended December 31, 2003.
Production expense grew by $9.3 million, to $35.1 million during the year ended June 30, 2004 compared to the year ended June 30, 2003. This was primarily due to increased advertising expenses relative to the $2.5 billion, or 57.2%, increase in our loan production volumes during the year ended June 30, 2004 over production volumes during the year ended June 30, 2003.
Production expense, when expressed as a percentage of total loan origination volume, was 0.5% and 0.6% for the years ended June 30, 2004 and 2003, respectively. The decrease in the percentage during the year ended June 30, 2004 from the percentage during the year ended June 30, 2003 is attributable to the $2.5 billion, or 57.2%, growth in total loan production during the year ended June 30, 2004 over the loan origination volume reported for the year ended June 30, 2003, partially offset by the 35.8% increase in production expense during the year ended June 30, 2004 over the year ended June 30, 2003.
General and Administrative. General and administrative expense declined by $4.5 million, to $44.7 million, during the year ended December 31, 2005 from $49.2 million during the year ended December 31, 2004. This was primarily due to decreases of $3.9 million, $3.5 million, $0.6 million, and $0.4 million in professional expense, provision for estimated uncollectible advances, depreciation and other, and communication expenses, respectively. In addition, we received a $1.6 million monoline insurance settlement received in connection with two off-balance sheet trusts that were called during 2005, which was recorded as a credit to our general and administrative expense.
From time to time, we are unable to fully realize advance receivables related to nonperforming mortgage collateral that is sold in the secondary markets. In connection with the pool calls we consummated during 2005, we received approximately $8.2 million of proceeds that we credited to our advance receivable allowance pending the disposition of the related nonperforming mortgage collateral. By December 31, 2005, substantially all of the nonperforming mortgage collateral acquired in our pool call transactions had been sold resulting in either the write-off or collection of the advance receivables. Based on our assessment of reduced future advance loss exposure related to remaining called collateral, we reduced our advance receivable allowance by $3.5 million through a credit to income.
The aforementioned declines in general and administrative expense were partially offset by increases of $3.7 million and $1.9 million in legal and occupancy costs, respectively. The $3.7 million growth in legal expense was primarily due to a $3.0 million mediated settlement on a litigation matter to which we agreed in the second quarter of 2005. Contributing to the $1.9 million increase in occupancy expense were $0.6 million of charges for terminations of branch operating leases and a corporate office operating lease. During the years ended December 31, 2005 and 2004, our rent payments totaled $12.0 million and $10.1 million, respectively, and we received total sublease payments of $1.5 million in each year.
General and administrative expense grew by $4.9 million, to $27.2 million, during the six months ended December 31, 2004 compared tothe six months ended December 31, 2003. This was due primarily to increases of $4.6 million, $0.8 million and $0.4 million in professional and legal fees, occupancy, and corporate related insurance expenses, respectively. These increases were partially offset by decreases of $0.7 million and $0.2 million in miscellaneous and communications expenses, respectively. The growth in professional and legal fees was due primarily to $4.1 million of costs incurred related to the REIT reorganization. The increase in occupancy is related to the growth in retail branches from 95 at December 31, 2003 to 96 at December 31, 2004 and to rental rate increases during the six months ended
58
December 31, 2004. The growth in corporate related insurance was attributable to premium increases passed through to us by carriers. The decline in miscellaneous expenses was primarily due to a $0.8 million decrease in the provision for estimated uncollectible servicing advances.
General and administrative expense grew by $0.8 million, to $44.5 million, during the year ended June 30, 2004 compared to the year ended June 30, 2003. This was primarily due to increases of $1.6 million, $1.2 million, $1.0 million and $0.8 million in occupancy, communication, corporate related insurance, and professional expenses, partially offset by decreases of $1.2 million and $2.7 million in legal and miscellaneous expenses, respectively. The growth in occupancy, communication and corporate related insurance costs was primarily due to the increase in the number of retail branches from 93 at June 30, 2003 to 99 at June 30, 2004. The $1.2 million decline in legal expense was primarily due to legal fees we incurred during the year ended June 30, 2003 in resolving certain litigation matters and in closing the exchange offer pursuant to which we exchanged $49.6 million of the outstanding 2006 Debentures that were tendered and issued in an equal amount of 5.5% Convertible Subordinated Debentures due March 2012 (the “2012 Debentures”). The $2.7 million decrease in miscellaneous expense was primarily due to the write-off in fiscal 2003 of $2.8 million of aged late fees receivable.
During the years ended June 30, 2004 and 2003, we paid total rental payments of $9.4 million and $8.1 million, respectively, and received total sublease payments of $1.4 million in each year.
Write-down of residual interests. During the years ended December 31, 2005 and 2004, the six months ended December 31, 2004 and 2003, and the year ended June 30, 2004, we did not record a write-down to our residual interests. However, during the year ended June 30, 2003, we recorded a write-down to our residual interests of $34.9 million.
The $34.9 million write-down consisted of a $31.9 million write-down during the three months ended December 31, 2002, plus a $3.0 million write-down recorded at June 30, 2003. During the quarter ended December 31, 2002, despite lower net credit losses on liquidations of mortgage loans in the off-balance sheet securitization trusts, we experienced higher than expected loss severities on such liquidations. During the same time, we also experienced higher than estimated prepayment speed activity for mortgage loans in the off-balance sheet securitization trusts due to the low mortgage interest rate environment prevailing in the United States. Therefore, we increased our credit loss assumptions, changed our annual prepayment rate assumptions and adjusted the underlying forward interest rate curve assumption used to estimate the fair value of our retained residual interests. The effect of these changes in estimates resulted in a $31.9 million write-down to the carrying value of our retained residual interests.
In August 2003, we notified the trustee of the securitization trusts of our intent to call four off-balance sheet securitization trusts. In estimating the effects on the carrying value of the retained residual interests of calling the mortgage loans in those off-balance sheet securitization trusts, we wrote down by $3.0 million the retained residual interests.
Debt Extinguishment Income. During the years ended December 31, 2005 and 2004, the six months ended December 31, 2004 and 2003, and the year ended June 30, 2004, we did not record any debt extinguishment income. During the year ended June 30, 2003, we recorded debt extinguishment income of $31.7 million. This was comprised of $25.0 million on forgiveness of 2012 Debentures owned by Specialty Finance Partners, $4.5 million on redemption of 2012 Debentures held by third parties, and $2.2 million on redemption of Senior Notes held by third parties.
On December 13, 2002, we consummated an exchange offer (the “Exchange Offer”), pursuant to which we exchanged $49.6 million of the outstanding 2006 Debentures and issued an equal amount of 2012 Debentures. In connection with the Exchange Offer, Specialty Finance Partners became the owner of
59
$41.6 million of 2012 Debentures, as it exchanged an equal amount of 2006 Debentures which it had previously acquired in open market purchase transactions. On December 23, 2002, we redeemed $19.8 million of the principal amount outstanding on the 2012 Debentures through a scheduled mandatory sinking fund payment, of which $16.6 million was paid to Specialty Finance Partners. On March 31, 2003, Specialty Finance Partners forgave its remaining $25.0 million principal balance of 2012 Debentures, which we recorded as debt extinguishment income. The remaining $4.7 million of our outstanding 2012 Debentures were fully redeemed on June 30, 2003 at the optional call price of 5.0%, or $0.2 million, of the outstanding principal balance, resulting in $4.5 million of debt extinguishment income.
During the year ended June 30, 2003, in a series of transactions that were all with unrelated parties, we purchased $22.1 million of the total $150.0 million principal balance of our Senior Notes at a discount from par for $19.9 million and recognized debt extinguishment income of $2.2 million. At June 30, 2003, we redeemed the remaining $127.9 million principal balance of our Senior Notes at par plus accrued and unpaid interest.
Income Tax Provision (Benefit)
During the years ended December 31, 2005 and 2004, we recorded an income tax provision (benefit) of $0.8 million and $(4.9) million, respectively. Our $0.8 million income tax provision for the year ended December 31, 2005 differed from an expected federal income tax benefit of $(1.9) million calculated at the federal marginal tax rate of 35.0% primarily due to the $28.4 million provision resulting from the increase in the tax valuation allowance, partially offset by the $22.5 million benefit related to the non-taxability of the REIT earnings and the $2.9 million state tax benefit. Our $(4.9) million income tax benefit for the year ended December 31, 2004 differed from an expected federal income tax provision of $12.9 million calculated at the federal marginal tax rate of 35.0% primarily due to the $21.6 million decrease in the tax valuation allowance and the $3.3 million income tax benefit related to the non-taxability of the REIT earnings, partially offset by a $6.9 million state tax provision and $1.1 million of non-deductible reorganization costs.
During the six months ended December 31, 2004 and 2003, we recorded an income tax provision (benefit) of $(5.2) million and $(18.0) million, respectively, which reflect effective tax (benefit) rates of (62.9)% and (64.5)%, respectively. Our $5.2 million tax benefit for the six months ended December 31, 2004 differed from an expected federal benefit of $2.9 million calculated at the marginal federal tax rate of 35.0% due to the $3.3 million benefit related to the non-taxability of the REIT earnings plus the $2.9 million benefit resulting from the decrease in the tax valuation allowance, partially offset by the $2.8 million state tax provision and $1.1 million of non-deductible reorganization costs. Our $18.0 million tax benefit for the six months ended December 31, 2003 differed from an expected federal tax expense of $9.8 million calculated at the federal marginal rate of 35.0% due to the $28.7 million decrease in valuation allowance, partially offset by $0.9 million of other items.
During the years ended June 30, 2004 and 2003, we recorded income tax benefits of $(17.7) million and $(1.8) million, respectively, which reflect effective tax rates of (24.2)% and (6.7)%, respectively. Our $(17.7) million tax benefit recorded during the year ended June 30, 2004 differed from the expected federal provision of $25.6 million calculated at the effective federal tax rate of 35.0% due to the $47.4 million federal benefit resulting from the decrease in the tax valuation allowance, partially offset by $6.3 million state tax provision which related to various state tax obligations. We determined that it was more likely than not that certain future tax benefits would be realized as a result of future income. Therefore, during the year ended June 30, 2004, our tax valuation account was decreased to recognize both anticipated future income and the current realization of deferred tax assets. We periodically undergo federal and state tax return examinations and may provide for additional liabilities for identified exposure items. During the three months ended June 30, 2003, a number of pending tax return audits were finalized and related tax liabilities were adjusted to the actual amounts due. This resolution resulted in an income
60
tax benefit of approximately $(6.0) million being recognized during the year ended June 30, 2003. Our REIT reorganization in November 2004 and Specialty Finance Partners’ investment during the year ended June 30, 1999 both resulted in a change in control for income tax purposes, thereby limiting our ability to use net operating loss carryforwards and certain other future deductions.
The following table presents changes in balance sheet account balances between December 31, 2005 and 2004 (in thousands):
|
| December 31, |
| Increase (Decrease) |
| |||||||
| 2005 |
| 2004 |
| $ |
| % |
| ||||
Loans held for sale, at lower of cost or market |
| $ | 951,177 |
| $ | 484,963 |
| $ | 466,214 |
| 96 | % |
Loans held for investment, net |
| 4,085,536 |
| 1,725,046 |
| 2,360,490 |
| 137 | % | |||
Advances and other receivables, net |
| 39,591 |
| 22,740 |
| 16,851 |
| 74 | % | |||
Residual interests, at estimated fair value |
| — |
| 39,082 |
| (39,082 | ) | (100 | )% | |||
Equipment and improvements, net |
| 10,810 |
| 8,840 |
| 1,970 |
| 22 | % | |||
Prepaid expenses and other |
| 30,713 |
| 22,076 |
| 8,637 |
| 39 | % | |||
Derivative financial instruments, at estimated fair value |
| 58,147 |
| 31,947 |
| 26,200 |
| 82 | % | |||
Financings on loans held for investment |
| 3,623,188 |
| 1,157,470 |
| 2,465,718 |
| 213 | % | |||
Revolving warehouse and repurchase facilities |
| 1,341,683 |
| 809,213 |
| 532,470 |
| 66 | % | |||
Borrowings |
| 16,487 |
| 7,680 |
| 8,807 |
| 115 | % | |||
Loans Held for Sale. Our portfolio of loans held for sale increased to $951.2 million at December 31, 2005 from $485.0 million at December 31, 2004 due primarily to total loan originations exceeding total loan sales and transfers of mortgage loans held for sale to loans held for investment during the year ended December 31, 2005.
Loans Held for Investment, Net. At December 31, 2005, our portfolio of loans held for investment, net was $4.1 billion, an increase of $2.4 billion over the $1.7 billion portfolio of loans held for investment at December 31, 2004. This increase was primarily due to our completion of $3.7 billion of four on-balance sheet securitizations during the year ended December 31, 2005, partially offset by mortgage loan runoff.
The portfolio of loans held for investment at December 31, 2005 and December 31, 2004 was net of a $43.4 million and $1.9 million allowance for loan losses, respectively. At December 31, 2005 and 2004, the allowance for loan losses when expressed as a percentage of the unpaid principal balance of loans held for investment was 1.05% and .11%, respectively. During the year ended December 31, 2005, we recorded a provision for loan losses of $40.3 million, transfer of $2.6 million from our servicing advance allowance, and net charge-offs of $1.4 million. The $2.6 million transfer was made in light of the Company’s assessment of credit risk to the portfolio of loans held for investment built in part with mortgage collateral from called off-balance sheet securitizations having aged servicing advances. We expect net charge-offs to increase in future periods as the loans in this portfolio become more seasoned, and fewer new loans are added.
Advances and Other Receivables. Advances and other receivables are comprised of interest and servicing advances, servicing and miscellaneous fees, accrued interest receivable and other miscellaneous receivables. Prior to June 30, 2005, advances and other receivables also included cash due from the off-balance sheet securitization trusts. The level of servicing advances, in any given period, depends upon portfolio delinquencies, the level of real estate owned and loans in the process of foreclosure, and the timing and remittance of cash collections on mortgage loans in the portfolio. We fund advances on a recurring basis not otherwise covered by financing arrangements, that we have in place from time to time, and recover those advances on a periodic basis.
61
Advances and other receivables increased by $16.9 million to $39.6 million at December 31, 2005 from $22.7 million at December 31, 2004. At December 31, 2005 and 2004, advances and other receivables was net of an advance receivable allowance of $1.9 million and $4.2 million, respectively. The increase was due primarily to an increase of $22.0 million in accrued interest and other receivables, partially offset by decreases of $4.3 million and $0.8 million in principal, interest, and servicing advances and cash due from securitization trusts, respectively.
The $22.0 million increase in accrued interest and other receivables at December 31, 2005 over the balance at December 31, 2004 is due primarily to an $18.7 million increase in accrued interest receivable relative to the increase in the balance of loans held for investment together with a $3.3 million increase in amounts due from counterparties. The $4.3 million decrease in principal, interest, and servicing advances was primarily due to recoveries of prior advances as a result of the call of our remaining off-balance sheet securitization trusts for which we serviced the loans. The $0.8 million decline in cash due from securitization trusts was due to having no residual balances at December 31, 2005.
Residual Interests. We did not have any residual interests at December 31, 2005 compared to $39.1 million at December 31, 2004. During the year ended December 31, 2005, we called the remaining off-balance sheet securitization trusts in which we retained residual interests and applied $39.1 million of cash received from these trusts to our outstanding balance of residual interests.
Equipment and Improvements, Net. Equipment and improvements, net, increased by $2.0 million, to $10.8 million at December 31, 2005 from $8.8 million at December 31, 2004 reflecting capital expenditures on new equipment and improvement acquisitions outpacing depreciation and amortization during the year ended December 31, 2005.
Prepaid Expenses and Other. Prepaid expenses and other increased by $8.6 million to $30.7 million at December 31, 2005 from $22.1 million at December 31, 2004. The increase was due to increases of $6.1 million and $7.1 million in unamortized debt issuance costs and real estate owned, respectively, partially offset by decreases of $2.3 million, $1.2 million, $0.9 million, and $0.2 million in licensing, permit and performance bond deposits; defunded loans; unamortized commitment fees; and, prepaid expenses, security deposits, and other deferred charges, respectively.
Derivative Financial Instruments. Derivative financial instruments increased by $26.2 million to $58.1 million at December 31, 2005 from $31.9 million at December 31, 2004. At December 31, 2005, we had notional amounts of $5.9 billion of interest rate cap agreements compared to $2.5 billion at December 31, 2004 in place to hedge rate risk exposure to our portfolio of mortgage loans held for investment and related financings. We carry our derivative financial instruments at estimated fair value. Included in interest expense during the year ended December 31, 2005, was a $0.1 million charge related to the negative mark to fair value of our interest rate cap agreements at December 31, 2005.
Financings on Loans Held for Investment. Amounts outstanding under our financings on loans held for investment increased by $2.5 billion to $3.6 billion at December 31, 2005 from $1.2 billion at December 31, 2004, primarily resulting from the four on-balance sheet securitizations that closed during the year ended December 31, 2005, partially offset by principal reductions during the year.
Revolving Warehouse and Repurchase Facilities. Amounts outstanding under revolving warehouse and repurchase facilities increased by $532.5 million to $1.3 billion at December 31, 2005 over $809.2 million at December 31, 2004, primarily as a result of increased reliance on the facilities to fund loans held for sale and loans held for investment prior to their securitization. Proceeds from whole loan sales and securitizations are used first to reduce balances outstanding under our revolving warehouse and repurchase facilities, and then used to satisfy corporate operating requirements.
Borrowings. At December 31, 2005, we had $16.5 million of borrowings outstanding under short-term collateral financings compared to $7.7 million at December 31, 2004. The increase in borrowing
62
resulted from increased advances under a facility at December 31, 2005 that was not in place at December 31, 2004.
Liquidity and Capital Resources
Our operations require access to short-term and long-term sources of cash.
Our primary sources of liquidity are expected to be
· fundings under revolving warehouse and repurchase facilities;
· fundings from financings on loans held for investment;
· the proceeds from the sale of mortgage loans;
· the proceeds from monetization of retained mortgage-backed bonds from our on-balance sheet securitizations; and
· the proceeds from the issuance of debt and equity securities.
Our primary operating cash requirements include:
· the funding of mortgage loan originations and purchases prior to their securitization and sale;
· interest and principal payments on financings on loans held for investment;
· interest and principal payments and liquidity requirements under our revolving warehouse and repurchase facilities, and other borrowings;
· advances in connection with our servicing portfolio;
· overcollateralization requirements in connection with on-balance sheet securitizations;
· fees, expenses and hedging costs, if any, incurred in connection with the securitization and sale of loans; and
· ongoing administrative, operating, and tax expenses.
Revolving Warehouse and Repurchase Facilities. We borrow substantial sums of cash on a regular basis to originate mortgage loans and to hold loans in our REIT portfolio prior to securitization. Therefore, we rely on revolving warehouse and repurchase facilities to finance the origination and holding of mortgage loans prior to securitization or sale.
At December 31, 2005, we had total revolving warehouse and repurchase facilities in the amount of $2.8 billion, of which $2.7 billion and $0.1 billion were committed and uncommitted, respectively. At December 31, 2005, amounts outstanding under our facilities totaled $1.3 billion, leaving us with $1.5 billion of available committed borrowing capacity under the facilities. Of the $2.8 billion of revolving warehouse and repurchase facilities available at December 31, 2005, $300.0 million, $700.0 million, $500.0 million, $300.0 million, $500.0 million and $500.0 million are scheduled to mature on March 24, 2006, April 3, 2006, August 4, 2006, September 29, 2006, December 1, 2006 and January 17, 2007, respectively. While no assurance can be made, we expect to renew our warehouse facilities on the same or similar terms at or prior to their maturity.
At December 31, 2004, we had total revolving warehouse and repurchase facilities in the amount of $2.6 billion, of which $2.5 billion and $0.1 billion were committed and uncommitted, respectively. At December 31, 2004, amounts outstanding under our facilities totaled $809.2 million, leaving us with approximately $1.8 billion of available borrowing capacity under the facilities.
63
Certain of the warehouse and repurchase facility lenders advance less than 100% of the principal balance of the mortgage loans originated, requiring the use of our working capital to fund the remaining portion. The revolving warehouse and repurchase facility agreements contain provisions requiring us to meet certain periodic financial covenants, including, among other things, minimum liquidity, stockholders’ equity, leverage, and net income levels. The facility agreements also contain customary representations and warranties.
Although our actual debt to equity ratio may vary from time to time depending on market conditions and other factors that our management and board of directors deem relevant, in general, our credit facilities limit our total debt-to-equity ratio to a level of 20.0 to 1.0. However, each of our credit facility lenders disregards nonrecourse financing, including the bonds underlying our on-balance sheet securitizations, in computing our adjusted leverage ratio, which is limited to 7.0 to 1.0. We were in compliance with these ratios at December 31, 2005.
Fundings from Financings on Loans Held for Investment. Our ability to generate fundings from financings on loans held for investment is necessary to generate cash proceeds to pay down our revolving warehouse and repurchase facilities which fund loans held for investment prior to their on-balance sheet securitization.
During the year ended December 31, 2005, our financings on loans held for investment increased by $2.5 billion, to $3.6 billion at December 31, 2005, primarily resulting from four on-balance sheet securitizations that closed during the period.
Proceeds from the Sale of Mortgage Loans. Our ability to sell loans we originate in the secondary market through whole loan sales is necessary to generate cash proceeds to pay down our revolving warehouse and repurchase facilities and fund mortgage loan originations. Our ability to sell loans in the secondary market on acceptable terms is essential for the continuation of our loan origination operations.
During the years ended December 31, 2005 and 2004, we sold $2.8 billion and $5.9 billion of mortgage loans through whole loan sales for cash to the secondary market, respectively. The $3.1 billion decline in whole loan sales during the year ended December 31, 2005 from the comparable period a year ago is due to our retention of a significant portion of our mortgage loan production to build our REIT portfolio of loans held for investment.
During the six months ended December 31, 2004 and 2003, we sold $2.4 billion and $2.9 billion of mortgage loans through whole loan sales for cash to the secondary market, respectively. The $509.1million decline in whole loan sales during the six months ended December 31, 2004 from the comparable six-month period in 2003 is due to our retaining a significant portion of our mortgage loan production to build our portfolio of loans held for investment.
During the year ended June 30, 2004, we sold $6.4 billion of mortgage loans through whole loan sales for cash to the secondary market. No loans were sold through off-balance sheet securitizations. During the year ended June 30, 2003, we sold $4.2 billion and $315.0 million through whole loan sales and off-balance sheet securitizations, respectively. The gain on sale we recognized on off-balance sheet securitizations and whole loan sales is affected by, among other things, market conditions at the time of the loan disposition, and our assumptions used in off-balance sheet securitizations. See “Results of Operations—Noninterest Income.” In connection with off-balance sheet securitization transactions, we are generally required to provide credit enhancements in the form of overcollateralization amounts or reserve accounts. In addition, during the life of the related securitization trusts, we subordinate a portion of the excess cash flow otherwise due it to the rights of holders of senior interests as a credit enhancement to support the sale of the senior interests.
Monetization of Retained Mortgage-Backed Bonds from Our On-Balance Sheet Securitizations. At December 31, 2005, we were party to a revolving short-term collateralized financing facility pursuant to
64
which $35.6 million at par value of retained bonds was pledged as collateral. Amounts outstanding under the facility at December 31, 2005 of $16.5 million were subject to interest at one-month or one-week LIBOR, plus 65 to 150 basis points, depending on the term of the requested advance.
During January 2006, we elected to issue the retained bonds and the proceeds from the issuance were used to fully repay amounts outstanding under the facility.
Proceeds from the Issuance of Debt and Equity Securities. On November 4, 2005, our Form S-3 shelf registration statement, filed for the purpose of selling our common stock, preferred stock, debt securities or other securities in one or more offerings up to an aggregate dollar amount of $500.0 million, was declared effective by the Securities and Exchange Commission (“SEC”). Depending on our liquidity needs and market conditions, we may issue one or more of these securities in different amounts and at different times. We intend to use the proceeds from any sale of these securities for general corporate purposes, which includes continuing to build a portfolio of self-originated mortgage loans, for general working capital purposes and to reduce short-term indebtedness.
Cash Flow. The following summarizes our material cash flow activities during the years ended December 31, 2005 and 2004, the six months ended December 31, 2004 and 2003, and the years ended June 30, 2004 and 2003:
The principal operating activities which effect our net cash provided by or used in such activities in any period are (i) the increase or decrease in loan production, and the mix of that production between wholesale and retail, which causes an increase or decrease in the use of cash, respectively; (ii) the increase or decrease in the level of loan sales, which causes an increase or decrease in cash provided, respectively; and (iii) net income.
During the year ended December 31, 2005, our net cash used in operating activities grew by $706.2 million, to $450.8 million, from the $255.4 million of net cash provided by operating activities during the year ended December 31, 2004. This was primarily due to a $672.1 million increase in cash used to fund originations of loans held for sale, net of proceeds from loan sales, as well as to a $48.0 million decline in net income, partially offset by a $13.9 million change in other operating items.
During the year ended December 31, 2005, our net cash used in investing activities increased by $675.4 million, to $2.4 billion, over the $1.7 billion for the same period last year and was attributable to our strategy of building a REIT portfolio of loans held for investment. If we increase our REIT portfolio of loans held for investment, we will continue to use cash in that investing activity. However, our REIT portfolio of loans held for investment is currently stabilized at a level we deem appropriate.
During the year ended December 31, 2005, our net cash provided by financing activities grew by $1.4 billion, to $2.9 billion, over the $1.5 billion for the year ended December 31, 2004. This was primarily attributable to a $1.3 billion increase in financings on loans held for investment, coupled with a $326.3 million increase in revolving warehouse and repurchase facilities. These were partially offset by $226.5 million of net capital raised during 2004 in connection with the recapitalization and reorganization, as well as a $55.0 million increase in cash used for dividend payments during the year ended December 31, 2005 over the prior year. The primary activities affecting our cash flows from financing activities are increases and decreases in the levels of financings of loans held for investment and borrowings under our revolving warehouse and repurchase facilities. In addition, cash flows from financing activities include capital related cash flows.
During the six months ended December 31, 2004, our net cash provided by operating activities grew by $670.9 million, to $511.2 million, over the $159.6 million of net cash used in operating activities during the six months ended December 31, 2003. This was primarily due to a $817.1million increase in proceeds from sales of loans held for sale, net of cash used to fund loan originations, partially offset by $48.9 million decline in net income and a $97.3 million change in other operating items.
65
During the six months ended December 31, 2004, our net cash used in investing activities increased by $1.7 billion, to $1.7 billion, over the comparable six-month period during 2003 and was attributable to our strategy of building our REIT portfolio of loans held for investment.
During the six months ended December 31, 2004, our net cash provided by financing activities grew by $1.1 billion, to $1.2 billion, over the $149.5 million for the six months ended December 31, 2003. This was primarily attributable to a $1.2 billion increase in financing on loans held for investment, as well as $226.5 million in net capital raised during the 2004 period and a $54.6 million decline in dividend payments on preferred stock. Partially offsetting these factors were uses of cash to fund reductions of $336.6 million and $19.3 million in revolving warehouse and repurchase facilities and borrowings, respectively.
During the year ended June 30, 2004, our net cash used in operating activities grew by $557.2 million, to $415.5 million, over the $141.7 million of net cash provided by operating activities during the year ended June 30, 2003. This was primarily due to a $660.5 million increase in cash used to fund originations or loans held for sale, net of proceeds from loan sales, partially offset by a $61.5 million increase in net income and a $41.8 million change in other operating items.
During the year ended June 30, 2004, our net cash provided by financing activities grew by $551.4 million, to $418.4 million, over the $133.1 million of net cash used in financing activities during the year ended June 30, 2003. This was primarily attributable to a $582.2 million increase in our revolving warehouse and repurchase facilities used to fund the growth in the origination of loans held for sale during fiscal 2004 over such levels in fiscal 2003. To a lesser extent, net cash provided by financing activities grew due to a $33.5 million decline in the use of cash to reduce borrowings. These factors were partially offset by a $64.3 million increase in the payment of preferred stock dividends.
As a financial institution, our lending and borrowing functions are integral parts of our business. When evaluating sources and uses of cash, we consider cash used to increase our assets and borrowings used to finance those assets separately from our operating cash flows. Our most significant use of cash is for the acquisition of loans held for sale, which is funded primarily through borrowings under our revolving warehouse and repurchase facilities. In accordance with U.S. GAAP, originations of loans held for sale, net of sales of such loans, are required to be included in our consolidated statements of cash flows as a component of cash flows from operating activities. However, borrowings used to fund such loans, and repayment of such borrowings, are required to be included in the consolidated statements of cash flows as a component of cash flows from financing activities.
The amount of net originations of loans held for sale included as a component of cash flows used in operating activities was $466.2 million during the year ended December 31, 2005 compared to $205.9 million as a component of cash provided by operating activities for the year ended December 31, 2004. Excluding the origination and sale activity of loans held for sale, our operating activities provided $18.0 million and $38.6 million of cash during the years ended December 31, 2005 and 2004, respectively.
The amount of net originations of loans held for sale included as a component of cash flows provided by operating activities was $527.2 million during the six months ended December 31, 2004 compared to $289.9 million as a component of cash used in operating activities for the same period in 2003. Excluding the origination and sale activity of loans held for sale, our operating activities used $26.9 million and provided $130.2 million of cash during the six months ended December 31, 2004 and 2003, respectively.
The amount of net originations of loans held for sale included as a component of cash flows used in operating activities was $605.3 million during the year ended June 30, 2004 compared to $55.2 million as a component of cash provided by operating activities for the year ended June 30, 2003. Excluding the origination and sale activity of loans held for sale, our operating activities provided $189.8 million and $86.5 million of cash during the years ended June 30, 2004 and 2003, respectively.
66
At December 31, 2005, we had net operating liquidity of $51.9 million, which consisted of $36.1 million of unrestricted cash and cash equivalents, $9.2 million of drawing capacity under a short-term collateralized financing facility, and approximately $6.6 million of cash that could be immediately raised through the pledging of unencumbered and eligible loans held for sale as collateral pursuant to committed revolving warehouse and repurchase facilities. We currently believe that our net operating liquidity level is sufficient to satisfy our operating requirements.
If our access to warehouse lines, working capital, or the securitization or whole loan markets is restricted, we may have to seek additional equity. There can be no assurance that sufficient sources of liquidity will be available to us at any given time or that favorable terms will be available. If we are unable to maintain sufficient liquidity, we would be restricted in the amount of loans that we will be able to produce and sell, which would negatively impact profitability and jeopardize our ability to continue to operate as a going concern.
The following table summarizes our material contractual obligations as of the date indicated (in millions):
|
| December 31, 2005 |
| |||||||||||||||||
|
| Total |
| Less Than |
| 1-3 |
| 3-5 |
| More Than |
| |||||||||
Financing on loans held for investment |
| $ | 3,638.4 |
|
| $ | 1,498.4 |
|
| $ | 1,528.5 |
| $ | 385.1 |
|
| $ | 226.4 |
|
|
Revolving warehouse and repurchase agreements |
| 1,341.7 |
|
| 1,341.7 |
|
| — |
| — |
|
| — |
|
| |||||
Borrowings |
| 16.5 |
|
| 16.5 |
|
| — |
| — |
|
| — |
|
| |||||
Operating leases, net |
| 49.6 |
|
| 12.3 |
|
| 21.8 |
| 10.3 |
|
| 5.2 |
|
| |||||
Purchase and other obligations |
| 0.5 |
|
| 0.4 |
|
| 0.1 |
| — |
|
| — |
|
| |||||
Total |
| $ | 5,046.7 |
|
| $ | 2,869.3 |
|
| $ | 1,550.4 |
| $ | 395.4 |
|
| $ | 231.6 |
|
|
Our revolving warehouse and repurchase agreements contain terms which require us to meet periodic financial covenants and other contractual obligations as on-going conditions to borrow. If we are unable to comply with the financial covenants or the other contractual obligations going forward, or if we are unable to obtain subsequent amendments or waivers, if required, the lenders can declare default events. If we do not cure the default events, the lenders are entitled to liquidate the residential mortgage loans which collateralize borrowings under the revolving warehouse and repurchase facilities to recover funds advanced.
At December 31, 2005 and 2004, we had notional amounts of $5.9 billion and $2.5 billion, respectively, of interest rate cap agreements in place to hedge interest rate risk exposure to our portfolio of mortgage loans held for investment and related financings. Interest expense during the year ended December 31, 2005 included a charge of $0.1 million related to the negative mark to market of these interest rate cap agreements at December 31, 2005. During the year ended December 31, 2004, interest expense included a credit of $6.3 million related to the positive mark to market of interest rate cap agreements at December 31, 2004. Interest income during the years ended December 31, 2005 and 2004 included $27.4 million and $0.5 million of income related to remittances to us from counterparties on in-the-money interest rate cap agreements.
During the year ended December 31, 2004, we entered into agreements to hedge interest rate risk exposure to our inventory and pipeline of mortgage loans held for sale. Gain on sale of loans during the
67
year ended December 31, 2004 included a charge of $3.3 million, which primarily related to hedge losses recorded on interest rate cap agreements that closed during the period related to hedging interest rate risk on loans held for sale.
We continually monitor the interest rate environment and our hedging strategies. However, there can be no assurance that our earnings would not be adversely affected during any period of unexpected changes in interest rates or prepayment rates, including charges to earnings on future derivative contracts into which we may enter.
Sale of Loans—Interest Rate Risk. We are exposed to rising interest rates for loans originated or purchased which are held pending sale in the whole loan market. Currently, we mitigate exposure to interest rate changes through whole loan sale forward contracts. From time to time, we mitigate exposure to rising interest rates through the use of interest rate cap agreements, forward interest rate swap agreements, or other hedging activities. These hedging activities help mitigate the risk of absolute movements in interest rates.
Interest Rate Sensitive Assets
Residual Interests. We had no residual interests at December 31, 2005 and $39.1 million at December 31, 2004. These instruments were recorded at estimated fair value at December 31, 2004. We valued these assets based on the present value of future revenue streams, net of expenses, using various assumptions. The weighted average discount rate used to calculate the present value of the residual interests was 13.7% at December 31, 2004. The weighted average life of the mortgage loans used for valuation at December 31, 2004 was 2.0 years.
Fair Value of Financial Instruments. Our financial instruments, which are recorded at contractual amounts that approximate market or fair value, primarily consist of loans held for sale, advances and other receivables, and revolving warehouse and repurchase facilities. As these amounts are short term in nature and/or generally bear market rates of interest, the carrying amounts of these instruments are reasonable estimates of their fair values. Our financial instruments also include our loans held for investment which are recorded at contractual amounts. The fair value of our loans held for investment are based on current market prices for similar loans using current investor yield requirements. The carrying amount of our warehouse borrowings approximates fair value when valued using available quoted market prices.
Interest Rate Risk. We are exposed to on-balance sheet interest rate risk related to our loans held for investment and loans held for sale.
Warehouse Facilities Exposure. We utilize warehouse and repurchase financing facilities to facilitate the holding of mortgage loans prior to sale and securitization. At December 31, 2005 and 2004, we had total revolving warehouse and repurchase facilities available in the amount of $2.8 billion and $2.6 billion, respectively. At December 31, 2005 and 2004, amounts committed under such facilities were $2.7 billion and $2.5 billion, respectively. The total amount outstanding related to these facilities was $1.3 billion and $809.2 million at December 31, 2005 and 2004, respectively. Drawings available to us under the facilities were $1.5 billion and $1.8 billion at December 31, 2005 and 2004, respectively. Revolving warehouse and repurchase facilities are typically for a term of one year or less and are designated to fund mortgages originated within specified underwriting guidelines. The majority of the assets remain in the facilities for a period of up to 90 days at which point they are securitized or sold to institutional investors. As these amounts are short term in nature and/or generally bear market rates of interest, the contractual amounts of these instruments are reasonable estimates of their fair values.
68
The following tables illustrate the timing of the maturities of our interest rate sensitive assets and liabilities as of the dates indicated (in thousands):
|
| Maturity Range |
|
|
| |||||||||||||||||||
December 31, 2005 |
|
|
| Zero to |
| 6 Months |
| 1-2 |
| 3-4 |
| 5-6 |
| Thereafter |
| Total |
| |||||||
Interest rate sensitive assets: |
|
|
|
|
|
|
|
|
|
|
|
|
|
|
| |||||||||
Cash and cash equivalents |
| $ | 123,172 |
| $ | — |
| $ | — |
| $ | — |
| $ | — |
| $ | — |
| $ | 123,172 |
| ||
Loans held for sale, |
| 951,177 |
| — |
| — |
| — |
| — |
| — |
| 951,177 |
| |||||||||
Loans held for investment, net |
| 856,993 |
| 816,289 |
| 1,221,175 |
| 855,266 |
| 143,890 |
| 191,923 |
| 4,085,536 |
| |||||||||
Interest rate cap agreements |
| 58,147 |
| — |
| — |
| — |
| — |
| — |
| 58,147 |
| |||||||||
Total interest rate sensitive assets |
| $ | 1,989,489 |
| $ | 816,289 |
| $ | 1,221,175 |
| $ | 855,266 |
| $ | 143,890 |
| $ | 191,923 |
| $ | 5,218,032 |
| ||
Interest rate sensitive |
|
|
|
|
|
|
|
|
|
|
|
|
|
|
| |||||||||
Short-term collateralized financing facility |
| $ | 16,487 |
| $ | — |
| $ | — |
| $ | — |
| $ | — |
| $ | — |
| $ | 16,487 |
| ||
Revolving warehouse and repurchase facilities |
| 1,341,683 |
| — |
| — |
| — |
| — |
| — |
| 1,341,683 |
| |||||||||
Financings on loans held for investment |
| 768,926 |
| 729,479 |
| 1,057,794 |
| 720,561 |
| 135,214 |
| 226,428 |
| 3,638,402 |
| |||||||||
Total interest |
| $ | 2,127,096 |
| $ | 729,479 |
| $ | 1,057,794 |
| $ | 720,561 |
| $ | 135,214 |
| $ | 226,428 |
| $ | 4,996,572 |
| ||
Excess of interest rate sensitive assets over interest rate sensitive liabilities |
| $ | (137,607 | ) | $ | 86,810 |
| $ | 163,381 |
| $ | 134,705 |
| $ | 8,676 |
| $ | (34,505 | ) | $ | 221,460 |
| ||
Cumulative net interest rate sensitivity gap |
| $ | (137,607 | ) | $ | (50,797 | ) | $ | 112,584 |
| $ | 247,289 |
| $ | 255,965 |
| $ | 221,460 |
| $ | 221,460 |
| ||
69
|
| Maturity Range |
|
|
| |||||||||||||||||||
December 31, 2004 |
|
|
| Zero to |
| 6 Months |
| 1-2 |
| 3-4 |
| 5-6 |
| Thereafter |
| Total |
| |||||||
Interest rate sensitive assets: |
|
|
|
|
|
|
|
|
|
|
|
|
|
|
| |||||||||
Cash and cash equivalents |
| $ | 37,780 |
| $ | — |
| $ | — |
| $ | — |
| $ | — |
| $ | — |
| $ | 37,780 |
| ||
Loans held for sale, net |
| 484,963 |
| — |
| — |
| — |
| — |
| — |
| 484,963 |
| |||||||||
Loans held for investment, net |
| 150,567 |
| 223,516 |
| 608,267 |
| 341,716 |
| 138,475 |
| 262,505 |
| 1,725,046 |
| |||||||||
Interest rate cap agreements |
| 31,947 |
| — |
| — |
| — |
| — |
| — |
| 31,947 |
| |||||||||
Total interest rate sensitive assets |
| $ | 705,257 |
| $ | 223,516 |
| $ | 608,267 |
| $ | 341,716 |
| $ | 138,475 |
| $ | 262,505 |
| $ | 2,279,736 |
| ||
Interest rate sensitive |
|
|
|
|
|
|
|
|
|
|
|
|
|
|
| |||||||||
Financing facility |
| $ | 7,680 |
| $ | — |
| $ | — |
| $ | — |
| $ | — |
| $ | — |
| $ | 7,680 |
| ||
Revolving warehouse and repurchase facilities |
| 809,213 |
| — |
| — |
| — |
| — |
| — |
| 809,213 |
| |||||||||
Financings on loans held for investment |
| 104,942 |
| 155,785 |
| 423,947 |
| 225,845 |
| 78,897 |
| 170,320 |
| 1,159,736 |
| |||||||||
Total interest rate sensitive liabilities |
| $ | 921,835 |
| $ | 155,785 |
| $ | 423,947 |
| $ | 225,845 |
| $ | 78,897 |
| $ | 170,320 |
| $ | 1,976,629 |
| ||
Excess of interest rate sensitive assets over interest rate sensitive liabilities |
| $ | (216,578 | ) | $ | 67,731 |
| $ | 184,320 |
| $ | 115,871 |
| $ | 59,578 |
| $ | 92,185 |
| $ | 303,107 |
| ||
Cumulative net interest rate sensitivity gap |
| $ | (216,578 | ) | $ | (148,847 | ) | $ | 35,473 |
| $ | 151,344 |
| $ | 210,922 |
| $ | 303,107 |
| $ | 303,107 |
| ||
70
Our business requires a significant amount of cash, and if it is not available, our business and financial performance will be significantly harmed.
We require substantial amounts of cash to fund our loan originations and to pay loan origination expenses. We finance the majority of the loans we make by borrowing from our revolving warehouse and repurchase facilities and pledging the loans made as collateral. While holding our loans pending sale or securitization, we may also require cash, as our warehouse lines may not fully fund the entire principal balance of our loans financed with the facility. In addition, if our loans are financed past the permitted term under our warehouse lines, or if they decline in value, we will need cash to reduce our borrowing under the warehouse lines to the permitted level. We may also need cash for working capital to satisfy our financial covenants in our warehouse and repurchase facilities, and other needs.
Our earnings may decrease because of increases in interest rates.
Our profitability may be directly affected by changes in interest rates. Any such changes in interest rates could harm our results of operations, financial condition and business prospects. The following are some of the risks we face related to an increase in interest rates:
· Our net interest income depends in large part on differences between interest earned on our mortgage loans, net of provisions for loan losses and our financing costs. The interest on our mortgage loans is generally fixed for the first two or three years from origination, while our on-balance sheet financings generally pay an adjustable LIBOR-based yield. Therefore, an increase in LIBOR reduces the net interest income we receive from these mortgage loans. Consequently, increases in interest rates, particularly short-term interest rates, may decrease our net income. Interest rate fluctuations resulting in our interest expense exceeding our interest income would result in operating losses for us.
· The value of our loans is determined in part by the difference between interest earned on our mortgage loans and short-term interest rates on treasuries and other securities. Therefore, if interest rates rise between the date of origination and the date we sell or securitize the loans, the value of our loans may decline.
· Interest rate increases may harm our earnings by increasing our costs of funding and securitizing our loans and if we do not increase the interest rate we receive on our mortgage loans by the amount of the increase in our funding costs, the spread between the interest we receive on our mortgage loans and our funding costs is reduced.
· Our adjustable-rate mortgage loans have periodic and lifetime interest rate caps above which the interest rate on the loans may not rise. If general interest rates increase, the rate of interest on these mortgage loans could be limited, while the rate payable on the senior certificates representing interests in a securitization trust into which these loans are sold may be uncapped. This would reduce the amount of cash we receive over the life of the loans in on-balance sheet securitizations.
· An increase in interest rates could reduce our loan origination volume because refinancings of existing loans, including cash-out refinancings, would be less attractive, and qualifying for a purchase loan or refinancing may be more difficult. Lower origination volume may reduce our earnings by reducing gain on sale of loans, net interest income and loan origination income.
· An increase in interest rates could increase the delinquency and default rates on the adjustable-rate mortgage loans that we originate and hold because the borrowers’ monthly payments under such loans may increase beyond the borrowers’ ability to pay. A substantial portion of our portfolio
71
consists of hybrid/adjustable rate loans which may adjust up to three percent at the first adjustment date and could cause a monthly payment increase of up to one third. Higher than anticipated delinquencies or losses may decrease our cash flows or impair our ability to sell or securitize loans in the future, which could harm our results of operations, financial condition and business prospects.
The delinquency and default rates in our portfolio may be higher than those prevailing in the mortgage banking industry due to the origination of lower credit grade mortgage loans, which may cause us losses.
Residential mortgage loans are secured by residential properties and are subject to risks of delinquency and foreclosure, and risks of loss. Our principal market includes subprime borrowers who have credit histories that may limit their access to credit. Subprime borrowers typically have higher rates of delinquency and default than prime borrowers. Delinquency interrupts the flow of interest income from a mortgage loan, and default can ultimately lead to a loss if the net realizable value of the real property securing the mortgage loan is insufficient to cover the principal and interest due on the loan. If the delinquency and defaults in the loans in our portfolio exceed our projections, our income will decrease.
We bear the risk of delinquency and default on loans beginning when we originate them. In whole loan sales, our risk of delinquency typically extends to the first few payments after sale, and we may be obligated to repurchase loans that become delinquent during that period. When we securitize our loans, we are exposed to delinquencies and losses through the life of the loans underlying our on-balance sheet securitizations structured as financings. We attempt to manage these risks with risk-based loan pricing and appropriate underwriting policies and loan collection methods. However, we cannot be certain that such policies and methods will control our delinquency and default risks and, if such policies and methods are insufficient to control our delinquency and default risks, our business, financial condition, liquidity and results of operations could be harmed. Moreover, we establish an allowance for credit losses on our portfolio based on our anticipated delinquencies and losses in our portfolio. However, if our actual delinquency and credit losses exceed our estimates, our business, financial condition and results of operations could be harmed.
We face intense competition in the business of originating, purchasing and selling mortgage loans, which may make it difficult for us to compete successfully, and decrease our market share and our earnings.
We face intense competition in the business of originating, purchasing and selling mortgage loans. Many of our competitors are substantially larger and have considerably greater financial resources and lower costs of capital than we do. In addition, certain government-sponsored entities, such as Fannie Mae and Freddie Mac, are also expanding their participation in the subprime mortgage industry. These government-sponsored entities have a size and cost-of-funds advantage that allows them to purchase loans with lower rates or fees than we are willing to offer. In addition, establishing a wholesale lending operation such as ours requires a relatively small commitment of capital and human resources. This low barrier to entry permits new competitors to enter our markets quickly and compete with our wholesale lending business. Additional competition may lower the rates we can charge borrowers and increase the cost to originate mortgage loans. Increased competition may also reduce the volume of our mortgage loan originations and mortgage loan sales. As a result, we may not be able to acquire sufficient mortgage-related assets with favorable yields over our borrowing costs, which could harm our results of operations, financial condition and business prospects. Moreover, the increased competition may increase the demand for our experienced personnel and the potential that such personnel will leave for competitors. If our competitors are able to attract some of our key employees and disrupt our broker relationships, it could harm our results of operations, financial condition and business prospects.
The intense competition in the subprime mortgage industry has also led to rapid technological developments, evolving industry standards and frequent releases of new products and enhancements. As mortgage products are offered more widely through alternative distribution channels, such as the Internet,
72
we may be required to make significant changes to our current wholesale and retail structures and information systems to compete effectively. Our inability to continue enhancing our current Internet capabilities, or to adapt to other technological changes in the industry, could harm our results of operations, financial condition and business prospects.
Our inability to realize cash proceeds from loan sales and securitizations in excess of the loan acquisition cost could hurt our financial performance.
To continue our mortgage loan origination and purchase operations, we must be able to sell our mortgage loans in the whole loan sale and securitization markets on at least a quarterly basis. The net cash proceeds received from loan sales and securitizations consist of the proceeds received from such sales and securitizations, plus the premiums we receive on sale of loans in excess of the outstanding principal balance, minus the securitizations and the discounts on loans that we have to sell for less than the outstanding principal balance. We use the cash proceeds from these sales to pay down warehouse and repurchase facilities and make new mortgage loans. The value of the mortgage loans depends on a number of factors, including general economic conditions, interest rates and governmental regulations. In addition, we rely on institutional purchasers, such as investment banks, financial institutions and other mortgage lenders, to purchase bonds issued in securitization transactions and mortgage loans in the whole loan market. If we are unable to originate loans at a cost lower than the cash proceeds realized from loan sales, that inability could harm our results of operations, financial condition and business prospects. In addition, adverse changes in the securitization and whole loan markets may affect our ability to securitize or sell our mortgage loans for acceptable prices within a reasonable period of time, which would hurt our earnings, financial condition and business prospects.
A downturn in the residential mortgage origination business, which is a cyclical industry, may harm our operations.
The mortgage origination business has historically been a cyclical industry, enjoying periods of strong growth and profitability followed by periods of shrinking volumes and industry-wide losses. The residential mortgage industry experienced rapid growth through 2004 due to declining interest rates. However, short-term interest rates have risen recently and during periods of rising interest rates, refinancing originations decrease, as higher interest rates provide reduced economic incentives for borrowers to refinance their existing mortgages. Our mortgage originations decreased in 2005 from 2004. We expect this to result in a decreased volume of originations in the foreseeable future. Due to stable and decreasing interest rates over recent years, our historical performance may not be indicative of results in a rising interest rate environment, and our results of operations may be materially adversely affected if interest rates rise.
If loan prepayment rates are higher than expected, yields on our planned investments will be reduced.
The value of the mortgage loans in our portfolio may be affected by prepayment rates on those mortgage loans. Prepayment rates on mortgage loans are influenced by changes in current interest rates, the introduction of new loan products that may offer lower monthly payments, and a variety of economic, geographic and other factors beyond our control, and consequently, such prepayment rates cannot be predicted with certainty. In periods of declining mortgage loan interest rates, prepayments on mortgage loans generally increase and the proceeds of such prepayments are likely to be reinvested by us in assets with lower yields than the yields on the assets that were prepaid. Higher than expected mortgage loan prepayments require us to accelerate the amortization of our loan acquisition costs and reduce our earnings.
Declining real estate values could harm our operations.
We believe the risks associated with our business will be more acute during periods of declining real estate values. Declining real estate values will likely reduce our level of new mortgage loan originations, since borrowers often use increases in the value of their existing home to support the refinancing of their
73
existing mortgage loans or the purchase of new homes at higher levels of borrowings. Further, declining real estate values significantly increase the likelihood that we will incur increased payment delinquencies, foreclosures and losses on our loans if there is a default. Therefore, any sustained period of declining real estate values could adversely affect both our net interest income from loans in our portfolio as well as our ability to originate, sell and securitize loans, which would significantly harm our revenues, results of operations, financial condition, business prospects and our ability to make distributions to you.
Our hedging transactions may limit our gains or result in losses.
We use derivatives, primarily interest rate cap agreements, to hedge the interest rate risk relative to our loans held for investment and the financings related thereto. Our board of directors has adopted a general policy regarding the use of derivatives, which generally allows us to use derivatives when we deem appropriate for risk management purposes. We may use derivatives, including interest rate swaps and caps, options, term repurchase contracts, forward contracts and futures contracts, in our risk management strategy to limit the effects of changes in interest rates on our operations. We cannot assure you that our use of derivatives will offset the risks related to changes in interest rates. There have been periods, and it is likely that there will be periods in the future, during which we will incur losses after accounting for our derivative financial instruments. The derivative financial instruments we select may not have the effect of reducing our interest rate risk. In addition, the nature and timing of hedging transactions may influence the effectiveness of these strategies. Poorly designed strategies or improperly executed transactions could actually increase our risk and losses. In addition, hedging strategies involve transaction and other costs. We cannot assure you that our hedging strategy and the derivatives that we use will adequately offset the risk of interest rate volatility or that our hedging transactions will not result in losses, and such losses could harm our results of operations, financial condition and business prospects.
We have a limited operating history managing a loan portfolio and failure to properly manage our loan portfolio could impair our growth prospects and harm our results of operations and financial condition.
Prior to our initial public offering in November 2004, we had no history managing a portfolio of mortgage-backed securities. Our failure to properly manage our loan portfolio could harm our results of operations or financial condition.
The leverage in our REIT portfolio may adversely affect the return on our planned investments.
We leverage our REIT portfolio through borrowings, generally through the use of revolving warehouse and repurchase credit facilities, and on-balance sheet securitizations, including the issuance of collateralized mortgage-backed debt securities. The amount of leverage we incur will vary depending on our ability to securitize loans in our REIT portfolio to obtain credit facilities and our lenders’ estimates of the value of our REIT portfolio’s cash flow. We may not be able to meet our debt service obligations and, to the extent that we cannot, we risk the loss of some or all of our assets to foreclosure or sale to satisfy our debt obligations. We have a target overall leverage amount of 12 to 15 times our stockholders’ equity, but there is no limitation on our leverage ratio or on the aggregate amount of our borrowings.
If we are unable to maintain our targeted leverage on our equity the returns on our REIT portfolio could be diminished, which may limit our earnings.
We intend to maintain our leverage on our stockholders’ equity 12 to 15 times through the use of on-balance sheet securitizations. At December 31, 2005, our portfolio leverage was approximately 15 times. A key element of our strategy is our intention to use leverage to increase the size of our portfolio in an attempt to enhance our returns. If our leverage decreases due to prepayment of loans in our portfolio or an increase in our equity without a commensurate increase in the size of our portfolio, the returns on our REIT portfolio may be harmed.
74
We are required to repurchase mortgage loans or indemnify investors if we breach representations and warranties, which would hurt our earnings.
We are required under agreements governing our securitization transactions and whole loan sales to repurchase or replace mortgage loans that do not conform to representations and warranties we make at the time of sale. In addition, we may be obligated, in certain whole loan sales, to buy back mortgage loans if the borrower defaults on the first few payments of principal and interest due after the loan is sold. Our repurchase obligations could hurt our earnings and have a material adverse effect on our financial position because we would likely take a loss on any repurchased loans.
We make a significant amount of our mortgage loans in California, Florida, New York and Texas, and our operations could be hurt by economic downturns or natural disasters in these states.
Like many of our competitors, our production is concentrated in certain states, namely California, Florida, Texas and New York, where we believe conditions in the mortgage markets are most favorable. During the year ended December 31, 2005, we originated 23.6%, 24.0%, 7.3%, and 7.9% of our mortgage loans in California, Florida, New York and Texas, respectively, for a total of 62.8%. At December 31, 2005, 22.2%, 23.1%, 7.0%, and 8.3% of our servicing portfolio consisted of mortgage loans secured by real estate in California, Florida, New York and Texas, respectively, for a total of 60.6%. Declines in the economy generally or residential real estate markets in any of these states may reduce the demand for mortgage loans, reduce the values of the properties collateralizing our mortgages, increase the frequency of delinquency, foreclosure or bankruptcy and increase losses in the event of foreclosure, any of which would hurt our earnings.
The occurrence of a natural disaster may cause a sudden decrease in the value of real estate in any of these states and would likely reduce the value of the properties collateralizing the mortgage loans we made. Historically, California has been vulnerable to earthquakes, erosion-caused mudslides and wildfires, and Florida and Texas have been vulnerable to tropical storms, hurricanes and tornadoes. Recently parts of Texas, Louisiana, Mississippi and Alabama have been damaged by Hurricane Katrina and Hurricane Rita. We do not know for certain how many properties securing our mortgage loans in those states have been damaged by these hurricanes and continue to investigate the status of impacted properties. At December 31, 2005, 0.4%, 0.2%, and 0.0% of our servicing portfolio consisted of mortgage loans secured by real estate in Louisiana, Mississippi and Alabama, respectively, for a total of 0.6%. Since such natural disasters are not typically covered by the standard hazard insurance policies maintained by borrowers, the borrowers have to pay for repairs due to such disasters. Uninsured borrowers may not repair the property or may stop paying their mortgage loans if the property is damaged. This would cause the number of foreclosures to increase and decrease our ability to recover losses on properties affected by the disasters.
Our business is subject to extensive federal and state regulation which may limit our ability to operate and could decrease our earnings.
Our operations are subject to extensive rules and regulations by federal, state and local governmental authorities. Federal and numerous state and local laws, rules and regulations have been adopted in recent years, or are under consideration, that are intended to eliminate certain lending practices, often referred to as “predatory” lending practices, that are considered to be abusive. These laws, rules and regulations impose certain limitations on points and fees charged by the lender, on the annual percentage rate, or APR, of the loan, or on prepayment fees, and may expose a lender to risks of litigation and regulatory sanction no matter how carefully a loan is underwritten. These laws, rules and regulations have increased our cost of doing business as we have been required to develop systems and procedures to comply with these requirements. Our policy is to avoid originating loans that meet or exceed the APR or “points and fees” thresholds of these laws, rules and regulations, which reduces our fee income and origination volume, all of which could harm our results of operations, financial condition and business prospects. Many of these laws, rules and regulations also seek to impose liability for violations on purchasers of loans,
75
regardless of whether a purchaser knew of or participated in the violation. Accordingly, the companies that buy our loans or provide financing for our loan originations generally will not purchase or finance any loans subject to these types of laws, rules and regulations. This precludes us from continuing to originate loans that exceed the state and local limitations or thresholds and have impacted our ability to originate loans in states with limitations and thresholds. Moreover, some of our competitors who are, or are owned by, national banks or federally chartered thrifts may not be subject to these laws and may, therefore, be able to capture market share from us and other lenders.
We service loans on a nationwide basis. Therefore, we must comply with the federal, state and local laws and regulations, as well as judicial and administrative decisions, pertaining to loan servicing. As our servicing operations continue to grow, it may be more difficult to effectively train our personnel with respect to all of these laws and regulations, thereby potentially increasing our exposure to the risks of noncompliance with the laws and regulations pertaining to loan servicing.
Recently, the federal government created the national “Do Not Call Registry” which prohibits companies from telemarketing to those individuals who signed the registry. A significant part of our retail marketing consists of telemarketing, and the registry has reduced our ability to telemarket to retail customers which could reduce our retail loan production. In addition, a number of states have enacted similar laws restricting telemarketing sales which could further reduce our retail production.
Our failure to comply with the laws, rules and regulations discussed above can lead to liabilities and other burdens on us, including, but not limited to, criminal liability (including the trebling of fines or damages under some laws in certain circumstances), civil liability (including class action lawsuits) administrative enforcement actions, an inability to sell or securitize mortgage loans, an inability to renew our current warehouse financing facilities or secure alternate or additional warehouse facilities, the loss of state licenses or permits required for continued lending and servicing operations and legal defenses that adversely affect our ability to enforce loans, or give the borrower the right to rescind or cancel the loan transaction. Accordingly, if we are found to have failed to comply with these laws, rules and regulations, we could be subject to fines or damages that could materially adversely affect our business, financial condition and results of operations.
We are the subject of current putative class action litigation and investigations by governmental agencies, which could adversely affect our business and attract class action litigation against us.
In July 2005, we were served with a putative class action complaint entitled Webb v. Aames Investment Corporation, et. al. brought in the United States District Court, Central District of California. In December 2005, we were served with a putative class action complaint entitled Cooper v. Aames Investment Corporation, et. al. brought in the United States District Court, Eastern District of Wisconsin. These complaints allege violations of the Fair Credit Reporting Act (“FCRA”) in connection with prescreened offers of credit, which we made to plaintiffs. Webb also alleges that our direct mail pieces failed to comply with the requirements of FCRA that the required notice be clear and conspicuous. The plaintiffs seek to recover on behalf of themselves and others similarly situated compensatory and punitive damages and attorneys’ fees. We filed a motion to dismiss the clear and conspicuous claims in connection with Webb and while we believe that a motion with leave to amend will be granted, an order has not yet been entered. We also filed a motion to transfer Cooper to the Central District of California where Webb is pending. There have been no rulings on the merits of the plaintiffs’ claims or the claims of the putative class in either matter, and no class has been certified. We intend to vigorously defend these matters but if a class is certified and prevails on the merits, the potential liability could have a material adverse affect on our business. The outcome of these cases and the amount of liability, if any, cannot be determined at this time.
On September 7, 2004, we received a Civil Investigative Demand and Notice to Proceed from the Office of the Attorney General of Iowa, that, although not alleging any wrongdoing, sought documents and data relating to our business and lending practices in Iowa. We have cooperated and intend to continue to
76
cooperate fully with the Office of the Attorney General of Iowa in this investigation. Because the investigation is at an early stage, we cannot predict the outcome of the investigation and its effect, if any on our business in Iowa, which approximated 0.02% of total mortgage loan production during the year ended December 31, 2005.
On April 27, 2004, we received a civil investigative demand, or the demand, from the Federal Trade Commission, or the FTC, that, although not alleging any wrongdoing, sought documents and data relating to our business and lending practices. The demand was issued pursuant to an April 8, 2004 resolution of the FTC authorizing non-public investigations of various unnamed subprime lenders and loan brokers to determine whether there have been violations of the federal Consumer Credit Protection Act and the Federal Trade Commission Act. We have cooperated and intend to continue to cooperate fully with the FTC in this investigation. Because the investigation is at an early stage, we cannot predict the outcome of the investigation and its effect, if any, on our business.
In the ordinary course of business, we are defendants in or parties to a variety of legal actions. Certain of such actions involve claims relating to our origination and collection efforts, alleged violations of employment laws, unfair trade practices, and other federal and state laws. In our opinion, the resolution of any of these pending incidental matters is not expected to have a material adverse effect on our consolidated financial position and results of operations.
Our failure to comply with the laws, rules and regulations governing mortgage lending can lead to liabilities and other burdens on us, including, but not limited to, civil and criminal liability (including the trebling of fines or damages under some laws in certain circumstances), administrative enforcement actions, an inability to renew our current warehouse financing facilities or secure alternate or additional warehouse facilities, or the loss of state licenses or permits required for continued lending and servicing operations. Regulatory fines and damage awards levied against other subprime lenders in several recent highly publicized cases have been significant and in certain circumstances severe. Accordingly, if we are found to have failed to comply with these laws, rules and regulations, we could be subject to fines or damages that could materially adversely affect our business, financial condition and results of operations.
We may be subject to fines or other penalties based upon the conduct of our independent brokers.
The mortgage brokers from whom we obtain loans are subject to parallel and separate legal obligations. While these laws may not explicitly hold the originating lenders responsible for the legal violations of mortgage brokers, increasingly federal and state agencies have sought to impose liability on parties that take assignments of such loans. Recently, for example, the FTC entered into a settlement agreement with a mortgage lender where the FTC characterized a broker that had placed all of its loan production with a single lender as the “agent” of the lender. The FTC imposed a fine on the lender in part because, as “principal,” the lender was legally responsible for the mortgage broker’s unfair and deceptive acts and practices. The United States Department of Justice in the past has sought to hold a subprime mortgage lender responsible for the pricing practices of its mortgage brokers, alleging that the mortgage lender was directly responsible for the total fees and charges paid by the borrower under the Fair Housing Act even if the lender neither dictated what the mortgage broker could charge nor kept the money for its own account. Accordingly, although we have not incurred any such fines or penalties, we may be subject to fines or other penalties based upon the conduct of our independent mortgage brokers.
Our interest-only loans may have a higher risk of default than our fully-amortizing loans.
During the year ended December 31, 2005, originations of interest-only loans totaled $0.8 billion, or 11.3%, of total originations. These interest-only loans generally require the borrowers to make monthly payments only of accrued interest for the first 60 months following origination. After such interest-only period, the borrower’s monthly payment is recalculated to cover both interest and principal so that the
77
mortgage loan will amortize fully prior to its final payment date. When the monthly payment increases, the related borrower may not be able to pay the increased amount and may default or may refinance the related mortgage loan to avoid the higher payment. Because no principal payments may be made on such mortgage loans for an extended period following origination, if the borrower defaults, the unpaid principal balance of the related mortgage loan will be greater than had the loans had an amortizing feature.
We may change our investment strategy without your consent, which may result in our investing in riskier investments than our currently planned investments.
We may change our investment strategy at any time without the consent of our stockholders, which could result in our making investments that are different from, and possibly riskier than, the investments described in this prospectus. A change in our investment strategy may increase our exposure to, among other things, credit risk, interest rate risk and real estate market fluctuations.
An interruption in service or breach in security of our information systems could impair our ability to originate loans on a timely basis and may result in lost business.
We rely heavily upon communications and information systems to conduct our business. Any failure or interruption in service or breach in security of our information systems or the third-party information systems on which we rely could cause underwriting or other delays and could result in fewer loan applications being received and processed and reduced efficiency in loan servicing. Any such failure, interruption or compromise of our systems or security measures could affect our flow of business and harm our reputation. We cannot assure you that no material failures or interruptions will occur or, if they do occur, that we or the third parties on whom we rely will adequately address them. The occurrence of any failures or interruptions could significantly harm our business.
Failure to maintain our Investment Company Act exemption may harm our operations and our market price.
We are not currently regulated as an investment company under the Investment Company Act of 1940, as amended, or the Investment Company Act, and we intend to operate so as to not become regulated as an investment company under the Investment Company Act. We believe that there are a number of exemptions under the Investment Company Act that may be applicable to us. To maintain our exemption, the assets that we may acquire will be limited by the provisions of the Investment Company Act and the rules and regulations promulgated under the Investment Company Act. In addition, we could, among other things, be required either to change the manner in which we conduct our operations to avoid being required to register as an investment company or to register as an investment company, either of which could have an adverse effect on our operations and the market price of our common stock.
78
Our charter permits our board of directors to increase the authorized shares and to issue additional stock with terms that may discourage a third party from acquiring us in a transaction that might otherwise have involved a premium over the then-prevailing price of our stock.
Our charter authorizes us to issue additional authorized but unissued shares of common stock or preferred stock and our board, without any action by our stockholders, may amend our charter from time to time to increase or decrease the aggregate number of shares of stock or the number of shares of stock of any class we have the authority to issue. In addition, our board of directors may classify or reclassify any unissued shares of common stock or preferred stock and may set the preferences, conversion or other rights, voting powers, restrictions, limitations as to dividends and other distributions, qualifications, or terms or conditions of redemption as determined by our board. Thus, our board could authorize the issuance of common stock or preferred stock with terms and conditions that could have the effect of discouraging a takeover or other transaction in which holders of some or a majority of our shares might receive a premium for their shares over the then-prevailing market price of our shares.
Provisions of our charter and bylaws may limit the ability of a third party to acquire control of our company in a transaction that might otherwise have involved a premium over the then-prevailing price of our stock.
Our charter permits the removal of a director only upon cause and the affirmative vote of a majority of the votes entitled to be cast generally in the election of directors and provides that vacancies may be filled only by a majority of the remaining directors, even if the remaining directors do not constitute a quorum. Our bylaws require advance notice of a stockholder’s intention to nominate directors or present business for consideration by stockholders at an annual meeting of our stockholders. Our charter and bylaws also contain other provisions that may delay, defer, or prevent a transaction or change in control that involves a premium price for our common stock or that for other reasons may be desired by our stockholders.
Risks Related to Our Organization and Structure
Our charter contains ownership limits and restrictions on transferability of our stock, which may inhibit potential acquisition bids and limit the market price of our stock.
For a company to maintain its status as a REIT, not more than 50% of the value of its outstanding shares, including any outstanding preferred shares, after taking into account options to acquire shares, may be owned, actually or constructively, by five or fewer individuals (as defined in the Internal Revenue Code to include certain entities), and the shares must be beneficially owned by 100 or more persons (which generally refers to entities as well as individuals) during at least 335 days of a taxable year of 12 months or during a proportionate part of a shorter taxable year, other than the first year such company elects to qualify as a REIT. As we elected to qualify as a REIT for the six months ended December 31, 2004 and the year ended December 31, 2005, our charter contains restrictions designed to assist us in satisfying those REIT-related requirements and generally prohibits, subject to specific waivers or exceptions approved by our board of directors, any person from actually or constructively owning more than 9.8% (in value or number, whichever is more restrictive) of our outstanding common stock or more than 9.8% of the value of the aggregate of our outstanding stock. Based on certain representations and covenants we received from Specialty Finance Partners and Hotchkis & Wiley Capital Management, our board of directors waived the ownership limits for Specialty Finance Partners and Hotchkis & Wiley Capital Management and their direct and indirect owners.
With respect to Specialty Finance Partners, the ownership limit is waived solely with respect to (a) stock received by Specialty Finance Partners in the REIT reorganization and (b) stock held or beneficially owned by Specialty Finance Partners thereafter as a result of (i) the exercise of its rights pursuant to an award of options, restricted stock or restricted stock units granted by the Board of
79
Directors, or a committee thereof, to certain of our directors affiliated with Specialty Finance Partners under any incentive stock or option plan approved by the Board of Directors or our stockholders or (ii) receipt of stock or options to acquire stock pursuant to such an incentive plan. However, when an individual or entity acquires or owns our stock both indirectly through a direct or indirect ownership interest in Specialty Finance Partners and also by another means (e.g., through a direct investment in our stock), then the individual’s or entity’s ownership of our stock will be subject to the 9.8% ownership limits in the charter, which would also take into account the amount of our common stock held by Specialty Finance Partners attributed to the individual or entity.
Our charter prohibits certain entities from owning our shares which might reduce the demand for our shares by limiting the potential purchasers of our shares.
Although the law on the matter is unclear, if a REIT owns an interest in a taxable mortgage pool and certain types of entities are stockholders of the REIT, a tax might be imposed on the REIT. As we elected to qualify as a REIT for the six months ended December 31, 2004 and for the year ended December 31, 2005 in order to ensure we were not subject to that tax in the event it could have been imposed, our charter prohibits our shares from being held directly by those entities, which include: the United States, any State or political subdivision thereof, any foreign government, any international organization, any agency or instrumentality of any of the foregoing, any other tax-exempt organization, other than a farmer’s cooperative described in section 521 of the Internal Revenue Code, that is both exempt from income taxation and exempt from taxation under the unrelated business taxable income provisions of the Internal Revenue Code, and any rural electrical or telephone cooperative.
If we fail to remain qualified as a REIT, our distributions will not be deductible by us, and our income will be subject to taxation, reducing our earnings available for distributions.
We elected to qualify as a REIT for U.S. federal income tax purposes when we filed our December 31, 2004 federal income tax return. The requirements for this qualification, however, are highly technical and complex and even a technical or inadvertent mistake could jeopardize our REIT status. If we fail to meet these requirements, our distributions will not be deductible to us, and we will have to pay a corporate level tax on our income. This would substantially reduce our earnings, our cash available to pay distributions and your yield on your investment in our shares. In addition, such a tax liability might cause us to borrow funds, liquidate some of our investments or take other steps which could negatively affect our operating results. Moreover, if our REIT status is terminated because of our failure to meet a technical REIT requirement or if we voluntarily revoke our election, we would generally be disqualified from electing treatment as a REIT for the four taxable years following the year in which REIT status is lost. As a result, the amount of funds available for distribution to our stockholders would be reduced for the year or years involved.
We may be unable to comply with the strict income distribution requirements applicable to REITs, or compliance with such requirements could adversely affect our financial condition.
To obtain the favorable treatment associated with qualifying as a REIT, we must distribute to our stockholders with respect to each year at least 90% of our net taxable income excluding capital gains. In addition, we are subject to a tax on the undistributed portion of our income at regular corporate rates and also may be subject to a non-deductible 4% excise tax on the amount by which certain distributions considered as paid by us with respect to any calendar year are less than the sum of: (1) 85% of our ordinary income for the calendar year, (2) 95% of our capital gains net income for the calendar year, other than capital gains we elect to retain and pay tax on, and (3) 100% of undistributed taxable income from prior periods. We could be required to borrow funds on a short-term basis to meet the distribution requirements
80
that are necessary to achieve the tax benefits associated with qualifying as a REIT, even if conditions are not favorable for borrowing.
To comply with the REIT income and asset tests, we may have to acquire qualifying real estate assets that are not part of our overall business strategy and that might not be the best alternative.
As a REIT, 75% of the value of our total assets must consist of specified real estate related assets and certain other specified types of investments, and 75% of our gross income must be earned from specified real estate related sources and certain other specified types of income. If the value of the real estate securing each of our loans, determined at the date the loans are acquired (and possibly certain other times), is less than the highest outstanding balance of the loan for a particular taxable year, then a portion of that loan will not be a qualifying real estate asset and a portion of the interest income will not be qualifying real estate income. Accordingly, to determine which of our loans constitute qualifying assets for purposes of the REIT asset tests and the extent to which the interest earned on our loans constitute qualifying income for purposes of the REIT income tests, we must determine the value of the real estate at the time we acquire each loan and possibly certain other times. There can be no assurance that the IRS will not disagree with our determinations and assert that a lower value is applicable, which could negatively impact our ability to qualify as a REIT. These considerations also might restrict the types of loans that we can make in the future. In addition, we may have to acquire other assets that qualify as real estate (for example, interests in other mortgage loan portfolios or mortgage-backed securities) that are not part of our overall business strategy and might not otherwise be the best investment alternative for us.
The tax on prohibited transactions will limit our ability to engage in transactions, including certain methods of securitizing loans, that would be treated as sales for U.S. federal income tax purposes.
A REIT’s net income from prohibited transactions is subject to a 100% tax. In general, prohibited transactions are sales or other dispositions of property, other than foreclosure property, but including mortgage loans, held primarily for sale to customers in the ordinary course of business. We might be subject to this tax if we were to sell or securitize loans in a manner that was treated as a sale of the loans for federal income tax purposes. Therefore, in order to avoid the 100% prohibited transactions tax, we may choose not to engage in certain sales of loans and not to securitize loans in a manner that would be treated as a sale of the loans for federal income tax purposes (except for sales of loans made by our taxable REIT subsidiary), even though such sales or securitization transactions might otherwise be beneficial for us.
The REIT qualification rules impose limitations on the types of investments and activities that we may undertake which may preclude us from pursuing the most economically beneficial investment alternatives.
In order to qualify as a REIT, we must satisfy certain income and asset tests, which require that a certain specified percentage of our income and assets be comprised of certain types of income and assets. Satisfying these requirements might limit our ability to undertake investments and activities that would otherwise be beneficial to us. For example, from time to time, we enter into hedging transactions with respect to one or more of our assets or liabilities. Our hedging activities may include entering into interest rate swaps, caps, and floors, options to purchase these items, and futures and forward contracts. To the extent that we enter into an interest rate swap or cap contract, option, futures contract, forward rate agreement, or any similar financial instrument to hedge our indebtedness incurred or to be incurred to acquire mortgage loans, any periodic income or gain from the disposition of that contract attributable to the carrying or acquisition of the real estate assets should be disregarded—that is, treated as neither qualifying nor non-qualifying income—for purposes of the 95% gross income test, but should not be treated as qualifying income for purposes of the 75% gross income test. To the extent that we hedge with other types of financial instruments or for other purposes, or to the extent that a portion of our mortgage loans is not secured by real estate assets or in other situations, the income from those transactions is not
81
likely to be treated as qualifying income for purposes of either of the gross income tests. Although we intend to structure any hedging transactions in a manner that does not jeopardize our status as a REIT, we may choose not to engage in certain hedging transactions of the type we have undertaken in the past (except through our taxable REIT subsidiaries), even though such transactions might otherwise be beneficial for us.
The “taxable mortgage pool” rules may limit the manner in which we effect future securitizations and limit our returns on these transactions, making them less profitable.
There is a significant likelihood that our future securitizations would be considered to result in the creation of taxable mortgage pools. As a REIT, so long as we own 100% of the equity interests in the taxable mortgage pool, we would not be adversely affected by the characterization of our securitizations as taxable mortgage pools (assuming that we do not have any stockholders who might cause a corporate income tax to be imposed upon us by reason of our owning a taxable mortgage pool). We would be precluded, however, from selling to outside investors equity interests in our securitizations, as we have done in the past, or from selling any debt securities issued in connection with the securitization that might be considered to be equity interests for tax purposes. These limitations will preclude us from engaging in the types of sales that we have used with respect to our prior securitizations to maximize our returns from securitization transactions.
We may be required to allocate “excess inclusion income” to our stockholders, which could result in adverse tax consequences for our stockholders.
Our future securitization transactions likely will result in the creation of taxable mortgage pools, with the result that a portion of our income from that arrangement could be treated as “excess inclusion income.” Excess inclusion income is an amount, with respect to any calendar quarter, equal to the excess, if any, of (a) income allocable to the holder of a residual interest in a REMIC or, under Treasury regulations that have not been issued, an equity interest in a taxable mortgage pool over (b) the sum of an amount for each day in the calendar quarter equal to the product of (i) the adjusted issue price of such interests at the beginning of the quarter multiplied by (ii) 120% of the long-term Federal rate (determined on the basis of compounding at the close of each calendar quarter and properly adjusted for the length of such quarter). Excess inclusion income would be allocated among our stockholders. A stockholder’s share of excess inclusion income (i) would not be allowed to be offset by any net operating losses otherwise available to the stockholder, (ii) would be subject to tax as unrelated business taxable income in the hands of most types of stockholders that are otherwise generally exempt from federal income tax, and (iii) would result in the application of U.S. federal income tax withholding at the maximum rate (30%), without reduction for any otherwise applicable income tax treaty, to the extent allocable to most types of foreign stockholders.
Item 8. Financial Statements and Supplementary Data
The following financial statements are attached to this report:
· Report of Independent Registered Public Accounting Firm
· Consolidated Balance Sheets as of December 31, 2005 and 2004
· Consolidated Statements of Operations for the Years Ended December 31, 2005 and 2004 (Unaudited), Six Months Ended December 31, 2004, and Years Ended June 30, 2004 and 2003
· Consolidated Statements of Changes in Stockholders’ Equity for the Years Ended December 31, 2005 and 2004 (Unaudited), Six Months Ended December 31, 2004, and Years Ended June 30, 2004 and 2003
82
· Consolidated Statements of Cash Flows for the Years Ended December 31, 2005 and 2004 (Unaudited), Six Months Ended December 31, 2004, and Years Ended June 30, 2004 and 2003
· Notes to Consolidated Financial Statements
Item 9. Changes In and Disagreements With Registered Public Accounting Firm on Accounting and Financial Disclosure
None.
Item 9A. Controls and Procedures
Evaluation of Disclosure Controls and Procedures
As of the end of the period covered by this annual report on Form 10-K, Aames Investment carried out an evaluation, under the supervision and with the participation of its Disclosure Committee and management, including the Chief Executive Officer and Chief Financial Officer, of the effectiveness of the design and operation of Aames Investment’s disclosure controls and procedures pursuant to Exchange Act Rule 15d-15. Based upon that evaluation, the Chief Executive Officer and Chief Financial Officer concluded that Aames Investment’s disclosure controls and procedures are effective in timely alerting them to material information relating to Aames Investment (including its consolidated subsidiaries) required to be included in reports it files with the SEC pursuant to the Securities Exchange Act of 1934. Subsequent to the date of that evaluation, there have been no significant changes in our internal controls or in other factors that could significantly affect the internal controls.
Management’s Report on Internal Control Over Financial Reporting
The management of Aames Investment is responsible for establishing and maintaining adequate internal control over financial reporting, as such term is defined in Exchange Act Rules 13a-15(f) and 15d-15(f). Internal control over financial reporting is a process designed to provide reasonable assurance regarding the reliability of financial reporting and the preparation of financial statements for external purposes in accordance with U.S. generally accepted accounting principles.
Under the supervision and with the participation of management, including the Chief Executive Officer and Chief Financial Officer, Aames Investment conducted an evaluation of the effectiveness of internal control over financial reporting as of December 31, 2005 based on the framework in Internal Control—Integrated Framework issued by the Committee of Sponsoring Organizations of the Treadway Commission (COSO). Based on that evaluation, Aames Investment’s management concluded that its internal control over financial reporting was effective as of December 31, 2005.
Aames Investment’s independent registered public accounting firm, Ernst & Young LLP, has issued an audit report on management’s assessment of the effectiveness of internal control over financial reporting as of December 31, 2005, which is included herein.
Changes in Internal Control Over Financial Reporting
No change in Aames Investment’s internal control over financial reporting occurred during the fourth quarter of the year ended December 31, 2005, that has materially affected, or is reasonably likely to affect, Aames Investment’s control over financial reporting.
None.
83
REPORT OF INDEPENDENT REGISTERED PUBLIC ACCOUNTING FIRM
ON INTERNAL CONTROL OVER FINANCIAL REPORTING
The Board of Directors and Stockholders
Aames Investment Corporation
We have audited management’s assessment, included in the accompanying management’s report on Internal Control Over Financial Reporting, that Aames Investment Corporation (the Company) maintained effective internal control over financial reporting as of December 31, 2005, based on criteria established in Internal Control—Integrated Framework issued by the Committee of Sponsoring Organizations of the Treadway Commission (the COSO criteria). Aames Investment Corporation’s management is responsible for maintaining effective internal control over financial reporting and for its assessment of the effectiveness of internal control over financial reporting. Our responsibility is to express an opinion on management’s assessment and an opinion on the effectiveness of the Company’s internal control over financial reporting based on our audit.
We conducted our audit in accordance with the standards of the Public Company Accounting Oversight Board (United States). Those standards require that we plan and perform the audit to obtain reasonable assurance about whether effective internal control over financial reporting was maintained in all material respects. Our audit included obtaining an understanding of internal control over financial reporting, evaluating management’s assessment, testing and evaluating the design and operating effectiveness of internal control, and performing such other procedures as we considered necessary in the circumstances. We believe that our audit provides a reasonable basis for our opinion.
A company’s internal control over financial reporting is a process designed to provide reasonable assurance regarding the reliability of financial reporting and the preparation of financial statements for external purposes in accordance with generally accepted accounting principles. A company’s internal control over financial reporting includes those policies and procedures that (1) pertain to the maintenance of records that, in reasonable detail, accurately and fairly reflect the transactions and dispositions of the assets of the company; (2) provide reasonable assurance that transactions are recorded as necessary to permit preparation of financial statements in accordance with generally accepted accounting principles, and that receipts and expenditures of the company are being made only in accordance with authorizations of management and directors of the company; and (3) provide reasonable assurance regarding prevention or timely detection of unauthorized acquisition, use, or disposition of the company’s assets that could have a material effect on the financial statements.
Because of its inherent limitations, internal control over financial reporting may not prevent or detect misstatements. Also, projections of any evaluation of effectiveness to future periods are subject to the risk that controls may become inadequate because of changes in conditions, or that the degree of compliance with the policies or procedures may deteriorate.
In our opinion, management’s assessment that Aames Investment Corporation maintained effective internal control over financial reporting as of December 31, 2005, is fairly stated, in all material respects, based on the COSO criteria. Also, in our opinion, Aames Investment Corporation maintained, in all material respects, effective internal control over financial reporting as of December 31, 2005, based on the COSO criteria.
We also have audited, in accordance with the standards of the Public Company Accounting Oversight Board (United States), the consolidated balance sheets of Aames Investment Corporation as of December 31, 2005 and 2004, and the related consolidated statements of operations, stockholders’ equity, and cash flows for the year ended December 31, 2005, the six month period ended December 31, 2004 and for each of the two years in the period ended June 30, 2004, and our report dated March 14, 2006 expressed an unqualified opinion thereon.
| /s/ ERNST & YOUNG LLP |
Los Angeles, California
March 14, 2006
84
Item 10. Directors and Executive Officers of Registrant
Certain Information Concerning Our Directors
The following table presents certain biographical information about our directors as of March 24, 2006.
Name |
|
|
| Age |
| Position |
| ||
Jenne K. Britell, Ph.D. |
|
| 63 |
|
| Lead Independent Director |
| ||
David H. Elliott |
|
| 64 |
|
| Director |
| ||
John F. Farrell, Jr. |
|
| 68 |
|
| Director |
| ||
A. Jay Meyerson |
|
| 59 |
|
| Chairman of the Board and Chief Executive Officer |
| ||
Mani A. Sadeghi |
|
| 42 |
|
| Director |
| ||
Robert A. Spass |
|
| 50 |
|
| Director |
| ||
Stephen E. Wall |
|
| 63 |
|
| Director |
| ||
Each of our directors is serving for a one-year term which expires at the next annual meeting of our stockholders and holds office until his successor is duly elected and qualified or until his earlier death, resignation, disqualification or removal. Set forth below is a brief description of the business experience of each of our directors.
JENNE K. BRITELL, Ph.D. has served as a director since October 2004 and served as a director of Aames Financial from June 2001 until our corporate reorganization in November 2004. Dr. Britell has also served as Chairman and Chief Executive Officer of Structured Ventures, Inc., advisors to private equity and venture capital firms, since February 2001. From January 2003 to July 2004, she also served as the Senior Advisor for Financial Services to eBay and PayPal. From August 1996 to March 2000, Dr. Britell held several senior positions at GE Capital, the financial services group of General Electric, including serving as: President, Global Commercial and Mortgage Banking and Executive Vice President, Global Consumer Finance from July 1999 to March 2000; President and Chief Executive Officer, Central and Eastern Europe from January 1998 to July 1999; and President and Chief Executive Officer, GE Mortgage Services from August 1996 to January 1998. Dr. Britell serves as a director of each of Crown Holdings, Inc., where she also serves as the Chair of the Audit Committee, Quest Diagnostics Incorporated, where she also serves as a member of the Audit and Finance Committee, Lincoln National Corporation, where she also serves as a member of the Audit Committee and the Corporate Governance Committee, and West Pharmaceutical Services, Inc. She received a bachelor’s degree, with honors, and a master’s degree from Harvard University and a master’s degree in Business Administration and Ph.D. from Columbia University.
DAVID H. ELLIOTT has served as a director since October 2004 and served as a director of Aames Financial from December 1999 until our corporate reorganization in November 2004. Mr. Elliott served as Chairman of the Board of Directors of MBIA Inc. from 1994 until his retirement in 1999 and as Chief Executive Officer of MBIA Inc. and MBIA Insurance Corporation from 1992 until his retirement in 1999. Mr. Elliott received a bachelor’s degree from Yale University and a J.D. degree from Boston University Law School. He also served in the United States Army, including a tour in Vietnam.
JOHN F. FARRELL, JR. has served as a director since October 2004. Mr. Farrell has also served as a director of Fidelity National Financial, Inc. since 2000 and as Chair of its Audit Committee since 2003, and as a director and Chair of the Audit Committee of Fidelity National Title Group, Inc. since 2005. He was Chairman of the Board and Chief Executive Officer of North American Mortgage Company, a public mortgage-banking company, from 1985 to 1997, and was Chairman of Integrated Acquisition Corporation, a private equity firm, from 1984 through 1989. From 1972 to 1981, Mr. Farrell was a partner at Oppenheimer & Co., an investment banking firm, where he focused on private equity investments.
85
Mr. Farrell has served as a member of the Boston College Audit and Finance Committee since 1994 and served as a trustee to Boston College from 1992 to 2000. Mr. Farrell received B.S. and M.S. degrees in Engineering and J.D. and LL.M. degrees from New York University. Mr. Farrell is a member of the New York Bar.
A. JAY MEYERSON has served as our Chairman of the Board since October 2004 and as our Chief Executive Officer since our inception in February 2004, and has served as the Chief Executive Officer and President of Aames Financial since October 1999. Mr. Meyerson also served as a director of Aames Financial from November 1999 until our corporate reorganization in November 2004. From January 1997 to October 1999, Mr. Meyerson was a managing director with KPMG, LLP’s national financial services consulting practice. From 1994 to 1997 Mr. Meyerson served as the Chief Executive Officer and Chairman of the Board of KeyBank USA, the national consumer finance business subsidiary of KeyCorp. Prior to his employment with KeyCorp, Mr. Meyerson held executive level management positions with Society Bank and Ameritrust Bank from 1987 to 1994 and, prior to that, senior management level positions with Wells Fargo Bank from 1975 until 1987. Mr. Meyerson received a bachelor’s degree in Management from Pepperdine University.
MANI A. SADEGHI has served as a director since October 2004 and served as a director of Aames Financial from February 1999 until our corporate reorganization in November 2004, serving as its Chairman of the Board from December 2000 until such reorganization. Mr. Sadeghi also served as interim Chief Executive Officer of Aames Financial from May 1999 until October 1999. He has acted as the Chief Executive Officer of Equifin Capital Management LLC, an investment management company affiliated with Capital Z Management, LLC, since founding the company in 1998, and has been a Managing Partner of Equifin Capital Management II, LLC, an investment management company, since its formation in 2005. Additionally, Mr. Sadeghi was a Partner and Vice President of Capital Z Management from July 2001 until November 2004. Prior to 1998, Mr. Sadeghi served in various executive positions at AT&T Capital Corporation, culminating in his role as Group President. Mr. Sadeghi also serves as Chairman of the Board of NewStar Financial, Inc. Mr. Sadeghi received bachelor’s and master’s degrees from Stanford University and a master of business administration, with distinction, from University of Pennsylvania’s Wharton School of Business.
ROBERT A. SPASS has served as a director since October 2004 and served as a director of Aames Financial from July 2000 until our corporate reorganization in November 2004. Mr. Spass has also served as the Chairman of the Board and a Partner of Capital Z Management since July 1998. Prior to co-founding Capital Z Management in 1998, Mr. Spass was the President and Chief Executive Officer of International Insurance Advisors, Inc., the management company of International Insurance Investors, L.P. Mr. Spass serves as a director of each of Universal American Financial Corp., where he also serves as a member of the Executive Committee and the Nominating and Governance Committee, Ceres Group, Inc., where he also serves as a member of the Executive Committee and the Nominating and Governance Committee, USI Holdings Corporation, where he also serves as a member of the Compensation Committee, Endurance Specialty Insurance Ltd., where he also serves as a member of the Audit Committee, the Compensation Committee and the Nominating and Corporate Governance Committee, and Lancashire Holdings Limited, where he also serves as Chairman of the Board, Chair of the Audit Committee and Chair of the Nominating and Governance Committee. Mr. Spass received a B.A. degree in Business from the State University of New York at Buffalo.
STEPHEN E. WALL has served as a director since October 2004 and served as a director of Aames Financial from February 2001 until our corporate reorganization in November 2004. Mr. Wall served in various capacities with KeyCorp and its predecessors from August 1970 until his retirement in January 1999; at the time of his retirement, Mr. Wall was Executive Vice President of KeyCorp and the Chairman of the Board, President and Chief Executive Officer of Key Bank National Association. Mr. Wall received a B.A. degree in Political Science from California State University, Long Beach.
86
No arrangement or understanding exists between any director and any other person or persons pursuant to which any director was or is to be selected as a director or nominee, except for Messrs. Sadeghi and Spass. Messrs. Sadeghi and Spass were each appointed to our Board under the terms of the Registration Rights and Governance Agreement dated November 1, 2004 among us, our largest stockholder—Specialty Finance Partners—and one of its affiliates—Capital Z Management, LLC. Under the terms of the agreement, for so long as they collectively own at least 12.5% of our outstanding shares, Specialty Finance Partners and Capital Z Management have the right to designate two nominees to our Board, and if Specialty Finance Partners and Capital Z Management collectively own less than 12.5%, but at least 5%, of our outstanding shares, they will have the right to designate one such nominee. The agreement also requires us to support the nomination of each such individual for election to our Board and to use our best efforts to cause him to be so elected.
The directors do not have any family relationship among themselves or with any of our executive officers.
Certain Information Concerning Our Audit Committee
Our Board has established a standing audit committee in accordance with section 3(a)(58)(A) of the Exchange Act. The current members of our Audit Committee are David H. Elliott, John F. Farrell, Jr. and Stephen E. Wall. Our Board has determined that each member of our Audit Committee is independent within the meaning of the applicable New York Stock Exchange listing standards and meets the other requirements for audit committee membership set forth therein. In addition, our Board has determined that all of the members of our Audit Committee are “audit committee financial experts” within the meaning of Item 401(h) of Regulation S-K.
Certain Information Concerning Our Executive Officers
The following table presents certain biographical information about our executive officers as of March 10, 2006.
Name |
|
|
| Age |
| Position |
| ||
Mark A. Bragg |
|
| 43 |
|
| Senior Vice President and Director of National Loan |
| ||
H. James Fullen |
|
| 53 |
|
| Executive Vice President and Chief Operations Officer |
| ||
John P. Kim |
|
| 44 |
|
| Executive Vice President—Capital Markets and Chief |
| ||
Barry M. Levine |
|
| 44 |
|
| Executive Vice President and Chief Credit/Risk Officer |
| ||
John F. Madden, Jr. |
|
| 45 |
|
| Executive Vice President, General Counsel and Secretary |
| ||
Michael J. Matthews |
|
| 46 |
|
| Executive Vice President and Chief Production Officer |
| ||
A. Jay Meyerson |
|
| 59 |
|
| Chairman of the Board and Chief Executive Officer |
| ||
Jon D. Van Deuren |
|
| 53 |
|
| Executive Vice President and Chief Financial Officer |
| ||
Our executive officers are elected by, and serve at the discretion of, our Board of Directors. Set forth below is a brief description of the business experience of all executive officers other than A. Jay Meyerson, who is also a director and whose business experience is described under “—Certain Information Concerning Our Directors.”
MARK A. BRAGG has served as a Senior Vice President and the Director of National Loan Servicing of Aames Investment since December 2004 and as a Senior Vice President and the Director of National Loan Servicing of Aames Financial since July 2004. Prior to that, Mr. Bragg served as the Senior Vice
87
President—Default Alternatives of Aames Financial from October 1996 until July 2004. Mr. Bragg holds a B.A. degree in Marketing from the University of Utah.
H. JAMES FULLEN has served as an Executive Vice President and the Chief Operations Officer for Retail and Wholesale of Aames Investment since January 2006. Prior to that, Mr. Fullen served as the Senior Vice President—Retail Credit Operations of both Aames Investment and Aames Financial from November 2002 until January 2006. Prior to joining Aames Financial, Mr. Fullen was the President of Fullen & Company, a privately-held home builder, from 2001 until 2002. Prior to that, he held various management positions at Associates First Capital Corporation (now part of Citigroup Inc.) from 1994 until 2000, most recently serving as the Chief Executive Officer of Associates Capital Bank and the President of Home Equity Loan Offices from 1997 until 2000, where he was responsible for the re-engineering of over 200 offices from full service branches to real estate offices.
JOHN P. KIM has served as the Executive Vice President—Capital Markets of Aames Investment since November 2004 and as the Chief Investment Officer of Aames Investment since May 2005. He has also served as the Executive Vice President—Capital Markets of Aames Financial since February 2004. Prior to that, Mr. Kim served as the Senior Vice President—Capital Markets of Aames Financial from August 2002 until February 2004. Prior to joining Aames Financial, Mr. Kim served as First Vice President, Capital Markets—Secondary Marketing Trading and Securitization of one of the nation’s largest savings and loans, IndyMac Mortgage Holdings, Inc. (now known as IndyMac Bancorp, Inc.), from November 1997 until August 2002, where he oversaw the sale and securitization of the mortgages the company originated. Prior to that, Mr. Kim served as Vice President and Senior Portfolio Manager of California Federal Bank from 1993 until 1997. Mr. Kim holds a B.A. degree in Economics from the University of California, Berkeley.
BARRY M. LEVINE has served as the Chief Credit/Risk Officer of Aames Investment since March 2005 and as an Executive Vice President of Aames Investment since October 2004. He has also served as an Executive Vice President of Aames Financial since May 2000. Prior to being promoted to Chief Credit/Risk Officer, Mr. Levine served as the Chief Information Officer of both Aames Investment and Aames Financial from October 2004 until February 2005. Prior to joining Aames Financial, Mr. Levine served as Vice President and Chief Information Officer of Residential Money Centers, a subsidiary of Residential Funding Corporation, which is part of General Motors' financial services division and is in the business of acquiring loan originated by other financial institutions and packaging such loans as mortgage-backed securities which it sells to institutional investors, from March 2000 to May 2000. From 1998 to 2000, Mr. Levine served as Vice President and Chief Information Officer of ContiFinancial Corporation, a privately-held company in the business of originating, securitizing, servicing and selling loans. From 1994 to 1998, Mr. Levine served as Vice President and Global Manager of Client Implementations and Business Reengineering at Chase Manhattan Bank. Mr. Levine holds a B.S. degree, magna cum laude, in Business Administration from State University of New York at Albany and an M.B.A. in Finance from New York University.
JOHN F. MADDEN, JR. has served as an Executive Vice President, the General Counsel and the Secretary of Aames Investment since our inception in February 2004. Mr. Madden has also served as an Executive Vice President of Aames Financial since his promotion in July 2002 from Senior Vice President (a position he held since October 1999), and as the General Counsel and the Secretary of Aames Financial since October 1999. Prior to that, he served as an Assistant General Counsel and an Associate General Counsel of Aames Financial from 1995 until October 1999. Mr. Madden holds a B.A. degree, magna cum laude, in Political Science from Carleton College and a J.D. degree from the University of Chicago Law School. Mr. Madden is a member of the California Bar.
MICHAEL J. MATTHEWS has served as an Executive Vice President and Chief Production Officer of Aames Investment since January 2006. Mr. Matthews served as Executive Vice President—National
88
Retail Sales and Marketing of Aames Investment from October 2004 until January 2006 and as Executive Vice President—National Retail Sales and Marketing of Aames Financial from June 2002 until January 2006. Prior to joining Aames Financial, Mr. Matthews held various senior executive positions at Associates First Capital Corporation (now part of Citigroup Inc.) from 1981 until 2001, most recently serving as the Executive Vice President of Associates Home Equity Services, the largest nation-wide retail operating unit in The Associates home equity organization, from 1998 to 2000. Mr. Matthews holds a B.S. degree in Business Administration from the University of Delaware.
JON D. VAN DEUREN has served as an Executive Vice President and the Chief Financial Officer of Aames Investment since April 2005. Prior to that he served as the Senior Vice President—Finance and the Chief Accounting Officer of Aames Investment from our inception in February 2004 until April 2005, the Chief Accounting Officer of Aames Financial from August 2001 until April 2005 and the Senior Vice President—Finance of Aames Financial from December 1998 until April 2005. Prior to that, Mr. Van Deuren served as Chief Operating Officer of Burke, Williams & Sorensen, LLP. Prior to that, Mr. Van Deuren served as the Chief Financial Officer of Guardian Bancorp and before that was a partner with KPMG, LLP. Mr. Van Deuren holds a B.S. degree, with high honors, in Accounting and Business from California State University, Long Beach and is a Certified Public Accountant.
No arrangement or understanding exists between any of our executive officers and any other person or persons pursuant to which any of executive officers was selected as an officer. Our executive officers do not have any family relationship among themselves or with any of our director nominees.
Section 16(a) Beneficial Ownership Reporting Compliance
Section 16(a) of the Securities Exchange Act requires our executive officers and directors and persons who beneficially own more than 10% of our common stock to file reports of ownership and changes in beneficial ownership with the SEC and to furnish us with copies of all Section 16(a) forms they file. Based solely on our review of the copies of such forms furnished to us and written representations provided to us by our executive officers and directors, we believe that all Section 16(a) filing requirements were met during our fiscal year ended December 31, 2005, except that Mark A. Bragg, our Senior Vice President of Loan Servicing, did not file a Form 4 reporting his disposition of 334 shares of our common stock on June 1, 2005 until February 2, 2006.
We have adopted a code of ethics entitled “Code of Business Conduct and Ethics,” which is posted on our website. Our website is www.aames.net and the code of ethics can be found through a link to the Corporate Financials section on our website. We intend to satisfy the disclosure requirement under Section 5.05 of Form 8-K for any amendment to, or waiver from a provision of, this code by posting any such information on our website.
89
Item 11. Executive Compensation
Summary of Cash and Certain Other Compensation
The following table sets forth the compensation paid by us for the fiscal year ended December 31, 2005, the six months ended December 31, 2004 and the fiscal years ended June 30, 2004 and 2003 to our chief executive officer and our four most highly compensated executive officers (other than our chief executive officer) who served in such capacity at the end of our last fiscal year (the “named executive officers”).
|
|
|
|
|
|
|
|
| Long Term |
|
|
| |||||||||||||||
|
|
|
| Annual |
| Other Annual |
| Restricted |
| Securities |
| All Other |
| ||||||||||||||
Name and |
|
|
| Fiscal |
| Salary |
| Bonus |
| Compensation |
| Stock |
| Options/ |
| Compensation |
| ||||||||||
A. Jay Meyerson |
|
| 2005 |
|
| 425,000 |
| 600,000 | (1) |
| 643,249 | (2) |
|
| — |
|
|
| — |
|
|
| — |
|
| ||
Chairman of the Board and |
|
| 2004 | (3) |
| 186,363 |
| 500,000 |
|
| 14,153 | (4) |
|
| 2,501,889 | (5) |
|
| — |
|
|
| 2,001,000 | (6) |
| ||
Chief Executive Officer |
|
| 2004 | (7) |
| 350,000 |
| 837,500 |
|
| 63,667 | (8) |
|
| — |
|
|
| 6,900,000 | (9) |
|
| — |
|
| ||
|
|
| 2003 |
|
| 350,000 |
| 562,000 |
|
| 74,507 | (10) |
|
| — |
|
|
| — |
|
|
| — |
|
| ||
John P. Kim |
|
| 2005 |
|
| 230,481 |
| 225,000 | (1) |
| 64,801 | (11) |
|
| 147,300 | (12) |
|
| — |
|
|
| 6,300 | (13) |
| ||
Executive Vice President— |
|
| 2004 | (3) |
| 100,000 |
| 90,000 |
|
| — |
|
|
| 320,420 | (14) |
|
| — |
|
|
| 290,000 | (15) |
| ||
Capital Markets and Chief |
|
| 2004 | (7) |
| 200,000 |
| 260,000 |
|
| — |
|
|
| — |
|
|
| 1,000,000 | (16) |
|
| 6,150 | (13) |
| ||
Investment Officer |
|
| 2003 | (17) |
| 185,416 |
| 215,000 |
|
| — |
|
|
| — |
|
|
| 350,000 | (18) |
|
| 2,500 | (13) |
| ||
Barry M. Levine |
|
| 2005 |
|
| 250,000 |
| 275,000 | (1) |
| 88,153 | (11) |
|
| 147,300 | (19) |
|
| — |
|
|
| 6,300 | (13) |
| ||
Executive Vice President |
|
| 2004 | (3) |
| 125,000 |
| 90,000 |
|
| — |
|
|
| 325,523 | (20) |
|
| — |
|
|
| 377,000 | (21) |
| ||
and Chief Credit/Risk |
|
| 2004 | (7) |
| 250,000 |
| 335,000 |
|
| — |
|
|
| — |
|
|
| 1,300,000 | (22) |
|
| 6,150 | (13) |
| ||
Officer |
|
| 2003 |
|
| 231,250 |
| 250,000 |
|
| — |
|
|
| — |
|
|
| — |
|
|
| 6,000 | (13) |
| ||
John F. Madden, Jr. |
|
| 2005 |
|
| 238,715 |
| 225,000 | (1) |
| 98,129 | (11) |
|
| 147,300 | (23) |
|
| — |
|
|
| 6,300 | (13) |
| ||
Executive Vice President, |
|
| 2004 | (3) |
| 100,000 |
| 250,000 |
|
| — |
|
|
| 325,533 | (24) |
|
| — |
|
|
| 377,000 | (21) |
| ||
General Counsel and |
|
| 2004 | (7) |
| 200,000 |
| 268,000 |
|
| — |
|
|
| — |
|
|
| 1,300,000 | (22) |
|
| 6,150 | (13) |
| ||
Secretary |
|
| 2003 |
|
| 200,000 |
| 200,000 |
|
| — |
|
|
| — |
|
|
| 50,000 | (25) |
|
| 6,000 | (13) |
| ||
Jon D. Van Deuren |
|
| 2005 |
|
| 236,667 |
| 225,000 | (1) |
| 81,475 | (11) |
|
| 274,500 | (26) |
|
| — |
|
|
| 6,300 | (13) |
| ||
Executive Vice President |
|
| 2004 | (3) |
| 105,000 |
| 125,000 |
|
| — |
|
|
| 147,475 | (27) |
|
| — |
|
|
| 203,000 | (28) |
| ||
and Chief Financial Officer |
|
| 2004 | (7) |
| 210,000 |
| 250,000 |
|
| — |
|
|
| — |
|
|
| 700,000 | (29) |
|
| 6,150 | (13) |
| ||
|
| 2003 |
|
| 210,000 |
| 150,000 |
|
| — |
|
|
| — |
|
|
| — |
|
|
| 6,000 | (13) |
| |||
(1) The amount paid to executive was based on his performance for the year ended December 31, 2004 but was not determined or paid until March 2005 and, thus, is characterized as compensation for the fiscal year ended December 31, 2005.
(2) Consists of (A) dividends in the aggregate amount of $633,777 paid on executive’s unvested shares of restricted common stock and outstanding restricted stock units (dividends in the amount of $0.06, $0.27, $0.34 and $0.35 were paid on January 31, 2005, May 9, 2005, August 8, 2005 and November 7, 2005, respectively, on each such share and unit held by executive on the respective date) and (B) a life insurance premium of $9,472 paid for executive’s benefit.
(3) The information provided is for the six-month period ended December 31, 2004 (e.g., the salary information is for six months rather than 12 months).
(4) Consists of housing benefits.
(5) Represents 257,396 shares of restricted stock granted on November 5, 2004 in connection with our corporate reorganization valued at $9.72 per share (the closing price of our common stock on the NYSE on the date of grant). These shares vest in four equal installments beginning on the first anniversary of the date of grant and are entitled to receive dividends. As of the end of our last fiscal year, executive held 193,047 shares of restricted stock valued at $6.46 per share (the closing price of our common stock on the NYSE on December 30, 2005) or $1,662,778 in the aggregate.
(6) Consists of consideration paid to redeem options to acquire 6,900,000 shares of Aames Financial’s Series E preferred stock, the proceeds of which, net of applicable taxes, were used to purchase our common stock in the initial public offering.
(7) The information provided is for the 12-month period ended June 30, 2004.
90
(8) Consists of (A) housing benefits of $54,195 and (B) a life insurance premium of $9,472 paid for executive’s benefit.
(9) Represents options to acquire 6,900,000 shares of Aames Financial’s Series E preferred stock.
(10) Consists of (A) housing benefits of $65,035 and (B) a life insurance premium of $9,472 paid for executive’s benefit.
(11) Consists of dividends paid on executive’s unvested shares of restricted common stock and outstanding restricted stock units (dividends in the amount of $0.06, $0.27, $0.34 and $0.35 were paid on January 31, 2005, May 9, 2005, August 8, 2005 and November 7, 2005, respectively, on each such share and unit held by executive on the respective date).
(12) Represents 15,000 shares of restricted stock granted on July 18, 2005 as compensation for executive’s service as an executive officer valued at $9.82 per share (the closing price of our common stock on the NYSE on the date of grant). These shares vest in four equal installments beginning on the first anniversary of the date of grant and are entitled to receive dividends. As of the end of our last fiscal year, executive held an aggregate of 42,723 shares of restricted stock valued at $6.46 per share (the closing price of our common stock on the NYSE on December 30, 2005) or $275,991 in the aggregate.
(13) Consists of employer contributions to Aames Financial’s Section 401(k) plan for executive’s benefit.
(14) Represents 32,965 shares of restricted stock granted on November 5, 2004 in connection with our corporate reorganization valued at $9.72 per share (the closing price of our common stock on the NYSE on the date of grant). These shares vest in four equal installments beginning on the first anniversary of the date of grant and are entitled to receive dividends.
(15) Consists of consideration paid to redeem options to acquire 1,000,000 shares of Aames Financial’s Series E preferred stock.
(16) Represents options to acquire 1,000,000 shares of Aames Financial’s Series E preferred stock.
(17) Aames Financial hired executive on July 29, 2002 and, thus, the information provided is for the period from July 29, 2002 to June 30, 2003.
(18) Represents options to acquire 350,000 shares of Aames Financial’s common stock.
(19) Represents 15,000 shares of restricted stock granted on July 18, 2005 as compensation for executive’s service as an executive officer valued at $9.82 per share (the closing price of our common stock on the NYSE on the date of grant). These shares vest in four equal installments beginning on the first anniversary of the date of grant and are entitled to receive dividends. As of the end of our last fiscal year, executive held an aggregate of 40,117 shares of restricted stock valued at $6.46 per share (the closing price of our common stock on the NYSE on December 30, 2005) or $259,156 in the aggregate.
(20) Represents 33,490 shares of restricted stock granted on November 5, 2004 in connection with our corporate reorganization valued at $9.72 per share (the closing price of our common stock on the NYSE on the date of grant). These shares vest in four equal installments beginning on the first anniversary of the date of grant and are entitled to receive dividends.
(21) Consists of consideration paid to redeem options to acquire 1,300,000 shares of Aames Financial’s Series E preferred stock, the proceeds of which, net of applicable taxes, were used to purchase our common stock in the initial public offering.
(22) Represents options to acquire 1,300,000 shares of Aames Financial’s Series E preferred stock.
(23) Represents 15,000 shares of restricted stock granted on July 18, 2005 as compensation for executive’s service as an executive officer valued at $9.82 per share (the closing price of our common stock on the NYSE on the date of grant). These shares vest in four equal installments beginning on the first anniversary of the date of grant and are entitled to receive dividends. As of the end of our last fiscal year, executive held an aggregate of 40,118 shares of restricted stock valued at $6.46 per share (the closing price of our common stock on the NYSE on December 30, 2005) or $259,162 in the aggregate.
(24) Represents 33,491 shares of restricted stock granted on November 5, 2004 in connection with our corporate reorganization valued at $9.72 per share (the closing price of our common stock on the NYSE on the date of grant). These shares vest in four equal installments beginning on the first anniversary of the date of grant and are entitled to receive dividends.
(25) Represents options to acquire 50,000 shares of Aames Financial’s common stock.
(26) Represents (A) 15,000 shares of restricted stock granted on May 2, 2005 in connection with executive’s promotion to Chief Financial Officer valued at $8.48 per share (the closing price of our common stock on the NYSE on the date of grant) and (B) 15,000 shares of restricted stock granted on July 18, 2005 as compensation for executive’s service as an executive officer valued at $9.82 per share (the closing price of our common stock on the NYSE on the date of grant). These shares vest in four equal installments beginning on the first anniversary of the date of grant and are entitled to receive dividends. As of the end of our last fiscal year, executive held an aggregate of 43,102 shares of restricted stock valued at $6.46 per share (the closing price of our common stock on the NYSE on December 30, 2005) or $277,858 in the aggregate.
(27) Represents 17,350 shares of restricted stock granted on November 5, 2004 in connection with our corporate reorganization valued at $9.72 per share (the closing price of our common stock on the NYSE on the date of grant). These shares vest in four equal installments beginning on the first anniversary of the date of grant and are entitled to receive dividends.
(28) Consists of consideration paid to redeem options to acquire 700,000 shares of Aames Financial’s Series E preferred stock, the proceeds of which, net of applicable taxes, were used to purchase our common stock in the initial public offering.
(29) Represents options to acquire 700,000 shares of Aames Financial’s Series E preferred stock.
91
Option/SAR Grants In Last Fiscal Year and Aggregate Option/SAR Exercises In Last Fiscal Year and Fiscal Year-End Option/SAR Values
We have not granted any options or stock appreciation rights (i.e. SARs) to any of our executive officers, or otherwise, since our initial public offering. Thus, there were no options or stock appreciation rights exercised by the named executive officers during the fiscal year ended December 31, 2005, nor were there any unexercised options or SARs held by such officers at the end of such year.
Aggregate Unvested RSAs and Outstanding RSUs at Fiscal-Year End and Fiscal Year-End RSA/RSU Values
We currently have two types of equity-based awards outstanding—restricted stock awards and restricted stock units. Restricted stock awards are made to our executive officers as compensation for their service. They are common stock awards subject to forfeiture restrictions—the underlying shares vest annually in four equal installments from the date of grant. The awards are entitled to dividends but do not otherwise entitle the holder to the rights of a stockholder prior to vesting. Our executive officers were issued restricted stock units in connection with our corporate reorganization in exchange for certain of their options to purchase the common stock of our corporate predecessor, Aames Financial. Restricted stock units are vested and, thus, not subject to forfeiture. Each holder of those restricted stock units will receive the shares of our common stock underlying the units on a future date or dates selected by the holder at the time of grant. The units are entitled to dividends but do not otherwise entitle the holder to the rights of a stockholder prior to vesting.
The following table sets forth certain information regarding the unvested restricted stock awards and outstanding restricted stock units held by our named executive officers as of the fiscal year ended December 31, 2005.
|
| Restricted Stock Awards |
| Restricted Stock Units |
| ||||||||||||||
Name |
|
|
| Number of Shares |
| Value of Unvested |
| Number of Shares |
| Value of Outstanding |
| ||||||||
A. Jay Meyerson |
|
| 193,044 |
|
|
| 1,247,064 |
|
|
| 363,954 |
|
|
| 2,351,143 |
|
| ||
John P. Kim |
|
| 39,723 |
|
|
| 256,611 |
|
|
| — |
|
|
| — |
|
| ||
Barry M. Levine |
|
| 40,117 |
|
|
| 259,156 |
|
|
| 25,825 |
|
|
| 166,893 |
|
| ||
John F. Madden, Jr. |
|
| 40,118 |
|
|
| 259,162 |
|
|
| 52,567 |
|
|
| 339,583 |
|
| ||
Jon D. Van Deuren |
|
| 42,962 |
|
|
| 277,535 |
|
|
| 38,263 |
|
|
| 247,179 |
|
| ||
(1) Stock valued at $6.46 per share (the closing price of our common stock on the NYSE on December 30, 2005).
Long-Term Incentive Plans
We did not make any long-term incentive awards to any of our executive officers, or otherwise, during the fiscal year ended December 31, 2005.
Pension Plans
We did not have any defined benefit or actuarial plan in place during the fiscal year ended December 31, 2005.
Employment Contracts, Termination of Employment and Change in Control Agreements
Employment Agreement with our Chief Executive Officer
In connection with the REIT reorganization, we and Aames Financial entered into an employment agreement with Mr. Meyerson pursuant to which he serves as a member of our Board, our chief executive officer and the chief executive officer of Aames Financial. The agreement was subsequently amended on
92
July 1, 2005. The agreement has an initial term of 3 years, which began on the day our initial public offering closed and expires on November 5, 2007. After the expiration of the initial term, the agreement will automatically renew for successive one-year terms unless we, Aames Financial or Mr. Meyerson provide each other party with notice of non-renewal at least 90 days before the agreement is scheduled to so renew.
During the term of agreement, Mr. Meyerson is entitled to the following compensation while employed by Aames Financial:
· An annual base salary of at least $425,000, which will be reviewed annually by our Compensation Committee to determine whether it should be increased.
· A target performance-based bonus of at least $650,000, which will be reviewed annually by our Compensation Committee to determine whether it should be increased. The amount of the bonus actually paid to Mr. Meyerson with respect to any year will depend on our profitability and his actual performance during that year; it may be less than targeted if we are not as profitable as targeted or he does not meet his performance goals or more than targeted if we are more profitable than targeted and he meets or exceeds his performance goals.
· The annual payment of up to $25,000 in premiums on a $1,000,000 insurance policy and any other fringe benefits provided to our other senior officers, reimbursement of reasonable business expenses, indemnification against claims arising out of his employment or service as a director, and coverage under our directors and officers liability insurance policy.
Mr. Meyerson also received 257,396 shares of restricted stock which vest annually in four equal installments beginning on the first anniversary of the date our initial public offering closed. In addition, in exchange for the surrender and cancellation of his options to acquire Aames Financial’s common stock, Mr. Meyerson received 413,954 restricted stock units underlying shares of our common stock which shares will be distributed on dates he selected at the time of grant.
Mr. Meyerson’s employment agreement may be terminated by Aames Financial for “cause” or for reasons other than cause, by Mr. Meyerson for “good reason” or for reasons other than good reason, or by reason of Mr. Meyerson’s death or “permanent disability” (in each case, as defined in the employment agreement), and the reason for any such termination will determine the severance to which he is entitled. If Mr. Meyerson’s employment with Aames Financial is terminated during the term of his employment agreement, he is entitled to:
· If the termination is by Aames Financial for cause or by Mr. Meyerson for reasons other than good reason, (1) his base salary through the final date of his active employment, (2) payment for any accrued but unused vacation days, and (3) if the date of termination occurs after the end of a performance period but prior to the payment of the performance bonus for such period, the performance bonus to which he would otherwise be entitled in accordance with Aames Financial’s performance bonus plan.
· If the termination is due to Mr. Meyerson’s death or permanent disability, (1) the payments described in the immediately preceding bullet and (2) in lieu of a performance bonus for the year in which the termination occurs, a payment of $650,000 subject to a pro-rata reduction for the portion of the bonus performance period following the date of termination.
· If the termination is by Aames Financial for reasons other than cause or by Mr. Meyerson for good reason, (1) the payments described in the immediately preceding bullet, (2) continued payment of his annual base salary in effect at the time of termination for the 36 months following his termination, (3) continued payment of the annual premiums of his life insurance policy by Aames Financial for the 36 months following his termination, and (4) the immediate vesting of any
93
outstanding shares of restricted stock and restricted stock units and all stock options (which will be exercisable for up to 180 days after the date of termination).
In addition, if the termination is by Mr. Meyerson for good reason or by Aames Financial for reasons other than cause, is due to Mr. Meyerson’s death or permanent disability, or occurs after the expiration of the initial term of the agreement (regardless of the reason for such termination), Aames Financial will continue to provide health and dental insurance to Mr. Meyerson until his 65th birthday and to the woman to whom he was married as of the closing date of our initial public offering until her 65th birthday, and will pay all premiums for such coverage.
Mr. Meyerson may be entitled to compensation from Aames Financial following the expiration of the employment period for assisting with the successful transition of our management. If (1) his employment is terminated following the expiration of his term of employment, (2) during his employment he devoted reasonable efforts to the implementation of a program for the succession of our leadership following his termination and, pursuant to such succession program, he made best efforts to present one or more qualified candidates to our Board for such leadership position or positions, (3) he agrees to provide reasonable consultation services to us or Aames Financial for the three years following his termination, and (4) he is not entitled to severance under his employment agreement for the reason that he terminated his employment for good reason or was terminated by Aames Financial without cause, then:
· Mr. Meyerson will receive payments for a period of 36 months following the date of his termination at the rate of $350,000 per year.
· For purposes of determining the vesting of any outstanding restricted stock, restricted stock units and stock options, Mr. Meyerson will be treated as though he continued to be employed by Aames Financial during the period he provides such consultation services.
· Aames Financial will continue to pay the annual premiums on his life insurance policy for the 36 months following his termination.
If there is a “change in control” (as defined in the Amended and Restated Aames Investment Corporation 2004 Equity Incentive Plan) and Mr. Meyerson is required to pay an excise tax on any amounts payable to him as a result of that change in control pursuant to the “golden parachute” rules of Section 4999 of the Internal Revenue Code, we will provide him with additional payments such that he will receive on an after-tax basis an amount equal to the amount he would have received in the absence of the imposition of the tax.
Compensation for Executives other than our Chief Executive Officer
Employment Contracts
None of our executive officers other than our chief executive officer is party to an employment contract with us or any of our subsidiaries.
Executive Severance Plan
Each of our executive officers other than Mr. Meyerson is a participant in Aames Financial’s executive severance plan. The plan entitles each participant to severance if his employment is terminated by Aames Financial without “cause” or by him with “good reason” (in each case, as defined in such plan). The type of severance benefits to which a participant is entitled depends on whether or not he is a member of Aames’ Financial’s “corporate management committee” (a committee comprised of certain of our senior executive officers who periodically review and evaluate our operations and performance, which includes, among others, each of the named executive officers participating in the plan) or a “designated executive officer” (currently, Michael J. Matthews, our Chief Production Officer).
94
Generally, each participant is entitled to continued payment of his annual base salary in effect at the time of termination for the six months following his termination (unless he has been employed by Aames Financial for less than six months, in which case he is entitled to receive one month’s salary for each month he has been employed). However, if the participant is a member of Aames Financial’s corporate management committee, he is entitled to (1) (a) continued payment of his annual base salary in effect at the time of termination for the 12 months following his termination (unless he has been employed by Aames Financial for less than 12 months, in which case he is entitled to receive one month’s salary for each month he has been employed) and (b) if he is also an Executive Vice President (as is each of our named executive officers participating in the plan) and the termination occurs within 90 days following a “change in control” (as defined in the plan), payment of an additional 12 months’ salary, and (2) payment of a performance bonus for the year in which the termination occurs, the amount of which will be determined and paid in accordance with Aames Financial’s executive bonus plan subject to a pro-rata reduction for the portion of the bonus performance period following the date of termination. Additionally, if the participant is a designated executive officer, he is entitled to the benefits an Executive Vice President would receive, except that he is entitled to continued payment of his annual base salary in effect at the time of termination for the 24 months following his termination instead of 12 months (unless he has been employed by Aames Financial for less than 12 months, in which case he is entitled to receive one month’s salary for each month he has been employed).
Director Compensation Plan
In March 2005, our Compensation Committee recommended, and our Board approved, a plan for director compensation, which was retroactively effective as of January 1, 2005 with two exceptions—the amount of the annual cash retainer and the form of payment of those fees for which the compensation plan then in place already provided, each of which continued to be governed by the terms of that former plan until March 31, 2005.
Pursuant to our director compensation plan, each of our non-employee directors is entitled to an annual retainer consisting of (1) $20,000 in cash and (2) an award of restricted common stock valued at $70,000 (as determined by reference to the closing price of our common stock on the date of grant) which vests in full on the first anniversary of the date of grant. The chair of our Audit Committee is entitled to an additional annual cash retainer of $10,000, and each other member of our Audit Committee is entitled to $5,000. The chair of each of our Compensation Committee and our Nominating and Governance Committee is entitled to an additional annual cash retainer of $5,000. Our Lead Independent Director is entitled to an additional annual fee of $10,000 (but is not be eligible to receive any additional fees for service as the chair of a committee). In addition, each of the non-employee directors receives a fee of $1,000 for each Board meeting he or she attends and, if he or she serves on a Board committee, a fee of $1,000 for each meeting of that committee he or she attends. All compensation is paid on a quarterly basis other than the grant of stock, which is made annually following the election of our directors. In addition to the foregoing compensation, we also pay all reasonable out-of-pocket expenses incurred by the directors in connection with their attendance at meetings.
As noted above, the portion of the annual retainer to which each of our non-employee directors was entitled for his or her service on our Board during the first quarter of our last fiscal year was not determined in accordance with our current director compensation plan. Rather, those directors were compensated pursuant to the terms of the compensation plan adopted at the time of our initial public offering, which provided for an annual retainer in the amount of $30,000 (and, thus, each received $7,500 for that quarter, rather than the $5,000 in cash he or she received in the three remaining quarters of that year). As also noted above, certain fees to which each non-employee director was entitled for his or her services as such during that quarter continued to be paid in the form prescribed by our former plan, which
95
provided that all fees relating to Board or committee service were payable half in cash and half in restricted shares of our common stock (the value of which was determined by reference to the closing price of our common stock on the date of grant). To the extent the current plan provides for fees not contemplated by our former plan (i.e., fees for meeting attendance, for service as a non-chair member of our Audit Committee and for service as our Lead Independent Director), each non-employee director was generally paid all such fees earned in our last fiscal year, whether prior to or after the adoption of the current plan, in cash in accordance with the current plan. However, because at the time our current compensation plan was adopted our directors had already received the compensation to which they were entitled under our former plan for their service during the first quarter of our last fiscal year, to the extent the fees to which they were entitled did not differ between the plans (i.e., the retainers for service as the chair of one of our committees), the payment of those fees was in a mix of stock and cash, as provided by our former plan.
Summary of Compensation Paid to Our Directors
The following table sets forth the compensation paid by us to each non-management director for his service during the fiscal year ended December 31, 2005.
|
| Cash-Based Compensation ($) |
|
|
|
|
| ||||||||||||||||||||
Name |
|
|
| Annual |
| Board |
| Committee |
| All Other |
| Equity-Based |
| Total |
| ||||||||||||
Jenne K. Britell, Ph.D. |
|
| 18,750 | (3) |
|
| 13,000 |
|
|
| 9,000 |
|
|
| 50,666 | (4) |
|
| 74,363 | (5) |
|
| 165,779 |
|
| ||
David H. Elliott |
|
| 18,750 | (3) |
|
| 14,000 |
|
|
| 16,000 |
|
|
| 63,823 | (6) |
|
| 74,363 | (7) |
|
| 186,936 |
|
| ||
John F. Farrell, Jr. |
|
| 18,750 | (3) |
|
| 14,000 |
|
|
| 20,000 |
|
|
| 25,567 | (8) |
|
| 73,736 | (9) |
|
| 152,053 |
|
| ||
Mani A. Sadeghi(10) |
|
| 18,750 | (3) |
|
| 14,000 |
|
|
| — |
|
|
| 16,817 | (11) |
|
| 73,736 | (12) |
|
| 123,303 |
|
| ||
Robert A. Spass(13) |
|
| 18,750 | (3) |
|
| 10,000 |
|
|
| — |
|
|
| 20,457 | (14) |
|
| 73,736 | (15) |
|
| 122,943 |
|
| ||
Stephen E. Wall |
|
| 18,750 | (3) |
|
| 14,000 |
|
|
| 14,000 |
|
|
| 48,036 | (16) |
|
| 74,990 | (17) |
|
| 169,776 |
|
| ||
(1) During our 2005 fiscal year, our Board held 14 meetings; each non-employee director received $1,000 for each of the meetings that he attended.
(2) During our 2005 fiscal year, our Audit Committee held 11 meetings, our Compensation Committee held five meetings and our Nominating and Governance Committee held four meetings; each non-employee director received $1,000 for each of the meetings held by a committee of which he was a member that he attended.
(3) Consists of (A) $3,750 received in accordance with our former compensation plan as payment for service on our Board during the first quarter of our 2005 fiscal year, and (B) $15,000 received in accordance with our current compensation plan as payment for service on our Board during the remainder of that year.
(4) Consists of: (A) $625 that Dr. Britell received in accordance with our former compensation plan as payment of 50% of the fee to which she was entitled for her service as the chair of our Nominating and Governance Committee during the first quarter of our 2005 fiscal year; (B) $5 that Dr. Britell received in lieu of the fractional shares she would otherwise have received in accordance with our former compensation plan as payment for her services during that quarter; (C) $8,750 that Dr. Britell received in accordance with our current compensation plan as payment for her service as our Lead Independent Director during that year (which represents the $10,000 annual fee to which the Lead Independent Director is entitled under our current compensation plan less the aggregate amount Dr. Britell received for her service as the chair of our Nominating and Governance Committee during the first quarter of the year pursuant to our former compensation plan, as the Lead Independent Director is not entitled to receive additional fees for service as the chair of a committee under our current compensation plan); and (D) $41,286 in dividends paid on Dr. Britell’s unvested shares of restricted common stock and outstanding restricted stock units (dividends in the amount of $0.06, $0.27, $0.34 and $0.35 were paid on January 31, 2005, May 9, 2005, August 8, 2005 and November 7, 2005, respectively, on each such share and unit held by Dr. Britell on the respective date).
(5) Consists of: (A) 460 shares of restricted common stock granted on March 7, 2005 valued at $9.50 per share (the closing price on the date of grant), which vested in full on the first anniversary of the date of grant, that Dr. Britell received in accordance with our former compensation plan as payment of 50% of the fee to which she was entitled for her service on our Board during the first quarter of our 2005 fiscal year and 50% of the fee to which she was entitled for her service as the chair of our Nominating and Governance Committee during that quarter; and (B) 8,484 shares of restricted common stock granted on May 4, 2005 valued at $8.25 per share (the closing price on the date of grant), which will vest in full on the first anniversary of the date of
96
grant, that Dr. Britell received in accordance with our current compensation plan as payment for her service on our Board during our 2005 fiscal year. Such shares are entitled to receive dividends.
(6) Consists of: (A) $625 that Mr. Elliott received in accordance with our former compensation plan as payment of 50% of the fee to which he was entitled for his service as the chair of our Compensation Committee during the first quarter of our 2005 fiscal year; (B) $5 that Mr. Elliott received in lieu of the fractional shares he would otherwise have received in accordance with our former compensation plan as payment for his services during that quarter; (C) $3,750 that Mr. Elliott received in accordance with our current compensation plan as payment for his service as the chair of our Compensation Committee during the remainder of that year; (D) $5,000 that Mr. Elliott received in accordance with our current compensation plan as payment for his service as a member of our Audit Committee during that year; and (E) $54,443 in dividends paid on Mr. Elliott’s unvested shares of restricted common stock and outstanding restricted stock units (dividends in the amount of $0.06, $0.27, $0.34 and $0.35 were paid on January 31, 2005, May 9, 2005, August 8, 2005 and November 7, 2005, respectively, on each such share and unit held by Mr. Elliott on the respective date).
(7) Consists of: (A) 460 shares of restricted common stock granted on March 7, 2005 valued at $9.50 per share (the closing price on the date of grant), which vested in full on the first anniversary of the date of grant, that Mr. Elliott received in accordance with our former compensation plan as payment of 50% of the fee to which he was entitled for his service on our Board during the first quarter of our 2005 fiscal year and 50% of the fee to which he was entitled for his service as the chair of our Compensation Committee during that quarter; and (B) 8,484 shares of restricted common stock granted on May 4, 2005 valued at $8.25 per share (the closing price on the date of grant), which will vest in full on the first anniversary of the date of grant, that Mr. Elliott received in accordance with our current compensation plan as payment for his service on our Board during our 2005 fiscal year. Such shares are entitled to receive dividends.
(8) Consists of: (A) $1,250 that Mr. Farrell received in accordance with our current compensation plan as payment of the fee to which he was entitled for his service as a member of our Audit Committee during the first quarter of our 2005 fiscal year; (B) $7 that Mr. Farrell received in lieu of the fractional shares he would otherwise have received in accordance with our former compensation plan as payment for his services during that quarter; (C) $7,500 that Mr. Farrell received in accordance with our current compensation plan as payment for his service as the chair of our Audit Committee during the remainder of that year; and (D) $16,810 in dividends paid on Mr. Farrell’s unvested shares of restricted common stock (dividends in the amount of $0.06, $0.27, $0.34 and $0.35 were paid on January 31, 2005, May 9, 2005, August 8, 2005 and November 7, 2005, respectively, on each such share and unit held by Mr. Farrell on the respective date).
(9) Consists of: (A) 394 shares of restricted common stock granted on March 7, 2005 valued at $9.50 per share (the closing price on the date of grant), which vested in full on the first anniversary of the date of grant, that Mr. Farrell received in accordance with our former compensation plan as payment of 50% of the fee to which he was entitled for his service on our Board during the first quarter of our 2005 fiscal; and (B) 8,484 shares of restricted common stock granted on May 4, 2005 valued at $8.25 per share (the closing price on the date of grant), which will vest in full on the first anniversary of the date of grant, that Mr. Farrell received in accordance with our current compensation plan as payment for his service on our Board during our 2005 fiscal year. Such shares are entitled to receive dividends.
(10) At the request of Mr. Sadeghi, all compensation to which he is entitled for serving as a director is paid to Equifin Capital Management, LLC. Mr. Sadeghi disclaims beneficial ownership of all such compensation which is equity-based.
(11) Consists of: (A) $7 that Equifin Capital Management, LLC received in lieu of the fractional shares it would otherwise have received in accordance with our former compensation plan as payment for Mr. Sadeghi’s services during the first quarter of our 2005 fiscal year; and (B) $16,810 in dividends paid on Equifin’s unvested shares of restricted common stock (dividends in the amount of $0.06, $0.27, $0.34 and $0.35 were paid on January 31, 2005, May 9, 2005, August 8, 2005 and November 7, 2005, respectively, on each such share and unit held by Equifin on the respective date).
(12) Consists of: (A) 394 shares of restricted common stock granted on March 7, 2005 valued at $9.50 per share (the closing price on the date of grant), which vested in full on the first anniversary of the date of grant, that Equifin Capital Management, LLC received in accordance with our former compensation plan as payment of 50% of the fee to which Mr. Sadeghi was entitled for his service on our Board during the first quarter of our 2005 fiscal; and (B) 8,484 shares of restricted common stock granted on May 4, 2005 valued at $8.25 per share (the closing price on the date of grant), which will vest in full on the first anniversary of the date of grant, that Equifin received in accordance with our current compensation plan as payment for Mr. Sadeghi’s service on our Board during our 2005 fiscal year. Such shares are entitled to receive dividends.
(13) At the request of Mr. Spass, all compensation to which he is entitled for serving as a director is paid to Capital Z Management, LLC. Mr. Spass disclaims beneficial ownership of all such compensation which is equity-based.
(14) Consists of: (A) $7 that Capital Z Management, LLC received in lieu of the fractional shares it would otherwise have received in accordance with our former compensation plan as payment for Mr. Spass’ services during the first quarter of our 2005 fiscal year; and (B) $20,450 in dividends paid on Capital Z’s unvested shares of restricted common stock (dividends in the amount of $0.06, $0.27, $0.34 and $0.35 were paid on January 31, 2005, May 9, 2005, August 8, 2005 and November 7, 2005, respectively, on each such share and unit held by Capital Z on the respective date).
(15) Consists of: (A) 394 shares of restricted common stock granted on March 7, 2005 valued at $9.50 per share (the closing price on the date of grant), which vested in full on the first anniversary of the date of grant, that Capital Z Management, LLC received in
97
accordance with our former compensation plan as payment of 50% of the fee to which Mr. Spass was entitled for his service on our Board during the first quarter of our 2005 fiscal; and (B) 8,484 shares of restricted common stock granted on May 4, 2005 valued at $8.25 per share (the closing price on the date of grant), which will vest in full on the first anniversary of the date of grant, that Capital Z received in accordance with our current compensation plan as payment for Mr. Spass’ service on our Board during our 2005 fiscal year. Such shares are entitled to receive dividends.
(16) Consists of: (A) $1,250 that Mr. Wall received in accordance with our former compensation plan as payment of 50% of the fee to which he was entitled for his service as the chair of our Audit Committee during the first quarter of our 2005 fiscal year; (B) $3 that Mr. Wall received in lieu of the fractional shares he would otherwise have received in accordance with our former compensation plan as payment for his services during that quarter; (C) $3,750 that Mr. Wall received in accordance with our current compensation plan as payment for his service as a member of our Audit Committee during the remainder of that year; and (D) $43,033 in dividends paid on Mr. Wall’s unvested shares of restricted common stock and outstanding restricted stock units (dividends in the amount of $0.06, $0.27, $0.34 and $0.35 were paid on January 31, 2005, May 9, 2005, August 8, 2005 and November 7, 2005, respectively, on each such share and unit held by Mr. Wall on the respective date).
(17) Consists of: (A) 526 shares of restricted common stock granted on March 7, 2005 valued at $9.50 per share (the closing price on the date of grant), which vested in full on the first anniversary of the date of grant, that Mr. Wall received in accordance with our former compensation plan as payment of 50% of the fee to which he was entitled for his service on our Board during the first quarter of our 2005 fiscal year and 50% of the fee to which he was entitled for his service as the chair of our Audit Committee during that quarter; and (B) 8,484 shares of restricted common stock granted on May 4, 2005 valued at $8.25 per share (the closing price on the date of grant), which will vest in full on the first anniversary of the date of grant, that Mr. Wall received in accordance with our current compensation plan as payment for his service on our Board during our 2005 fiscal year. Such shares are entitled to receive dividends.
As an executive of the company, Mr. Meyerson did not receive any fees in accordance with our director compensation plan. Instead, Mr. Meyerson was compensated for his services as a member of our Board pursuant to his employment agreement with us and Aames Financial (which is described below under “Executive Compensation—Employment Contracts, Termination of Employment and Change in Control Agreements”).
Compensation Committee Interlocks and Insider Participation
No one who was a member of our Compensation Committee during our fiscal year ended December 31, 2005 (namely, Jenne K. Britell, John F. Farrell, Jr. and David H. Elliott) has ever been an officer or employee of ours, of our corporate predecessor Aames Financial, or of any of their respective subsidiaries. Nor did any of those persons have any relationship during that year which we would be required to disclose under Item 404 of Regulation S-K.
None of our executive officers served as a member of the board of directors or compensation committee (or other board committee performing equivalent functions) of any other entity, one of whose executive officers served as a member of our Board or our Compensation Committee during our last fiscal year.
98
Report of the Compensation Committee
The information contained in this report should not be deemed to be “soliciting material” or “filed” or incorporated by reference in future filings with the Securities and Exchange Commission, or subject to the liabilities of Section 18 of the Securities Exchange Act of 1934, except to the extent that Aames Investment specifically incorporates such information by reference into a document filed under the Securities Act of 1933 or the Securities Exchange Act of 1934.
Compensation Committee Responsibilities
Aames Investment’s Compensation Committee is responsible for, among other things:
· Reviewing and approving corporate goals and objectives relative to the chief executive officer’s compensation;
· Evaluating the chief executive officer’s performance in light of such goals and objectives;
· Establishing the chief executive officer’s compensation based upon such evaluation;
· Making recommendations to our Board with respect to the compensation of our other executive officers (including the named executive officers) based on the recommendations of our chief executive officer; and
· Administering incentive compensation and equity-based plans, including approving all awards under any such plans.
Compensation Policy and Programs
The Compensation Committee’s responsibility is to align the values of Aames Investment’s stockholders, Aames Investment’s financial performance and the compensation of the Company’s executives by overseeing the design and implementation of a sound compensation program that will attract and retain highly qualified personnel. The compensation programs the Compensation Committee develops are intended to complement Aames Investment’s short- and long-term business objectives and to focus the efforts of the Company’s executives on realizing these objectives.
Each year, aided by information provided by independent consultants with expertise in executive compensation, the Compensation Committee conducts a review of Aames Investment’s executive compensation program, which takes into consideration (1) all compensation previously paid to each of the Company’s executives, whether in the form of cash or equity, any severance and other contingent payments to which each executive might be entitled and the value of any fringe benefits to which the executives might be entitled, (2) the performance of each of the executives during the term of his employment, including his satisfaction of the objective performance goals established by the Board, in the case of the chief executive officer, and the chief executive officer, in the case of the other executive officers and subjective criteria such as his initiative and leadership ability, and (3) all forms of compensation paid by companies in the same industry as the Company or which are otherwise similar to the Company. The Compensation Committee then considers the results of its review of the compensation program and the performance objectives established for the Company’s executive officers for the upcoming year and approves base salaries and target bonus levels of compensation for each executive for such year. The Compensation Committee may also make equity-based awards to our executives at that time, or from time to time throughout any year. The aggregate amount of compensation actually paid to each of the Company’s executives for any year is dependent upon the Company’s overall performance for such year, the executive’s efforts during that year as measured by reference to his achievement of his performance objectives, the amount of equity-based awards made to such executive in past years, any contingent
99
payments to which such executive might be entitled and the value of any fringe benefits provided to such executive.
Aames Investment’s executive officers (including the named executive officers) were eligible for three types of compensation for their service during the Company’s 2005 fiscal year—base salary, near-term incentive compensation in the form of cash bonuses and long-term incentive compensation in the form of stock options or stock awards.
Base Salary
In establishing the base salary for Aames Investment’s chief executive officer and formulating its recommendation with respect to the base salary for the Company’s other executive officers, the Compensation Committee considers: (1) all forms of compensation paid by comparable companies, (2) the degree of responsibility generally given by the Company to the officers in such positions, and (3) internal issues of consistency and fairness. The Compensation Committee also considers the recommendations of Aames Investment’s chief executive officer when preparing the committee’s proposal with respect to the base salaries of the Company’s other executive officers.
In connection with the REIT reorganization, Aames Investment and its corporate predecessor, Aames Financial, entered into an employment agreement with Aames Investment’s chief executive officer, A. Jay Meyerson, the terms and conditions of which are discussed above under “Executive Compensation—Employment Contracts, Termination of Employment and Change in Control Agreements.” Pursuant to his employment agreement, Mr. Meyerson is entitled to a base salary of at least $425,000 per year during the term of the agreement, the amount of which is based upon:
· The financial performance and results of Aames Financial prior to the REIT reorganization, as measured by reference to the level of achievement of objectives established by Aames Financial’s Board, which included (1) increasing the Company’s net income, (2) strengthening the Company’s balance sheet, (3) improving or maintaining the Company’s market share, (4) positively differentiating the Aames brand, and (5) completing the REIT reorganization;
· The contributions Mr. Meyerson’s made to Aames Financial’s overall corporate performance and realization of such objectives, including the initiative and leadership Mr. Meyerson displayed prior to and during the REIT reorganization; and
· The payments received by the chief executive officers of Aames Investment’s competitors around the time the agreement was entered into.
In accordance with Mr. Meyerson’s employment agreement, the Compensation Committee reviews the minimum annual base salary to which he is entitled at the same time and in the same manner as the committee reviews the compensation paid to Aames Investment’s other executive officers to determine whether any increase in Mr. Meyerson’s base salary is appropriate. In accordance with the agreement, Mr. Meyerson received a base salary of $425,000 for his service during the Company’s 2005 fiscal year.
None of our other executive officers is party to an employment agreement with Aames Investment or Aames Financial.
Bonuses
The Compensation Committee believes that, to encourage the attainment of Aames Investment’s goals, a substantial portion of the annual compensation of each executive officer should be in the form of variable incentive pay.
100
As such, on February 10, 2004, the Board of Directors of our corporate predecessor, Aames Financial, approved an incentive compensation plan pursuant to which each of the Company’s executive officers was eligible to receive a cash bonus in 2005, the amount of which was based upon:
· The Company’s profitability during the year ended December 31, 2004, as measured by reference to the Company’s loan production and operating income as determined by the Board; and
· The assessment of the Compensation Committee, in the case of the chief executive officer, and the chief executive officer together with the Compensation Committee, in the case of each other executive officer, of such executive’s contribution to the Company’s overall financial performance, as measured by reference to such executive’s performance of his job duties, including the satisfaction of the responsibilities associated with his position, the completion of any special project given to him and his achievement of the personal performance objectives for that year to which the Board and the chief executive officer, in the case of the CEO, and the chief executive officer and the executive, in the case of each other executive, agreed prior to the beginning of the year.
Mr. Meyerson’s target bonus for such year was $625,000. In March 2005, he was awarded a bonus equal to 96% of that target (i.e., $600,000). In accordance with the incentive compensation plan, the amount Mr. Meyerson’s bonus payment was based on:
· the Board’s determination of the Company’s profitability for the year ended December 31, 2004, as measured by reference to both the Company’s performance as if the REIT reorganization did not occur—which showed an overall achievement of 93% of the loan production and operating income objectives—and the Company’s performance including the REIT reorganization—which showed on overall achievement of 124% of the loan production and operating income objectives; and
· the Compensation Committee’s assessment of his performance, as measured by reference to his personal performance objectives—which he was found to have satisfied.
The Compensation Committee determined that, as Mr. Meyerson satisfied his performance objectives and the Company’s profitability was at or near the stated goal, the amount of his bonus should approximate his target.
The bonus targets for the executive officers other than Mr. Meyerson for the year ended December 31, 2004 ranged from 83% to 120% of the officers’ respective salaries, and the payments to such officers ranged from 75% to 114% of their respective targets.
Equity-Based Awards
The Compensation Committee believes that equity-based incentive awards align the interests of the executive officers with those of the stockholders, thereby providing each executive officer with a significant incentive to manage the Company from the perspective of an owner of the business. The Compensation Committee also believes that time-vested awards, such as restricted stock awards, encourage executive retention.
As such, in 2004 Aames Investment adopted an omnibus equity incentive plan in order to make equity-based awards to its employees, directors and consultants (i.e., the Amended and Restated Aames Investment Corporation 2004 Equity Incentive Plan). In determining whether to make grants under the Amended and Restated Aames Investment Corporation 2004 Equity Incentive Plan, the Compensation Committee considers the aggregate number of shares available for grant under such plan, the performance of Aames Investment, the practices of companies comparable to Aames Investment and prior awards made to the Company’s executives. If the Compensation Committee determines to make equity-based awards to Aames Investment’s executive officers, the committee considers the degree of responsibility generally given by the Company to officers in each rank of the Company’s management and the size of award
101
necessary to create a meaningful opportunity for officers of such rank for reward predicated on increasing value for the Company’s stockholders, and establishes guidelines for the size and terms of grants to officers in each rank. In determining the actual award for any individual officer the Compensation Committee will consider, in addition to such officer’s rank, his performance history, his potential for future responsibility and promotion and any past grants made to him, and the relative weight given to any particular factor may vary among the individuals eligible for grant at the Compensation Committee’s discretion. The Compensation Committee may decide not to make any equity-based grants in a given year, or may decide to make grants to certain officers but not others, whether or not of the same rank, in its discretion.
Internal Revenue Code Section 162(m)
Section 162(m) of the Internal Revenue Code limits the federal income tax deduction publicly held companies may take for compensation in excess of $1,000,000 paid in a given fiscal year to certain of the named executive officers, if the compensation is not “performance based” within the meaning of the Section 162(m) rules. In order to qualify as performance based, the compensation must, among other things, be based on performance goals set by a committee of at least two “outside directors.” In addition, compensation paid in the form of equity must be granted pursuant to a plan approved by the company’s stockholders. The Board has determined that each of us is an outside director and the Amended and Restated Aames Investment Corporation 2004 Equity Incentive Plan has been designed so that we may make awards thereunder which are performance-based compensation. It is the Compensation Committee’s policy to maximize Aames Investment’s ability to obtain a corporate tax deduction for compensation paid to the Company’s executive officers to the extent doing so is consistent with the interests of the Company and its stockholders in retaining and motivating key executives. Aames Investment believes that it will be able to deduct the amount of all of the compensation paid to each named executive officer for 2005.
| COMPENSATION COMMITTEE |
| David H. Elliott, Chair |
| Jenne K. Britell |
| John F. Farrell, Jr. |
102
Performance Graph
The following graph compares the cumulative total shareholder return on our common stock with that of the NYSE Composite Index and a grouping of issuers in the subprime mortgage lending business consisting of Accredited Home Lenders Holding Co., New Century Financial Corporation, NovaStar Financial, Inc. and Saxon Capital, Inc. for the period beginning November 2, 2004—the date our common stock began trading on the New York Stock Exchange—and ending on December 31, 2005, assuming in each case that all dividends were reinvested.
The comparison in the following graph is based on historical data and is not intended to forecast the possible future performance of our common stock. Our common stock was first offered at $8.50 per share. The graph reflects the closing price of $9.30 per share on November 2, 2004, our first day of trading on the New York Stock Exchange. The graph assumes that the value of an investment in our common stock and each index was $100 on November 2, 2004.
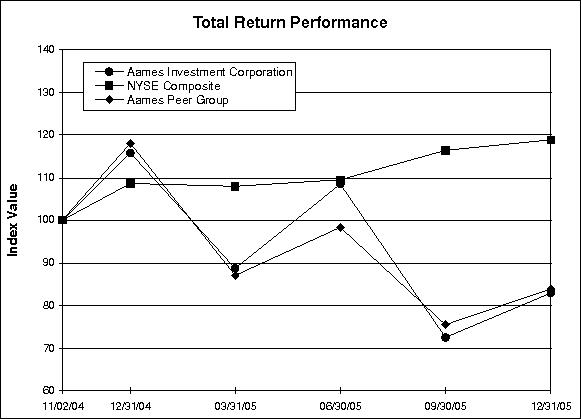
|
| Period Ending |
|
| ||||||||||||||||||||||||
Index |
|
|
| 11/02/04 |
| 12/31/04 |
| 03/31/05 |
| 06/30/05 |
| 09/30/05 |
| 12/31/05 |
|
| ||||||||||||
Aames Investment Corporation |
|
| 100.00 |
|
|
| 115.71 |
|
|
| 88.68 |
|
|
| 108.42 |
|
|
| 72.50 |
|
|
| 82.92 |
|
| |||
NYSE Composite Index |
|
| 100.00 |
|
|
| 108.58 |
|
|
| 107.91 |
|
|
| 109.45 |
|
|
| 116.34 |
|
|
| 118.81 |
|
| |||
Aames Peer Group |
|
| 100.00 |
|
|
| 117.99 |
|
|
| 87.02 |
|
|
| 98.30 |
|
|
| 75.48 |
|
|
| 83.88 |
|
| |||
The information contained in the Performance Graph section should not be deemed to be “soliciting material” or “filed” or incorporated by reference in future filings with the SEC, or subject to the liabilities of Section 18 of the Securities Exchange Act of 1934, except to the extent that we specifically incorporate such information by reference into a document filed under the Securities Act of 1933 or the Securities Exchange Act of 1934.
103
Item 12. Security Ownership of Certain Beneficial Owners and Management and Related Stockholder Matters
The following table sets forth information known to us with respect to beneficial ownership of our common stock as of March 24, 2006 by:
· each person known by us to beneficially own more than 5% of our common stock;
· each our of directors and nominees;
· each of our named executive officers; and
· all of our directors and executive officers as a group.
The following table is based upon information supplied to us by our officers, directors and principal stockholders and any Schedules 13D and 13G filed with the SEC. Beneficial ownership is determined under the rules of the SEC and generally includes voting or investment power with respect to securities. We know of no agreements among our stockholders that relate to the voting of, or dispositive power over, our common stock and, unless otherwise indicated and subject to community property laws where applicable, we believe that each of the stockholders named in the following table has sole voting and investment power with respect to the shares indicated as beneficially owned by such. The number of shares beneficially owned by each person or group as of March 24, 2006 includes shares of common stock such person had the right to acquire on or within 60 days of that date (i.e., May 23, 2006), including upon the distribution of common stock pursuant to the terms of any restricted stock unit agreement or restricted stock award agreement to which he is a party.
Name and Address of Beneficial Owner(1) |
|
|
| Number of |
| Percentage |
| ||
Specialty Finance Partners (and affiliates)(3) |
| 13,944,742 | (4) |
| 22.54 | % |
| ||
Friedman, Billings, Ramsey Group, Inc.(5) |
| 4,707,900 |
|
| 7.61 |
|
| ||
AMVESCAP PLC (and affiliates)(6) |
| 4,317,100 | (7) |
| 6.98 |
|
| ||
Hotchkis and Wiley Capital Management, LLC(8) |
| 5,915,840 | (9) |
| 9.56 |
|
| ||
Wellington Management Company, LLP(10) |
| 3,928,950 | (11) |
| 6.35 |
|
| ||
Dr. Jenne K. Britell Ph.D. |
| 17,874 | (12) |
| * |
|
| ||
David H. Elliott |
| 18,014 | (13) |
| * |
|
| ||
John F. Farrell, Jr. |
| 18,772 | (14) |
| * |
|
| ||
John P. Kim |
| 5,110 |
|
| * |
|
| ||
104
Barry M. Levine |
| 59,389 |
|
| * |
|
|
John F. Madden, Jr. |
| 38,231 |
|
| * |
|
|
A. Jay Meyerson |
| 328,516 |
|
| * |
|
|
Mani A. Sadeghi |
| 19,772 | (15) |
| * |
|
|
Robert A. Spass |
| 14,123,510 | (16) |
| 22.82 |
|
|
Jon D. Van Deuren |
| 26,644 | (17) |
| * |
|
|
Stephen E. Wall |
| 28,006 | (18) |
| * |
|
|
All executive officers and directors as a group (14 persons) |
| 14,734,554 | (19) |
| 23.81 |
|
|
* Less than 1%
(1) Unless otherwise stated, the business address of each person included in the table is c/o Aames Investment Corporation, 350 South Grand Avenue, 43rd Floor, Los Angeles, California 90071.
(2) For each person included in the table, percentage ownership is calculated by dividing the number of shares beneficially owned by such person or group as described above by 61,877,547—the number of shares outstanding on March 24, 2006—and the number of shares of common stock that such person had the right to acquire on or within 60 days of that date, including the distribution of common stock under the terms of the individual’s restricted stock unit agreement or any restricted stock award agreement to which he is a party.
(3) Based on solely the information contained in the Schedule 13D filed with the SEC by Specialty Finance Partners and certain of its affiliates on November 15, 2004 and information supplied to us by certain of members of our Board.
(4) Consists of (A) 13,932,970 shares owned by Specialty Finance Partners, a Bermuda general partnership, and (B) 11,772 shares owned by Capital Z Management, LLC, 3,288 of which it held as of March 24, 2006 and 8,484 it has the right to acquire as of May 5, 2006. Specialty Finance Partners is ultimately controlled by Capital Z Partners, Ltd., a Bermuda corporation owned by 13 individuals, none of whom own more than 10% or more of its voting securities. Capital Z Management, a Delaware limited liability company, performs investment management services for Capital Z Partners and its portfolio companies and, as such, is an affiliate of Specialty Finance Partners. Mr. Spass is a member of the board of Capital Z Partners and the chairman of the board and a partner of Capital Z Management.
(5) Based solely on the information contained in the Schedule 13G/A filed with the SEC by Friedman, Billings, Ramsey Group, Inc. on February 14, 2006.
(6) Based solely on the information contained in the Schedule 13G filed with the SEC by AMVESCAP PLC and certain of its affiliates on February 14, 2005.
(7) The shares are held by subsidiaries of AMVESCAP PLC as follows: AIM Advisors, Inc. owns 4,027,800 shares, AIM Capital Management, Inc owns 251,600 shares and INVESCO Institutional (N.A)., Inc. owns 37,700 shares.
(8) Based solely on the information contained in the Schedule 13G/A filed with the SEC by Hotchkis & Wiley Capital Management, LLC on February 14, 2006.
(9) Hotchkis and Wiley Capital Management, LLC has sole voting power with respect to 4,658,640 shares and sole dispositive power with respect to 5,915,840 shares. The shares are owned of record by clients of HWCM who have the right to receive, or the power to direct the receipt of, dividends from, or the proceeds from the sale of, such shares and HWCM disclaims beneficial ownership of all such shares.
(10) Based solely on the information contained in the Schedule 13G filed with the SEC by Wellington Management Company, LLC on February 14, 2006.
(11) Wellington Management Company, LLP has shared voting power with respect to 2,902,150 shares and shared dispositive power with respect to 3,928,950 shares. The shares are owned by record by clients of Wellington Management who have the right to receive, or the power to direct the receipt of, dividends from, or the proceeds from the sale of, such shares.
(12) Consists of 9,390 shares Dr. Britell held as March 24, 2006 and 8,484 shares she has the right to acquire as of May 5, 2006, when restricted common stock she received on May 5, 2005 as compensation for her service as a director vests.
105
(13) Consists of 9,530 shares Mr. Elliott held as March 24, 2006 and 8,484 shares he has the right to acquire as of May 5, 2006, when restricted common stock he received on May 5, 2005 as compensation for his service as a director vests. Mr. Elliott shares voting and investment power with respect to all such shares with his wife, Jeanne M. Elliott.
(14) Consists of 10,288 shares Mr. Farrell held as March 24, 2006 and 8,484 shares he has the right to acquire as of May 5, 2006, when restricted common stock he received on May 5, 2005 as compensation for his service as a director vests.
(15) Consists of (A) 8,000 shares Mr. Sadeghi directly owns, all of which he held as of March 24, 2006, and (B) 11,772 shares owned by Equifin Capital Management LLC, 3,288 of which it held as of March 24 2006 and 8,484 it has the right to acquire as of May 5, 2006, when restricted common stock the company received on May 5, 2005 as compensation for Mr. Sadeghi’s service as a director vests. Mr. Sadeghi is the chief executive officer of Equifin Capital Management and, as such, may be deemed to beneficially own the shares of common stock it owns. Mr. Sadeghi disclaims beneficial ownership of the shares directly owned by Equifin Capital Management.
(16) Consists of (A) 178,768 shares Mr. Spass directly owns, all of which he held as of March 24, 2006, (B) 11,772 shares owned by Capital Z Management, LLC, 3,288 of which it held as of March 24, 2006 and 8,484 it has the right to acquire as of May 5, 2006, when restricted common stock the company received on May 5, 2005 as compensation for Mr. Spass’ service as a director vests and, (C) 13,932,970 shares owned by Specialty Finance Partners, all of which it held as of March 24, 2006. Mr. Spass is the chairman of the board and a partner of Capital Z Management and, as such, may be deemed to beneficially own the shares of common stock it owns. Capital Z Management is an affiliate of, and Mr. Spass is a director of, Capital Z Partners, Ltd., the entity which ultimately controls Specialty Finance Partners, and, as such, Mr., Spass may be deemed to beneficially own the shares of common stock Specialty Finance Partners owns. Mr. Spass disclaims beneficial ownership of the shares directly owned by both Capital Z Management and Specialty Finance Partners.
(17) Consists of (A) 14,631 shares Mr. Van Deuren held as of March 24, 2006, (B) 8,263 shares he has the right to receive on March 31, 2006 pursuant to the terms of his restricted stock unit agreement, and (C) 3,750 he has the right to acquire as of May 5, 2006, when restricted common stock he received on May 5, 2005 in connection with his promotion to chief financial officer vests.
(18) Consists of 19,522 shares Mr. Wall held as March 24, 2006 and 8,484 shares he has the right to acquire as of May 5, 2006, when restricted common stock he received on May 5, 2005 as compensation for his service as a director vests.
(19) Includes the aggregate of 14,671,637 shares the members of the group held as of March 24, 2006 and the aggregate of 62,917 shares the members of the group had the right to acquire on or prior to May 23, 2006.
We know of no arrangement the operation of which may, at a later date, result in a change of control of us.
Equity Compensation Plan Information
The Amended and Restated Aames Investment Corporation 2004 Equity Incentive Plan is our only compensation plan under which our equity securities are authorized for issuance, and it allows us to make awards to our officers and other employees, directors and all other persons who provide us services. Those awards may be stock options, SARs or “full value awards” (including shares of restricted stock and restricted stock units). Currently, a maximum of 5,550,000 shares of our common stock may be issued upon the exercise of stock options or SARs, in connection with the vesting of shares of restricted common stock or upon the distribution of shares underlying restricted stock units. To date, all awards made under the Plan have been full value awards and each share of our common stock underlying a full value award reduces the number of shares available for future issuance by 2.5 shares.
The Plan was adopted by our Board on July 21, 2004, approved by the stockholders of our former parent corporation, Aames Financial, on October 6, 2004 and became effective in connection with our reorganization as a REIT and our initial public offering in November 2004. On March 7, 2005, our Board approved an amendment and restatement of the Plan; because of the nature of the amendment, we were not required pursuant to the terms of the Plan or the applicable governance rules of the New York State Exchange to seek, and we did not obtain, stockholder approval of it.
106
The following table provides information as of December 31, 2005 with respect to the shares of our common stock that may be issued under that plan.
|
| (a) |
| (b) |
| (c) |
| ||||||
|
| Number of securities to be |
| Weighted-average |
| Number of securities |
| ||||||
Amended and Restated Aames Investment Corporation 2004 Equity Incentive Plan |
|
| — | (1) |
|
| — |
|
|
| 122,160 | (2) |
|
(1) The table does not include the 716,551 restricted stock units granted in connection with our reorganization or the 936,516 shares of restricted stock granted as compensation which were outstanding as of December 31, 2005 that do not have an exercise price.
(2) Each share of our common stock granted as a restricted stock unit or restricted stock award reduces the number of shares available for future issuance under the plan by 2.5 shares.
Item 13. Certain Relationships and Related Transactions
Robert A. Spass, one of our directors and director nominees, is a director of Capital Z Partners, Ltd., the entity which ultimately controls Specialty Finance Partners, and is chairman of the board and a partner of Capital Z Management, LLC. In connection with our REIT reorganization, Specialty Finance Partners and Capital Z Management received an aggregate of 13,986,556 shares of our common stock, 61,486 restricted stock units and $118,885,755 in cash in exchange for their ownership interest in our corporate predecessor, Aames Financial. In connection with that reorganization and the simultaneous initial public offering of our common stock, we entered into a registration rights and governance agreement with Specialty Finance Partners and Capital Z Management. This agreement provides Specialty Finance Partners and Capital Z Management with certain rights with respect to the registration of the shares of our common stock that they hold. In addition, for so long as they collectively own at least 12.5% of our outstanding shares, Specialty Finance Partners and Capital Z Management have the right to designate two nominees to our Board, and if Specialty Finance Partners and Capital Z Management collectively own less than 12.5%, but at least 5%, of our outstanding shares, they will have the right to designate one such nominee. The agreement also requires us to support the nomination of each such individual for election to our Board and to use our best efforts to cause him to be so elected. Specialty Finance Partners and Capital Z Management collectively owned more than 12.5% of our outstanding common stock as of March 10, 2006 and have nominated Mr. Spass and Mani A. Sadeghi to serve on our Board.
107
Item 14. Principal Independent Registered Public Accounting Firm Fees and Services
Principal Accountant Fees and Services
The following is a summary of the fees billed to us by Ernst & Young LLP for professional services the firm rendered for the fiscal year ended December 31, 2005 and the six months ended December 31, 2004 and the fees billed to Aames Financial for services the firm rendered for the fiscal year ended June 30, 2004:
|
| Fiscal 2005 |
| Six Months Ended |
| Fiscal 2004 |
| |||||
Audit fees |
| $ | 1,290,500 |
|
| $ | 465,000 |
|
| $ | 612,000 |
|
Audit related fees |
| $ | 145,443 |
|
| $ | 295,500 |
|
| $ | 258,000 |
|
Tax fees |
| $ | 399,395 |
|
| $ | 117,000 |
|
| $ | 530,000 |
|
All other fees |
| — |
|
| — |
|
| — |
| |||
Total |
| $ | 1,835,338 |
|
| $ | 877,000 |
|
| $ | 1,400,000 |
|
Audit Fees. Audit fees are those fees billed for professional services rendered for the audit of our consolidated financial statements for the fiscal year ended December 31, 2005 and the six months ended December 31, 2004 and Aames Financial’s consolidated financial statements for the fiscal year ended June 30, 2004, review of the interim consolidated financial statements included in our and Aames Financial’s quarterly reports and services that are normally provided by Ernst & Young in connection with statutory and regulatory filings or engagements.
Audit-Related Fees. Audit-related fees are those fees billed for assurance and related services that reasonably related to the performance of the audit or review of our and Aames Financial’s consolidated financial statements and are not reported under “Audit Fees.” These services include professional services regarding accounting consultations in connection with audits of employee benefit plans, preparation of registration statements on Forms S-11 and S-4 in the six-month period ended December 31, 2004 and in the fiscal year ended June 30, 2004, professional services related to securitization due diligence, professional services related to our compliance with the requirements of the Sarbanes-Oxley Act of 2002 and accounting consultations in connection with our issuance of restricted stock units.
Tax Fees. Tax fees are those fees billed for professional services for tax compliance, tax advice and tax planning. These services include assistance regarding federal and state tax compliance and assistance with tax reporting requirements and audit compliance. They also include tax consulting services in connection with our conversion into a real estate investment trust in the six-month period ended December 31, 2004 and in the fiscal year ended June 30, 2004.
Policy on Audit Committee Pre-Approval of Audit and Permissible Non-Audit Services of Independent Auditors
Consistent with the policies of the SEC regarding auditor independence, our Audit Committee is directly responsible for the appointment, compensation and oversight of our independent registered public accounting firm. In recognition of this responsibility, our Audit Committee has established the following procedures for the pre-approval of all audit and permissible non-audit services provided by such firm. Prior to the engagement of the independent registered accounting firm for the next year’s audit, our management submits to the Audit Committee a detailed list of each of the audit, audit-related, tax and other services expected to be provided by the firm during that year, an estimate of cost of such services and, where necessary to ensure our Audit Committee has a sufficient understanding of the services, detailed documentation regarding such services. The Audit Committee reviews the list and any related documentation, considers the impact that each proposed service may have on the independent registered accounting firm’s independence from us and then approves a detailed list of the services the firm may
108
provide which includes a budget for each service. Our independent registered public accounting firm and management periodically report to our Audit Committee regarding the services provided by the firm in accordance with this pre-approval and the fees for such services. Where the fee for a pre-approved service is materially in excess of the amount budgeted for such service at the time of its pre-approval, the excess amount will not be paid without the approval of our Audit Committee or its Chair. Similarly, if our management desires to engage the firm for a service that has not be pre-approved by our Audit Committee, whether because it was not contemplated at the time of our Audit Committee’s initial pre-approval or otherwise, the firm may not be engaged to provide such service until the specific pre-approval of our Audit Committee or its Chair has been obtained. If the Chair of our Audit Committee so pre-approves any fee or service, he will report his pre-approval decision to the Audit Committee at its next meeting.
In accordance with the foregoing procedures, all professional services provided by Ernst & Young LLP to us during our fiscal year ended December 31, 2005 and the six months ended December 31, 2004 were pre-approved by our Audit Committee, and all professional services provided by Ernst & Young LLP to Aames Financial during its fiscal year ended June 30, 2004 were pre-approved by Aames Financial’s Audit Committee, without any reliance on the de minimis exception to the requirement that all such services be pre-approved by the Audit Committee set forth in Section 2.01(c)(7)(i)(C) of Regulation S-X.
109
Item 15. Exhibits and Financial Statement Schedules
(a) The following documents are filed as part of this report:
(1) Consolidated Financial Statements: Financial Statements listed as part of “Item 8. Financial Statements and Supplementary Data.”
(2) Exhibits: All exhibits listed in the “Exhibit Index” are filed with this report or are incorporated by reference into this report.
110
Pursuant to the requirements of Section 13 or 15(d) of the Securities Exchange Act of 1934, the registrant has duly caused this report to be signed on its behalf by the undersigned, thereunto duly authorized.
|
|
| AAMES INVESTMENT CORPORATION | |
Dated: March 27, 2006 |
| By: |
| /S/ A. JAY MEYERSON |
|
|
|
| A. Jay Meyerson |
Pursuant to the requirements of the Securities Exchange Act of 1934, this Report has been signed below by the following persons on behalf of the registrant and in the capacities and on the dates indicated.
Signature |
|
|
| Title |
|
|
| Date |
| |
/s/ JENNE K. BRITELL |
| Lead Independent Director |
| March 27, 2006 | ||||||
Jenne K. Britell |
|
|
|
| ||||||
/s/ DAVID H. ELLIOTT |
| Director |
| March 27, 2006 | ||||||
David H. Elliott |
|
|
|
| ||||||
/s/ JOHN F. FARRELL |
| Director |
| March 27, 2006 | ||||||
John F. Farrell |
|
|
|
| ||||||
/s/ A. JAY MEYERSON |
| Chairman of the Board and Chief Executive Officer |
| March 27, 2006 | ||||||
A. Jay Meyerson |
| (Principal Executive Officer) |
|
| ||||||
/s/ MANI A. SADEGHI |
| Director |
| March 27, 2006 | ||||||
Mani A. Sadeghi |
|
|
|
| ||||||
/s/ ROBERT A. SPASS |
| Director |
| March 27, 2006 | ||||||
Robert A. Spass |
|
|
|
| ||||||
/s/ JON D. VAN DEUREN |
| Executive Vice President—Finance and Chief |
| March 27, 2006 | ||||||
Jon D. Van Deuren |
| Financial Officer (Principal Financial Officer) |
|
| ||||||
/s/ STEPHEN E. WALL |
| Director |
| March 27, 2006 | ||||||
Stephen E. Wall |
|
|
|
| ||||||
111
Exhibit No. |
| Description |
2.1 |
| Form of Agreement and Plan of Merger (incorporated by reference to Exhibit 2.1 to Amendment No. 3 to the registration statement on Form S-11 (333-113890) filed with the SEC on September 7, 2004 (“Amendment No. 3 to S-11”)). |
3.1 |
| Articles of Amendment and Restatement (incorporated by reference to Exhibit 3.1 to the Aames Investment Corporation Annual Report on Form 10-K for the fiscal year ended December 31, 2004 (the “2004 10-K”)). |
3.2 |
| Amended and Restated Bylaws. |
4.1 |
| Common Stock Certificate (incorporated by reference to Exhibit 4.1 to Amendment No. 3 to S-11). |
10.1 |
| Amended and Restated Aames Investment Equity Incentive Plan (incorporated by reference to Exhibit 10.1 to the 2004 10-K). |
10.2 |
| Registration Rights and Governance Agreement dated November 1, 2004 among Specialty Finance Partners, Capital Z Management LLC and Aames Investment (incorporated by reference to Exhibit 10.2 to the 2004 10-K). |
10.3 |
| Employment Agreement dated November 3, 2004 among Aames Investment Corporation, Aames Financial Corporation and A. Jay Meyerson (incorporated by reference to Exhibit 10.3 to the 2004 10-K).* |
10.4 |
| Form of Aames Investment Corporation Indemnification Agreement with directors and executive officers (incorporated by reference to Exhibit 10.4 to the 2004 10-K).* |
10.5(b) |
| Amendment No. 1 dated March 18, 2005 to Master Repurchase Agreement dated August 5, 2004 among Bear Stearns Mortgage Capital Corporation, Aames Capital Corporation, Aames Investment Corporation, and Aames Funding Corporation (incorporated by reference to Exhibit 10.5(b) to the 2004 10-K). |
10.5(c) |
| Extension Letter to the Master Repurchase Agreement dated as of July 29, 2005 by and among Bear Stearns Mortgage Capital Corporation, Aames Capital Corporation, Aames Investment Corporation and Aames Funding Corporation (incorporated by reference to Exhibit 10.5(d) to the June 2005 10-Q). |
10.5(d) |
| Amendment No. 3 to the Master Repurchase Agreement dated as of October 31, 2005 by and among Bear Stearns Mortgage Capital Corporation, Aames Capital Corporation, Aames Investment Corporation and Aames Funding Corporation (incorporated by reference to Exhibit 10.5(e) to the September 30, 2005 10-Q (the “September 2005 10-Q”)). |
10.5(e) |
| Amendment No. 4 to the Master Repurchase Agreement dated as of March 1, 2006 by and among Bear Stearns Mortgage Capital Corporation, Aames Capital Corporation, Aames Investment Corporation and Aames Funding Corporation. |
10.6 |
| Stock Purchase Agreement dated November 1, 2004 by and among Aames Investment Corporation, Friedman, Billings, Ramsey Group, Inc., Aames Financial Corporation, Aames TRS, Inc. and Aames Newco, Inc. (incorporated by reference to Exhibit 10.6 to Amendment No. 10 to the registration statement on Form S-11 333-113890 filed with the SEC on October 29, 2004). |
112
10.7 |
| Registration Rights Agreement dated November 1, 2004 by and between Aames Investment Corporation, Inc. and Friedman, Billings, Ramsey Group, Inc. (incorporated by reference to Exhibit 10.7 to the 2004 10-K). |
10.8(a) |
| Master Repurchase Agreement among Aames Capital Corporation, Aames Funding Corporation, Aames Investment Corporation and Morgan Stanley Bank dated December 2, 2005. |
10.8(b) |
| Amendment No. 1 dated as of January 5, 2006 to the Master Repurchase Agreement among Aames Capital Corporation, Aames Funding Corporation and Morgan Stanley Bank dated December 2, 2005. |
10.8(c) |
| Amendment No. 2 dated as of March 3, 2006 to the Master Repurchase Agreement among Aames Capital Corporation, Aames Funding Corporation and Morgan Stanley Bank dated December 2, 2005. |
10.9(a) |
| Amended and Restated Master Loan and Security Agreement dated as of April 28, 2005 among Aames Capital Corporation, Aames Investment Corporation and Citigroup Global Markets Realty Corp. (incorporated by reference to Exhibit 10.9 to the June 2005 10-Q). |
10.9(b) |
| Amendment Number One dated as of September 30, 2005 to the Amended and Restated Master Loan and Security Agreement dated as of April 28, 2005 among Aames Capital Corporation, Aames Investment Corporation and Citigroup Global Markets Realty Corp. (incorporated by reference to Exhibit 10.9(b) to the September 2005 10-Q). |
10.9(c) |
| Amendment Number Two dated as of November 3, 2005 to the Amended and Restated Master Loan and Security Agreement dated as of April 28, 2005 among Aames Capital Corporation, Aames Investment Corporation and Citigroup Global Markets Realty Corp. (incorporated by reference to Exhibit 10.9(c) to the September 2005 10-Q). |
10.9(d) |
| Amendment Number Three dated as of March 1, 2006 to the Amended and Restated Master Loan and Security Agreement dated as of April 28, 2005 among Aames Capital Corporation, Aames Investment Corporation and Citigroup Global Markets Realty. |
10.10(a) |
| Warehouse Loan and Security Agreement dated as of February 10, 2000 as Amended and Restated to and including February 4, 2005 among Aames Investment Corporation, Aames Capital Corporation, Aames Funding Corporation and Greenwich Capital Financial Products, Inc. (incorporated by reference to Exhibit 10.10 to the 2004 10-K). |
10.10(b) |
| Amendment Number One dated May 25, 2005 to the Warehouse and Loan Security Agreement among Aames Investment Corporation, Aames Capital Corporation, Aames Funding Corporation and Greenwich Capital Financial Products, Inc. (incorporated by reference to Exhibit 10.10(b) to the June 2005 10-Q). |
10.10(c) |
| Amendment Number Three dated July 29, 2005 to the Warehouse and Loan Security Agreement among Aames Investment Corporation, Aames Capital Corporation, Aames Funding Corporation and Greenwich Capital Financial Products, Inc. (incorporated by reference to Exhibit 10.10(d) to the September 2005 10-Q). |
10.10(d) |
| Amendment Number Four dated August 15, 2005 to the Warehouse and Loan Security Agreement among Aames Investment Corporation, Aames Capital Corporation, Aames Funding Corporation and Greenwich Capital Financial Products, Inc. (incorporated by reference to Exhibit 10.10(e) to the September 2005 10-Q). |
113
10.10(e) |
| Amendment Number Five dated October 31, 2005 to the Warehouse and Loan Security Agreement among Aames Investment Corporation, Aames Capital Corporation, Aames Funding Corporation and Greenwich Capital Financial Products, Inc. (incorporated by reference to Exhibit 10.10(f) to the September 2005 10-Q). |
10.10(f) |
| Amendment Number Six dated January 18, 2006 to the Warehouse Loan and Security Agreement among Aames Investment Corporation, Aames Capital Corporation, Aames Funding Corporation and Greenwich Capital Financial Products, Inc. |
10.10(g) |
| Amendment Number Eight dated March 1, 2006 to the Warehouse Loan and Security Agreement among Aames Investment Corporation, Aames Capital Corporation, Aames Funding Corporation and Greenwich Capital Financial Products, Inc. |
10.11(a) |
| Master Repurchase Agreement Governing Purchases and Sales of Mortgage Loans dated as of January 18, 2005 among Lehman Brothers Bank, FSB, Aames Capital Corporation and Aames Investment Corporation (incorporated by reference to Exhibit 10.11 to the 2004 10-K). |
10.11(b) |
| Second Amendment dated October 28, 2005 to Master Repurchase Agreement Governing Purchases and Sales of Mortgage Loans among Lehman Brothers Bank, FSB, Aames Capital Corporation and Aames Investment Corporation (incorporated by reference to Exhibit 10.11(c) to the September 2005 10-Q). |
1011(c) |
| Third Amendment dated as of January 17, 2006 to the Master Repurchase Agreement Governing Purchases and Sales of Mortgage Loans among Lehman Brothers Bank, FSB, Aames Capital Corporation and Aames Investment Corporation (incorporated by reference to Exhibit 10.11(d) to the September 2005 10-Q). |
10.11(d) |
| Fourth Amendment dated as of March 3, 2006 to the Master Repurchase Agreement Governing Purchases and Sales of Mortgage Loans among Lehman Brothers Bank, FSB, Aames Capital Corporation and Aames Investment Corporation. |
10.12(a) |
| Revolving Credit and Security Agreement dated as of July 1, 2003 among Aames Capital Corporation, Aames Funding Corporation and Countrywide Warehouse Lending (incorporated by reference to Exhibit 10.35(a) to the Aames Financial Corporation Form 10-K for the year ended June 30, 2003). |
10.12(b) |
| Amendment No. 3 to Revolving Credit and Security Agreement dated as of November 4, 2004 among Aames Capital Corporation, Aames Funding Corporation and Countrywide Warehouse Lending (incorporated by reference to Exhibit 10.12(b) to the 2004 10-K). |
10.12(c) |
| Commitment Letter for the Revolving Credit and Security Agreement dated March 25, 2005 among Aames Capital Corporation, Aames Funding Corporation, Aames Investment Corporation, Aames Financial Corporation and Countrywide Warehouse Lending (incorporated by reference to Exhibit 10.12(c) to the June 2005 10-Q). |
10.12(d) |
| Amendment No. 4 to Revolving Credit and Security Agreement dated as of March 25, 2005 among Aames Capital Corporation, Aames Funding Corporation and Countrywide Warehouse Lending (incorporated by reference to Exhibit 10.12(e) to the Aames Investment Corporation Quarterly Report on Form 10-Q for the quarter ended March 31, 2005). |
10.12(e) |
| Amendment No. 2 to the Countrywide Commitment Letter dated as of November 4, 2005 (incorporated by reference to Exhibit 10.12(f) to the September 2005 10-Q). |
114
10.12(f) |
| Amendment No. 3 to the Countrywide Commitment Letter dated March 9, 2006. |
10.13 |
| Office Lease dated as of September 15, 1998, between Colonnade Wilshire Corp. and Aames Financial Corporation for the premises located at 3731 Wilshire Boulevard, Los Angeles, California (incorporated by reference to Exhibit 10.12 to the Aames Financial Corporation Form 10-K for the year ended June 30, 1999). |
10.14(a) |
| Office Building Lease dated as of August 7, 1996 between Aames Financial Corporation and California Plaza IIA, LLC for the premises located at 350 S. Grand Avenue, Los Angeles, California (incorporated by reference to Exhibit 10.17(a) to the Aames Financial Corporation Form 10-K for the year ended June 30, 1997 (the “Aames Financial 1997 10-K”)). |
10.14(b) |
| First Amendment to Office Building Lease dated as of August 15, 1997 between Aames Financial Corporation and California Plaza IIA, LLC (incorporated by reference to Exhibit 10.17(b) to the Aames Financial 1997 10-K). |
10.14(c) |
| Second Amendment to Office Building Lease dated as of July 29, 2005 by and between EOP-TWO California Plaza, LLC and Aames Financial Corporation (incorporated by reference to Exhibit 10.14(c) to the June 2005 10-Q). |
10.15 |
| Office Building Lease dated as of September 13, 2002 between Aames Financial Corporation and Jamboree LLC for the premises located at 3347 and 3351 Michelson Drive, Irvine, California (incorporated by reference to Exhibit 10.18 to the Aames Financial Corporation Form 10-K for the fiscal year ended June 30, 2002). |
10.16 |
| Director Compensation Plan Summary (incorporated by reference to Exhibit 99.1 to the Aames Investment Corporation Current Report on Form 8-K/A dated March 23, 2005 filed with the SEC on March 31, 2005).* |
10.17 |
| 2005 Executive Management Incentive Compensation Plan Summary (incorporated by reference to the Exhibit 10.17 to the 2004 10-K).* |
10.18 |
| Aames Financial Corporation Executive Severance Plan, amended and released dated as of August 4, 2005. * (incorporated by reference to Exhibit 10.18 to the September 2005 10-Q). |
10.19 |
| Amendment No. 1 dated July 1, 2005 to the Employment Agreement among Aames Investment Corporation, Aames Financial Corporation and A. Jay Meyerson.* |
21.1 |
| Subsidiaries of Aames Investment Corporation. |
23.1 |
| Consent of Independent Registered Public Accounting Firm. |
31.1 |
| Certification of A. Jay Meyerson pursuant to Section 302 of the Sarbanes-Oxley Act of 2002. |
31.2 |
| Certification of Jon D. Van Deuren pursuant to Section 302 of the Sarbanes-Oxley Act of 2002. |
32.1 |
| Certification pursuant to Section 906 of the Sarbanes-Oxley Act of 2002. |
* Indicates a management contract or compensatory arrangement.
115
REPORT OF INDEPENDENT REGISTERED PUBLIC ACCOUNTING FIRM
The Board of Directors and Stockholders
Aames Investment Corporation
We have audited the accompanying consolidated balance sheets of Aames Investment Corporation and subsidiaries (the Company) as of December 31, 2005 and 2004, and the related consolidated statements of operations, stockholders’ equity and cash flows for the year ended December 31, 2005, the six-month period ended December 31, 2004, and for each of the two years in the period ended June 30, 2004. These financial statements are the responsibility of the Company’s management. Our responsibility is to express an opinion on these financial statements based on our audits.
We conducted our audits in accordance with the standards of the Public Company Accounting Oversight Board (United States). Those standards require that we plan and perform the audit to obtain reasonable assurance about whether the financial statements are free of material misstatement. An audit includes examining, on a test basis, evidence supporting the amounts and disclosures in the financial statements. An audit also includes assessing the accounting principles used and significant estimates made by management, as well as evaluating the overall financial statement presentation. We believe that our audits provide a reasonable basis for our opinion.
In our opinion, the consolidated financial statements referred to above present fairly, in all material respects, the consolidated financial position of Aames Investment Corporation and subsidiaries at December 31, 2005 and 2004, and the consolidated results of their operations and their cash flows for the year ended December 31, 2005, the six-month period ended December 31, 2004, and for each of the two years in the period ended June 30, 2004, in conformity with U.S. generally accepted accounting principles.
We also have audited, in accordance with the standards of the Public Company Accounting Oversight Board (United States), the effectiveness of Aames Investment Corporation’s internal control over financial reporting as of December 31, 2005, based on criteria established in Internal Control—Integrated Framework issued by the Committee of Sponsoring Organizations of the Treadway Commission and our report dated March 14, 2006, expressed an unqualified opinion thereon.
| /s/ ERNST & YOUNG LLP |
Los Angeles, California
March 14, 2006
F-1
AAMES INVESTMENT CORPORATION AND SUBSIDIARIES
(in thousands, except share data)
|
| December 31, |
| ||||
|
| 2005 |
| 2004 |
| ||
ASSETS |
|
|
|
|
| ||
Cash and cash equivalents: |
|
|
|
|
| ||
Unrestricted |
| $ | 36,078 |
| $ | 31,641 |
|
Restricted |
| 87,094 |
| 6,139 |
| ||
Loans held for sale, at lower of cost or market |
| 951,177 |
| 484,963 |
| ||
Loans held for investment, net |
| 4,085,536 |
| 1,725,046 |
| ||
Advances and other receivables, net |
| 39,591 |
| 22,740 |
| ||
Residual interests, at estimated fair value |
| — |
| 39,082 |
| ||
Deferred income taxes |
| 28,489 |
| 28,401 |
| ||
Equipment and improvements, net |
| 10,810 |
| 8,840 |
| ||
Prepaid expenses and other |
| 30,713 |
| 22,076 |
| ||
Derivative financial instruments, at estimated fair value |
| 58,147 |
| 31,947 |
| ||
Total assets |
| $ | 5,327,635 |
| $ | 2,400,875 |
|
LIABILITIES |
|
|
|
|
| ||
Financings on loans held for investment |
| $ | 3,623,188 |
| $ | 1,157,470 |
|
Revolving warehouse and repurchase facilities |
| 1,341,683 |
| 809,213 |
| ||
Borrowings |
| 16,487 |
| 7,680 |
| ||
Accounts payable and accrued expenses |
| 54,300 |
| 63,242 |
| ||
Accrued dividends |
| 21,584 |
| 3,780 |
| ||
Income taxes payable |
| 889 |
| 1,864 |
| ||
Total liabilities |
| 5,058,131 |
| 2,043,249 |
| ||
Commitments and contingencies (Note 17) |
|
|
|
|
| ||
STOCKHOLDERS’ EQUITY |
|
|
|
|
| ||
Preferred stock, par value $0.01 per share; 160,000,000 shares authorized; none outstanding |
| — |
| — |
| ||
Common stock, par value $0.01 per share; 500,000,000 shares authorized; 61,828,340 shares and 61,360,271 shares issued and outstanding at December 31, 2005 and 2004, respectively |
| 618 |
| 614 |
| ||
Additional paid-in capital |
| 656,041 |
| 655,437 |
| ||
Retained deficit |
| (387,155 | ) | (298,425 | ) | ||
Total stockholders’ equity |
| 269,504 |
| 357,626 |
| ||
Total liabilities and stockholders’ equity |
| $ | 5,327,635 |
| $ | 2,400,875 |
|
See accompanying notes to consolidated financial statements.
F-2
AAMES INVESTMENT CORPORATION AND SUBSIDIARIES
CONSOLIDATED STATEMENTS OF OPERATIONS
(in thousands, except per share data)
| Years Ended |
| Six Months |
| Years Ended |
| ||||||||||||||
|
| 2005 |
| 2004 |
| 2004 |
| 2004 |
| 2003 |
| |||||||||
|
|
|
| (unaudited) |
|
|
|
|
|
|
| |||||||||
Interest income |
| $ | 340,515 |
|
| $ | 93,181 |
|
|
| $ | 56,103 |
|
| $ | 69,446 |
| $ | 69,186 |
|
Interest expense |
| 170,942 |
|
| 32,396 |
|
|
| 18,490 |
|
| 26,227 |
| 35,119 |
| |||||
Net interest income |
| 169,573 |
|
| 60,785 |
|
|
| 37,613 |
|
| 43,219 |
| 34,067 |
| |||||
Provision for losses on loans held for investment |
| 40,294 |
|
| 1,900 |
|
|
| 1,900 |
|
| — |
| — |
| |||||
Net interest income after provision for loan losses |
| 129,279 |
|
| 58,885 |
|
|
| 35,713 |
|
| 43,219 |
| 34,067 |
| |||||
Noninterest income: |
|
|
|
|
|
|
|
|
|
|
|
|
|
|
| |||||
Gain on sale of loans |
| 30,277 |
|
| 177,607 |
|
|
| 59,960 |
|
| 261,801 |
| 174,710 |
| |||||
Loan servicing |
| 6,330 |
|
| 6,634 |
|
|
| 3,070 |
|
| 7,829 |
| 8,896 |
| |||||
Total noninterest income |
| 36,607 |
|
| 184,241 |
|
|
| 63,030 |
|
| 269,630 |
| 183,606 |
| |||||
Net interest income after provision for loan losses and noninterest income |
| 165,886 |
|
| 243,126 |
|
|
| 98,743 |
|
| 312,849 |
| 217,673 |
| |||||
Noninterest expense: |
|
|
|
|
|
|
|
|
|
|
|
|
|
|
| |||||
Personnel |
| 91,217 |
|
| 120,608 |
|
|
| 62,660 |
|
| 160,169 |
| 117,547 |
| |||||
Production |
| 35,351 |
|
| 36,504 |
|
|
| 17,165 |
|
| 35,113 |
| 25,849 |
| |||||
General and administrative |
| 44,707 |
|
| 49,162 |
|
|
| 27,238 |
|
| 44,527 |
| 43,738 |
| |||||
Write-down of residual interests |
| — |
|
| — |
|
|
| — |
|
| — |
| 34,923 |
| |||||
Total noninterest expense |
| 171,275 |
|
| 206,274 |
|
|
| 107,063 |
|
| 239,809 |
| 222,057 |
| |||||
Nonoperating income: |
|
|
|
|
|
|
|
|
|
|
|
|
|
|
| |||||
Debt extinguishment income — |
|
|
|
|
|
|
|
|
|
|
|
|
|
|
| |||||
Capital Z |
| — |
|
| — |
|
|
| — |
|
| — |
| 24,970 |
| |||||
Debt extinguishment income — |
|
|
|
|
|
|
|
|
|
|
|
|
|
|
| |||||
others |
| — |
|
| — |
|
|
| — |
|
| — |
| 6,741 |
| |||||
Total nonoperating income |
| — |
|
| — |
|
|
| — |
|
| — |
| 31,711 |
| |||||
Income (loss) before income taxes |
| (5,389 | ) |
| 36,852 |
|
|
| (8,320 | ) |
| 73,040 |
| 27,327 |
| |||||
Income tax provision (benefit) |
| 842 |
|
| (4,933 | ) |
|
| (5,235 | ) |
| (17,674 | ) | (1,839 | ) | |||||
Net income (loss) |
| $ | (6,231 | ) |
| $ | 41,785 |
|
|
| $ | (3,085 | ) |
| $ | 90,714 |
| $ | 29,166 |
|
Net income (loss) to common stockholders: |
|
|
|
|
|
|
|
|
|
|
|
|
|
|
| |||||
Basic |
| $ | (6,231 | ) |
| $ | 32,085 |
|
|
| $ | (3,085 | ) |
| $ | 77,660 |
| $ | 15,697 |
|
Diluted |
| $ | (6,231 | ) |
| $ | 41,785 |
|
|
| $ | (3,085 | ) |
| $ | 92,804 |
| $ | 29,166 |
|
Net income (loss) per common share: |
|
|
|
|
|
|
|
|
|
|
|
|
|
|
| |||||
Basic |
| $ | (0.10 | ) |
| $ | 0.52 |
|
| �� | $ | (0.05 | ) |
| $ | 11.02 |
| $ | 2.39 |
|
Diluted |
| $ | (0.10 | ) |
| $ | 0.68 |
|
|
| $ | (0.05 | ) |
| $ | 0.89 |
| $ | 0.30 |
|
Dividends per common share — declared |
| $ | 1.30 |
|
| $ | 0.06 |
|
|
| $ | 0.06 |
|
| $ | — |
| $ | — |
|
Weighted average number of common shares outstanding: |
|
|
|
|
|
|
|
|
|
|
|
|
|
|
| |||||
Basic |
| 62,517 |
|
| 61,316 |
|
|
| 61,322 |
|
| 7,049 |
| 6,558 |
| |||||
Diluted |
| 62,517 |
|
| 61,348 |
|
|
| 61,322 |
|
| 104,364 |
| 96,053 |
| |||||
See accompanying notes to consolidated financial statements.
F-3
AAMES INVESTMENT CORPORATION AND SUBSIDIARIES
CONSOLIDATED STATEMENTS OF CHANGES IN STOCKHOLDERS’ EQUITY
|
|
|
|
|
|
|
|
| Additional |
|
|
|
|
| ||||||||||||||||||
|
| Convertible Preferred Stock |
| Common |
| Paid-in |
| Retained |
|
|
| |||||||||||||||||||||
|
| Series B |
| Series C |
| Series D |
| Stock |
| Capital |
| Deficit |
| Total |
| |||||||||||||||||
Balance, June 30, 2002 |
|
| $ | 27 |
|
|
| $ | 20 |
|
|
| $ | 60 |
|
|
| $ | 6 |
|
|
| $ | 418,027 |
|
| $ | (380,955 | ) | $ | 37,185 |
|
Net income |
|
| — |
|
|
| — |
|
|
| — |
|
|
| — |
|
|
| — |
|
| 29,166 |
| 29,166 |
| |||||||
Stock options exercised |
|
| — |
|
|
| — |
|
|
| — |
|
|
| 1 |
|
|
| 91 |
|
| — |
| 92 |
| |||||||
Dividends accrued on preferred stock |
|
| — |
|
|
| — |
|
|
| — |
|
|
| — |
|
|
| — |
|
| (13,469 | ) | (13,469 | ) | |||||||
Balance, June 30, 2003 |
|
| 27 |
|
|
| 20 |
|
|
| 60 |
|
|
| 7 |
|
|
| 418,118 |
|
| (365,258 | ) | 52,974 |
| |||||||
Net income |
|
| — |
|
|
| — |
|
|
| — |
|
|
| — |
|
|
| — |
|
| 90,714 |
| 90,714 |
| |||||||
Stock options exercised |
|
| — |
|
|
| — |
|
|
| — |
|
|
| — |
|
|
| 123 |
|
| — |
| 123 |
| |||||||
Cancellation of stock |
|
| — |
|
|
| — |
|
|
| — |
|
|
| — |
|
|
| (146 | ) |
| — |
| (146 | ) | |||||||
Dividends accrued on preferred stock |
|
| — |
|
|
| — |
|
|
| — |
|
|
| — |
|
|
| — |
|
| (13,054 | ) | (13,054 | ) | |||||||
Balance, June 30, 2004 |
|
| 27 |
|
|
| 20 |
|
|
| 60 |
|
|
| 7 |
|
|
| 418,095 |
|
| (287,598 | ) | 130,611 |
| |||||||
Net loss |
|
| — |
|
|
| — |
|
|
| — |
|
|
| — |
|
|
| — |
|
| (3,085 | ) | (3,085 | ) | |||||||
Redemption of stock in connection with recapitalization |
|
| (27 | ) |
|
| (20 | ) |
|
| (60 | ) |
|
| (7 | ) |
|
| — |
|
| — |
| (114 | ) | |||||||
Issuance of common stock in initial public offering and concurrent private placement, net |
|
| — |
|
|
| — |
|
|
| — |
|
|
| 614 |
|
|
| 226,033 |
|
| — |
| 226,647 |
| |||||||
Stock-based compensation related to restricted stock units |
|
| — |
|
|
| — |
|
|
| — |
|
|
| — |
|
|
| 10,902 |
|
| — |
| 10,902 |
| |||||||
Stock options exercised |
|
| — |
|
|
| — |
|
|
| — |
|
|
| — |
|
|
| 407 |
|
| — |
| 407 |
| |||||||
Dividends accrued on preferred stock |
|
| — |
|
|
| — |
|
|
| — |
|
|
| — |
|
|
| — |
|
| (3,962 | ) | (3,962 | ) | |||||||
Dividends declared on common stock |
|
| — |
|
|
| — |
|
|
| — |
|
|
| — |
|
|
| — |
|
| (3,780 | ) | (3,780 | ) | |||||||
Balance, December 31, 2004 |
|
| — |
|
|
| — |
|
|
| — |
|
|
| 614 |
|
|
| 655,437 |
|
| (298,425 | ) | 357,626 |
| |||||||
Net loss |
|
| — |
|
|
| — |
|
|
| — |
|
|
| — |
|
|
| — |
|
| (6,231 | ) | (6,231 | ) | |||||||
Conversions and cancellations of restricted stock units and awards |
|
| — |
|
|
| — |
|
|
| — |
|
|
| 4 |
|
|
| (1,632 | ) |
| — |
| (1,628 | ) | |||||||
Stock-based compensation related to restricted stock awards |
|
| — |
|
|
| — |
|
|
| — |
|
|
| — |
|
|
| 2,264 |
|
| — |
| 2,264 |
| |||||||
Equity issuance expenses |
|
| — |
|
|
| — |
|
|
| — |
|
|
| — |
|
|
| (28 | ) |
| — |
| (28 | ) | |||||||
Dividends on common stock |
|
| — |
|
|
| — |
|
|
| — |
|
|
| — |
|
|
| — |
|
| (82,499 | ) | (82,499 | ) | |||||||
Balance, December 31, 2005 |
|
| $ | — |
|
|
| $ | — |
|
|
| $ | — |
|
|
| $ | 618 |
|
|
| $ | 656,041 |
|
| $ | (387,155 | ) | $ | 269,504 |
|
See accompanying notes to consolidated financial statements.
F-4
AAMES INVESTMENT CORRATION AND SUBSIDIARIES
CONSOLIDATED STATEMENTS OF CASH FLOWS
|
|
|
| Six Months |
|
|
| |||||||||
|
| Years Ended |
| Ended |
| Years Ended |
| |||||||||
|
| December 31, |
| December 31, |
| June 30, |
| |||||||||
| 2005 |
| 2004 |
| 2004 |
| 2004 |
| 2003 |
| ||||||
|
|
|
| (unaudited) |
|
|
|
|
|
|
| |||||
Cash Flows from Operating Activities: |
|
|
|
|
|
|
|
|
|
|
| |||||
Net income (loss) |
| $ | (6,231 | ) | $ | 41,785 |
| $ | (3,085 | ) | $ | 90,714 |
| $ | 29,166 |
|
Adjustments to reconcile net income (loss) to net cash provided by (used in) operating activities: |
|
|
|
|
|
|
|
|
|
|
| |||||
Provision for losses on loans held for investment |
| 40,294 |
| 1,900 |
| 1,900 |
| — |
| — |
| |||||
Depreciation and amortization |
| 3,370 |
| 3,981 |
| 1,880 |
| 4,125 |
| 4,132 |
| |||||
Stock-based compensation |
| 2,264 |
| 10,902 |
| 10,902 |
| — |
| — |
| |||||
Mark-to-market (gain) loss on derivatives |
| 143 |
| (6,344 | ) | (6,344 | ) | — |
| — |
| |||||
Deferred income taxes |
| (88 | ) | (12,195 | ) | (6,516 | ) | (21,885 | ) | — |
| |||||
Mortgage servicing rights amortization |
| — |
| — |
| — |
| 220 |
| 2,700 |
| |||||
Residual interests discount accretion |
| — |
| (972 | ) | — |
| (4,357 | ) | (16,558 | ) | |||||
Write-down of residual interests |
| — |
| — |
| — |
| — |
| 34,923 |
| |||||
Debt extinguishment income |
| — |
| — |
| — |
| — |
| (31,711 | ) | |||||
Loans held for sale: |
|
|
|
|
|
|
|
|
|
|
| |||||
Originations and purchases |
| (6,754,528 | ) | (7,419,645 | ) | (3,587,548 | ) | (6,988,994 | ) | (4,446,180 | ) | |||||
Proceeds from sales |
| 6,288,314 |
| 7,625,550 |
| 4,114,750 |
| 6,383,706 |
| 4,501,371 |
| |||||
Net (increase) decrease in loans held for sale |
| (466,214 | ) | 205,905 |
| 527,202 |
| (605,288 | ) | 55,191 |
| |||||
(Increase) decrease in: |
|
|
|
|
|
|
|
|
|
|
| |||||
Advances and other receivables, net |
| (16,851 | ) | (1,557 | ) | (5,289 | ) | 17,398 |
| 19,961 |
| |||||
Residual interests |
| 39,082 |
| 13,869 |
| 5,038 |
| 89,469 |
| 49,700 |
| |||||
Prepaid expenses and other |
| (8,637 | ) | (6,802 | ) | (4,416 | ) | (204 | ) | (2,746 | ) | |||||
Derivative financial instruments |
| (26,343 | ) | (25,603 | ) | (19,287 | ) | — |
| — |
| |||||
Increase (decrease) in: |
|
|
|
|
|
|
|
|
|
|
| |||||
Accounts payable and accrued expenses |
| (10,570 | ) | 28,689 |
| 9,204 |
| 15,618 |
| 2,415 |
| |||||
Income taxes payable |
| (975 | ) | 1,864 |
| 57 |
| (1,268 | ) | (5,481 | ) | |||||
Net cash provided by (used in) operating activities |
| (450,756 | ) | 255,422 |
| 511,246 |
| (415,458 | ) | 141,692 |
| |||||
Cash Flows from Investing Activities: |
|
|
|
|
|
|
|
|
|
|
| |||||
Increase in loans held for investment, net |
| (2,400,784 | ) | (1,726,946 | ) | (1,726,946 | ) | — |
| — |
| |||||
Purchase of equipment and improvements |
| (5,340 | ) | (3,758 | ) | (2,012 | ) | (3,905 | ) | (2,124 | ) | |||||
Net cash used in investing activities |
| (2,406,124 | ) | (1,730,704 | ) | (1,728,958 | ) | (3,905 | ) | (2,124 | ) | |||||
F-5
AAMES INVESTMENT CORPORATION AND SUBSIDIARIES
CONSOLIDATED STATEMENTS OF CASH FLOWS—(Continued)
(in thousands)
|
|
|
|
|
| Six Months |
|
|
|
|
| |||||||
|
| Years Ended |
| Ended |
| Years Ended |
| |||||||||||
|
| December 31, |
| December 31, |
| June 30, |
| |||||||||||
|
| 2005 |
| 2004 |
| 2004 |
| 2004 |
| 2003 |
| |||||||
|
|
|
| (unaudited) |
|
|
|
|
|
|
| |||||||
Cash Flows from Financing Activities: |
|
|
|
|
|
|
|
|
|
|
|
|
| |||||
Financings on loans held for investment |
| 2,465,718 |
| 1,157,470 |
|
| 1,157,470 |
|
| — |
| — |
| |||||
Net increase (decrease) in revolving warehouse and repurchase facilities |
| 532,470 |
| 206,162 |
|
| (77,220 | ) |
| 542,758 |
| (39,444 | ) | |||||
Proceeds from (reduction) in borrowings |
| 8,807 |
| (79,537 | ) |
| (70,603 | ) |
| (60,229 | ) | (93,747 | ) | |||||
Net proceeds from issuance of common stock, net of recapitalization/merger of entities under common control |
| — |
| 226,533 |
|
| 226,533 |
|
| — |
| — |
| |||||
Proceeds from stock options exercised |
| — |
| 523 |
|
| 407 |
|
| 127 |
| 92 |
| |||||
Payment of common stock dividends |
| (64,695 | ) | — |
|
| — |
|
| — |
| — |
| |||||
Payment of preferred stock dividends |
| — |
| (9,700 | ) |
| (3,962 | ) |
| (64,286 | ) | — |
| |||||
Payment of equity issuance expenses |
| (28 | ) | — |
|
| — |
|
| — |
| — |
| |||||
Net cash provided by (used in) financing activities |
| 2,942,272 |
| 1,501,451 |
|
| 1,232,625 |
|
| 418,370 |
| (133,099 | ) | |||||
Net increase (decrease) in cash and cash equivalents |
| 85,392 |
| 26,169 |
|
| 14,913 |
|
| (993 | ) | 6,469 |
| |||||
Cash and cash equivalents, beginning of period |
| 37,780 |
| 11,611 |
|
| 22,867 |
|
| 23,860 |
| 17,391 |
| |||||
Cash and cash equivalents, end of period |
| $ | 123,172 |
| $ | 37,780 |
|
| $ | 37,780 |
|
| $ | 22,867 |
| $ | 23,860 |
|
Supplemental disclosures: |
|
|
|
|
|
|
|
|
|
|
|
|
| |||||
Interest paid |
| $ | 159,765 |
| $ | 25,786 |
|
| $ | 14,841 |
|
| $ | 20,463 |
| $ | 33,491 |
|
Income taxes paid |
| $ | 2,666 |
| $ | 5,706 |
|
| $ | 1,325 |
|
| $ | 6,309 |
| $ | 3,645 |
|
See accompanying notes to consolidated financial statements.
F-6
AAMES INVESTMENT CORPORATION AND SUBSIDIARIES
NOTES TO CONSOLIDATED FINANCIAL STATEMENTS
Note 1. Recent Events (unaudited)
On March 15, 2006, Aames Investment Corporation (“Aames Investment”), which elected to qualify as a mortgage real estate investment trust, or REIT, for U.S. federal income tax purposes for the six months ended December 31, 2004 and for the year ended December 31, 2005, announced that it intends to alter its structure so that it would no longer be required to pay out at least 90% of its taxable earnings to its stockholders as dividends, but rather, would retain its capital for internal growth. On March 24, 2006, Aames Investment’s Board of Directors approved a corporate reorganization to achieve that goal. In the reorganization, the following would occur:
1. Aames Financial Corporation (“Aames Financial’’), Aames Investment’s current taxable REIT subsidiary or TRS, would form a wholly owned REIT subsidiary, to acquire, hold and service mortgage loans.
2. If approved by the stockholders, Aames Investment would merge with the REIT subsidiary, which would result in: (i) Aames Financial becoming the new parent of Aames Investment, (ii) common stockholders of Aames Investment exchanging their shares for common shares of Aames Financial, and (iii) Aames Investment becoming a subsidiary of Aames Financial.
3. Since Aames Investment, the REIT, would be a subsidiary of Aames Financial, it would distribute its taxable income, including income from the REIT portfolio, to Aames Financial, rather than to public stockholders. This would enable Aames Financial to retain the earnings on the REIT portfolio for internal capital growth. In addition, by reorganizing Aames Investment as a subsidiary of Aames Financial, Aames Investment’s taxable earnings, including the earnings from the REIT portfolio, would be subject to shelter from taxation through utilization of Aames Financial’s historical net operating loss carryforwards (“NOLs”) until fully utilized. The taxable income generated by Aames Financial is subject to regular corporate income tax. However, as of December 31, 2005, Aames Financial had approximately $304.1 million of NOLs for U.S. federal income tax purposes that expire from 2017 through 2025. We believe that Aames Financial will be able to use these NOLs to offset its future income, subject to annual limitations and, as a result, Aames Financial will have substantially lower effective tax rates than statutory rates.
On March 27, 2006, the Company announced that it is in the process of closing two of its five wholesale operations centers, in Deerfield, Florida and Parsippany, New Jersey, and consolidating the functions previously performed in those centers into its centers located in Irvine, California, Jacksonville, Florida and Dallas, Texas. The Company has also eliminated 100 positions in the wholesale channel. The Company expects to record a charge to income of from $2.0 million to $3.0 million during the three months ended March 31, 2006 in connection with these steps. The combined annual savings from these actions are currently estimated at $10.0 million.
Note 2. Summary of Significant Accounting Policies
General
Aames Investment is a mortgage real estate investment trust, or REIT, which manages a portfolio of subprime residential mortgage loans. Its principal subsidiary, Aames Financial, is a national mortgage banking company that commenced operations in 1954 and focuses primarily on originating, selling and servicing residential mortgage loans through both wholesale and retail channels under the name “Aames
F-7
AAMES INVESTMENT CORPORATION AND SUBSIDIARIES
NOTES TO CONSOLIDATED FINANCIAL STATEMENTS (Continued)
Home Loan.” Aames Investment, together with its subsidiaries, is collectively referred to as the “Company.”
Aames Investment, a Maryland corporation, was incorporated on February 24, 2004. On November 5, 2004, Aames Investment completed a $297.5 million initial public offering of 35.0 million common shares and a $39.5 million concurrent private placement of 5.0 million shares of common stock. Subsequently, on November 24, 2004, Aames Investment sold an additional 5.3 million shares of common stock in an over-allotment transaction. All of the common shares sold were priced at $8.50 per share, less certain discounts.
On November 9, 2004, Aames Investment completed its reorganization with Aames Financial Corporation, formerly Aames Investment’s parent company. The reorganization transaction was accounted for as a recapitalization-restructuring of entities under common control with no change in accounting basis. The common shares of Aames Financial and the Series B, C and D Convertible Preferred Stock were exchanged in connection with the reorganization.
At December 31, 2005, Specialty Finance Partners (“SFP”), a partnership controlled by Capital Z Financial Services Fund, II, L.P., a Bermuda partnership (together with SFP, “Capital Z”) and others affiliated with Capital Z together owned approximately 14.0 million shares, or approximately 23% of the Company’s common shares outstanding. Representatives of Capital Z currently have two seats on the Company’s seven member Board of Directors.
Aames Investment elected to qualify as a REIT for U.S. federal income tax purposes. Aames Financial Corporation is the taxable REIT subsidiary (“TRS”) of Aames Investment.
Aames Investment’s strategy is to use its equity capital and funds borrowed under revolving warehouse and repurchase facilities to finance mortgage loan originations, and to use those financing sources together with on-balance sheet securitizations to finance its REIT portfolio of mortgage loans. Aames Investment will retain in its REIT portfolio a portion of these loans, largely hybrid/adjustable rate mortgage loans. Aames Investment will sell the remainder, including a majority of the fixed-rate mortgage loans originated, on a whole loan servicing-released basis to third parties.
The Company’s principal market is borrowers whose financing needs are not being met by traditional mortgage lenders for a variety of reasons, including the need for specialized loan products or credit histories that may limit such borrowers’ access to credit. Mortgage loans originated are extended on the basis of equity in the borrower’s property and the creditworthiness of the borrower.
Principles of Accounting and Consolidation
The consolidated financial statements of the Company include the accounts of Aames Investment and its wholly-owned subsidiaries. All significant intercompany balances and transactions have been eliminated in consolidation.
The preparation of financial statements in conformity with U.S. generally accepted accounting principles requires management to make estimates and assumptions that affect the reported amounts of assets and liabilities and disclosure of contingent assets and liabilities at the date of the financial statements and the reported amounts of income and expense during the reporting period. Actual results could differ from those estimates.
F-8
AAMES INVESTMENT CORPORATION AND SUBSIDIARIES
NOTES TO CONSOLIDATED FINANCIAL STATEMENTS (Continued)
Cash and Cash Equivalents
The Company considers all highly liquid debt instruments with an original maturity of no more than three months to be cash equivalents.
Loans Held for Sale
Loans held for sale are mortgage loans the Company plans to securitize or sell as whole loans and are carried at the lower of aggregate cost or estimated market value. Market value is determined by current investor yield requirements. Aggregate cost includes the unpaid principal balance, net of deferred loan origination fees and costs. Loan origination fees, as well as discount points and direct origination costs, are initially deferred and recorded as an adjustment to the cost of the loan and are reflected in earnings when the loan is sold. The Company maintains a lower of cost or market valuation allowance for loans held for sale that are severely delinquent, have suffered declines in market value, had credit deterioration, have significant collateral deficiencies, or have other attributes that reduce their sale potential.
Loans Held for Investment and Allowance for Loan Losses
Loans held for investment represent either mortgage loans securitized through transactions structured as financings or mortgage loans designated as held for investment for future on-balance sheet securitization. Loans held for investment are carried at amortized cost less the allowance for loan losses. Amortized cost includes the unpaid principal balance, net of deferred loan origination fees and costs, which are amortized to interest income using the interest method over the estimated economic life of the loans. The financing related to the securitizations of loans held for investment is included in the Company’s consolidated balance sheet as financings on loans held for investment.
The allowance for loan losses is maintained at a level deemed adequate by management to provide for probable and inherent losses in the portfolio. The allowance is based upon a quarterly review of past loan loss experience, loan portfolio composition and risk, current economic conditions that may affect the borrower’s ability to pay, delinquencies and the underlying collateral value. While management uses available information to estimate losses on loans held for investment, future additions to the allowance may be necessary based on changes in estimates resulting from economic and other conditions. Loans that are deemed to be uncollectible are charged off and deducted from the allowance. The provision for loan losses and recoveries on loans previously charged off are added to the allowance.
Interest income is accrued as earned. Loans are placed on non-accrual status when any portion of principal or interest is past due 59 days, or earlier when concern exists as to the ultimate collectibility of principal or interest. When a loan is placed on non-accrual status, the accrued and unpaid interest is reversed as a reduction of interest income and accrued interest receivable. Interest income is subsequently recognized on a cash basis if and when remitted by the borrower. Loans return to accrual status when principal and interest become current.
Real Estate Owned
Real estate owned (“REO”) is comprised of properties acquired through or in lieu of foreclosure in satisfaction of unpaid mortgage loans. REO is recorded in prepaid expenses and other assets in the consolidated financial statements at the lower of cost or estimated net realizable value, after estimated disposition costs. Estimated realizable values are based on an evaluation of various factors, including appraisals, sales of comparable assets and estimated market conditions. Properties that become REO are
F-9
AAMES INVESTMENT CORPORATION AND SUBSIDIARIES
NOTES TO CONSOLIDATED FINANCIAL STATEMENTS (Continued)
marked to market, if necessary, upon transfer, with any loss being reflected as a charge-off to the allowance for loan losses. Gains and losses on the subsequent sales of REO, periodic revaluation of REO, and the net costs of maintaining REO are included in noninterest expense on the consolidated statements of operations.
Advances and Other Receivables
Advances and other receivables consist primarily of principal and interest advances to bondholders of financings on loans held for investment, and, to a lesser extent, include servicing advances, servicing and miscellaneous fees receivable, accrued interest, and other miscellaneous receivables. Prior to June 30, 2005, advances and other receivables also included cash distributions receivable from the off-balance sheet securitization trusts.
In its capacity as servicer of loans in the securitization trusts, the Company is required to advance the principal and interest due to the bondholders of the securitization trusts when delinquent borrowers fail to make timely payments on their mortgage loans. The Company is also required to fund foreclosure-related expenses, delinquent real estate taxes and property insurance on mortgage loans. In its capacity as servicer of the loans in the securitization trusts, the Company is not required to make advances which would not be expected to be recoverable. The Company records principal and interest advances and servicing advances as accounts receivable on its consolidated balance sheets at the time the cash advance is made and until recovered. The Company, as servicer, is entitled to recover these advances from regular monthly cash flows from the mortgage loans including monthly payments, loan pay-offs, and liquidation proceeds from the sale of real estate collateral underlying the mortgage loan if the properties are foreclosed upon and sold. The Company periodically evaluates the realizability of its advance receivables, and charges income for amounts deemed uncollectible. As a means of improving its liquidity, the Company has, from time to time, entered into agreements with unaffiliated third parties pursuant to which the third parties have made certain, but not all, of the servicing advances. Additionally, as a means of recovering outstanding advances prior to the time borrowers remit their payments or the mortgaged property is foreclosed upon and sold, from time to time, the Company may sell its advances.
Equipment and Improvements, Net
Equipment and improvements, net, are stated at cost less accumulated depreciation and amortization. Depreciation on furniture, fixtures and equipment is computed on the straight-line method over the estimated useful lives of the related assets, which range from three to seven years. Leasehold improvements are amortized on a straight-line basis over the lesser of the term of the lease or the estimated lives of the improvements.
Revenue Recognition
The Company depends on its ability to sell mortgage loans in the secondary markets, as market conditions allow, to generate cash proceeds to pay down its revolving warehouse and repurchase facilities and fund loan originations and purchases. The ability of the Company to sell loans in the secondary market on acceptable terms is essential for the continuation of the Company’s loan origination and purchase operations.
The Company records a sale of mortgage loans and the resulting gain on sale of loans when it surrenders control over the loans to a buyer (the “transferee”). Control is surrendered when (i) the loans
F-10
AAMES INVESTMENT CORPORATION AND SUBSIDIARIES
NOTES TO CONSOLIDATED FINANCIAL STATEMENTS (Continued)
are isolated from the Company, put presumptively beyond the reach of the Company and its creditors, even in a bankruptcy or other receivership, (ii) either the transferee has the unconstrained right to pledge or exchange the loans or the transferee is a qualifying special purpose entity and the beneficial interest holders in the qualifying special purpose entity have the unconstrained right to pledge or exchange the beneficial interests, and (iii) the Company does not maintain effective control over the loans through an agreement that entitles and obligates the Company to repurchase or redeem the loans before their maturity or through an agreement that unilaterally entitles the Company to repurchase or redeem the loans.
The Company sells its mortgage loans in whole loan sale transactions on a cash basis. In whole loan sale transactions, the buyer acquires all future rights (including mortgage servicing rights) to the loans, without recourse to the Company, except for standard representations and warranties. Gains and losses on whole loan sales are recognized when the Company surrenders control over the loans, generally on the settlement date, based upon the difference between the proceeds received and the net carrying amount of the loans. The Company charges gain on sale for estimated representation and warranty provisions related to probable losses on representation and warranty claims by investors.
At December 31, 2005, the Company had no retained residual interests. During the year ended December 31, 2005, the Company called the seven remaining securitization trusts in which it retained residual interests. No adjustments to the carrying values of the retained residual interests were deemed necessary as a result of calling these residual trusts.
When the Company consummated an off-balance sheet securitization structured as a sale, it conveyed loans to a separate entity (such as a trust) in exchange for cash proceeds and a residual interest in the trust. The cash proceeds were raised through an offering of pass-through certificates or bonds evidencing the right to receive principal payments and interest on the certificate balance or bonds. The non-cash gain on sale of loans represented the difference between the proceeds (including premiums) from the sale, net of related transaction costs, and the allocated carrying amount of the loans sold. The allocated carrying amount was determined by allocating the original cost basis amount of loans (including premiums paid on loans originated) between the portion sold and any retained interests (residual interests), based on their relative fair values at the date of transfer. The residual interests represented, over the estimated life of the loans, the present value of the estimated future cash flows based upon the expected timing that the estimated future cash flows would be released from the securitization trusts to the Company, i.e., the “cash out” method for residual interest valuation. These cash flows were determined by the excess of the weighted average coupon on each pool of loans sold over the sum of the interest rate paid to investors, the contractual servicing fee, a monoline insurance fee, if any, and an estimate for credit losses. Each agreement that the Company entered into in connection with its securitizations required the overcollateralization of the trust. The amount and timing of the cash flows expected to be released from the securitization trusts considered the impact of the applicable delinquency and credit loss limits specified in the securitization agreements.
The Company determined the present value of the cash flows at the time each securitization transaction closed using certain estimates made by management at the time the mortgage loans were sold. These estimates included: (i) a future rate of prepayment; (ii) credit losses; and (iii) a discount rate used to calculate present value. The future cash flows represented management’s best estimate. Management monitored performance of the loans and changes in the estimates were reflected in earnings.
F-11
AAMES INVESTMENT CORPORATION AND SUBSIDIARIES
NOTES TO CONSOLIDATED FINANCIAL STATEMENTS (Continued)
At December 31, 2005 and 2004, the Company did not have any mortgage servicing rights. Prior to June 30, 2000 and in connection with off-balance sheet securitizations, the Company capitalized mortgage servicing rights based on an allocation of the carrying amount of the loans securitized on a servicing retained basis. Mortgage servicing rights were amortized in proportion to and over the period of estimated future servicing income. Subsequent to June 30, 2000, the Company sold or securitized mortgages on a servicing released basis; therefore, the Company did not capitalize mortgage servicing rights.
Stock-Based Compensation
Through June 30, 2004, the Company compensated employees through the issuance of common stock options in accordance with the Aames Financial Corporation Stock Option Plan dated February 10, 1999, as amended (the “1999 Plan”). The 1999 Plan provided for the issuance of options to purchase shares of the Company’s common stock to officers, key executives and consultants of the Company. The 1999 Plan was replaced by the 2004 Aames Investment Corporation Equity Incentive Plan (the “2004 EIP”) on November 5, 2004. Pursuant to the 2004 EIP, both restricted stock units and restricted stock awards were issued. Since November 5, 2004, no stock options are outstanding.
As permitted by Statement of Financial Accounting Standards No. 123, “Accounting for Stock-Based Compensation,” the Company recognized compensation expense using the intrinsic value method specified in Accounting Principles Board Opinion No. 25, “Accounting for Stock Issued to Employees”. Had compensation been recorded in accordance with SFAS 123, the Company’s net income (loss) and net income (loss) per common share data would have reflected the pro forma amounts indicated below (in thousands, except per share data):
|
| Years Ended |
| Six Months |
| Years Ended |
| ||||||||||
|
| 2005 |
| 2004 |
| 2004 |
| 2004 |
| 2003 |
| ||||||
|
|
|
| (unaudited) |
|
|
|
|
|
|
| ||||||
Net income (loss): |
|
|
|
|
|
|
|
|
|
|
|
|
|
|
| ||
As reported |
| N/A |
|
| N/A |
|
|
| N/A |
|
| $ | 90,714 |
| $ | 29,166 |
|
Pro forma(1) |
| N/A |
|
| N/A |
|
|
| N/A |
|
| 88,927 |
| 27,993 |
| ||
Basic income (loss) to common stockholders: |
|
|
|
|
|
|
|
|
|
|
|
|
|
|
| ||
As reported |
| N/A |
|
| N/A |
|
|
| N/A |
|
| $ | 77,660 |
| $ | 15,697 |
|
Pro forma(1) |
| N/A |
|
| N/A |
|
|
| N/A |
|
| 75,873 |
| 14,524 |
| ||
Diluted income (loss) to common stockholders: |
|
|
|
|
|
|
|
|
|
|
|
|
|
|
| ||
As reported |
| N/A |
|
| N/A |
|
|
| N/A |
|
| $ | 92,804 |
| $ | 29,166 |
|
Pro forma(1) |
| N/A |
|
| N/A |
|
|
| N/A |
|
| 91,017 |
| 27,993 |
| ||
Basic income (loss) per common share: |
|
|
|
|
|
|
|
|
|
|
|
|
|
|
| ||
As reported |
| N/A |
|
| N/A |
|
|
| N/A |
|
| $ | 11.02 |
| $ | 2.39 |
|
Pro forma |
| N/A |
|
| N/A |
|
|
| N/A |
|
| 10.76 |
| 2.21 |
| ||
Diluted (loss) per common share: |
|
|
|
|
|
|
|
|
|
|
|
|
|
|
| ||
As reported |
| N/A |
|
| N/A |
|
|
| N/A |
|
| $ | 0.89 |
| $ | 0.30 |
|
Pro forma |
| N/A |
|
| N/A |
|
|
| N/A |
|
| 0.87 |
| 0.29 |
| ||
(1) The pro forma stock-based compensation cost, net of tax effects, was $1.8 million and $1.2 million for the years ended June 30, 2004 and 2003.
F-12
AAMES INVESTMENT CORPORATION AND SUBSIDIARIES
NOTES TO CONSOLIDATED FINANCIAL STATEMENTS (Continued)
The fair value of each option grant was estimated on the date of grant using the Black-Scholes option-pricing model with the following weighted-average assumptions:
|
| Years Ended |
| Six Months |
| Years Ended |
| ||||||||
|
| 2005 |
| 2004 |
| 2004 |
| 2004 |
| 2003 |
| ||||
|
|
|
| (unaudited) |
|
|
|
|
|
|
| ||||
Dividend yield |
| N/A |
|
| N/A |
|
|
| N/A |
|
| 0.00 | % | 0.00 | % |
Expected volatility |
| N/A |
|
| N/A |
|
|
| N/A |
|
| 107.00 | % | 118.00 | % |
Risk-free interest rate |
| N/A |
|
| N/A |
|
|
| N/A |
|
| 3.00 | % | 2.97 | % |
Expected life of option |
| N/A |
|
| N/A |
|
|
| N/A |
|
| 4.5 years |
| 4.5 years |
|
The weighted average fair values of options granted during the years ended June 30, 2004 and 2003 were $2.08 and $0.75, respectively.
Advertising Expense
The Company’s policy is to charge advertising costs to expense when incurred.
Income Taxes
Aames Investment has elected to be treated as a real estate investment trust, or REIT, for U.S. federal tax purposes. As a REIT, Aames Investment is not subject to federal income taxes at the parent company level to the extent that it distributes at least 90% of the REIT’s taxable income to its stockholders and complies with certain other requirements. Other requirements include meeting certain percentage requirements for assets and income that effectively serve to focus the REIT’s investments into mortgage loans secured by real estate, including mortgage-backed securities and other qualifying investments. Holdings of non-real estate and portfolio investments is limited, such that no more than 20% of the value of Aames Investment’s total assets may consist of securities of one or more taxable REIT subsidiaries. Aames Investment intends to distribute 100% of its REIT taxable income; therefore, no income tax provision has been made.
The taxable income of Aames Financial, the taxable REIT subsidiary, is subject to regular corporate income taxes. Taxes are provided on substantially all income and expense items included in earnings, regardless of the period in which such items are recognized for tax purposes. The Company uses an asset and liability approach that requires the recognition of deferred tax assets and liabilities for the expected future tax consequences of events that have been recognized in the Company’s financial statements or tax returns. In estimating future tax consequences, the Company generally considers all expected future events other than the enactment of changes in the tax law or rates.
Earnings (Loss) Per Common Share
Basic earnings (loss) per share excludes dilution and is computed by dividing net income (loss) available to common stockholders by the weighted average number of common shares outstanding for the period. Diluted earnings (loss) per share reflects the potential dilution that could occur if securities or other contracts to issue common stock were exercised or converted into common stock or resulted from issuance of common stock that then shared in earnings, except when their effect is antidilutive.
F-13
AAMES INVESTMENT CORPORATION AND SUBSIDIARIES
NOTES TO CONSOLIDATED FINANCIAL STATEMENTS (Continued)
Risk Management, Derivative Instruments, and Hedging Activities
The Company’s earnings may be directly affected by the level of and fluctuation in interest rates in the on-balance sheet securitization trusts.
The Company uses hedge products to mitigate interest rate exposure to its financings on loans held for investment that are indexed to one-month LIBOR. The Company has utilized hedge products that included interest rate cap agreements, forward interest rate swap agreements, and other hedging products. From time to time, the Company uses hedge products to mitigate interest rate exposure on its inventory and pipeline of mortgage loans held for sale. The use, amount, and term of derivative financial instruments are determined by members of the Company’s senior management.
Derivative financial instruments are recorded at fair value on the Company’s consolidated balance sheets. The Company records the fair value of any derivatives in a separate asset or liability line item, as the case may be, depending on materiality considerations. The Company’s derivative financial instruments are not designated, and do not qualify, as accounting hedges. Therefore, changes in the fair value of the derivative financial instruments are recorded currently in operations as realized or incurred.
Reclassifications
Certain amounts related to December 31, 2004, and June 30, 2004 and 2003 have been reclassified to conform to the December 31, 2005 presentation.
Recently Issued Accounting Standards
In May 2005, the Financial Accounting Standards Board (“FASB”) issued Statement of Financial Accounting Standards No. 154, “Accounting Changes and Error Corrections” (“SFAS 154”), which replaces APB No. 20, “Accounting Changes,” and Statement of Financial Accounting Standards No. 3, “Reporting Changes in Interim Financial Statements.” SFAS 154 changes the accounting for and reporting of a change in accounting principle. SFAS 154 requires retrospective application to prior periods’ financial statements of voluntary changes in accounting principle and changes required by new accounting standards when the standard does not include specific transition provisions, unless it is impracticable to do so. SFAS 154 is effective for accounting changes and corrections of errors in fiscal years beginning after December 15, 2005 and will only affect the Company’s consolidated financial statements upon adoption of a voluntary change in accounting principle by the Company.
In December 2004, the FASB issued Statement of Financial Accounting Standards No. 123R, “Share-Based Payment” (“SFAS 123R”), an amendment of SFAS 123. This Statement requires companies to measure the cost of employee services received in exchange for an award of equity instruments based on the grant date fair value of the award. SFAS 123R requires measurement of fair value of employee stock options using an option pricing model that takes into account the awarded options’ unique characteristics. SFAS 123R requires charging the recognized cost to expense over the period the employee provides services to earn the award, generally its vesting period. In April of 2005, the Securities and Exchange Commission revised the required adoption date of SFAS 123R. As a result of this change, the Company was required to adopt SFAS 123R effective January 1, 2006. The adoption of SFAS 123R did not have a material impact on the Company’s consolidated financial statements.
F-14
AAMES INVESTMENT CORPORATION AND SUBSIDIARIES
NOTES TO CONSOLIDATED FINANCIAL STATEMENTS (Continued)
Note 3. Cash and Cash Equivalents and Cash Held in Trust
At December 31, 2005 and 2004, the Company had corporate cash and cash equivalents available of $123.2 million and $37.8 million, respectively, of which $87.1 million and $6.1 million were restricted, respectively. At December 31, 2005 and 2004, the Company had $70.1 million and $7.0 million of overnight investments, respectively.
The Company services mortgage loans in its portfolio of loans held for investment, services mortgage loans for others on a long-term basis and services mortgage loans on an interim basis, which consist of loans held for sale and loans subserviced for others. In such capacity, certain funds are collected from borrowers and placed in segregated trust accounts which totaled $37.2 million and $29.4 million at December 31, 2005 and 2004, respectively. These accounts and corresponding liabilities are not included in the accompanying consolidated balance sheets.
Note 4. Loans Held for Sale
The following summarizes the composition of the Company’s loans held for sale by interest rate type at the dates indicated (in thousands):
|
| December 31, |
| ||
|
| 2005 |
| 2004 |
|
Fixed rate mortgages |
| $ 397,112 |
| $ 234,563 |
|
Adjustable rate loans |
| 570,716 |
| 253,406 |
|
Total unpaid principal balance |
| 967,828 |
| 487,969 |
|
Net deferred loan origination (fees) costs |
| (4,547 | ) | 1,228 |
|
Valuation allowance |
| (12,104 | ) | (4,234 | ) |
Total loans held for sale, at lower of cost or market |
| $ 951,177 |
| $ 484,963 |
|
The Company maintains a lower of cost or market (“LOCOM”) valuation allowance for loans held for sale that are severely delinquent, have suffered declines in market value, had credit deterioration, have significant collateral deficiencies, or have other attributes that reduce their sale potential.
The following table summarizes the activity in the LOCOM valuation allowance for the periods indicated (in thousands):
|
|
|
|
|
| Six Months |
| ||||
|
|
|
|
|
| Ended |
| ||||
|
| Years Ended December 31, |
| December 31, |
| ||||||
|
| 2005 |
| 2004 |
| 2004 |
| ||||
|
|
|
| (unaudited) |
|
|
| ||||
Balance, beginning of period |
| $ 4,234 |
|
| $ 7,497 |
|
|
| $ 7,029 |
|
|
LOCOM provision |
| 19,897 |
|
| 2,429 |
|
|
| 781 |
|
|
Transfer from advances receivable allowance(1) |
| 600 |
|
| — |
|
|
| — |
|
|
Charge-offs |
| (12,677 | ) |
| (6,460 | ) |
|
| (3,602 | ) |
|
Recoveries |
| 50 |
|
| 768 |
|
|
| 26 |
|
|
Net charge-offs |
| (12,627 | ) |
| (5,692 | ) |
|
| (3,576 | ) |
|
Balance, end of period |
| $ 12,104 |
|
| $ 4,234 |
|
|
| $ 4,234 |
|
|
(1) See Note 6. Advances and Other Receivables, Net
F-15
AAMES INVESTMENT CORPORATION AND SUBSIDIARIES
NOTES TO CONSOLIDATED FINANCIAL STATEMENTS (Continued)
Loans held for sale that were past due 90 days or more were $12.4 million and $6.7 million at December 31, 2005 and 2004, respectively. At December 31, 2005 and 2004, the Company had loans held for sale of approximately $14.0 million and $7.7 million, respectively, on which the accrual of interest had been discontinued. Had these loans been current throughout their terms, interest income would have been higher by approximately $1.6 million and $0.7 million during the years ended December 31, 2005 and 2004, respectively.
At December 31, 2005, $934.9 million of the Company’s loans held for sale were pledged as collateral under the Company’s warehouse and repurchase facilities.
Note 5. Loans Held for Investment, Net
The following table summarizes the components of loans held for investment, net, at the dates indicated (in thousands):
|
| December 31, |
| ||
|
| 2005 |
| 2004 |
|
Securitized |
| $ 3,659,657 |
| $ 1,187,435 |
|
Not yet securitized |
| 461,451 |
| 531,261 |
|
Total unpaid principal balance |
| 4,121,108 |
| 1,718,696 |
|
Net deferred loan origination costs |
| 7,787 |
| 8,250 |
|
Allowance for loan losses |
| (43,359 | ) | (1,900 | ) |
Total loans held for investment, net |
| $ 4,085,536 |
| $ 1,725,046 |
|
The following table summarizes the activity in the allowance for losses for loans held for the periods indicated (in thousands):
|
|
|
|
|
| Six Months |
| ||||
|
|
|
|
|
| Ended |
| ||||
|
| Years Ended December 31, |
| December 31, |
| ||||||
|
| 2005 |
| 2004 |
| 2004 |
| ||||
|
|
|
| (unaudited) |
|
|
| ||||
Balance, beginning of period |
| $ 1,900 |
|
| $ — |
|
|
| $ — |
|
|
Provision for loan losses |
| 40,294 |
|
| 1,900 |
|
|
| 1,900 |
|
|
Transfer from advances receivable allowance(1) |
| 2,582 |
|
| — |
|
|
| — |
|
|
Charge-offs |
| (1,449 | ) |
| — |
|
|
| — |
|
|
Recoveries |
| 32 |
|
| — |
|
|
| — |
|
|
Net charge-offs |
| (1,417 | ) |
| — |
|
|
| — |
|
|
Balance, end of period |
| $ 43,359 |
|
| $ 1,900 |
|
|
| $ 1,900 |
|
|
(1) See Note 6. Advances and Other Receivables, Net
Loans held for investment that were past due 90 days or more were $127.0 million and $277,000 at December 31, 2005 and 2004, respectively. At December 31, 2005 and 2004, the Company had loans held for investment of approximately $269.7 million and $0.5 million, respectively, on which the accrual of interest had been discontinued. Had these loans been current throughout their terms, interest income would have been higher by approximately $8.2 million and $18,000 during the years ended December 31, 2005 and 2004, respectively.
F-16
AAMES INVESTMENT CORPORATION AND SUBSIDIARIES
NOTES TO CONSOLIDATED FINANCIAL STATEMENTS (Continued)
At December 31, 2005, all of the securitized loans held for investment collateralized the Company’s financings on loans held for investment, whereas $438.6 million of the not yet securitized loans held for investment were pledged under the Company’s warehouse and repurchase facilities.
Note 6. Advances and Other Receivables, Net
The following table presents the components of advances and other receivables as of the dates indicated (in thousands):
|
| December 31, |
| ||
|
| 2005 |
| 2004 |
|
Accrued interest and other receivables |
| $ 33,427 |
| $ 11,380 |
|
Principal, interest and servicing advances, net |
| 6,164 |
| 10,430 |
|
Cash due from securitization trusts |
| — |
| 859 |
|
Servicing and miscellaneous fees |
| — |
| 71 |
|
Total advances and other receivables |
| $ 39,591 |
| $ 22,740 |
|
The following table presents the activity in the advances receivable allowance for the periods indicated (in thousands):
|
|
|
|
|
| Six Months |
| ||||
|
|
|
|
|
| Ended |
| ||||
|
| Years Ended December 31, |
| December 31, |
| ||||||
|
| 2005 |
| 2004 |
| 2004 |
| ||||
|
|
|
| (unaudited) |
|
|
| ||||
Balance, beginning of period |
| $ 4,170 |
|
| $ 8,150 |
|
|
| $ 4,498 |
|
|
Provision (benefit) for uncollectible advances |
| (3,456 | ) |
| — |
|
|
| — |
|
|
Transfer to allowance for loan losses |
| (2,582 | ) |
| — |
|
|
| — |
|
|
Transfer to LOCOM valuation allowance |
| (600 | ) |
| — |
|
|
| — |
|
|
Addition related to pool calls |
| 8,266 |
|
| 10,390 |
|
|
| — |
|
|
Net charge-offs |
| (3,897) |
|
| (14,370 | ) |
|
| (328 | ) |
|
Balance, end of period |
| $ 1,901 |
|
| $ 4,170 |
|
|
| $ 4,170 |
|
|
The Company maintains an advance allowance for potentially uncollectible advances. During the year ended December 31, 2005, the Company sold in whole loan sales to third parties substantially all of the subperforming mortgage collateral received in the 2005 calls of off-balance sheet securitizations. In connection with the sales, the Company either wrote-off or collected the advances related to the mortgage collateral. Based on its assessment of lower future advance loss exposure on advances related to called collateral, the Company reduced the advance allowance by $3.5 million through a credit to income.
In addition, during the year ended December 31, 2005, the Company transferred $2.6 million and $0.6 million of the advance allowance to the allowance for loan losses and the LOCOM valuation account, respectively. The $2.6 million transfer was made to combine the Company’s assessment of credit risk related to aged servicing advances on the portfolio of loans held for investment. The $0.6 million transfer was made in light of the Company’s assessment of valuation risk to loans held for sale having aged servicing advances from called off-balance sheet securitizations.
F-17
AAMES INVESTMENT CORPORATION AND SUBSIDIARIES
NOTES TO CONSOLIDATED FINANCIAL STATEMENTS (Continued)
Note 7. Residual Interests
At December 31, 2005, the Company had no retained residual interests. During the year ended December 31, 2005, the Company called the seven remaining securitization trusts in which it retained residual interests. No adjustments to the carrying values of the retained residual interests were deemed necessary as a result of calling these residual trusts. Residual interests were recorded as a result of the sale of loans through securitizations that the Company structured as sales, referred to as “off-balance sheet securitizations”.
The activity in residual interests during the periods indicated is summarized as follows (in thousands):
|
|
|
|
|
| Six Months |
|
|
|
|
| ||||
|
| Years Ended |
| Ended |
| Years Ended |
| ||||||||
|
| December 31, |
| December 31, |
| June 30, |
| ||||||||
|
| 2005 |
| 2004 |
| 2004 |
| 2004 |
| 2003 |
| ||||
|
|
|
| (unaudited) |
|
|
|
|
|
|
| ||||
Residual interests, beginning of period |
| $ 39,082 |
|
| $ 51,979 |
|
|
| $ 44,120 |
|
| $ 129,232 |
| $ 197,297 |
|
Accretion |
| — |
|
| 972 |
|
|
| — |
|
| 4,357 |
| 16,558 |
|
Cash received from the trusts |
| (39,082 | ) |
| (13,869 | ) |
|
| (5,038 | ) |
| (89,469 | ) | (49,700 | ) |
Write-down of residual interests |
| — |
|
| — |
|
|
| — |
|
| — |
| (34,923 | ) |
Residual interests, end of year |
| $ — |
|
| $ 39,082 |
|
|
| $ 39,082 |
|
| $ 44,120 |
| $ 129,232 |
|
During the years ended December 31, 2005 and 2004, the six months ended December 31, 2004, and the year ended June 30, 2004, the Company did not dispose of any of its mortgage loans in off-balance sheet securitizations. During the year ended June 30, 2003, the Company completed a $315.0 million off-balance sheet securitization. The Company sold to Capital Z Investments, L.P., a Bermuda partnership (“CZI”), an affiliate of Capital Z, for $8.7 million of cash the residual interests created in the $315.0 million off-balance sheet securitization.
During the years ended December 31, 2005 and June 30, 2004 and 2003, the Company received cash from the trusts in the amounts of $47.3 million, $61.8 million, and $4.4 million, respectively, in connection with finalizing calls of off-balance sheet securitization trusts.
During the years ended December 31, 2005 and June 30, 2004 and 2003, the Company paid cash to the trusts in the amounts of $201.7 million, $320.7 million, and $17.6 million, respectively, in connection with calls of off-balance sheet securitization trusts and the related buy-out of the remaining mortgage loans held in the trusts.
During the year ended June 30, 2003, the Company experienced higher than expected loss severities and higher than estimated prepayment speed activity for mortgage loans in the securitization trusts. Therefore, the Company increased its credit loss assumptions and changed its annual prepayment rate assumptions and also adjusted the underlying forward interest rate curve assumption used to estimate the fair value of its retained residual interests. The effect of these changes in estimates resulted in a $31.9 million write-down to the carrying value of the Company’s retained residual interests. On August 15, 2003, the Company called four securitization trusts. In estimating the effects on the carrying value of the retained residual interests of calling the mortgage loans in those four securitization trusts, the Company wrote down by $3.0 million the retained residual interests related to those four securitization trusts at June 30, 2003.
F-18
AAMES INVESTMENT CORPORATION AND SUBSIDIARIES
NOTES TO CONSOLIDATED FINANCIAL STATEMENTS (Continued)
The table below summarizes cash flows received from (paid to) off-balance sheet securitization trusts during the periods indicated (in thousands):
|
|
|
|
|
| Six Months |
|
|
|
|
| ||||
|
| Years Ended |
| Ended |
| Years Ended |
| ||||||||
|
| December 31, |
| December 31, |
| June 30, |
| ||||||||
|
| 2005 |
| 2004 |
| 2004 |
| 2004 |
| 2003 |
| ||||
|
|
|
| (unaudited) |
|
|
|
|
|
|
| ||||
Servicing fees collected |
| $ 2,001 |
|
| $ 3,761 |
|
|
| $ 1,613 |
|
| $ 4,131 |
| $ 5,310 |
|
Purchases of delinquent and foreclosed loans |
| (40) |
|
| (1,357) |
|
|
| (1,357) |
|
| (1,452) |
| (7,322) |
|
Interest and servicing advances made |
| (8,943) |
|
| (19,852) |
|
|
| (11,978) |
|
| (21,809) |
| (31,190) |
|
Interest and servicing advances collected |
| 15,961 |
|
| 20,071 |
|
|
| 9,577 |
|
| 41,716 |
| 45,769 |
|
Cash received from CZI on sales of residual interests |
| — |
|
| — |
|
|
| — |
|
| — |
| 8,695 |
|
Proceeds from off-balance sheet securitizations |
| — |
|
| — |
|
|
| — |
|
| — |
| 314,958 |
|
Included in net losses on liquidations of mortgage loans in off-balance sheet securitization trusts are net losses of $2.9 million, $12.0 million, $0.5 million and $1.7 million incurred in purchases of delinquent and foreclosed loans during the years ended December 31, 2005 and 2004 and June 30, 2004 and 2003, respectively. There were no net losses incurred on liquidations of delinquent and foreclosed mortgage loans purchased out of off-balance sheet securitizations during the six months ended December 31, 2004.
Key assumptions and estimates used by the Company in measuring the residual interests at the date of securitization resulting from the securitizations completed during the year ended June 30, 2003 were as follows:
|
| Year Ended |
| ||
|
| June 30, 2003 |
| ||
Prepayments: |
|
|
|
|
|
Estimated annual prepayment rates, as a percentage of outstanding principal balance of securitized loans: |
|
|
|
|
|
Fixed rate loans |
|
| 24.3 | % |
|
Adjustable rate loans |
|
| 45.4 | % |
|
Estimated weighted average life of securitized loans |
|
| 4.0 years |
|
|
Credit losses: |
|
|
|
|
|
Future estimated prospective credit losses, as a percentage of original principal balances of securitized loans |
|
| 3.6 | % |
|
Total estimated prospective credit losses (in thousands) |
|
| $ 11,370 |
|
|
Weighted average discount rate |
|
| 15.0 | % |
|
F-19
AAMES INVESTEMENT CORPORATION AND SUBSIDIARIES
NOTES TO CONSOLIDATED FINANCIAL STATEMENTS (Continued)
Note 8. Mortgage Servicing Rights, Net
The Company had no mortgage servicing rights at December 31, 2005 and 2004 and June 30, 2004. The activity in mortgage servicing rights for the periods indicated is summarized as follows (in thousands):
|
| June 30, |
| ||||
|
| 2004 |
| 2003 |
| ||
Mortgage servicing rights, net, beginning of year |
| $ | 220 |
| $ | 2,920 |
|
Amortization |
| (220 | ) | (2,700 | ) | ||
Mortgage servicing rights, net, end of year |
| $ | — |
| $ | 220 |
|
Note 9. Equipment and Improvements, Net
Equipment and improvements, net, consisted of the following at the dates indicated (in thousands):
|
| December 31, |
| ||||
|
| 2005 |
| 2004 |
| ||
Computer hardware |
| $ | 17,525 |
| $ | 15,471 |
|
Furniture and fixtures |
| 12,258 |
| 11,309 |
| ||
Computer software |
| 16,559 |
| 15,094 |
| ||
Leasehold improvements |
| 4,834 |
| 4,190 |
| ||
Subtotal |
| 51,176 |
| 46,064 |
| ||
Accumulated depreciation and amortization |
| (40,366 | ) | (37,224 | ) | ||
Total equipment and improvements, net |
| $ | 10,810 |
| $ | 8,840 |
|
Depreciation and amortization expense was comprised of the following components for the periods indicated in thousands):
|
| Years Ended |
| Six Months |
| Years Ended |
| |||||||||||||
|
| 2005 |
| 2004 |
| 2004 |
| 2004 |
| 2003 |
| |||||||||
|
|
|
| (unaudited) |
|
|
|
|
|
|
| |||||||||
Depreciation |
| $ | 2,731 |
|
| $ | 3,514 |
|
|
| $ | 1,632 |
|
| $ | 3,716 |
| $ | 3,793 |
|
Amortization |
| 639 |
|
| 467 |
|
|
| 248 |
|
| 409 |
| 339 |
| |||||
|
| $ | 3,370 |
|
| $ | 3,981 |
|
|
| $ | 1,880 |
|
| $ | 4,125 |
| $ | 4,132 |
|
F-20
AAMES INVESTEMENT CORPORATION AND SUBSIDIARIES
NOTES TO CONSOLIDATED FINANCIAL STATEMENTS (Continued)
Note 10. Prepaid Expenses and Other Assets
Prepaid expenses and other assets consisted of the following at the dates indicated (in thousands):
|
| December 31, |
| ||||
|
| 2005 |
| 2004 |
| ||
Licensing, permit and performance bond deposits |
| $ | 4,049 |
| $ | 6,338 |
|
Unamortized debt issuance costs |
| 12,364 |
| 6,228 |
| ||
Unamortized commitment fees |
| 1,463 |
| 2,402 |
| ||
Prepaids, security deposits and other deferred charges |
| 2,935 |
| 3,071 |
| ||
Real estate owned |
| 7,100 |
| — |
| ||
Other assets |
| 2,802 |
| 4,037 |
| ||
Total prepaid expenses and other |
| $ | 30,713 |
| $ | 22,076 |
|
Note 11. Derivative Financial Instruments
Hedging Interest Rate Risk
In the interim period between loan origination or purchase and securitization of loans, the Company is exposed to interest rate risk. The majority of loans are sold or securitized within 90 days of origination or purchase. However, a portion of the loans are held for sale or securitization for as long as twelve months (or longer, in very limited circumstances) prior to securitization. If interest rates rise during the period that the mortgage loans are held, the spread between the weighted average interest rate on the loans to be sold or to be securitized and the pass-through interest rates on the securities to be sold (the latter having increased as a result of market interest rate movements) may narrow. From time to time, the Company mitigates this exposure to rising interest rates through interest rate cap agreements, forward interest rate swap agreements or other hedging activities. These hedging activities help mitigate the risk of absolute movements in interest rates.
A significant risk to the Company’s operations that relates to its REIT portfolio management is the risk that interest rates on its assets will not adjust at the same time or amount as the rates on its liabilities adjust. This is because the interest on the underlying hybrid/adjustable rate mortgage loans is based on fixed rates payable on the underlying loans for the first two or three years from origination, while the holders of the applicable bonds issued in securitization are generally paid based on an adjustable one-month LIBOR-based yield. Moreover, even after the initial fixed period, the Company’s loans generally adjust every six months and are subject to periodic rate caps, whereas the bonds adjust monthly based primarily on LIBOR. Therefore, an increase in one-month LIBOR generally reduces the net interest income the Company receives from its securitized loan portfolio. The Company attempts to mitigate a portion of this net interest margin variability during the first two years after loan origination by purchasing derivative financial instruments referred to as interest rate cap agreements.
At December 31, 2005 and 2004, the Company was party to $5.9 billion and $2.5 billion, respectively, of notional amounts of interest rate cap agreements designed to mitigate interest rate exposure on its financings of loans held for investment that were indexed to one-month LIBOR. The fair value of the Company’s position in the interest rate caps was $58.1 million and $31.9 million at December 31, 2005 and 2004. Included in interest expense during the years ended December 31, 2005 and 2004 and the six months ended December 31, 2004 were losses (gains) of $0.1 million, $(6.3) million, and $(6.3) million, respectively, to mark open hedge positions to their fair value.
F-21
AAMES INVESTEMENT CORPORATION AND SUBSIDIARIES
NOTES TO CONSOLIDATED FINANCIAL STATEMENTS (Continued)
The activity in derivative financial instruments related to loans held for investment is summarized as follows for the periods indicated (in thousands):
|
| Years Ended December 31, |
| ||||||
|
| 2005 |
| 2004 |
| ||||
|
|
|
| (unaudited) |
| ||||
Balance, beginning of period |
| $ | 31,947 |
|
| $ | — |
|
|
Premium |
| 26,343 |
|
| 25,603 |
|
| ||
Mark-to-market (loss) gain |
| (143 | ) |
| 6,344 |
|
| ||
Balance, end of period |
| $ | 58,147 |
|
| $ | 31,947 |
|
|
The Company, as it has from time to time, entered into interest rate contracts designed to mitigate interest rate exposure to the Company’s inventory and pipeline of loans held for sale in anticipation of closing loan dispositions transactions during the period. Gain on sale of loans during the year and six months ended December 31, 2004 included charges of $2.9 million of derivative related losses on interest rate cap agreements which closed during the period.
At June 30, 2004, the Company was a party to $550.0 million (notional) of interest rate cap agreements that were indexed to one-month LIBOR. The fair value of the Company’s position in the interest rate caps was $6.3 million at June 30, 2004. Gain on sale of loans during the year ended June 30, 2004 includes a diminimis credit to income to mark the interest rate caps to market at June 30, 2004. At June 30, 2003, the Company had no hedge instruments in place. Gain on sale of loans during the year ended June 30, 2003 includes $10.9 million of derivative related losses. All of the $10.9 million of hedge losses relate to losses on forward interest swap agreements which closed during the year ended June 30, 2003.
Credit Risk
The Company is exposed to on-balance sheet credit risk related to its loans held for investment and loans held for sale. The Company is exposed to off-balance sheet credit risk related to loans which the Company has committed to originate.
Note 12. Financings on Loans Held for Investment
Financings on loans held for investment consisted of the following as of the dates indicated (in thousands):
|
| December 31, |
| ||||
|
| 2005 |
| 2004 |
| ||
Securitized bonds |
| $ | 3,638,402 |
| $ | 1,159,736 |
|
Unamortized debt discount |
| (15,214 | ) | (2,266 | ) | ||
Total financings on loans held for investment |
| $ | 3,623,188 |
| $ | 1,157,470 |
|
The interest rates on the securitized bonds reset monthly and are indexed to one-month LIBOR.
At December 31, 2005 and 2004, the Company had $12.4 million and $6.2 million, respectively, of unamortized debt issuance costs related to the issuance of the financings on loans held for investment which are included in prepaid expenses and other assets in the accompanying consolidated balance sheets.
F-22
AAMES INVESTEMENT CORPORATION AND SUBSIDIARIES
NOTES TO CONSOLIDATED FINANCIAL STATEMENTS (Continued)
Unamortized debt discount and debt issuance costs are amortized to interest expense over the expected economic life of the bonds.
The Company’s maturity of financings on loans held for investment is based on certain prepayment assumptions. The Company currently estimates the average life of the financings to be approximately 1.8 to 4.0 years.
The following table summarizes the Company’s current estimate of the maturity of the financings (dollar in thousands):
2006 |
| $ | 1,498,405 |
|
2007 |
| 1,057,794 |
| |
2008 |
| 470,684 |
| |
2009 |
| 249,877 |
| |
2010 |
| 135,214 |
| |
Thereafter |
| 226,428 |
| |
|
| $ | 3,638,402 |
|
Note 13. Revolving Warehouse and Repurchase Facilities
Amounts outstanding under committed revolving warehouse and repurchase facilities, which are collateralized by loans held for sale, consisted of the following at the dates indicated (in thousands):
|
| December 31, |
| ||||||
|
| 2005 |
| 2004 |
| ||||
Repurchase facilities at December 31, 2005: |
|
|
|
|
|
|
| ||
$500.0 million facility, expires January 17, 2007; bearing interest at 0.95% to 1.45% over one-month LIBOR, depending on collateral |
|
| $ | 217,359 |
|
| $ | 256,686 |
|
$500.0 million facility, expires August 4, 2006; generally bearing interest at 0.85% to 1.0% over one-month LIBOR, depending on collateral |
|
| 187,587 |
|
| 93,078 |
| ||
$500.0 million facility expires December 1, 2006, generally bearing interest at 0.85% to 1.50% over one-month LIBOR, depending on collateral |
|
| 416,679 |
|
| 95,962 |
| ||
Warehouse facilities at December 31, 2005: |
|
|
|
|
|
|
| ||
$700.0 million facility expires April 3, 2006; bearing interest at 0.95% to 2.00% over one-month LIBOR, depending on collateral |
|
| 220,381 |
|
| 191,327 |
| ||
$300.0 million facility expires September 29, 2006; generally bearing interest at 0.95% to 1.65% over one-month LIBOR, depending on collateral |
|
| 76,045 |
|
| 6,303 |
| ||
$300.0 million facility, expires March 24, 2006; generally bearing interest at 0.95% to 2.75% over one-month LIBOR, depending on collateral |
|
| 223,632 |
|
| 165,857 |
| ||
Total amounts outstanding under revolving warehouse and repurchase facilities |
|
| $ | 1,341,683 |
|
| $ | 809,213 |
|
While no assurance can be made, the Company expects to renew on terms at or similar to those currently in place, the aforementioned revolving warehouse facilities.
F-23
AAMES INVESTEMENT CORPORATION AND SUBSIDIARIES
NOTES TO CONSOLIDATED FINANCIAL STATEMENTS (Continued)
The following table summarizes certain information related to the Company’s revolving warehouse and repurchase facilities at the dates indicated (in thousands):
|
| December 31, |
| ||||
|
| 2005 |
| 2004 |
| ||
Total revolving warehouse and repurchase facilities: |
|
|
|
|
| ||
Committed |
| $ | 2,700,000 |
| $ | 2,450,000 |
|
Uncommitted |
| 100,000 |
| 100,000 |
| ||
Total |
| $ | 2,800,000 |
| $ | 2,550,000 |
|
Borrowing availability |
| $ | 1,458,317 |
| $ | 1,740,787 |
|
One-month LIBOR |
| 4.39 | % | 2.40 | % | ||
The following table summarizes certain information related to the Company’s revolving warehouse and repurchase facilities during the periods indicated (in thousands):
|
| Years Ended |
| Six Months |
| Years Ended |
| |||||||||||
|
| 2005 |
| 2004 |
| 2004 |
| 2004 |
| 2003 |
| |||||||
|
|
|
| (unaudited) |
|
|
|
|
|
|
| |||||||
Borrowings under revolving warehouse and repurchase facilities: |
|
|
|
|
|
|
|
|
|
|
|
|
| |||||
Average amount outstanding during the period |
| $ | 1,061,766 |
| $ | 939,514 |
|
| $ | 1,216,129 |
|
| $ | 755,638 |
| $ | 550,521 |
|
Maximum amount outstanding at any month-end during the period |
| $ | 1,706,334 |
| $ | 1,377,227 |
|
| $ | 1,377,227 |
|
| $ | 1,257,905 |
| $ | 901,176 |
|
Weighted average interest rate during the period |
| 4.34 | % | 2.71 | % |
| 2.82 | % |
| 2.06 | % | 2.22 | % | |||||
The Company and certain of its subsidiaries are parties to the revolving warehouse and repurchase facilities which are utilized to finance the origination of mortgage loans prior to sale or securitization. Revolving warehouse and repurchase facilities typically have a 364-day term and are designated to fund mortgage loans originated within specified underwriting guidelines. The revolving warehouse and repurchase facilities contain provisions requiring the Company to meet certain periodic financial covenants, including, among other things, minimum liquidity, stockholders’ equity, leverage and net income levels. The Company was in compliance with these covenants at December 31, 2005. Additionally, some of the revolving warehouse and repurchase facilities fund less than 100% of the principal balance of the mortgage loans originated, requiring the use of working capital to fund the remaining portion. The majority of the mortgage loans originated under the facilities remain in the facilities for a period generally of up to 90 days, at which point they are securitized or sold to institutional investors.
At December 31, 2005 and 2004, included in prepaid expenses and other assets in the accompanying consolidated balance sheets were $1.5 million and $2.4 million, respectively, of deferred commitment fees relating to the revolving warehouse and repurchase facilities remaining to be amortized to interest expense over their respective remaining terms.
F-24
AAMES INVESTEMENT CORPORATION AND SUBSIDIARIES
NOTES TO CONSOLIDATED FINANCIAL STATEMENTS (Continued)
Note 14. Borrowings
Amounts outstanding under borrowings consisted of the following at the dates indicated (in thousands):
|
| December 31, |
| ||||
|
| 2005 |
| 2004 |
| ||
Short-term collateralized financing facility |
| $ | 16,487 |
| $ | — |
|
Financing Facility due March 2005 |
| — |
| 7,680 |
| ||
Total borrowings |
| $ | 16,487 |
| $ | 7,680 |
|
At December 31, 2005, the Company was party to a revolving facility pursuant to which $35.6 million at par value of retained bonds (resulting from the Company’s securitization of loans) was pledged as collateral. Amounts outstanding under the facility were subject to interest at one-month or one-week LIBOR, plus 65 to 150 basis points, depending the term of the requested advance.
During January 2006, the Company elected to issue certain of these retained bonds and the proceeds from the issuance were used to fully repay the related amounts outstanding under the facility.
Note 15. Accounts Payable and Accrued Expenses
The Company maintains a representation and warranty allowance for exposure to losses that arise in connection with loans that it is required to repurchase from whole loan buyers. The allowance is included in accounts payable and accrued expenses in the consolidated balance sheets. The allowance, which totaled $9.0 million at December 31, 2005, is carried to address repurchase obligations arising from representations and warranty claims, and obligations for other contractual disputes with investors with respect to mortgage loan sales. Allowance levels are a function of expected losses based on expected and actual pending claims and repurchase requests, historical experience, loan volume and loan sales distribution channels and the assessment of probability related to such claims. While the ultimate amount of repurchases and warranty claims is uncertain, the Company believes that the allowance is adequate. The Company will continue to evaluate the adequacy of its representation and warranty reserve and may continue to allocate a portion of its gain on sale proceeds for these exposures going forward. Changes in the level of provision to this allowance impacts the overall gain on sale margin from quarter to quarter.
The following table presents activity in the representation and warranty allowance for the periods indicated (in thousands):
|
|
|
|
|
| Six Months |
| |||||||
|
|
|
|
|
| Ended |
| |||||||
|
| Years Ended December 31, |
| December 31, |
| |||||||||
|
| 2005 |
| 2004 |
| 2004 |
| |||||||
|
|
|
| (unaudited) |
|
|
| |||||||
Balance, beginning of period |
| $ | 13,137 |
|
| $ | 6,528 |
|
|
| $ | 11,636 |
|
|
Provision for representation, warranty and other miscellaneous losses |
| 2,547 |
|
| 22,212 |
|
|
| 7,359 |
|
| |||
Charge-offs |
| (6,710 | ) |
| (15,827 | ) |
|
| (5,871 | ) |
| |||
Recoveries |
| 40 |
|
| 224 |
|
|
| 13 |
|
| |||
Net charge-offs |
| (6,670 | ) |
| (15,603 | ) |
|
| (5,858 | ) |
| |||
Balance, end of period |
| $ | 9,014 |
|
| $ | 13,137 |
|
|
| $ | 13,137 |
|
|
F-25
AAMES INVESTMENT CORPORATION AND SUBSIDIARIES
NOTES TO CONSOLIDATED FINANCIAL STATEMENTS (Continued)
The income tax provision (benefit) consisted of the following for the periods indicated (in thousands):
|
| Years Ended |
| Six Months |
| Years Ended |
| |||||||||||||
|
| 2005 |
| 2004 |
| 2004 |
| 2004 |
| 2003 |
| |||||||||
|
|
|
| (unaudited) |
|
|
|
|
|
|
| |||||||||
Current taxes: |
|
|
|
|
|
|
|
|
|
|
|
|
|
|
| |||||
Federal |
| $ | 763 |
|
| $ | 2,525 |
|
|
| $ | 700 |
|
| $ | 2,450 |
| $ | 3,509 |
|
State |
| 167 |
|
| (152 | ) |
|
| 581 |
|
| 1,761 |
| 652 |
| |||||
|
| 930 |
|
| 2,373 |
|
|
| 1,281 |
|
| 4,211 |
| 4,161 |
| |||||
Deferred taxes: |
|
|
|
|
|
|
|
|
|
|
|
|
|
|
| |||||
Federal |
| (239 | ) |
| (11,761 | ) |
|
| (2,388 | ) |
| (26,405 | ) | (6,000 | ) | |||||
State |
| 151 |
|
| 4,455 |
|
|
| (4,128 | ) |
| 4,520 |
| — |
| |||||
|
| (88 | ) |
| (7,306 | ) |
|
| (6,516 | ) |
| (21,885 | ) | (6,000 | ) | |||||
Total income tax provision (benefit) |
| $ | 842 |
|
| $ | (4,933 | ) |
|
| $ | (5,235 | ) |
| $ | (17,674 | ) | $ | (1,839 | ) |
The following table summarizes the tax effects of temporary differences that give rise to significant portions of deferred tax assets and deferred tax liabilities at the dates indicated (in thousands):
|
| December 31, |
| ||||
|
| 2005 |
| 2004 |
| ||
Deferred tax assets: |
|
|
|
|
| ||
Net operating loss carry forward |
| $ | 120,429 |
| $ | 68,825 |
|
Residual interests |
| — |
| 25,668 |
| ||
Mark-to-market |
| 6,615 |
| 2,600 |
| ||
Compensation |
| 4,523 |
| 5,638 |
| ||
Other |
| — |
| 322 |
| ||
Total gross deferred tax assets |
| 131,567 |
| 103,053 |
| ||
Tax valuation allowance |
| (95,454 | ) | (71,024 | ) | ||
Deferred tax liabilities: |
|
|
|
|
| ||
State taxes |
| (5,319 | ) | (3,628 | ) | ||
Other |
| (2,305 | ) | — |
| ||
Total gross deferred tax liabilities |
| (7,624 | ) | (3,628 | ) | ||
Deferred tax asset, net |
| $ | 28,489 |
| $ | 28,401 |
|
F-26
AAMES INVESTMENT CORPORATION AND SUBSIDIARIES
NOTES TO CONSOLIDATED FINANCIAL STATEMENTS (Continued)
The following tables reconcile the statutory federal income tax rate to the effective income tax rate for the periods presented (dollars in thousands):
|
| Year Ended December 31, 2005 |
| |||||||||||||
|
| Permanent |
| Tax Effected |
| Effective |
| |||||||||
Income tax provision (benefit) |
|
|
|
|
|
|
|
|
|
| $ | 842 |
|
| ||
Income (loss) before income taxes |
|
|
|
|
|
|
|
|
|
| (5,389 | ) |
| |||
Effective tax rate |
|
|
|
|
|
|
|
|
|
| (15.6 | )% |
| |||
Federal statutory rate |
|
|
|
|
|
|
|
|
|
| 35.0 | % |
| |||
Tax valuation allowance |
|
| $ | 81,213 |
|
|
| $ | 28,425 |
|
|
| (527.5 | )% |
| |
State taxes |
|
| (4,400 | ) |
|
| (2,860 | ) |
|
| 53.1 | % |
| |||
Non-taxable REIT income |
|
| (64,192 | ) |
|
| (22,467 | ) |
|
| 416.9 | % |
| |||
Other |
|
| (1,010 | ) |
|
| (370 | ) |
|
| 6.9 | % |
| |||
|
|
|
|
|
|
|
|
|
|
| (15.6 | )% |
| |||
|
| Year Ended December 31, 2004 (unaudited) |
| |||||||||||||
|
| Permanent |
| Tax Effected |
| Effective |
| |||||||||
Income tax provision (benefit) |
|
|
|
|
|
|
|
|
|
| $ | (4,933 | ) |
| ||
Income (loss) before income taxes |
|
|
|
|
|
|
|
|
|
| 36,852 |
|
| |||
Effective tax rate |
|
|
|
|
|
|
|
|
|
| (13.4 | )% |
| |||
Federal statutory rate |
|
|
|
|
|
|
|
|
|
| 35.0 | % |
| |||
Tax valuation allowance |
|
| $ | (74,065 | ) |
|
| $ | (21,597 | ) |
|
| (58.6 | )% |
| |
State taxes |
|
| 10,564 |
|
|
| 6,947 |
|
|
| 18.9 | % |
| |||
Non-taxable REIT income |
|
| (9,465 | ) |
|
| (3,313 | ) |
|
| (9.0 | )% |
| |||
Non-deductible reorganization expense |
|
| 3,000 |
|
|
| 1,050 |
|
|
| 2.8 | % |
| |||
Other |
|
| (2,261 | ) |
|
| (919 | ) |
|
| (2.5 | )% |
| |||
|
|
|
|
|
|
|
|
|
|
| (13.4 | )% |
| |||
|
| Six Months Ended December 31, 2004 |
| |||||||||||||
|
| Permanent |
| Tax Effected |
| Effective |
| |||||||||
Income tax provision (benefit) |
|
|
|
|
|
|
|
|
|
| $ | (5,235 | ) |
| ||
Income (loss) before income taxes |
|
|
|
|
|
|
|
|
|
| (8,320 | ) |
| |||
Effective tax rate |
|
|
|
|
|
|
|
|
|
| 62.9 | % |
| |||
Federal statutory rate |
|
|
|
|
|
|
|
|
|
| 35.0 | % |
| |||
Tax valuation allowance |
|
| $ | (8,301 | ) |
|
| $ | (2,905 | ) |
|
| 34.9 | % |
| |
State taxes |
|
| 4,283 |
|
|
| 2,784 |
|
|
| (33.5 | )% |
| |||
Non-taxable REIT income |
|
| (9,465 | ) |
|
| (3,313 | ) |
|
| 39.8 | % |
| |||
Non-deductible reorganization expense |
|
| 3,000 |
|
|
| 1,050 |
|
|
| (12.6 | )% |
| |||
Other |
|
| 174 |
|
|
| 61 |
|
|
| (0.7 | )% |
| |||
|
|
|
|
|
|
|
|
|
|
| 62.9 | % |
| |||
F-27
AAMES INVESTMENT CORPORATION AND SUBSIDIARIES
NOTES TO CONSOLIDATED FINANCIAL STATEMENTS (Continued)
|
| Year Ended June 30, 2004 |
| |||||||||||
|
| Permanent |
| Tax Effected |
| Effective |
| |||||||
Income tax provision (benefit) |
|
|
|
|
|
|
|
| $ | (17,674 | ) |
| ||
Income (loss) before income taxes |
|
|
|
|
|
|
|
| 73,040 |
|
| |||
Effective tax rate |
|
|
|
|
|
|
|
| (24.2 | )% |
| |||
Federal statutory rate |
|
|
|
|
|
|
|
| 35.0 | % |
| |||
Tax valuation allowance |
| $ | (135,526 | ) |
| $ | (47,434 | ) |
|
| (64.9 | )% |
| |
State taxes |
| 6,281 |
|
| 4,163 |
|
|
| 5.7 | % |
| |||
|
|
|
|
|
|
|
|
| (24.2 | )% |
| |||
|
| Year Ended June 30, 2003 |
| |||||||||||||
|
| Permanent |
| Tax Effected |
| Effective |
| |||||||||
Income tax provision (benefit) |
|
|
|
|
|
|
|
|
|
| $ | (1,839 | ) |
| ||
Income (loss) before income taxes |
|
|
|
|
|
|
|
|
|
| 27,327 |
|
| |||
Effective tax rate |
|
|
|
|
|
|
|
|
|
| (6.7 | )% |
| |||
Federal statutory rate |
|
|
|
|
|
|
|
|
|
| 35.0 | % |
| |||
Tax valuation allowance |
|
| $ | (28,058 | ) |
|
| $ | (11,750 | ) |
|
| (43.0 | )% |
| |
Other, net |
|
| 848 |
|
|
| 355 |
|
|
| 1.3 | % |
| |||
|
|
|
|
|
|
|
|
|
|
| (6.7 | )% |
| |||
The REIT reorganization of the Company in November 2004 and the investment in the Company by Capital Z in February 1999 resulted in a change of control for income tax purposes thereby potentially limiting the Company’s ability to utilize net operating loss carry forwards and certain other future deductions.
The Company’s residual interest in real estate mortgage investment conduits (“REMIC”) creates excess inclusion income for tax purposes which may give rise to a current income tax liability. Available net loss carryforwards and current operating losses may not reduce taxable income below excess inclusion income earned from the REMICs.
The Company’s estimated federal net operating loss carryforward at December 31, 2005 and related expiration dates are as follows (dollars in thousands):
Year of Expiration |
|
|
| Amount |
| |||
2017 |
|
| $ | 40.0 |
|
| ||
2018 |
|
| 76.3 |
|
| |||
2019 |
|
| 47.0 |
|
| |||
2020 |
|
| 8.2 |
|
| |||
2021 |
|
| 6.4 |
|
| |||
2022 |
|
| 7.1 |
|
| |||
2023 |
|
| 1.3 |
|
| |||
2024 |
|
| 12.9 |
|
| |||
2025 |
|
| 104.9 |
|
| |||
Total federal tax net operating losses |
|
| $ | 304.1 |
|
| ||
F-28
AAMES INVESTMENT CORPORATION AND SUBSIDIARIES
NOTES TO CONSOLIDATED FINANCIAL STATEMENTS (Continued)
Note 17. Commitments and Contingencies
Operating Leases
The Company leases office space under operating leases expiring at various dates through March 2012. Certain leases have provisions for renewal options and/or rental increases at specified increments or in relation to increases in the Consumer Price Index.
The following table summarizes rent expense, sublease receipts and sublease related discount authorization related to such operating leases during the periods presented (in thousands):
|
| Rent |
| Sublease |
| Sublease |
| |||||||
Years ended: |
|
|
|
|
|
|
|
|
|
|
| |||
December 31, 2005 |
| $ | 12,029 |
|
| $ | 1,537 |
|
|
| $ | 266 |
|
|
December 31, 2004 (unaudited) |
| 10,108 |
|
| 1,476 |
|
|
| 276 |
|
| |||
Six months ended: |
|
|
|
|
|
|
|
|
|
|
| |||
December 31, 2004 |
| $ | 5,225 |
|
| $ | 740 |
|
|
| $ | 137 |
|
|
Years ended: |
|
|
|
|
|
|
|
|
|
|
| |||
June 30, 2004 |
| $ | 9,383 |
|
| $ | 1,445 |
|
|
| $ | 280 |
|
|
June 30, 2003 |
| 8,160 |
|
| 1,426 |
|
|
| 289 |
|
| |||
At December 31, 2005, future minimum rental payments required under non-cancelable operating leases and minimum receipts under subleases that have initial or remaining terms in excess of one year are as follows (in thousands):
|
| December 31, 2005 |
| |||||||||||||
|
| Minimum |
| Minimum |
| Net |
| |||||||||
2006 |
|
| $ | 13,465 |
|
|
| $ | 1,172 |
|
|
| $ | 12,293 |
|
|
2007 |
|
| 12,959 |
|
|
| 1,087 |
|
|
| 11,872 |
|
| |||
2008 |
|
| 11,001 |
|
|
| 1,087 |
|
|
| 9,914 |
|
| |||
2009 |
|
| 6,469 |
|
|
| 878 |
|
|
| 5,591 |
|
| |||
2010 |
|
| 5,570 |
|
|
| 878 |
|
|
| 4,692 |
|
| |||
Thereafter |
|
| 6,345 |
|
|
| 1,097 |
|
|
| 5,248 |
|
| |||
|
|
| $ | 55,809 |
|
|
| $ | 6,199 |
|
|
| $ | 49,610 |
|
|
Litigation
In July 2005, the Company was served with a putative class action complaint entitled Webb v. Aames Investment Corporation, et. al. brought in the United States District Court, Central District of California. In December 2005, the Company was served with a putative class action complaint entitled Cooper v. Aames Investment Corporation, et. al. brought in the United States District Court, Eastern District of Wisconsin. These complaints allege violations of the Fair Credit Reporting Act (“FCRA”) in connection with prescreened offers of credit, which the Company made to plaintiffs. Webb also alleges that the Company’s direct mail pieces failed to comply with the requirements of FCRA that the required notice be clear and
F-29
AAMES INVESTMENT CORPORATION AND SUBSIDIARIES
NOTES TO CONSOLIDATED FINANCIAL STATEMENTS (Continued)
conspicuous. The plaintiffs seek to recover on behalf of themselves and others similarly situated compensatory and punitive damages and attorneys’ fees. The Company filed a motion to dismiss the clear and conspicuous claims in connection with Webb and while the Company believes that a motion with leave to amend will be granted, an order has not yet been entered. The Company also filed a motion to transfer Cooper to the Central District of California where Webb is pending. There have been no rulings on the merits of the plaintiffs’ claims or the claims of the putative class in either matter and no class has been certified. The Company intends to vigorously defend these matters but if a class is certified and prevails on the merits, the potential liability could have a material adverse affect on the Company’s business. The outcome of these cases and the amount of liability, if any, cannot be determined at this time.
On April 27, 2004, the Company received a civil investigative demand from the Federal Trade Commission, or the FTC, that, although not alleging any wrongdoing, sought documents and data relating to the Company’s business and lending practices. The demand was issued pursuant to an April 8, 2004 resolution of the FTC authorizing non-public investigations of various unnamed subprime lenders and loan brokers to determine whether there have been violations of certain consumer protection laws. The Company has cooperated and intends to continue to cooperate fully with the FTC in this investigation. Because the investigation is at an early stage, the Company cannot predict the outcome of the investigation and its effect, if any, on the Company’s business.
On September 7, 2004, Aames Financial received a Civil Investigative Demand and Notice to Proceed from the Office of the Attorney General of Iowa, that, although not alleging any wrongdoing, sought documents and data relating to its business and lending practices in Iowa. Aames Financial has cooperated and intends to cooperate fully with the Office of the Attorney General of Iowa in this investigation. Because the investigation is at an early stage, Aames Financial cannot predict the outcome of the investigation and its effect, if any on its business in Iowa.
In the ordinary course of its business, the Company is subject to various claims made against it by borrowers, private investors and others arising from, among other things, losses that are claimed to have been incurred as a result of alleged breaches of fiduciary obligations, misrepresentations, errors and omissions of employees and officers of the Company, incomplete documentation and failures by the Company to comply with various laws, such as consumer protection laws, employment laws and other federal and state laws, and regulations applicable to its business. The Company believes that liability with respect to any of these currently asserted claims or legal actions is not likely to be material to the Company’s consolidated financial position and results of operations; however, any claims asserted or legal action in the future may result in expenses which could have a material adverse effect on the Company’s consolidated financial position and results of operations.
Note 18. Fair Value of Financial Instruments
The following disclosures of the estimated fair value of financial instruments at December 31, 2005 and 2004 are made by the Company using available market information, historical data, and appropriate valuation methodologies. However, considerable judgment is required to interpret market and historical data to develop the estimates of fair value. Accordingly, the estimates presented herein are not necessarily indicative of the amounts the Company could realize in a current market exchange.
F-30
AAMES INVESTMENT CORPORATION AND SUBSIDIARIES
NOTES TO CONSOLIDATED FINANCIAL STATEMENTS (Continued)
The use of different market assumptions and/or estimation methodologies may have a material effect on the estimated fair value amounts (in thousands).
|
| December 31, 2005 |
| December 31, 2004 |
| ||||||||
|
| Carrying |
| Estimated |
| Carrying |
| Estimated |
| ||||
Cash and cash equivalents |
| $ | 123,172 |
| $ | 123,172 |
| $ | 37,780 |
| $ | 37,780 |
|
Loans held for sale |
| 951,177 |
| 962,243 |
| 484,963 |
| 491,194 |
| ||||
Loans held for investment, net |
| 4,085,536 |
| 4,105,351 |
| 1,725,046 |
| 1,758,951 |
| ||||
Advances and other receivables |
| 39,591 |
| 39,591 |
| 22,740 |
| 22,740 |
| ||||
Interest rate cap agreements |
| 58,147 |
| 58,147 |
| 31,947 |
| 31,947 |
| ||||
Residual interests |
| — |
| — |
| 39,082 |
| 39,082 |
| ||||
Financings on loans held for investment |
| 3,623,188 |
| 3,623,188 |
| 1,157,470 |
| 1,157,470 |
| ||||
Revolving warehouse and repurchase facilities |
| 1,341,683 |
| 1,341,683 |
| 809,213 |
| 809,213 |
| ||||
Borrowings |
| 16,487 |
| 16,487 |
| 7,680 |
| 7,680 |
| ||||
The fair value estimates at December 31, 2005 and 2004, are based on pertinent information available to management as of the respective dates. Although management is not aware of any factors that would significantly affect the estimated fair value amounts, such amounts have not been revalued for purposes of these consolidated financial statements since those dates and, therefore, current estimates of fair value may differ significantly from the amounts presented herein.
The following describes the methods and assumptions used by the Company in estimating fair values:
· Cash and cash equivalents are based on the carrying amount which is a reasonable estimate of the fair value.
· Loans held for sale are based on outstanding whole loan commitments or current investor yield requirements.
· Loans held for investment are based on the estimated value of the portfolio of loans held for investment at current market prices for similar loans using current investor yield requirements.
· Advances and other receivables are generally short term in nature, therefore the carrying value approximates fair value.
· Interest rate caps are based on quoted market prices.
· Residual interests and mortgage servicing rights are based on the present value of expected future cash flows using assumptions based on the Company’s historical experience, industry information and estimated rates of future prepayment and credit loss.
· Amounts outstanding under financings on loans held for investment and borrowings generally bear market rates of interest and, therefore, are based on the carrying amount which is a reasonable estimate of fair value.
· Amounts outstanding under revolving warehouse and repurchase facilities are short term in nature and generally bear market rates of interest and, therefore, are based on the carrying amount which is a reasonable estimate of fair value.
F-31
AAMES INVESTMENT CORPORATION AND SUBSIDIARIES
NOTES TO CONSOLIDATED FINANCIAL STATEMENTS (Continued)
Further, the Company has identified the following loan products that are included in our loans held for investment whose contractual terms may give rise to a concentration of credit risk and increase our exposure to risk of nonpayment or realization:
1) Traditional hybrid ARM loans that are subject to future payment increases when the loans become subject to an adjustable interest rate after the lapse of the initial fixed rate period,
2) Loans with initial interest-only payment features that are subject to (i) future payment increases due to interest rate resets and, (ii) after the lapse of the interest-only period, conversion to amortizing principal and interest payment increases, and
3) Mortgage loans with combined loan-to-value ratios above 80.0%.
The table below details the unpaid principal balance of the identified loan products and their percentage composition of the unpaid principal balance of the Company’s loans held for investment at December 31, 2005 (dollars in thousands):
Loan Product or Characteristic |
|
|
| Unpaid |
| Percentage |
| |||
Traditional hybrid: |
|
|
|
|
|
|
| |||
Hybrid ARM 2/28 |
| $ | 2,870,672 |
|
| 69.7 | % |
| ||
Hybrid ARM 3/27 |
| 99,468 |
|
| 2.4 | % |
| |||
Hybrid ARM 5/25 |
| 144,983 |
|
| 3.5 | % |
| |||
Hybrid ARM 6 month adjustable |
| 227,465 |
|
| 5.5 | % |
| |||
|
| $ | 3,342,588 |
|
| 81.1 | % |
| ||
Interest-only hybrid: |
|
|
|
|
|
|
| |||
Hybrid ARM 2/28 |
| $ | 395,990 |
|
| 9.6 | % |
| ||
Hybrid ARM 3/27 |
| 14,284 |
|
| 0.3 | % |
| |||
Hybrid ARM 5/25 |
| 27,633 |
|
| 0.7 | % |
| |||
Hybrid ARM 6 month adjustable |
| 40,537 |
|
| 1.0 | % |
| |||
|
| $ | 478,444 |
|
| 11.6 | % |
| ||
Loans with loan-to-value |
|
|
|
|
|
|
| |||
ratios above 80%: |
|
|
|
|
|
|
| |||
> 80.0% to < / = 90.0% |
| $ | 2,746,423 |
|
| 66.6 | % |
| ||
> 90.0% to < / = 100.0% |
| 252,093 |
|
| 6.1 | % |
| |||
|
| $ | 2,998,516 |
|
| 72.7 | % |
| ||
Total unpaid principal balance of loans held for investment |
| $ | 4,121,108 |
|
|
|
|
| ||
Note 19. Employee Benefit Plans
401(k) Retirement Savings Plan
The Company sponsors a 401(k) Retirement Savings Plan, a defined contribution plan. Substantially all employees are eligible to participate in the plan after reaching the age of 21 and completion of six months of service. Contributions are made from employees’ elected salary deferrals. Effective January 1, 2001, the Company began contributing to the plan on a matching basis, however, the Company’s
F-32
AAMES INVESTMENT CORPORATION AND SUBSIDIARIES
NOTES TO CONSOLIDATED FINANCIAL STATEMENTS (Continued)
contribution remains at its option. Under the match, for every dollar the employee contributes to the Plan up to 6% of his eligible pay, the Company contributes $0.50 to his account. Prior thereto, employer contributions were determined at the beginning of the plan year at the option of the Company. Contributions made to the Plan by the Company during the years ended December 31, 2005 and 2004 (unaudited) and six months ended December 31, 2004 were $1.5 million, $1.5 million, and $0.6 million, respectively, and during the years ended June 30, 2004 and 2003 were $1.4 million and $1.1 million, respectively.
Stock-Based Compensation
Prior to the corporate reorganization that was consummated on November 5, 2004, Aames Financial Corporation issued to employees options to purchase Aames Financial common stock pursuant to the Aames Financial Corporation 1999 Amended and Restated Stock Option Plan (the “1999 Plan”). Immediately prior to the reorganization, each option to purchase Aames Financial Corporation common stock with an option exercise price below $2.383, the per share consideration received in the reorganization by Aames Financial common stockholders, which did not vest at November 5, 2004, was converted immediately prior to the reorganization into vested Aames Financial restricted common stock units, pursuant to the 2004 Aames Financial Corporation Equity Incentive Plan (the “Aames Financial EIP”). At that time, 1,282,553 Aames Financial restricted stock units were issued and personnel expense was charged for $10.9 million. Upon consummation of the reorganization, all restricted stock units issued under the Aames Financial EIP were exchanged for Aames Investment Corporation restricted common stock units. In addition, all options to purchase Aames Financial common stock with an exercise price above $2.383 were terminated and the 1999 Plan was cancelled. The Aames Investment restricted common stock units were issued pursuant to the Aames Investment Corporation 2004 Equity Incentive Plan, (the “Aames Investment EIP”) along with the issuance of 861,000 restricted stock awards which vest 25.0% per year commencing on the first anniversary date from the date of grant.
In addition, due to the change in control resulting from the corporate reorganization, 22.2 million Series E Preferred Stock Options became exercisable by their holders resulting in a $6.4 million charge to personnel expense in November 2004. There are no longer any Series E Preferred Stock Options issued and outstanding.
The following tables present activity in Restricted Stock Units (“RSUs”) and Restricted Stock Awards (“RSAs”) for the periods presented.
|
| Number |
| Grant |
| |
RSU’s |
|
|
|
|
| |
Balance outstanding, December 31, 2004 |
| 1,232,520 |
| $ | 8.50 |
|
Granted |
| — |
| — |
| |
Cancelled(1) |
| (176,424 | ) | 8.50 |
| |
Converted |
| (339,545 | ) | 8.50 |
| |
Balance outstanding, December 31, 2005 |
| 716,551 |
| $ | 8.50 |
|
F-33
AAMES INVESTMENT CORPORATION AND SUBSIDIARIES
NOTES TO CONSOLIDATED FINANCIAL STATEMENTS (Continued)
|
| Number |
| Grant |
| |
RSA’s |
|
|
|
|
| |
Balance outstanding, December 31, 2004 |
| 800,000 |
| $ | 8.50 |
|
Granted |
| 434,160 |
| 6.05-9.82 |
| |
Expired |
| — |
| — |
| |
Cancelled(1) |
| (169,120 | ) | 8.50-9.43 |
| |
Vested and converted |
| (128,524 | ) | 8.50 |
| |
Balance outstanding, December 31, 2005 |
| 936,516 |
| 6.05-9.82 |
| |
(1) Cancellations of RSUs/RSAs include those arising from employee terminations as well as RSUs/RSAs that were returned to the Company to settle payroll tax obligations upon conversion of RSUs/RSAs to common stock.
During the year ended December 31, 2005, 128,524 RSA’s vested and compensation expense of $2.3 million was recorded.
A summary of the Company’s former stock option plans and arrangements that were in effect as of June 30, 2004 and 2003 and changes during the years then ended are as follows:
|
| Number |
| Exercise |
| |
Balance outstanding, June 30, 2002 |
| 14,296,666 |
| $ | 0.73-147.90 |
|
Granted |
| 2,191,611 |
| 0.85-1.68 |
| |
Exercised |
| (108,138 | ) | 0.85-1.00 |
| |
Cancelled/Expired |
| (2,294,769 | ) | 0.85-137.10 |
| |
Balance outstanding, June 30, 2003 |
| 14,085,370 |
| $ | 0.73-147.90 |
|
Granted |
| 905,056 |
| 2.05-3.69 |
| |
Exercised |
| (110,068 | ) | 0.85-1.14 |
| |
Cancelled/Expired |
| (1,146,549 | ) | 0.85-119.60 |
| |
Balance outstanding, June 30, 2004 |
| 13,733,809 |
| $ | 0.73-147.90 |
|
Year ended December 31, 2005
During the year ended December 31, 2005, the Company declared a cash dividend of $1.30 per common share, all of which represented ordinary taxable income, and is comprised of the following quarterly dividends:
Cash |
| Quarter |
| Announcement |
| Ex-Dividend |
| Record |
| Payable |
$0.34 |
| December 31, 2005 |
| December 20, 2005 |
| December 28, 2005 |
| December 30, 2005 |
| January 9, 2006 |
$0.35 |
| September 30, 2005 |
| October 18, 2005 |
| October 26, 2005 |
| October 28, 2005 |
| November 7, 2005 |
$0.34 |
| June 30, 2005 |
| July 19, 2005 |
| July 26, 2005 |
| July 28, 2005 |
| August 8, 2005 |
$0.27 |
| March 31, 2005 |
| April 19, 2005 |
| April 27, 2005 |
| April 29, 2005 |
| May 9, 2005 |
F-34
AAMES INVESTMENT CORPORATION AND SUBSIDIARIES
NOTES TO CONSOLIDATED FINANCIAL STATEMENTS (Continued)
Six Months ended December 31, 2004
The following table summarizes the capital raising transactions consummated by Aames Investment during the six months ended December 31, 2004 (in thousands):
|
| Common |
| Price |
| Proceeds |
| ||||
Initial public offering |
|
| 35,000 |
|
| $ | 8.50 |
| $ | 297,500 |
|
Concurrent private placement |
|
| 5,000 |
|
| 8.50 |
| 42,500 |
| ||
Overallotment |
|
| 5,250 |
|
| 8.50 |
| 44,625 |
| ||
|
|
|
|
|
|
|
| 384,625 |
| ||
Underwriters' discount and expenses |
|
|
|
|
|
|
| (31,072 | ) | ||
Proceeds |
|
|
|
|
|
|
| 353,553 |
| ||
Cash component of merger consideration paid to former Aames Financial stockholders |
|
|
|
|
|
|
| (116,004 | ) | ||
Net proceeds for general corporate purposes |
|
|
|
|
|
|
| $ | 237,549 |
| |
On December 21, 2004, the Company declared a cash dividend of $0.06 per common share, payable on January 31, 2005 to stockholders of record at December 31, 2004. The dividend represented ordinary taxable income of approximately $0.052 per share and return of capital of approximately $0.008 per share.
Year ended June 30, 2004
During the year ended June 30, 2004, Aames Financial issued 123,000 shares of its Common Stock through the exercise of common stock options and received $0.2 million. During the year ended June 30, 2004 pursuant to a separation agreement, Aames Financial forgave $0.2 million principal balance outstanding on a note receivable from a former executive officer and cancelled the 30,000 Series C Convertible Preferred Shares which previously collateralized the obligation to Aames Financial.
On September 16, 2003, Aames Financial amended and restated its certificate of incorporation permitting it to issue up to 26.7 million shares of a new series of preferred stock, Series E Preferred Stock, par value $0.001 per share. At the same time, Aames Financial amended and restated its certificate of incorporation pursuant to which the number of authorized shares of Series C Convertible Preferred Stock was reduced to 34.5 million shares from 61.2 million shares. The Series E Preferred Stock was not convertible into any other security, was not entitled to receive dividends, ranked pari passu with Aames Financial’s other series of Preferred Stock and had a liquidation preference of $1.00 per share. Subsequently, on September 18, 2003, Aames Financial adopted its 2003 Series E Preferred Stock Option Plan, pursuant to which it issued to certain directors and executive officers options to purchase up to 22.2 million shares of Series E Preferred Stock.
During the year ended June 30, 2004, Aames Financial paid $64.3 million of dividends to holders of its Series B, C and D Convertible Preferred Stock, of which $62.2 million was paid to Capital Z.
Note 21. Transactions Involving Directors, Officers and Affiliates
During the year ended December 31, 2005, the Company paid $14.2 million in dividends to Specialty Finance Partners. During the year ended December 31, 2005, the Company paid dividends of $20,500 and $16,800 to Capital Z and Equifin, respectively, that related to unvested and unconverted RSAs and RSUs.
F-35
AAMES INVESTMENT CORPORATION AND SUBSIDIARIES
NOTES TO CONSOLIDATED FINANCIAL STATEMENTS (Continued)
Aames Financial had a management advisory agreement with Equifin Capital Management, LLC (“Equifin”), a company whose three principal officers previously served as directors of Aames Financial and of which one has continued as a director of Aames Investment. Terms of the agreement called for quarterly remittances of $250,000, plus out of pocket expenses, and expired at the earlier of February 10, 2009 or when either Aames Financial or Equifin mutually agreed to terminate the agreement. During the six months ended December 31, 2004, Aames Financial paid $1.4 million to Equifin pursuant to the agreement, of which $1.0 million was paid in November 2004 representing Aames Financial’s and Equifin’s agreement to sever the management services agreement at a mutually agreed upon discounted annual amount. During the years ended June 30, 2004 and 2003, the Company incurred management fees and out-of-pocket expenses in the amount of $1.1 million and $1.4 million, respectively, relating to advisory services rendered by Equifin.
Of the $4.0 million and $64.3 million of dividends paid to holders of its Series B, C and D Convertible Preferred Stock during the six months ended December 31, 2004 and the year ended June 30, 2004, respectively, $3.8 million and $62.2 million, respectively, were paid to Capital Z.
During the year ended June 30, 2003, the Company paid a $500,000 fee to Capital Z for Capital Z’s agreement to act as the limited guarantor on the Company’s Financing Facility. Commencing July 1, 2003 and until November 17, 2003, when the limited guaranty amount was fully reduced and Capital Z’s limited guarantee was extinguished, the Company paid Capital Z an additional $0.6 million to Capital Z based upon a percentage applied to the outstanding limited guaranty amount. During the six months ended December 31, 2004, the Company reimbursed Capital Z $66,000 for out-of-pocket expenses. The Company did not reimburse Capital Z for any out-of-pocket expenses during the year ended June 30, 2004. During the year ended June 30, 2003, the Company reimbursed Capital Z $40,000 for out-of-pocket expenses.
On March 31, 2003, the Residual Forward Sale Facility (the “Residual Facility”) with CZI expired. In connection with obtaining the Residual Facility, the Company paid and capitalized a facility fee of $3.0 million to CZI. Other costs capitalized in connection with obtaining the Residual Facility were $300,000. These capitalized costs were amortized to gain on sale of loans based upon the ratio of the dollar amount of the residual interests sold to CZI under the Residual Facility to the total Residual Facility amount. During the year ended June 30, 2003, amortization charged to gain on sale of loans was $0.8 million, of which $0.7 million related to the facility fee paid to CZI. At June 30, 2003, there were no remaining unamortized costs relating to the Residual Facility.
During the year ended June 30, 2003, SFP received $16.6 million from Aames Financial for SFP’s portion of the mandatory sinking fund payment made on the 5.5% Convertible Subordinated Debentures due March 2012 (the “2012 Debentures”), and SFP forgave $25.0 million of the 2012 Debentures due from Aames Financial.
F-36
AAMES INVESTMENT CORPORATION AND SUBSIDIARIES
NOTES TO CONSOLIDATED FINANCIAL STATEMENTS (Continued)
Note 22. Basic and Diluted Net (Loss) Per Common Share
The following table sets forth information regarding basic and diluted net income (loss) per common share for the periods presented (in thousands, except per share data):
|
|
|
| Six Months |
|
|
| |||||||||||||
|
| Years Ended |
| Ended |
| Years Ended |
| |||||||||||||
|
| December 31, |
| December 31, |
| June 30, |
| |||||||||||||
|
| 2005 |
| 2004 |
| 2004 |
| 2004 |
| 2003 |
| |||||||||
|
|
|
| (unaudited) |
|
|
|
|
|
|
| |||||||||
Basic net income (loss) per common share: |
|
|
|
|
|
|
|
|
|
|
|
|
|
|
| |||||
Net income (loss) |
| $ | (6,231 | ) |
| $ | 41,785 |
|
|
| $ | (3,085 | ) |
| $ | 90,714 |
| $ | 29,166 |
|
Less: Accrued dividends on Series B, C, and D Convertible Preferred Stock |
| — |
|
| (9,700 | ) |
|
| — |
|
| (13,054 | ) | (13,469 | ) | |||||
Basic net income (loss) to common stockholders |
| $ | (6,231 | ) |
| $ | 32,085 |
|
|
| $ | (3,085 | ) |
| $ | 77,660 |
| $ | 15,697 |
|
Basic weighted average number of common shares outstanding |
| 62,517 |
|
| 61,316 |
|
|
| 61,322 |
|
| 7,049 |
| 6,558 |
| |||||
Basic net income (loss) per common share |
| $ | (0.10 | ) |
| $ | 0.52 |
|
|
| $ | (0.05 | ) |
| $ | 11.02 |
| $ | 2.39 |
|
Diluted net income (loss) per common share: |
|
|
|
|
|
|
|
|
|
|
|
|
|
|
| |||||
Basic net income (loss) to common stockholders |
| $ | (6,231 | ) |
| $ | 32,085 |
|
|
| $ | (3,085 | ) |
| $ | 77,660 |
| $ | 15,697 |
|
Plus: Accrued dividends on Series B, C, and D Convertible Preferred Stock |
| — |
|
| 9,700 |
|
|
| — |
|
| 13,054 |
| 13,469 |
| |||||
Plus: Interest on 5.5% Convertible Subordinated Debentures |
| — |
|
| — |
|
|
| — |
|
| 2,090 |
| — |
| |||||
Diluted net income (loss) to common stockholders |
| $ | (6,231 | ) |
| $ | 41,785 |
|
|
| $ | (3,085 | ) |
| $ | 92,804 |
| $ | 29,166 |
|
Basic weighted average number of common shares outstanding |
| 62,517 |
|
| 61,316 |
|
|
| 61,322 |
|
| 7,049 |
| 6,558 |
| |||||
Plus: Incremental shares from assumed conversions of: |
|
|
|
|
|
|
|
|
|
|
|
|
|
|
| |||||
Series B, C and D Convertible Preferred Stock |
| — |
|
| — |
|
|
| — |
|
| 85,439 |
| 85,547 |
| |||||
5.5% Convertible Subordinated Debentures |
| — |
|
| — |
|
|
| — |
|
| 824 |
| — |
| |||||
Restricted Stock Awards |
| — |
|
| 32 |
|
|
| — |
|
| — |
| — |
| |||||
Plus: Incremental shares from assumed exercises of: |
|
|
|
|
|
|
|
|
|
|
|
|
|
|
| |||||
Warrants |
| — |
|
| — |
|
|
| — |
|
| 3,495 |
| 1,288 |
| |||||
Common stock options |
| — |
|
| — |
|
|
| — |
|
| 7,557 |
| 2,660 |
| |||||
Diluted weighted average number of common shares outstanding |
| 62,517 |
|
| 61,348 |
|
|
| 61,322 |
|
| 104,364 |
| 96,053 |
| |||||
Diluted net income (loss) per common share |
| $ | (0.10 | ) |
| $ | 0.68 |
|
|
| $ | (0.05 | ) |
| $ | 0.89 |
| $ | 0.30 |
|
F-37
AAMES INVESTMENT CORPORATION AND SUBSIDIARIES
NOTES TO CONSOLIDATED FINANCIAL STATEMENTS (Continued)
The following table presents the components of interest income during the periods presented (in thousands):
|
|
|
| Six Months |
|
|
| |||||||||||||
|
| Years Ended |
| Ended |
| Years Ended |
| |||||||||||||
|
| December 31, |
| December 31, |
| June 30, |
| |||||||||||||
|
| 2005 |
| 2004 |
| 2004 |
| 2004 |
| 2003 |
| |||||||||
|
|
|
| (unaudited) |
|
|
|
|
|
|
| |||||||||
Interest earned on: |
|
|
|
|
|
|
|
|
|
|
|
|
|
|
| |||||
Loans held for investment |
| $ | 246,887 |
|
| $ | 15,957 |
|
|
| $ | 15,957 |
|
| $ | — |
| $ | — |
|
Loans held for sale |
| 44,208 |
|
| 75,288 |
|
|
| 39,435 |
|
| 64,824 |
| 52,411 |
| |||||
Overnight investments |
| 2,673 |
|
| 281 |
|
|
| 281 |
|
| — |
| — |
| |||||
Income from derivative financial instruments |
| 27,424 |
|
| 488 |
|
|
| 488 |
|
| — |
| — |
| |||||
Prepayment penalty fees on loans held for investment |
| 23,701 |
|
| 88 |
|
|
| — |
|
| — |
| — |
| |||||
Amortization of net deferred loan origination costs |
| (4,737 | ) |
| (200 | ) |
|
| (200 | ) |
| — |
| — |
| |||||
Discount accretion on residual interests |
| — |
|
| 972 |
|
|
| — |
|
| 4,357 |
| 16,558 |
| |||||
Other |
| 359 |
|
| 307 |
|
|
| 142 |
|
| 265 |
| 217 |
| |||||
Total interest income |
| $ | 340,515 |
|
| $ | 93,181 |
|
|
| $ | 56,103 |
|
| $ | 69,446 |
| $ | 69,186 |
|
The following table presents the components of interest expense during the periods presented (in thousands):
|
|
|
| Six Months |
|
|
| |||||||||||||
|
| Years Ended |
| Ended |
| Years Ended |
| |||||||||||||
|
| December 31, |
| December 31, |
| June 30, |
| |||||||||||||
|
| 2005 |
| 2004 |
| 2004 |
| 2004 |
| 2003 |
| |||||||||
|
|
|
| (unaudited) |
|
|
|
|
|
|
| |||||||||
Interest incurred on: |
|
|
|
|
|
|
|
|
|
|
|
|
|
|
| |||||
Financings on loans held for investment |
| $ | 112,809 |
|
| $ | 2,912 |
|
|
| $ | 2,912 |
|
| $ | — |
| $ | — |
|
Revolving warehouse and repurchase facilities |
| 47,246 |
|
| 24,753 |
|
|
| 15,777 |
|
| 15,823 |
| 13,796 |
| |||||
Borrowings |
| 128 |
|
| 4,135 |
|
|
| 2,011 |
|
| 4,986 |
| 16,190 |
| |||||
Amortization of commitment fees, debt issuance costs, and debt discount |
| 10,002 |
|
| 5,618 |
|
|
| 3,137 |
|
| 5,095 |
| 4,930 |
| |||||
Mark to market (gain) loss on interest rate cap agreements designed to hedge interest rate risk on financings of loans held for investment |
| 143 |
|
| (6,344 | ) |
|
| (6,344 | ) |
| — |
| — |
| |||||
Bank charges and other |
| 614 |
|
| 1,322 |
|
|
| 997 |
|
| 323 |
| 203 |
| |||||
Total interest expense |
| $ | 170,942 |
|
| $ | 32,396 |
|
|
| $ | 18,490 |
|
| $ | 26,227 |
| $ | 35,119 |
|
Production expense during the years ended December 31, 2005 and 2004 (unaudited), the six months ended December 31, 2004, and the years ended June 30, 2004 and 2003 included charges of $21.0 million, $19.8 million, $9.6 million, $18.8 million, and $14.2 million, respectively, of advertising expense.
F-38
AAMES INVESTMENT CORPORATION AND SUBSIDIARIES
NOTES TO CONSOLIDATED FINANCIAL STATEMENTS (Continued)
Note 26. Quarterly Financial Data (Unaudited)
The following tables present summaries of unaudited quarterly operating results for the periods indicated (in thousands, except per share amounts):
|
| Three Months Ended |
| ||||||||||||||
|
| March 31 |
| June 30 |
| September 30 |
| December 31 |
| ||||||||
Year Ended December 31, 2005 |
|
|
|
|
|
|
|
|
|
|
|
|
| ||||
Net interest income after provision for loan losses and noninterest income |
| $ | 41,959 |
| $ | 22,662 |
|
| $ | 63,977 |
|
|
| $ | 37,288 |
|
|
Noninterest expense |
| (41,960 | ) | (44,572 | ) |
| (43,353 | ) |
|
| (41,390 | ) |
| ||||
Income (loss) before income taxes |
| (1 | ) | (21,910 | ) |
| 20,624 |
|
|
| (4,102 | ) |
| ||||
Income tax provision (benefit) |
| 765 |
| 665 |
|
| (661 | ) |
|
| 73 |
|
| ||||
Net income (loss) |
| $ | (766 | ) | $ | (22,575 | ) |
| $ | 21,285 |
|
|
| $ | (4,175 | ) |
|
Diluted net income (loss) per common share |
| $ | (0.01 | ) | $ | (0.37 | ) |
| $ | 0.34 |
|
|
| $ | (0.07 | ) |
|
|
| Three Months Ended |
| ||||||||||||||
|
| March 31 |
| June 30 |
| September 30 |
| December 31 |
| ||||||||
Year Ended December 31, 2004 |
|
|
|
|
|
|
|
|
|
|
|
|
| ||||
Net interest income after provision for loan losses and noninterest income |
| $ | 67,853 |
| $ | 76,774 |
|
| $ | 65,820 |
|
|
| $ | 32,679 |
|
|
Noninterest expense |
| (47,056 | ) | (52,398 | ) |
| (42,675 | ) |
|
| (64,145 | ) |
| ||||
Income (loss) before income taxes |
| 20,797 |
| 24,376 |
|
| 23,145 |
|
|
| (31,466 | ) |
| ||||
Income tax provision (benefit) |
| (93 | ) | 395 |
|
| (5,272 | ) |
|
| 37 |
|
| ||||
Net income (loss) |
| $ | 20,890 |
| $ | 23,981 |
|
| $ | 28,417 |
|
|
| $ | (31,503 | ) |
|
Diluted net income (loss) per common share |
| $ | 0.20 |
| $ | 0.24 |
|
| $ | 0.28 |
|
|
| $ | (0.51 | ) |
|
F-39
AAMES INVESTMENT CORPORATION AND SUBSIDIARIES
NOTES TO CONSOLIDATED FINANCIAL STATEMENTS (Continued)
Note 27. Parent Company Only Condensed Financial Statements
The following tables present the parent company only condensed financial statements of Aames Investment Corporation for the periods indicated (in thousands):
|
| December 31, |
| ||||||
Condensed Balance Sheets |
|
|
| 2005 |
| 2004 |
| ||
Cash and cash equivalents: |
|
|
|
|
| ||||
Unrestricted |
| $ | 13,042 |
| $ | 7,206 |
| ||
Restricted |
| 87,094 |
| 6,139 |
| ||||
Loans held for investment, net: |
|
|
|
|
| ||||
Securitized |
| 3,659,657 |
| 1,187,435 |
| ||||
Not yet securitized |
| 461,451 |
| 531,261 |
| ||||
Net deferred loan origination costs |
| 7,787 |
| 8,250 |
| ||||
Deferred loan acquisition premium |
| 41,132 |
| 29,226 |
| ||||
Allowance for loan losses |
| (43,359 | ) | (1,900 | ) | ||||
Total loans held for investment, net |
| 4,126,668 |
| 1,754,272 |
| ||||
Investment in subsidiaries |
| 78,697 |
| 149,028 |
| ||||
Accrued interest and other |
| 57,480 |
| 24,208 |
| ||||
Derivative finanancial instruments, at estimated fair value |
| 58,147 |
| 31,947 |
| ||||
Total assets |
| $ | 4,421,128 |
| $ | 1,972,800 |
| ||
Financings on loans held for investment |
| $ | 3,623,188 |
| $ | 1,157,470 |
| ||
Revolving warehouse and repurchase facilities |
| 433,241 |
| 409,199 |
| ||||
Retained bond financing |
| 16,487 |
| — |
| ||||
Other liabilities |
| 37,577 |
| 19,279 |
| ||||
Total liabilities |
| 4,110,493 |
| 1,585,948 |
| ||||
Stockholders’ equity |
| 310,635 |
| 386,852 |
| ||||
Total liabilities and stockholders’ equity |
| $ | 4,421,128 |
| $ | 1,972,800 |
| ||
&# 160;
|
| Year Ended |
| |||||
|
| December 31, |
| |||||
Condensed Statement of Operations |
|
|
| 2005 |
| |||
Net interest income |
|
| $ | 113,270 |
|
| ||
Provision for losses on loans held for investment |
|
| (40,294 | ) |
| |||
Net interest income after provision for loan losses |
|
| 72,976 |
|
| |||
Noninterest expense |
|
| (8,784 | ) |
| |||
Income before equity in net loss of subsidiary |
|
| 64,192 |
|
| |||
Equity in net loss of subsidiary |
|
| (58,518 | ) |
| |||
Net income |
|
| $ | 5,674 |
|
| ||
F-40
AAMES INVESTMENT CORPORATION AND SUBSIDIARIES
NOTES TO CONSOLIDATED FINANCIAL STATEMENTS (Continued)
|
| Year Ended |
| |||
|
| December 31, |
| |||
Statement of Cash Flows |
|
|
| 2005 |
| |
Cash flows from operating activities: |
|
|
| |||
Net income |
| $ | 5,674 |
| ||
Adjustments to reconcile net income to net cash provided by (used in) operating activities: |
|
|
| |||
Equity in net loss of subsidiary |
| 58,518 |
| |||
Provision for losses on loans held for investment |
| 40,294 |
| |||
Stock-based compensation |
| 2,264 |
| |||
Mark-to-market loss on derivative financial instruments |
| 143 |
| |||
Increase in: |
|
|
| |||
Accrued interest and other |
| (24,272 | ) | |||
Derivative financial instruments |
| (26,343 | ) | |||
Increase in: |
|
|
| |||
Accounts payable and accrued expenses |
| (1,132 | ) | |||
Net cash provided by operating activities |
| 55,146 |
| |||
Cash flows from investing activities: |
|
|
| |||
Loans held for investment |
| (2,412,690 | ) | |||
Net change in investment in subsidiaries |
| 11,812 |
| |||
Net change in intercompany receivables and payables |
| (9,000 | ) | |||
Net cash used in investing activities |
| (2,409,878 | ) | |||
Cash flows from financing activities: |
|
|
| |||
Financing on loans held for investment |
| 2,465,718 |
| |||
Net increase in revolving warehouse and repurchase facilities |
| 24,042 |
| |||
Proceeds from borrowings |
| 16,487 |
| |||
Payment of common stock dividends |
| (64,696 | ) | |||
Payment of equity issuance expenses |
| (28 | ) | |||
Net cash provided by financing activities |
| 2,441,523 |
| |||
Net increase in cash and cash equivalents |
| 86,791 |
| |||
Cash and cash equivalents, beginning of period |
| 13,345 |
| |||
Cash and cash equivalents, end of period |
| $ | 100,136 |
| ||
Supplemental disclosure: |
|
|
| |||
Interest paid |
| $ | 219,747 |
| ||
F-41