Exhibit 99.2
Link to searchable text of slide shown above
Link to searchable text of slide shown above

Link to searchable text of slide shown above
Link to searchable text of slide shown above
Link to searchable text of slide shown above
Link to searchable text of slide shown above
Link to searchable text of slide shown above
Link to searchable text of slide shown above
Link to searchable text of slide shown above
Link to searchable text of slide shown above
Link to searchable text of slide shown above
Link to searchable text of slide shown above
Link to searchable text of slide shown above
Link to searchable text of slide shown above

Link to searchable text of slide shown above
Link to searchable text of slide shown above
Link to searchable text of slide shown above
Link to searchable text of slide shown above
Link to searchable text of slide shown above
Link to searchable text of slide shown above
Searchable text section of graphics shown above

Investment Corporation
Fourth Quarter 2005 Results
& Conference Call
March 27, 2006

Forward-looking Statements
This presentation may contain forward-looking statements under federal securities laws. These statements are based on management’s current expectations and beliefs and are subject to a number of trends and uncertainties that could cause a actual results to differ materially from those described in the forward-looking statements. The risks and uncertainties that may cause our performance and results to vary include:(i) limited cash flow to fund operations and dependence on short-term financing facilities; (ii) changes in overall economic conditions and interest rates; (iii) increased delinquency rates in the portfolio; (iv) intense competition in the mortgage lending industry; (v) adverse changes in the securitization and whole loan market for mortgage loans; (vi) declines in real estate values; (vii) an inability to originate subprime hybrid/adjustable mortgage loans; (viii) obligations to repurchase mortgage loans and indemnify investors; (ix) concentration of operations in California, Florida, New York and Texas and the adverse impact of natural disasters (including Hurricanes Katrina, Rita and Wilma); (x) extensive government regulation; and (xi) an inability to comply with the federal tax requirements applicable to REITs and effectively operate within limitations imposed on REITs by federal tax rules. .
![]()
2
4th Quarter Overview
• Clean up quarter to dispose of lower value loans
• Retention of higher value loans for portfolio
• Began to see sustained rate increases on coupons
• Strategic corporate reorganization - Capital key to earnings growth
• Continued downward pressure on whole loan premiums require even greater efficiency
3
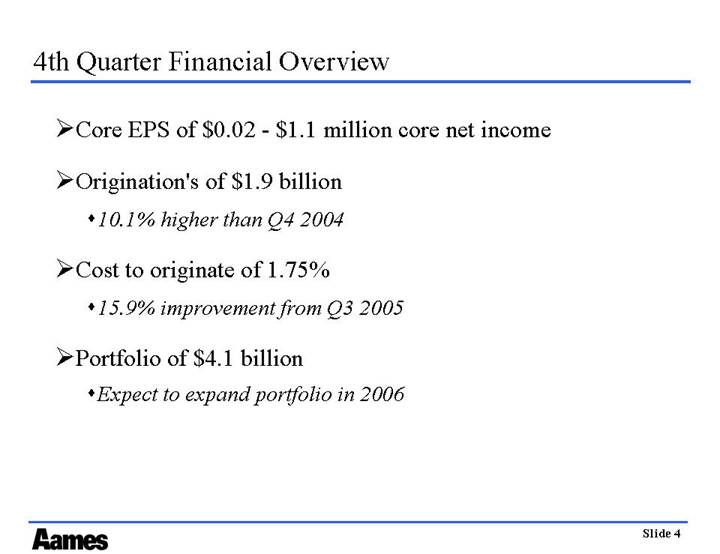
4th Quarter Financial Overview
• Core EPS of $0.02 -$1.1 million core net income
• Origination’s of $1.9 billion
• 10.1% higher than Q4 2004
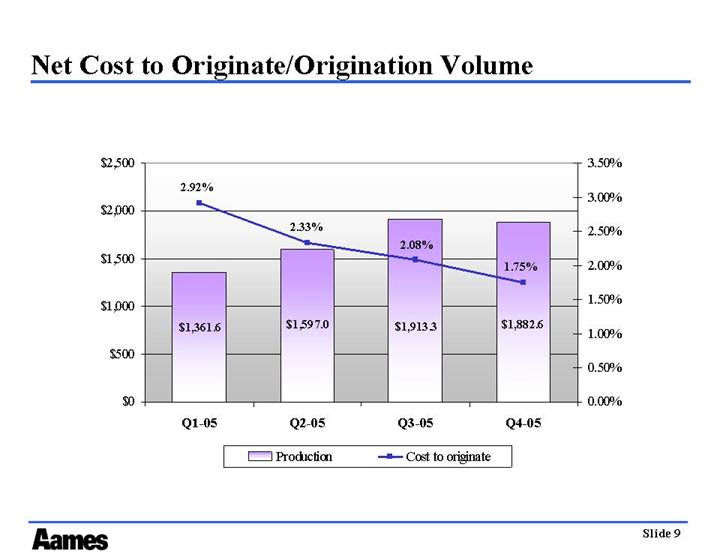
• Cost to originate of 1.75%
• 15.9% improvement from Q3 2005
• Portfolio of $4.1 billion
• Expect to expand portfolio in 2006
4
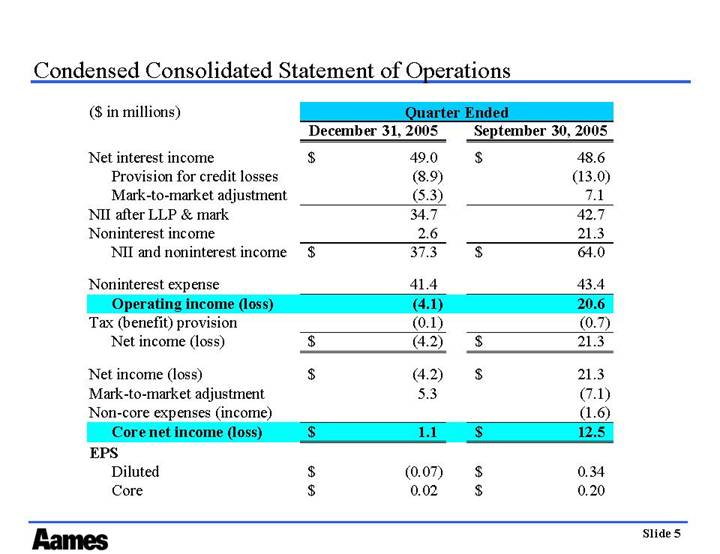
Condensed Consolidated Statement of Operations
|
| Quarter Ended |
| ||||
($ in millions) |
| December 31, 2005 |
| September 30, 2005 |
| ||
Net interest income |
| $ | 49.0 |
| $ | 48.6 |
|
Provision for credit losses |
| (8.9 | ) | (13.0 | ) | ||
Mark-to-market adjustment |
| (5.3 | ) | 7.1 |
| ||
NII after LLP & mark |
| 34.7 |
| 42.7 |
| ||
Noninterest income |
| 2.6 |
| 21.3 |
| ||
NII and noninterest income |
| $ | 37.3 |
| $ | 64.0 |
|
|
|
|
|
|
| ||
Noninterest expense |
| 41.4 |
| 43.4 |
| ||
Operating income (loss) |
| (4.1 | ) | 20.6 |
| ||
Tax (benefit) provision |
| (0.1 | ) | (0.7 | ) | ||
Net income (loss) |
| $ | (4.2 | ) | $ | 21.3 |
|
|
|
|
|
|
| ||
Net income (loss) |
| $ | (4.2 | ) | $ | 21.3 |
|
Mark-to-market adjustment |
| 5.3 |
| (7.1 | ) | ||
Non-core expenses (income) |
|
|
| (1.6 | ) | ||
Core net income (loss) |
| $ | 1.1 |
| $ | 12.5 |
|
EPS |
|
|
|
|
| ||
Diluted |
| $ | (0.07 | ) | $ | 0.34 |
|
Core |
| $ | 0.02 |
| $ | 0.20 |
|
5
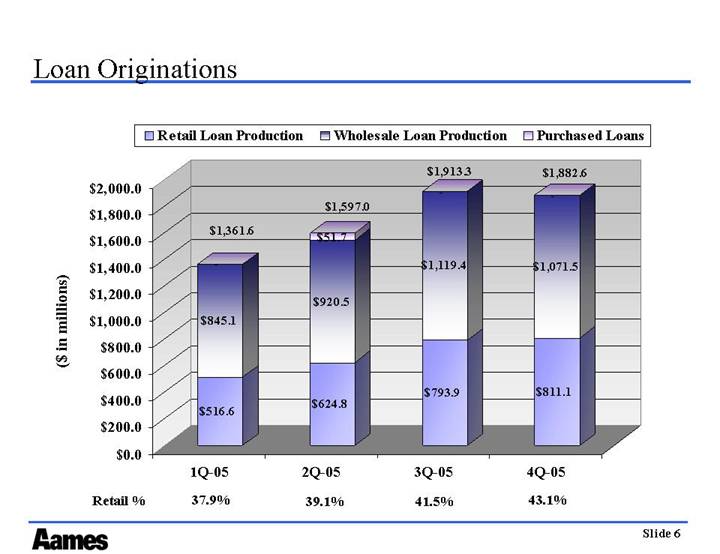
Loan Originations
[CHART]
6
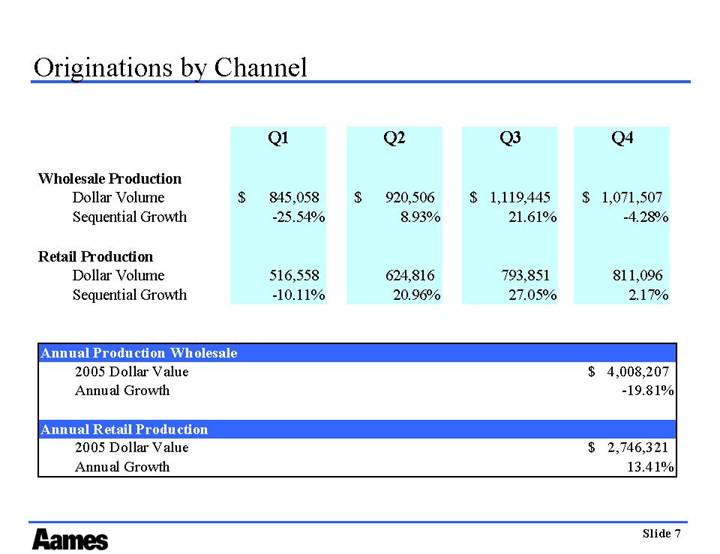
Originations by Channel
|
| Q1 |
| Q2 |
| Q3 |
| Q4 |
| ||||
|
|
|
|
|
|
|
|
|
| ||||
Wholesale Production |
|
|
|
|
|
|
|
|
| ||||
Dollar Volume |
| $ | 845,058 |
| $ | 920,506 |
| $ | 1,119,445 |
| $ | 1,071,507 |
|
Sequential Growth |
| -25.54 | % | 8.93 | % | 21.61 | % | -4.28 | % | ||||
|
|
|
|
|
|
|
|
|
| ||||
Retail Production |
|
|
|
|
|
|
|
|
| ||||
Dollar Volume |
| 516,558 |
| 624,816 |
| 793,851 |
| 811,096 |
| ||||
Sequential Growth |
| -10.11 | % | 20.96 | % | 27.05 | % | 2.17 | % | ||||
Annual Production Wholesale |
|
|
| |
2005 Dollar Value |
| $ | 4,008,207 |
|
Annual Growth |
| -19.81 | % | |
|
|
|
| |
Annual Retail Production |
|
|
| |
2005 Dollar Value |
| $ | 2,746,321 |
|
Annual Growth |
| 13.41 | % | |
7
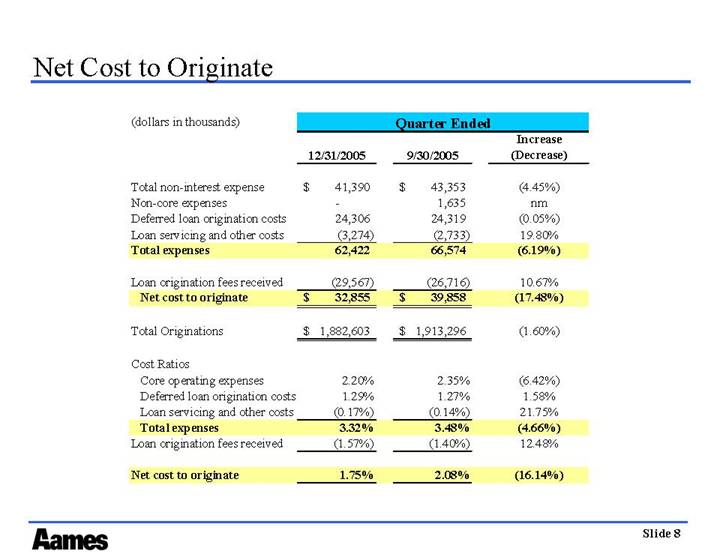
Net Cost to Originate
|
| Quarter Ended |
| ||||||
(dollars in thousands) |
| 12/31/2005 |
| 9/30/2005 |
| Increase |
| ||
|
|
|
|
|
|
|
| ||
Total non-interest expense |
| $ | 41,390 |
| $ | 43,353 |
| (4.45 | )% |
Non-core expenses |
| — |
| 1,635 |
| nm |
| ||
Deferred loan origination costs |
| 24,306 |
| 24,319 |
| (0.05 | )% | ||
Loan servicing and other costs |
| (3,274 | ) | (2,733 | ) | 19.80 | % | ||
Total expenses |
| 62,422 |
| 66,574 |
| (6.19 | )% | ||
|
|
|
|
|
|
|
| ||
Loan origination fees received |
| (29,567 | ) | (26,716 | ) | 10.67 | % | ||
Net cost to originate |
| $ | 32,855 |
| $ | 39,858 |
| (17.48 | )% |
|
|
|
|
|
|
|
| ||
Total Originations |
| $ | 1,882,603 |
| $ | 1,913,296 |
| (1.60 | )% |
|
|
|
|
|
|
|
| ||
Cost Ratios |
|
|
|
|
|
|
| ||
Core operating expenses |
| 2.20 | % | 2.35 | % | (6.42 | )% | ||
Deferred loan origination costs |
| 1.29 | % | 1.27 | % | 1.58 | % | ||
Loan servicing and other costs |
| (0.17 | )% | (0.14 | )% | 21.75 | % | ||
Total expenses |
| 3.32 | % | 3.48 | % | (4.66 | )% | ||
Loan origination fees received |
| (1.57 | )% | (1.40 | )% | 12.48 | % | ||
|
|
|
|
|
|
|
| ||
Net cost to originate |
| 1.75 | % | 2.08 | % | (16.14 | )% | ||
8
Net Cost to Originate/Origination Volume
[CHART]
9
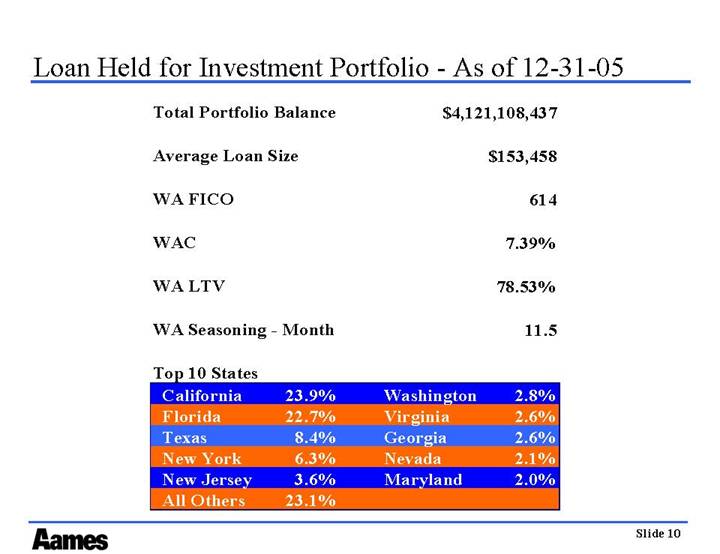
Loan Held for Investment Portfolio - - As of 12-31-05
Total Portfolio Balance |
| $ | 4,121,108,437 |
|
|
|
|
| |
Average Loan Size |
| $ | 153,458 |
|
|
|
|
| |
WA FICO |
| 614 |
| |
|
|
|
| |
WAC |
| 7.39 | % | |
|
|
|
| |
WA LTV |
| 78.53 | % | |
|
|
|
| |
WA Seasoning - Month |
| 11.5 |
| |
Top 10 States |
|
|
|
California |
| 23.9 | % |
Florida |
| 22.7 | % |
Texas |
| 8.4 | % |
New York |
| 6.3 | % |
New Jersey |
| 3.6 | % |
All Others |
| 23.1 | % |
Washington |
| 2.8 | % |
Virginia |
| 2.6 | % |
Georgia |
| 2.6 | % |
Nevada |
| 2.1 | % |
Maryland |
| 2.0 | % |
10
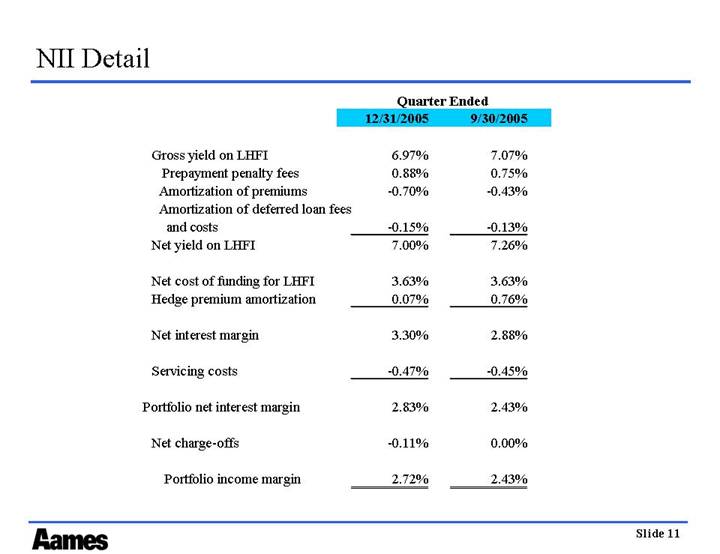
NII Detail
|
| Quarter Ended |
| ||
|
| 12/31/2005 |
| 9/30/2005 |
|
|
|
|
|
|
|
Gross yield on LHFI |
| 6.97 | % | 7.07 | % |
Prepayment penalty fees |
| 0.88 | % | 0.75 | % |
Amortization of premiums |
| -0.70 | % | -0.43 | % |
Amortization of deferred loan fees and costs |
| -0.15 | % | -0.13 | % |
Net yield on LHFI |
| 7.00 | % | 7.26 | % |
|
|
|
|
|
|
Net cost of funding for LHFI |
| 3.63 | % | 3.63 | % |
Hedge premium amortization |
| 0.07 | % | 0.76 | % |
|
|
|
|
|
|
Net interest margin |
| 3.30 | % | 2.88 | % |
|
|
|
|
|
|
Servicing costs |
| -0.47 | % | -0.45 | % |
|
|
|
|
|
|
Portfolio net interest margin |
| 2.83 | % | 2.43 | % |
|
|
|
|
|
|
Net charge-offs |
| -0.11 | % | 0.00 | % |
|
|
|
|
|
|
Portfolio income margin |
| 2.72 | % | 2.43 | % |
11
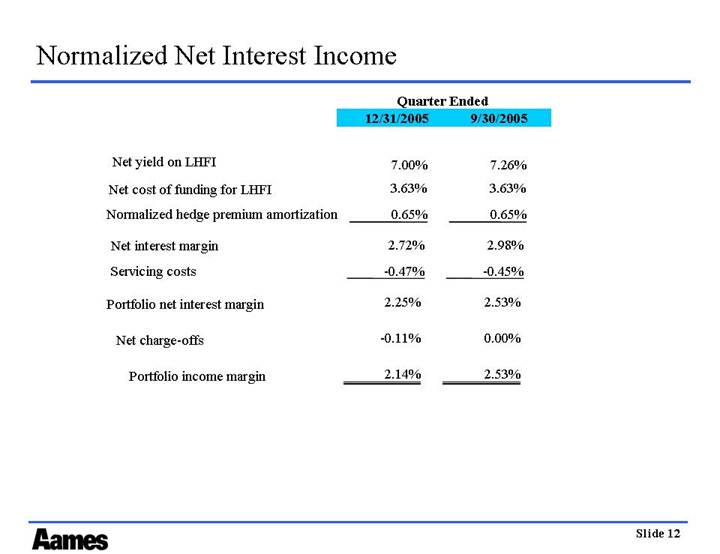
Normalized Net Interest Income
|
| Quarter Ended |
| ||
|
| 12/31/2005 |
| 9/30/2005 |
|
|
|
|
|
|
|
Net yield on LHFI |
| 7.00 | % | 7.26 | % |
|
|
|
|
|
|
Net cost of funding for LHFI |
| 3.63 | % | 3.63 | % |
|
|
|
|
|
|
Normalized hedge premium amortization |
| 0.65 | % | 0.65 | % |
|
|
|
|
|
|
Net interest margin |
| 2.72 | % | 2.98 | % |
|
|
|
|
|
|
Servicing costs |
| -0.47 | % | -0.45 | % |
|
|
|
|
|
|
Portfolio net interest margin |
| 2.25 | % | 2.53 | % |
|
|
|
|
|
|
Net charge-offs |
| -0.11 | % | 0.00 | % |
|
|
|
|
|
|
Portfolio income margin |
| 2.14 | % | 2.53 | % |
12
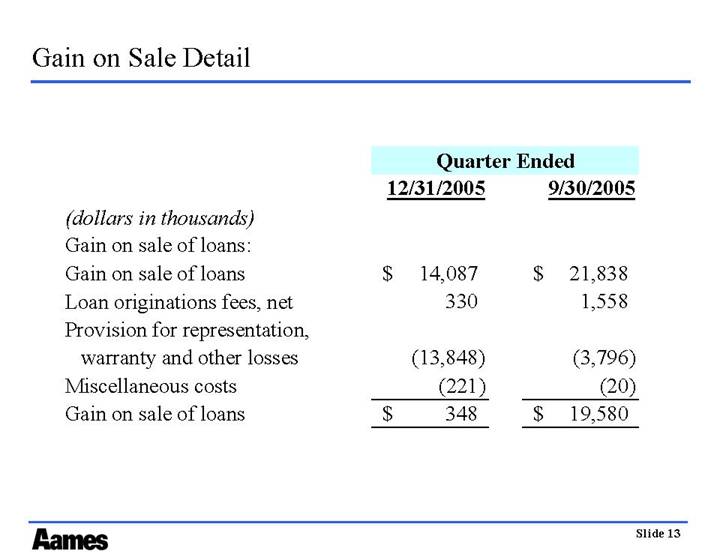
Gain on Sale Detail
|
| Quarter Ended |
| ||||
(dollars in thousands) |
| 12/31/2005 |
| 9/30/2005 |
| ||
|
|
|
|
|
| ||
Gain on sale of loans: |
|
|
|
|
| ||
Gain on sale of loans |
| $ | 14,087 |
| $ | 21,838 |
|
Loan originations fees, net |
| 330 |
| 1,558 |
| ||
Provision for representation, warranty and other losses |
| (13,848 | ) | (3,796 | ) | ||
Miscellaneous costs |
| (221 | ) | (20 | ) | ||
Gain on sale of loans |
| $ | 348 |
| $ | 19,580 |
|
13
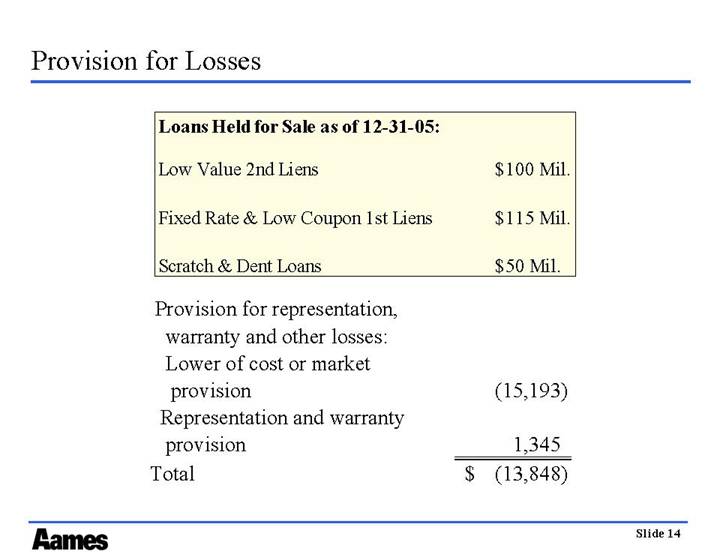
Provision for Losses
Loans Held for Sale as of 12-31-05: |
|
|
| |
|
|
|
| |
Low Value 2nd Liens |
| $ | 100 | Mil. |
|
|
|
| |
Fixed Rate & Low Coupon 1st Liens |
| $ | 115 | Mil. |
|
|
|
| |
Scratch & Dent Loans |
| $ | 50 | Mil. |
|
|
|
| |
Provision for representation, warranty and other losses: |
|
|
| |
Lower of cost or market provision |
| (15,193 | ) | |
Representation and warranty provision |
| 1,345 |
| |
Total |
| $ | (13,848 | ) |
14
Condensed Consolidated Balance Sheet
|
| Condensed Balance Sheet |
| ||||
(In millions) |
| December 31, 2005 |
| September 30, 2005 |
| ||
|
|
|
|
|
| ||
Assets |
|
|
|
|
| ||
Unrestricted cash |
| $ | 36.1 |
| $ | 43.2 |
|
Restricted cash |
| 87.1 |
| 91.4 |
| ||
Loans held for sale, at lower of cost or market |
| 951.2 |
| 632.5 |
| ||
Loans held for investment, net |
| 4,085.5 |
| 4,187.1 |
| ||
Residual interests, at estimated fair value |
| — |
| — |
| ||
Derivative instruments, at estimated fair value |
| 58.1 |
| 63.4 |
| ||
Fixed and other assets |
| 109.6 |
| 108.8 |
| ||
Total assets |
| $ | 5,327.6 |
| $ | 5,126.4 |
|
|
|
|
|
|
| ||
Liabilities and Stockholders’ Equity |
|
|
|
|
| ||
Non-warehouse debt |
| $ | 16.5 |
| $ | — |
|
ABS financing |
| 3,623.2 |
| 4,137.8 |
| ||
Warehouse facilities |
| 1,341.7 |
| 596.4 |
| ||
Accounts payable and accrued liabilities |
| 76.8 |
| 75.5 |
| ||
Total liabilities |
| $ | 5,058.1 |
| $ | 4,809.7 |
|
|
|
|
|
|
| ||
Stockholders’ equity |
| 269.5 |
| 316.7 |
| ||
Total liabilities and stockholders’ equity |
| $ | 5,327.6 |
| $ | 5,126.4 |
|
|
|
|
|
|
| ||
Book Value per share |
| $ | 4.36 |
|
|
| |
15
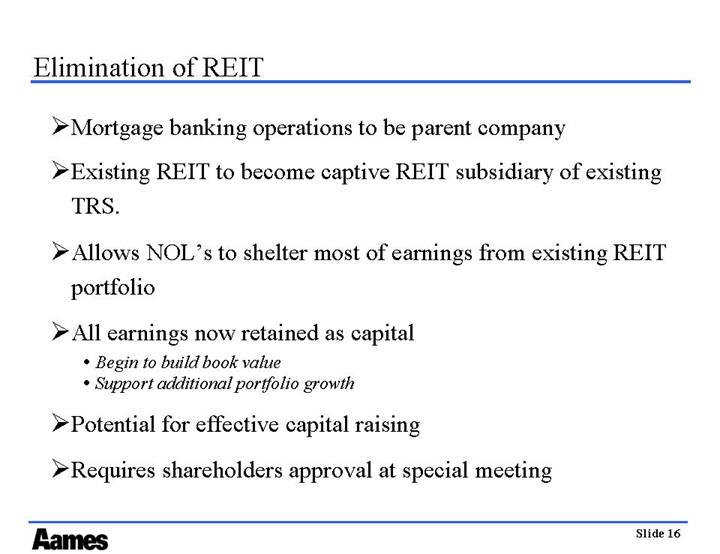
Elimination of REIT
• Mortgage banking operations to be parent company
• Existing REIT to become captive REIT subsidiary of existing TRS.
• Allows NOL’s to shelter most of earnings from existing REIT portfolio
• All earnings now retained as capital
• Begin to build book value
• Support additional portfolio growth
• Potential for effective capital raising
• Requires shareholders approval at special meeting
16
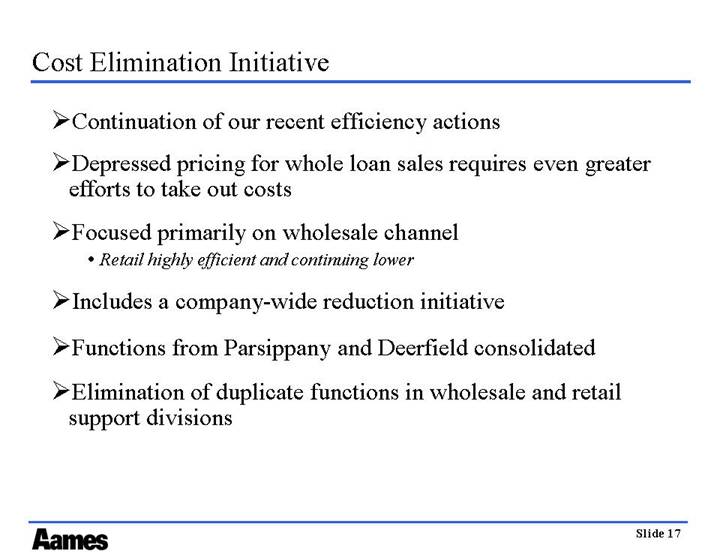
Cost Elimination Initiative
• Continuation of our recent efficiency actions
• Depressed pricing for whole loan sales requires even greater efforts to take out costs
• Focused primarily on wholesale channel
• Retail highly efficient and continuing lower
• Includes a company-wide reduction initiative
• Functions from Parsippany and Deerfield consolidated
• Elimination of duplicate functions in wholesale and retail support divisions
17
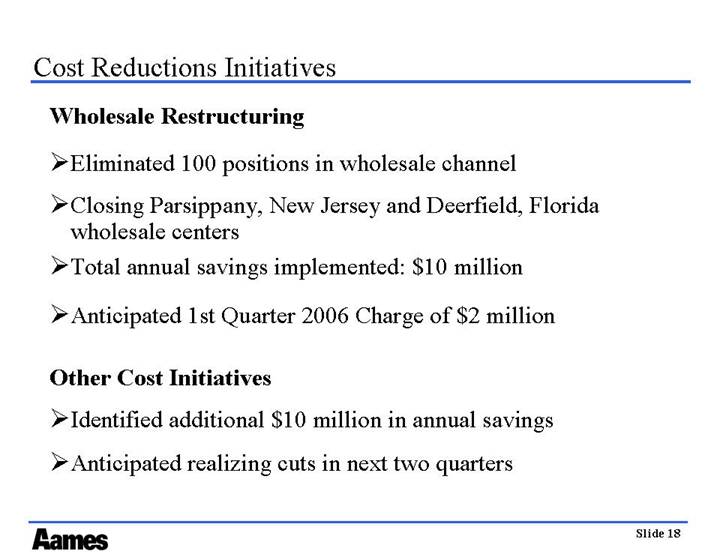
Cost Reductions Initiatives
Wholesale Restructuring
• Eliminated 100 positions in wholesale channel
• Closing Parsippany, New Jersey and Deerfield, Florida wholesale centers
• Total annual savings implemented: $10 million
• Anticipated 1st Quarter 2006 Charge of $2 million
Other Cost Initiatives
• Identified additional $10 million in annual savings
• Anticipated realizing cuts in next two quarters
18
Leverage Target
• Will increase leverage target temporarily
• Retained earnings will reduce leverage ratio over time
• Anticipated growth of loan portfolio
• Captive REIT may be used to raise REIT preferred stock to support portfolio
• Longer term leverage target higher as a C Corp than as a REIT
• Investment Portfolio/Equity
19
Summary
• 4th quarter cleaned up carried over loans held for sale
• Retained higher value loans to add to portfolio
• Addressing market challenges through cost reduction initiatives and corporate reorganization
• C Corp status will retain capital and support portfolio growth
• Focused on lowered cost to originate and higher portfolio earnings
20