EXHIBIT 99.2
Investment Corporation
First Quarter Results & Conference Call May 10, 2005
Forward-looking Statements
This presentation laws -looking forward . may contain - statements under federal securities . These statements are based on management’s current expectations and beliefs and are subject to a a number of trends and uncertainties that could cause actual results to differ materially from those-forward statements . looking described in the - . The risks and uncertainties that may cause our performance and results to vary include: (i) changes in overall economic conditions and interest rates; (ii) an inability to originate subprime hybrid/adjustable mortgage loans; (iii) increased delinquency rates in our portfolio; (iv) adverse changes in the securitization and whole loan market for mortgage loans; (v) declines in real estate values; (vi) limited cash flow to fund operations and dependence on short—term financing facilities; (vii) concentration - of operations in California, Florida, New York and Texas; (viii) extensive government regulation; (ix) intense competition in the mortgage lending industry; and (x) an inability to comply with the federal tax requirements applicable to REITs and effectively operate within limitations imposed on REITs by federal tax rules For a a more complete discussion of these risks and uncertainties and information relating to the company, see the Form 10—K for the year - ended December 31, 2004 and other filings with the SEC made by the company pursuant to the Securities Exchange Act of 1934 Aames Investment expressly disclaims any obligation to update or revise any forward—looking statements in this presentation -
[Graphic]
Slide 2 2

1st Quarter 2005 Highlights
Grew REIT loan portfolio to $2.9 billion
Closed $1.2 billion securitization
100% core hybrid product
Paid first full quarter dividend on May 9th
$0.27 per share
Core EPS loss per share of $0.17; GAAP diluted EPS loss of $0.01
$1.4 billion in loan production
[Graphic]
Slide 3 3
2005 Strategic Initiatives Update
Value focused production
Focused on long-term ROA from REIT portfolio
Reduce overall cost structure
Address competitive pressures through greater efficiencies
Leverage technology
Completed Retail Branch rationalization strategy
Continue to expand sales platform and productivity
Maximize benefits from in-house servicing
[Graphic]
Slide 4 4
Operating Overview
[Graphic]
Slide 5 5
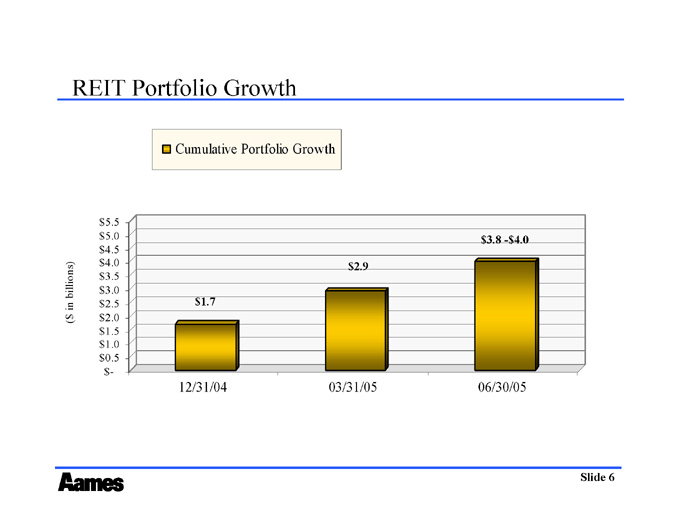
REIT Portfolio Growth
Cumulative Portfolio Growth
($in billions)
$5.5 $5.0 $4.5 $4.0 $3.5 $3.0 $2.5 $2.0 $1.5 $1.0 $0.5 $-
$1.7 $2.9 $3.8 - $4.0
12/31/04 03/31/05 06/30/05
[Graphic]
Slide 6 6
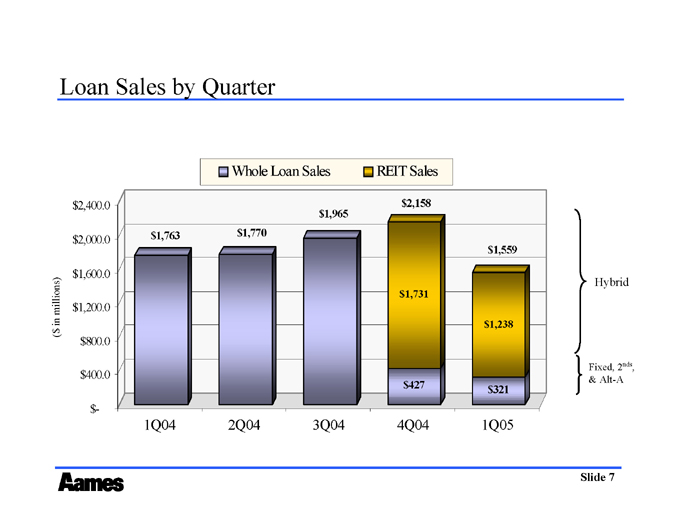
Loan Sales by Quarter
Whole Loan Sales REIT Sales
($in millions)
$2,400 $02,000 $1,600 $1,200 $800 $400 $-
$2,158 $1,559
$1,731 $1,238
$1,763 $1,770 $1,965 $427 $321
1Q04 2Q04 3Q04 4Q04 1Q05
Hybrid
Fixed, 2nds, & Alt-A
[Graphic]
Slide 7 7
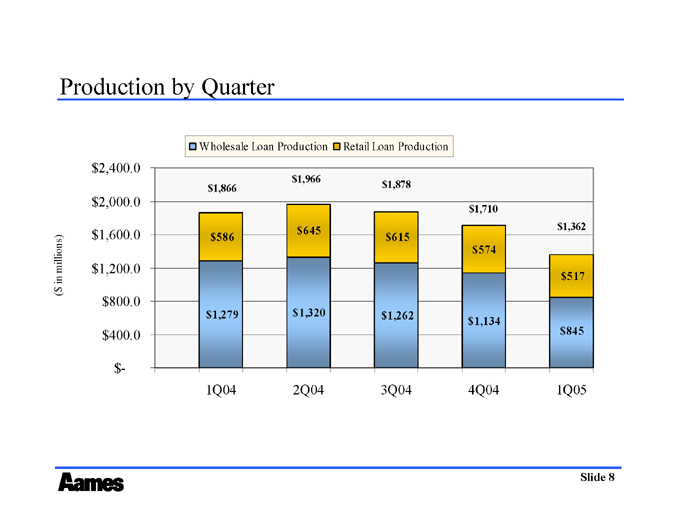
Production by Quarter
Wholesale Loan Production Retail Loan Production
($ in millions)
$2,400 $2,000 $1,600 $1,200 $800 $400 $-
$1,866 $1,966 $1,878 $1,710 $1,362
$586 $645 $615 $574 $517
$1,279 $1,320 $1,262 $1,134 $845
1Q04 2Q04 3Q04 4Q04 1Q05
[Graphic]
Slide 8 8
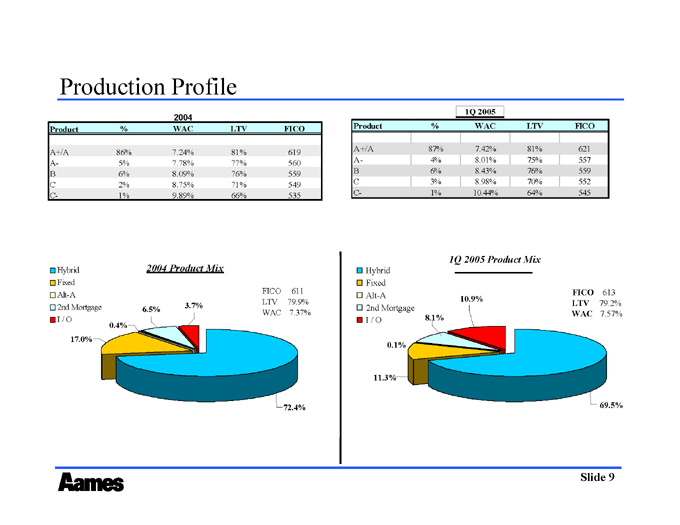
Production Profile
2004
Product %% WAC LTV FICO
A+/A 86% 7.7.24% 81% 619
A- 5%5% 7.7.78% 77% 560
B 6%6% 8.8.09% 76% 559
C 2%2% 8.8.75% 71% 549
C- 1%1% 9.9.89% 66% 535
1Q 2005
Product % WAC LTV FICO
A+/A 87% 7.42% 81% 621
A- 4% 8.01% 75% 557
B 6% 8.43% 76% 559
C 3% 8.98% 70% 552
C- 1% 10.44% 64% 545
2004 Product Mix
Hybrid 72.4%
Fixed 17.0%
Alt-A 0.4%
2nd Mortgage 6.5%
I / O 3.7%
FICO 611
LTV 79.9%
WAC 7.37%
1Q 2005 Product Mix
Hybrid 69.5%
Fixed 11.3%
Alt-A 0.1%
2nd Mortgage 8.1%
I / O 10.9%
FICO 613
LTV 79.2%
WAC 7.57%
[Graphic]
Slide 9 9
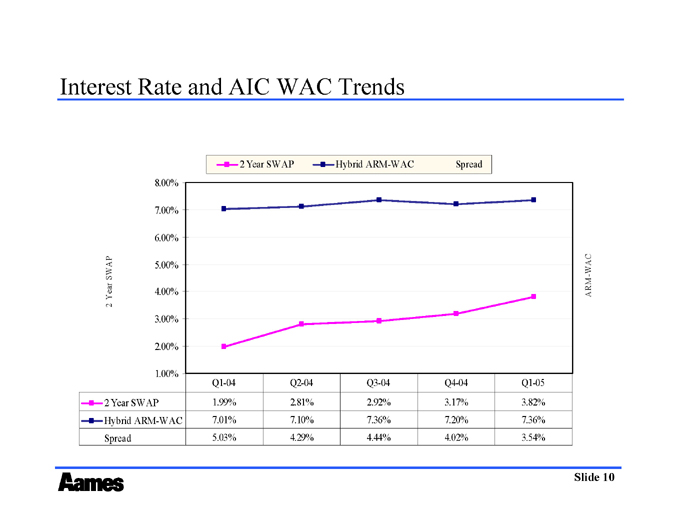
Interest Rate and AIC WAC Trends
2 Year SWAP Hybrid ARM-WAC Spread
2 SWAP Year
8.00% 7.00% 6.00% 5.00% 4.00% 3.00% 2.00% 1.00%
ARM-WAC
Q1-04 Q2-04 Q3-04 Q4-04 Q1-05
2 Year SWAP 1.99% 2.81% 2.92% 3.17% 3.82%
Hybrid ARM-WAC 7.01% 7.10% 7.36% 7.20% 7.36%
Spread 5.03% 4.29% 4.44% 4.02% 3.54%
[Graphic]
Slide 10

Financial Review
[Graphic]
Slide 11
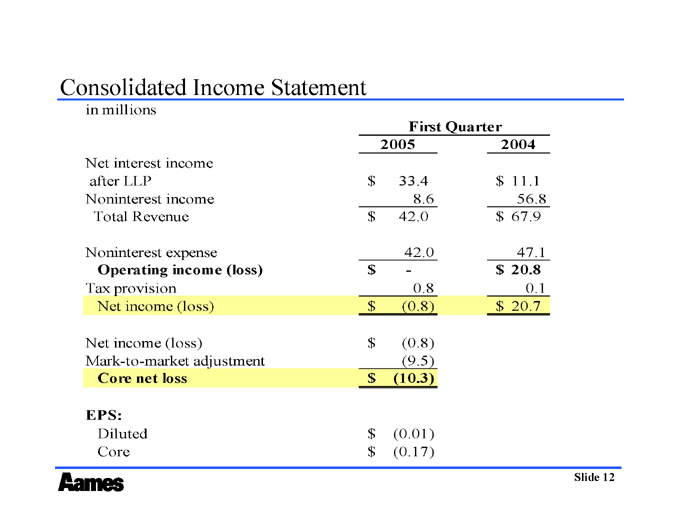
Consolidated Income Statement
in millions
First Quarter
2005 2004
Net interest income after LLP $ 33.4 $ 11.1
Noninterest income 8.6 56.8
Total Revenue $ 42.0 $ 67.9
Noninterest expense 42.0 47.1
Operating income (loss) $—$ 20.8
Tax provision 0.8 0.1
Net income (loss) $ (0.8) $ 20.7
Net income (loss) $ (0.8)
Mark-to-market adjustment (9.5)
Core net loss $ (10.3)
EPS:
Diluted $ (0.01)
Core $ (0.17)
[Graphic]
Slide 12
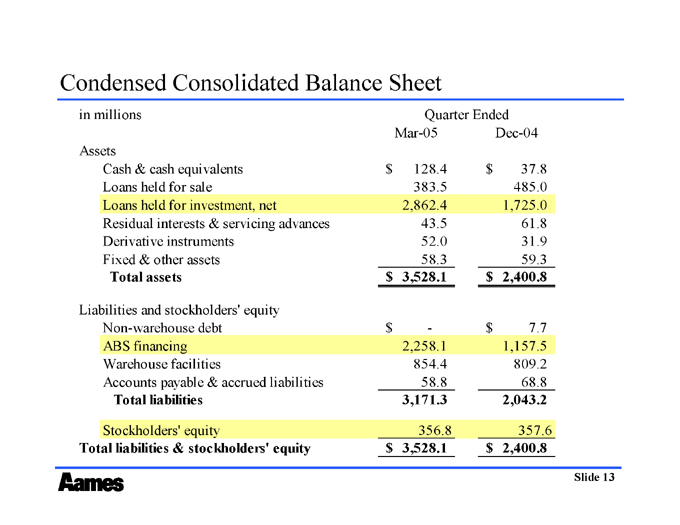
Condensed Consolidated Balance Sheet
in millions Quarter Ended
Mar-05 Dec-04
Assets
Cash & cash equivalents $ 128.4 $ 37.8
Loans held for sale 383.5 485.0
Loans held for investment, net 2,862.4 1,725.0
Residual interests & servicing advances 43.5 61.8
Derivative instruments 52.0 31.9
Fixed & other assets 58.3 59.3
Total assets $ 3,528.1 $ 2,400.8
Liabilities and stockholders’ equity
Non-warehouse debt $ - $ 7.7
ABS financing 2,258.1 1,157.5
Warehouse facilities 854.4 809.2
Accounts payable & accrued liabilities 58.8 68.8
Total liabilities 3,171.3 2,043.2
Stockholders’ equity 356.8 357.6
Total liabilities & stockholders’ equity $ 3,528.1 $ 2,400.8
[Graphic]
Slide 13
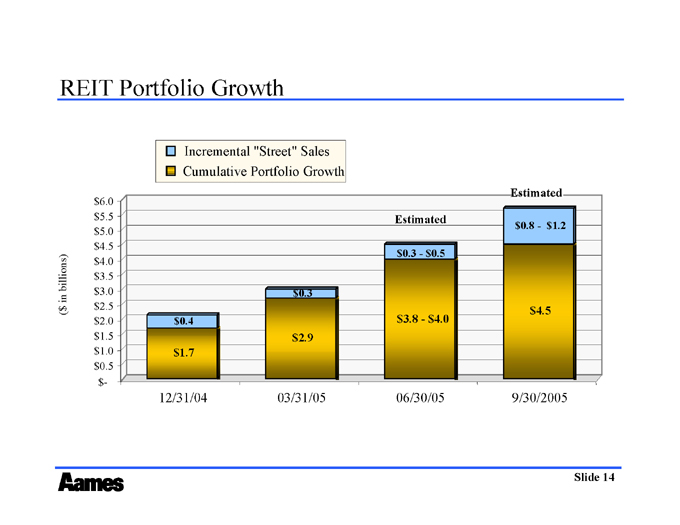
REIT Portfolio Growth
Incremental “Street” Sales
Cumulative Portfolio Growth
($ in billions)
$6.0 $5.5 $5.0 $4.5 $4.0 $3.5 $3.0 $2.5 $2.0 $1.5 $1.0 $0.5 $-
Estimated Estimated
$0.4 $0.3 $0.3 - $0.5 $0.8 - $1.2
$1.7 $2.9 $3.8 - $4.0 $4.5
12/31/04 03/31/05 06/30/05 9/30/2005
[Graphic]
Slide 14
1st Quarter 2005 Summary and Current Outlook
$0.27 dividend per share
Continued growth of REIT portfolio - $2.9 billion
Levered by end of 2nd quarter 2005
Focus on expanded retail and wholesale production
Respond to competitive pressures with targeted cost reduction
Call of remaining five off-balance sheet securitizations
Elimination of all residuals; $15 million in cash generated for balance sheet
[Graphic]
Slide 15