 Investment Corporation Third Quarter Results & Conference Call November 02, 2005 Exhibit 99.2 |
 Slide 2 Slide 2 Forward-looking Statements This presentation may contain forward-looking statements under federal securities laws. These statements are based on management's current expectations and beliefs and are subject to a number of trends and uncertainties that could cause actual results to differ materially from those described in the forward-looking statements. The risks and uncertainties that may cause our performance and results to vary include: (i) limited cash flow to fund operations and dependence on short-term financing facilities; (ii) changes in overall economic conditions and interest rates; (iii) increased delinquency rates in the portfolio; (iv) intense competition in the mortgage lending industry; (v) adverse changes in the securitization and whole loan market for mortgage loans; (vi) declines in real estate values; (vii) an inability to originate subprime hybrid/adjustable mortgage loans; (viii) obligations to repurchase mortgage loans and indemnify investors; (ix) concentration of operations in California, Florida, New York and Texas and the adverse impact of natural disasters (including Hurricanes Katrina, Rita and Wilma); (x) extensive government regulation; and (xi) an inability to comply with the federal tax requirements applicable to REITs and effectively operate within limitations imposed on REITs by federal tax rules. This presentation may contain forward-looking statements under federal securities laws. These statements are based on management's current expectations and beliefs and are subject to a number of trends and uncertainties that could cause actual results to differ materially from those described in the forward-looking statements. The risks and uncertainties that may cause our performance and results to vary include: (i) limited cash flow to fund operations and dependence on short-term financing facilities; (ii) changes in overall economic conditions and interest rates; (iii) increased delinquency rates in the portfolio; (iv) intense competition in the mortgage lending industry; (v) adverse changes in the securitization and whole loan market for mortgage loans; (vi) declines in real estate values; (vii) an inability to originate subprime hybrid/adjustable mortgage loans; (viii) obligations to repurchase mortgage loans and indemnify investors; (ix) concentration of operations in California, Florida, New York and Texas and the adverse impact of natural disasters (including Hurricanes Katrina, Rita and Wilma); (x) extensive government regulation; and (xi) an inability to comply with the federal tax requirements applicable to REITs and effectively operate within limitations imposed on REITs by federal tax rules. |
 Slide 3 Slide 3 3rd Quarter 2005 Highlights Generated core EPS of $0.20 • Earnings driven by net interest income and gain on sale of loans REIT portfolio of $4.2 billion • Fully leveraged Total originations of $1.9 billion • 19.8% sequential increase • Retail Channel produced 42% of total Net cost to originate of 2.08% • 11% decrease from 2Q 2005 Declared Quarterly Dividend of $0.35 |
 Slide 4 Slide 4 2005 Strategic Initiatives Update Value focused production • 2.39% gross gain on sale of loans Continue to enhance sales platform and productivity • 29% year over year growth in retail production Reduce overall cost structure • 2.08% net cost to originate Maximize benefits from in-house servicing |
 Slide 5 Slide 5 Operating Overview Operating Overview |
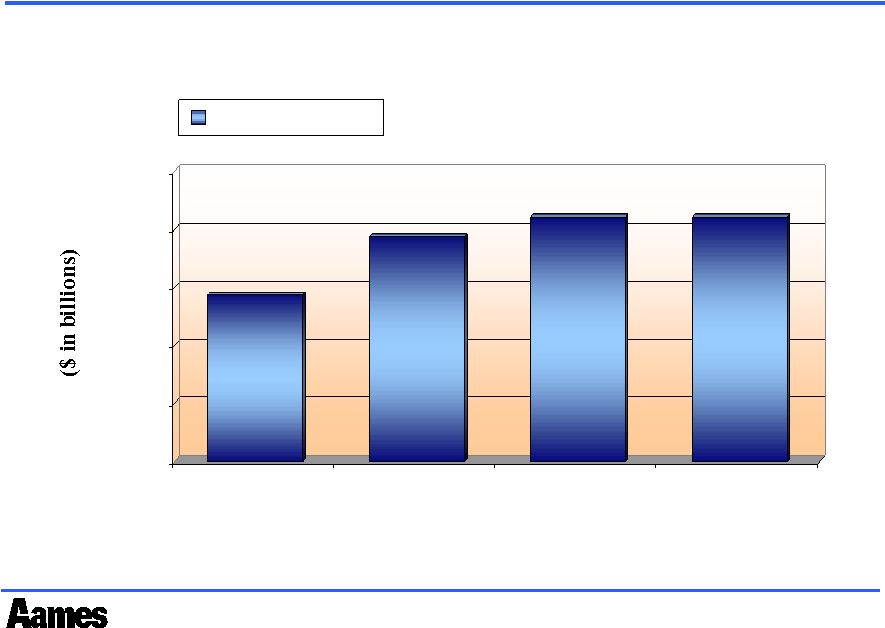 Slide 6 Slide 6 REIT Portfolio $2.9 $3.9 $4.2 $4.2 $- $1.0 $2.0 $3.0 $4.0 $5.0 03/31/05 06/30/05 9/30/2005 12/30/2005 Portfolio Growth $2.9 $3.9 $4.2 $4.2 $- $1.0 $2.0 $3.0 $4.0 $5.0 03/31/05 06/30/05 9/30/2005 12/30/2005 Portfolio Growth Estimated Estimated |
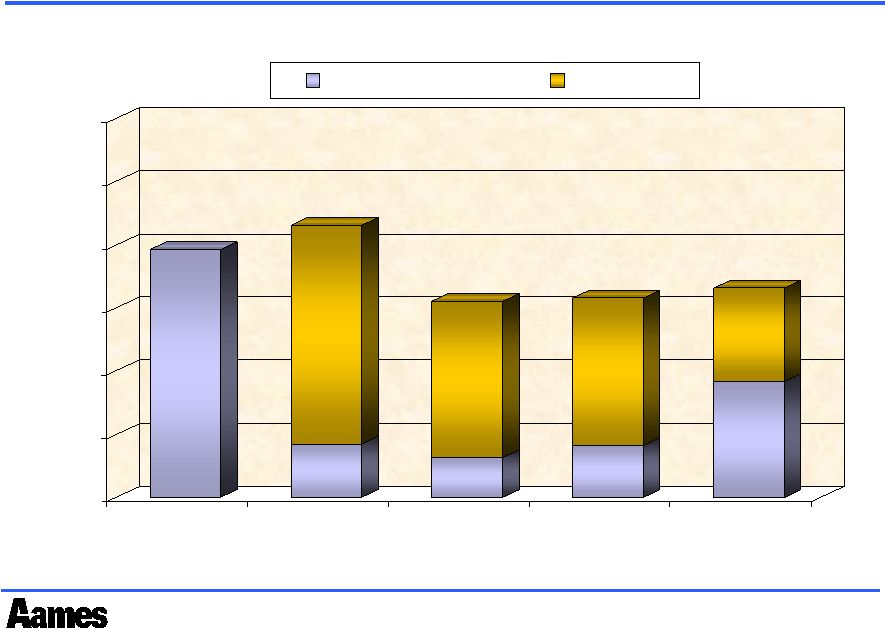 Slide 7 Slide 7 Loan Sales by Quarter $1,965 $427 $1,731 $2,158 $321 $1,238 $1,559 $411 $1,168 $1,579 $916 $747 $1,663 $0 $500 $1,000 $1,500 $2,000 $2,500 $3,000 3Q04 4Q04 1Q05 2Q05 3Q05 Whole Loan Sales REIT Sales $1,965 $427 $1,731 $2,158 $321 $1,238 $1,559 $411 $1,168 $1,579 $916 $747 $1,663 $0 $500 $1,000 $1,500 $2,000 $2,500 $3,000 3Q04 4Q04 1Q05 2Q05 3Q05 Whole Loan Sales REIT Sales |
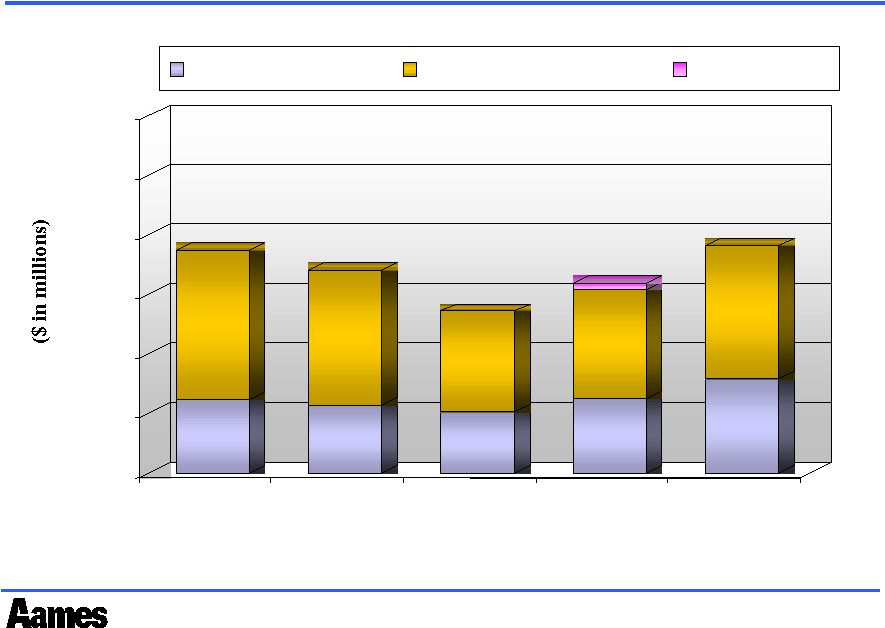 Slide 9 Slide 9 $615 $1,263 $1,878 $575 $1,135 $1,710 $517 $845 $1,362 $625 $921 $51.7 $1,597 $794 $1,119 $1,913 $0 $500 $1,000 $1,500 $2,000 $2,500 $3,000 3Q04 4Q04 1Q05 2Q05 3Q05 Retail Loan Production Wholesale Loan Production Purchased Loans Production by Quarter |
 Slide 9 Slide 9 Cost to Originate Trends Cost to Originate Trends 9/30/2005 9/30/2004 6/30/2005 Total noninterest expense 43,353 $ 42,675 $ 44,572 $ Non-core items 1,635 - (3,700) Deferred origination costs 24,319 21,780 19,434 Loan servicing & other costs (2,733) (2,341) (2,274) Total G&A Expenses 66,574 62,114 58,032 Net fees earned on originations (26,716) (16,466) (20,901) Net Cost to Originate 39,858 $ 45,648 $ 37,131 $ Total Originations 1,913,296 $ 1,878,012 $ 1,597,014 $ Cost Ratios Core noninterest expense 2.35% 2.27% 2.56% Deferred origination costs 1.27% 1.16% 1.22% Loan servicing & other costs -0.14% -0.12% -0.14% Total G&A Expenses 3.48% 3.31% 3.63% Net fees earned on originations -1.40% -0.88% -1.31% Total Cost to Originate 2.08% 2.43% 2.33% Quarter Ended 9/30/2005 9/30/2004 6/30/2005 Total noninterest expense 43,353 $ 42,675 $ 44,572 $ Non-core items 1,635 - (3,700) Deferred origination costs 24,319 21,780 19,434 Loan servicing & other costs (2,733) (2,341) (2,274) Total G&A Expenses 66,574 62,114 58,032 Net fees earned on originations (26,716) (16,466) (20,901) Net Cost to Originate 39,858 $ 45,648 $ 37,131 $ Total Originations 1,913,296 $ 1,878,012 $ 1,597,014 $ Cost Ratios Core noninterest expense 2.35% 2.27% 2.56% Deferred origination costs 1.27% 1.16% 1.22% Loan servicing & other costs -0.14% -0.12% -0.14% Total G&A Expenses 3.48% 3.31% 3.63% Net fees earned on originations -1.40% -0.88% -1.31% Total Cost to Originate 2.08% 2.43% 2.33% Quarter Ended |
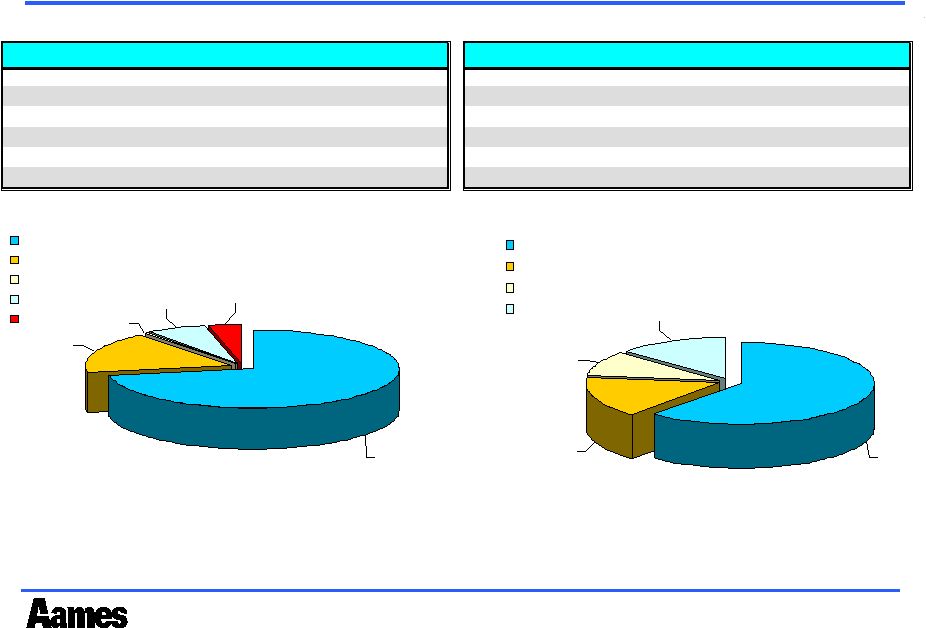 Slide 10 Slide 10 Production Profile Calendar 2004 Product % WAC LTV FICO A+/A 86% 7.24% 81% 619 A- 5% 7.78% 77% 560 B 6% 8.09% 76% 559 C 2% 8.75% 71% 549 C- 1% 9.89% 66% 535 2004 Product Mix 72.4% 17.0% 3.7% 6.5% 0.4% Hybrid Fixed Alt-A 2nd Mortgage I / O FICO 611 LTV 79.9% WAC 7.37% 3Q 2005 Product Mix 9.4% 13.5% 15.9% 61.3% Hybrid Fixed 2nd Mortgage I / O FICO 622 LTV 79.2% WAC 7.41% Product % WAC LTV FICO A+/A 89% 7.30% 80% 630 A- 4% 7.89% 75% 569 B 4% 8.29% 74% 559 C 2% 8.92% 70% 549 C- 1% 10.30% 65% 545 3Q2005 |
 Slide 11 Slide 11 Financial Review Financial Review |
 Slide 12 Slide 12 Condensed Consolidated Statement of Operations September 30, 2005 June 30, 2005 Net interest income 48.6 $ 40.0 $ Provision for credit losses (13.0) (11.9) Mark-to-market adjustment 7.1 (11.5) NII after LLP & mark 42.7 16.6 Noninterest income 21.3 6.0 NII and noninterest income 64.0 $ 22.6 $ Noninterest expense 43.4 44.5 Operating income (loss) 20.6 (21.9) Tax (benefit) provision (0.7) 0.7 Net income (loss) 21.3 $ (22.6) $ Net income (loss) 21.3 $ (22.6) $ Mark-to-market adjustment (7.1) 11.5 Non-core expenses (income) (1.6) 3.7 Core net income (loss) 12.5 $ (7.4) $ EPS Diluted 0.34 $ (0.37) $ Core 0.20 $ (0.12) $ Quarter Ended ($ in millions) September 30, 2005 June 30, 2005 Net interest income 48.6 $ 40.0 $ Provision for credit losses (13.0) (11.9) Mark-to-market adjustment 7.1 (11.5) NII after LLP & mark 42.7 16.6 Noninterest income 21.3 6.0 NII and noninterest income 64.0 $ 22.6 $ Noninterest expense 43.4 44.5 Operating income (loss) 20.6 (21.9) Tax (benefit) provision (0.7) 0.7 Net income (loss) 21.3 $ (22.6) $ Net income (loss) 21.3 $ (22.6) $ Mark-to-market adjustment (7.1) 11.5 Non-core expenses (income) (1.6) 3.7 Core net income (loss) 12.5 $ (7.4) $ EPS Diluted 0.34 $ (0.37) $ Core 0.20 $ (0.12) $ Quarter Ended ($ in millions) |
 Slide 13 Slide 13 Condensed Consolidated Balance Sheets (In millions) September 30, 2005 June 30, 2005 Assets Unrestricted cash 43.2 $ 63.7 $ Restricted cash 91.4 59.5 Loans held for sale, at lower of cost or market 632.5 380.5 Loans held for investment, net 4,187.1 3,873.9 Residual interests, at estimated fair value - 23.8 Derivative instruments, at estimated fair value 63.4 49.2 Fixed and other assets 108.8 66.6 Total assets 5,126.4 $ 4,517.2 $ Liabilities and Stockholders' Equity Non-warehouse debt - $ - $ ABS financing 4,137.8 3,162.4 Warehouse facilities 596.4 967.8 Accounts payable and accrued liabilities 75.5 71.1 Total liabilities 4,809.7 $ 4,201.3 $ Stockholders' equity 316.7 315.9 Total liabilities and stockholders' equity 5,126.4 $ 4,517.2 $ CONDENSED BALANCE SHEETS (In millions) September 30, 2005 June 30, 2005 Assets Unrestricted cash 43.2 $ 63.7 $ Restricted cash 91.4 59.5 Loans held for sale, at lower of cost or market 632.5 380.5 Loans held for investment, net 4,187.1 3,873.9 Residual interests, at estimated fair value - 23.8 Derivative instruments, at estimated fair value 63.4 49.2 Fixed and other assets 108.8 66.6 Total assets 5,126.4 $ 4,517.2 $ Liabilities and Stockholders' Equity Non-warehouse debt - $ - $ ABS financing 4,137.8 3,162.4 Warehouse facilities 596.4 967.8 Accounts payable and accrued liabilities 75.5 71.1 Total liabilities 4,809.7 $ 4,201.3 $ Stockholders' equity 316.7 315.9 Total liabilities and stockholders' equity 5,126.4 $ 4,517.2 $ CONDENSED BALANCE SHEETS |
 Slide 14 Slide 14 REIT Portfolio Returns REIT Portfolio Returns Quarter Ended 4,229,161 $ 3,314,356 $ Yield on portfolio 74,762 7.07% 59,328 7.16% Prepayment fees 7,946 0.75% 4,856 0.59% (4,520) -0.43% (5,336) -0.64% Amortization of deferred loan fees (1,345) -0.13% (1,143) -0.14% Gross yield on loans 76,843 $ 7.26% 57,705 $ 6.96% Interest on funding 43,391 4.10% 29,621 3.57% Hedge income (8,244) -0.78% (4,629) -0.56% Hedge costs, net 8,011 0.76% 5,035 0.61% Other costs 3,200 0.30% 2,110 0.25% Net cost to fund 46,358 4.38% 32,137 3.88% Gross spread 30,485 2.87% 25,568 3.09% Servicing costs (4,758) -0.45% (4,006) -0.48% 25,727 2.43% 21,562 2.60% Management fees & REIT costs (3,283) -0.31% (1,772) -0.21% Charge offs - 0.00% - 0.00% 22,432 $ 2.12% 19,789 $ 2.39% June 30, 2005 Net interest margin Amortization of premiums Average loan balance September 30, 2005 Estimated taxable REIT income Quarter Ended 4,229,161 $ 3,314,356 $ Yield on portfolio 74,762 7.07% 59,328 7.16% Prepayment fees 7,946 0.75% 4,856 0.59% (4,520) -0.43% (5,336) -0.64% Amortization of deferred loan fees (1,345) -0.13% (1,143) -0.14% Gross yield on loans 76,843 $ 7.26% 57,705 $ 6.96% Interest on funding 43,391 4.10% 29,621 3.57% Hedge income (8,244) -0.78% (4,629) -0.56% Hedge costs, net 8,011 0.76% 5,035 0.61% Other costs 3,200 0.30% 2,110 0.25% Net cost to fund 46,358 4.38% 32,137 3.88% Gross spread 30,485 2.87% 25,568 3.09% Servicing costs (4,758) -0.45% (4,006) -0.48% 25,727 2.43% 21,562 2.60% Management fees & REIT costs (3,283) -0.31% (1,772) -0.21% Charge offs - 0.00% - 0.00% 22,432 $ 2.12% 19,789 $ 2.39% June 30, 2005 Net interest margin Amortization of premiums Average loan balance September 30, 2005 Estimated taxable REIT income |
 Slide 15 Slide 15 3rd Quarter 2005 Summary and Current Outlook $0.20 Core EPS $0.35 dividend per share in 3rd quarter, $0.34 to $0.36 estimated for 4th quarter Continued growth of REIT portfolio - $4.2 billion • Now at target leverage ratio Continued improvement in efficiency 2.08% NCTO Respond to competitive and market pressures • Further targeted cost reductions • Disciplined coupon increases in response to interest rate market |