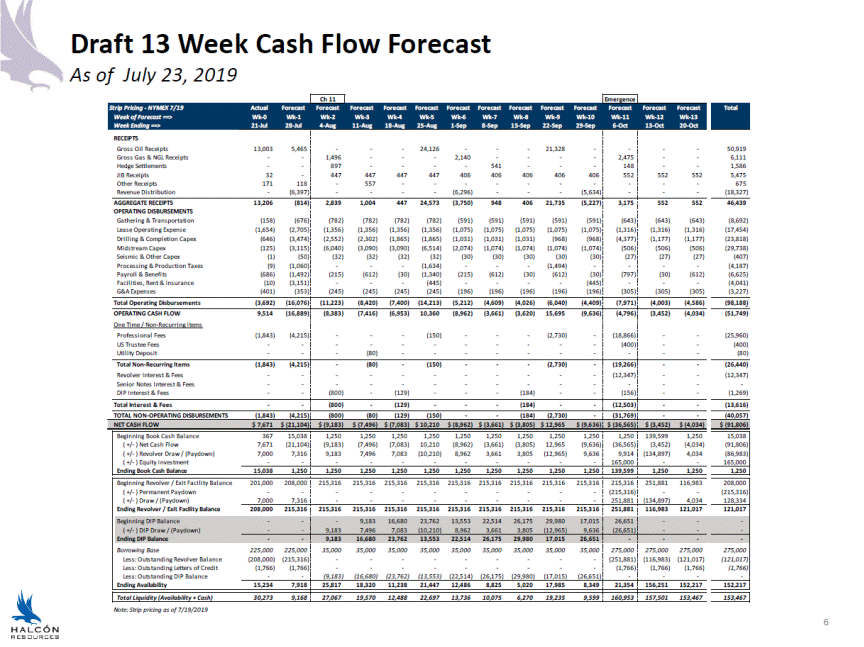
Draft 13 Week Cash Flow Forecast As of July 23, 2019 6 Ch 11 Emergence Strip Pricing - NYMEX 7/19 Actual Forecast Forecast Forecast Forecast Forecast Forecast Forecast Forecast Forecast Forecast Forecast Forecast Forecast Total Week of Forecast ==> Wk-0 Wk-1 Wk-2 Wk-3 Wk-4 Wk-5 Wk-6 Wk-7 Wk-8 Wk-9 Wk-10 Wk-11 Wk-12 Wk-13 Week Ending ==> 21-Jul 28-Jul 4-Aug 11-Aug 18-Aug 25-Aug 1-Sep 8-Sep 15-Sep 22-Sep 29-Sep 6-Oct 13-Oct 20-Oct RECEIPTS x Gross Oil Receipts 13,003 5,465 - - - 24,126 - - - 21,328 - - - - x 50,919 Gross Gas & NGL Receipts - - 1,496 - - - 2,140 - - - - 2,475 - - x 6,111 Hedge Settlements - - 897 - - - - 541 - - - 148 - - x 1,586 JIB Receipts 32 - 447 447 447 447 406 406 406 406 406 552 552 552 x 5,475 Other Receipts 171 118 - 557 - - - - - - - - - - x 675 Revenue Distribution - (6,397) - - - - (6,296) - - - (5,634) - - - x (18,327) x - AGGREGATE RECEIPTS 13,206 (814) 2,839 1,004 447 24,573 (3,750) 948 406 21,735 (5,227) 3,175 552 552 x 46,439 OPERATING DISBURSEMENTS x Gathering & Transportation (158) (676) (782) (782) (782) (782) (591) (591) (591) (591) (591) (643) (643) (643) x (8,692) Lease Operating Expense (1,654) (2,705) (1,356) (1,356) (1,356) (1,356) (1,075) (1,075) (1,075) (1,075) (1,075) (1,316) (1,316) (1,316) x (17,454) Drilling & Completion Capex (646) (3,474) (2,552) (2,302) (1,865) (1,865) (1,031) (1,031) (1,031) (968) (968) (4,377) (1,177) (1,177) x (23,818) Midstream Capex (125) (3,115) (6,040) (3,090) (3,090) (6,514) (2,074) (1,074) (1,074) (1,074) (1,074) (506) (506) (506) x (29,738) Seismic & Other Capex (1) (50) (32) (32) (32) (32) (30) (30) (30) (30) (30) (27) (27) (27) x (407) Processing & Production Taxes (9) (1,060) - - - (1,634) - - - (1,494) - - - - x (4,187) Payroll & Benefits (686) (1,492) (215) (612) (30) (1,340) (215) (612) (30) (612) (30) (797) (30) (612) x (6,625) Facilities, Rent & Insurance (10) (3,151) - - - (445) - - - - (445) - - - x (4,041) G&A Expenses (401) (353) (245) (245) (245) (245) (196) (196) (196) (196) (196) (305) (305) (305) x (3,227) x 0 Total Operating Disbursements (3,692) (16,076) (11,223) (8,420) (7,400) (14,213) (5,212) (4,609) (4,026) (6,040) (4,409) (7,971) (4,003) (4,586) x (98,188) x 0 OPERATING CASH FLOW 9,514 (16,889) (8,383) (7,416) (6,953) 10,360 (8,962) (3,661) (3,620) 15,695 (9,636) (4,796) (3,452) (4,034) x (51,749) x One Time / Non-Recurring Items x x Professional Fees (1,843) (4,215) - - - (150) - - - (2,730) - (18,866) - - x (25,960) US Trustee Fees - - - - - - - - - - - (400) - - x (400) Utility Deposit - - - (80) - - - - - - - - - - x (80) x - Total Non-Recurring Items (1,843) (4,215) - (80) - (150) - - - (2,730) - (19,266) - - x (26,440) x 0 Revolver Interest & Fees - - - - - - - - - - - (12,347) - - x (12,347) Senior Notes Interest & Fees - - - - - - - - - - - - - - x - DIP Interest & Fees - - (800) - (129) - - - (184) - - (156) - - x (1,269) x - Total Interest & Fees - - (800) - (129) - - - (184) - - (12,503) - - x (13,616) x - TOTAL NON-OPERATING DISBURSEMENTS (1,843) (4,215) (800) (80) (129) (150) - - (184) (2,730) - (31,769) - - x (40,057) NET CASH FLOW $ 7,671 $ (21,104) $ (9,183) $ (7,496) $ (7,083) $ 10,210 $ (8,962) $ (3,661) $ (3,805) $ 12,965 $ (9,636) $ (36,565) $ (3,452) $ (4,034) x $ (91,806) x Beginning Book Cash Balance 367 15,038 1,250 1,250 1,250 1,250 1,250 1,250 1,250 1,250 1,250 1,250 139,599 1,250 x 15,038 ( +/- ) Net Cash Flow 7,671 (21,104) (9,183) (7,496) (7,083) 10,210 (8,962) (3,661) (3,805) 12,965 (9,636) (36,565) (3,452) (4,034) x (91,806) ( +/- ) Revolver Draw / (Paydown) 7,000 7,316 9,183 7,496 7,083 (10,210) 8,962 3,661 3,805 (12,965) 9,636 9,914 (134,897) 4,034 x (86,983) ( +/- ) Equity Investment - - - - - - - - - - - 165,000 - - x 165,000 Ending Book Cash Balance 15,038 1,250 1,250 1,250 1,250 1,250 1,250 1,250 1,250 1,250 1,250 139,599 1,250 1,250 x 1,250 x Beginning Revolver / Exit Facility Balance 201,000 208,000 215,316 215,316 215,316 215,316 215,316 215,316 215,316 215,316 215,316 215,316 251,881 116,983 x 208,000 ( +/- ) Permanent Paydown - - - - - - - - - - - (215,316) - - x (215,316) ( +/- ) Draw / (Paydown) 7,000 7,316 - - - - - - - - - 251,881 (134,897) 4,034 x 128,334 Ending Revolver / Exit Facility Balance 208,000 215,316 215,316 215,316 215,316 215,316 215,316 215,316 215,316 215,316 215,316 251,881 116,983 121,017 x 121,017 x Beginning DIP Balance - - - 9,183 16,680 23,762 13,553 22,514 26,175 29,980 17,015 26,651 - - - ( +/- ) DIP Draw / (Paydown) - - 9,183 7,496 7,083 (10,210) 8,962 3,661 3,805 (12,965) 9,636 (26,651) - - - Ending DIP Balance - - 9,183 16,680 23,762 13,553 22,514 26,175 29,980 17,015 26,651 - - - - x Borrowing Base 225,000 225,000 35,000 35,000 35,000 35,000 35,000 35,000 35,000 35,000 35,000 275,000 275,000 275,000 x 275,000 Less: Outstanding Revolver Balance (208,000) (215,316) - - - - - - - - - (251,881) (116,983) (121,017) x (121,017) Less: Outstanding Letters of Credit (1,766) (1,766) - - - - - - - - - (1,766) (1,766) (1,766) x (1,766) Less: Outstanding DIP Balance - - (9,183) (16,680) (23,762) (13,553) (22,514) (26,175) (29,980) (17,015) (26,651) - - - x - Ending Availability 15,234 7,918 25,817 18,320 11,238 21,447 12,486 8,825 5,020 17,985 8,349 21,354 156,251 152,217 x 152,217 x Total Liquidity (Availability + Cash) 30,273 9,168 27,067 19,570 12,488 22,697 13,736 10,075 6,270 19,235 9,599 160,953 157,501 153,467 x 153,467 Note: Strip pricing as of 7/19/2019 x


