UNITED STATES
SECURITIES AND EXCHANGE COMMISSION
Washington, D.C. 20549
FORM N-CSR
CERTIFIED SHAREHOLDER REPORT OF REGISTERED
MANAGEMENT INVESTMENT COMPANIES
Investment Company Act file number: 811-09997
Baird Funds, Inc.
(Exact name of registrant as specified in charter)
777 East Wisconsin Avenue
Milwaukee, WI 53202
(Address of principal executive offices) (Zip code)
Charles M. Weber
Robert W. Baird & Co. Incorporated
777 East Wisconsin Avenue
Milwaukee, WI 53202
(Name and address of agent for service)
1-866-442-2473
Registrant's telephone number, including area code
Date of fiscal year end: December 31, 2007
Date of reporting period: June 30, 2007
Item 1. Reports to Stockholders.
Semi-Annual Report - Baird Funds
Baird Intermediate Bond Fund
Baird Aggregate Bond Fund
Baird Intermediate Municipal Bond Fund
Baird Core Plus Bond Fund
Baird Short-Term Bond Fund
TABLE OF CONTENTS
Page | |
| BAIRD INTERMEDIATE BOND FUND | 1 |
| BAIRD AGGREGATE BOND FUND | 15 |
| BAIRD INTERMEDIATE MUNICIPAL BOND FUND | 30 |
| BAIRD CORE PLUS BOND FUND | 37 |
| BAIRD SHORT-TERM BOND FUND | 46 |
| ADDITIONAL INFORMATION ON FUND EXPENSES | 56 |
| STATEMENTS OF ASSETS AND LIABILITIES | 58 |
| STATEMENTS OF OPERATIONS | 59 |
| STATEMENTS OF CHANGES IN NET ASSETS | 60 |
| FINANCIAL HIGHLIGHTS | 65 |
| NOTES TO THE FINANCIAL STATEMENTS | 74 |
| ADDITIONAL INFORMATION | 88 |
This report has been prepared for shareholders and may be distributed to others only if preceded or accompanied by a current prospectus.
Cautionary Note on Analyses, Opinions and Outlooks: In this report we offer analyses and opinions on the performance of individual securities, companies, industries, sectors, markets, interest rates and governmental policies, including predictions, forecasts and outlooks regarding possible future events. These can generally be identified as such because the context of the statements may include such words as “believe,” “should,” “will,” “expects,” “anticipates,” “hopes” and words of similar effect. These statements reflect the portfolio managers’ good faith beliefs and judgments and involve risks and uncertainties, including the risk that the portfolio managers’ analyses, opinions and outlooks are or will prove to be inaccurate. It is inherently difficult to correctly assess and explain the performance of particular securities, sectors, markets, interest rate movements, governmental actions or general economic trends and conditions, and many unforeseen factors contribute to the performance of Baird Funds. Investors are, therefore, cautioned not to place undue reliance on subjective judgments contained in this report.
The Baird Intermediate Bond Fund seeks an annual rate of total return, before Fund expenses, greater than the annual rate of total return of the Lehman Brothers Intermediate Government/Credit Bond Index. The Lehman Brothers Intermediate Government/Credit Bond Index is an unmanaged, market value weighted index of investment grade, fixed-rate debt, including government and corporate securities, with maturities between one and ten years.
Portfolio Characteristics
Quality Distribution* | Sector Weightings* |
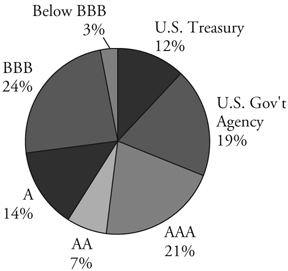 |  |
Net Assets: | $ | 324,303,641 | Annualized Expense Ratio: | |||||||
SEC 30-Day Yield:** | Institutional Class: | 0.30 | % | |||||||
| Institutional Class: | 5.13% | Investor Class: | 0.55 | %*** | ||||||
| Investor Class: | 4.99% | Portfolio Turnover Rate:**** | 24.1 | % | ||||||
Average Effective Duration: | 3.67 years | Total Number of Holdings: | 262 | |||||||
Average Effective Maturity: | 4.85 years | |||||||||
| * | Percentages shown are based on the Fund’s total net assets. |
| ** | SEC yields are based on SEC guidelines and are calculated for the 30 days ended June 30, 2007. |
| *** | Includes 0.25% 12b-1 fee. |
| **** | Not annualized. |
Page 1
Baird Intermediate Bond Fund
Average Annual Total Returns
Since | ||||||||||||||
For the Periods Ended June 30, 2007 | One Year | Five Years | Inception(1) | |||||||||||
| Baird Intermediate Bond Fund – Institutional Class Shares | 6.28 | % | 4.51 | % | 5.81% | |||||||||
| Baird Intermediate Bond Fund – Investor Class Shares | 6.01 | % | 4.23 | % | 5.56% | |||||||||
Lehman Brothers Intermediate Government/Credit Bond Index(2) | 5.76 | % | 4.15 | % | 5.45% | |||||||||
(1) | For the period from September 29, 2000 (commencement of operations) through June 30, 2007. |
(2) | The Lehman Brothers Intermediate Government/Credit Bond Index is an unmanaged, market value weighted index of investment grade, fixed-rate debt, including government and corporate securities, with maturities between one and ten years. This index does not reflect any deduction for fees, expenses or taxes. A direct investment in an index is not possible. |
The returns shown in the table above reflect reinvestment of dividends and/or capital gains distributions in additional shares. The returns do not reflect the deduction of taxes that a shareholder would pay on Fund distributions or the redemption of Fund shares.
Past performance does not guarantee future results. Investment return and principal value will fluctuate so that an investor’s shares, when redeemed, may be worth more or less than their original cost.
For information about the performance of the Fund as of the most recent month-end, please call 1-866-44BAIRD or visit www.bairdfunds.com. Mutual fund performance changes over time and current performance may be lower or higher than that stated.
Page 2
Baird Intermediate Bond Fund
Schedule of Investments June 30, 2007 (Unaudited) |
Principal | |||||||
Amount | Value | ||||||
LONG-TERM INVESTMENTS – 94.2% | |||||||
Asset Backed Securities – 5.2% | |||||||
| $ | 441,119 | Amresco Residential | |||||
| Securities Mortgage | |||||||
| Loan Trust, | |||||||
| Series 1998-1, Class A6, | |||||||
| 6.51%, 08/25/2027 | $ | 439,678 | |||||
| 855,872 | Bayview Financial | ||||||
| Acquisition Trust, | |||||||
| Series 2005-B, Class 1A2, | |||||||
| 4.696%, 04/28/2039 | 849,644 | ||||||
| 13,643 | CitiFinancial Mortgage | ||||||
| Securities, Inc., | |||||||
| Series 2004-1, Class AF2, | |||||||
| 2.645%, 04/25/2034 | 13,231 | ||||||
| 11,540 | Contimortgage Home | ||||||
| Equity Trust, | |||||||
| Series 1999-1, Class A7, | |||||||
| 6.97%, 12/25/2013 | 11,501 | ||||||
| Countrywide Asset-Backed | |||||||
| Certificates: | |||||||
| 2,215,000 | Series 2006-S3, Class A2, | ||||||
| 6.085%, 06/25/2021 | 2,220,401 | ||||||
| 2,200,000 | Series 2005-12, Class 1A2, | ||||||
| 4.847%, 02/25/2036 | 2,183,931 | ||||||
| 375,000 | Series 2006-13, Class 1AF3, | ||||||
| 5.944%, 01/25/2037 | 374,633 | ||||||
| 75,000 | Series 2006-9, Class 1AF3, | ||||||
| 5.859%, 10/25/2046 | 74,918 | ||||||
| 1,500,000 | Credit Based Asset | ||||||
| Servicing and Securities, | |||||||
| Series 2005-CB1, | |||||||
| Class AF4, | |||||||
| 4.6118%, 01/25/2035 | 1,491,634 | ||||||
| Delta Funding Home | |||||||
| Equity Loan Trust: | |||||||
| 223,652 | Series 1997-2, Class A6, | ||||||
| 7.04%, 06/25/2027 | 222,927 | ||||||
| 193,125 | Series 1999-1, Class A6F, | ||||||
| 6.34%, 12/15/2028 | 192,761 | ||||||
| 657,991 | Series 1999-2, Class A7F, | ||||||
| 7.03%, 08/15/2030 | 656,492 | ||||||
| 150,000 | Discover Card | ||||||
| Master Trust I, | |||||||
| Series 2003-4, Class A1, | |||||||
| 5.43%, 05/15/2011 | 150,243 | ||||||
| 48,634 | Equivantage Home | ||||||
| Equity Loan Trust, | |||||||
| Series 1996-3, Class A3, | |||||||
| 7.70%, 09/25/2027 | 48,478 | ||||||
| GMAC Mortgage | |||||||
| Corporation Loan Trust: | |||||||
| 1,325,463 | Series 2004-GH1, | ||||||
| Class A2, | |||||||
| 4.39%, 12/25/2025 | 1,314,797 | ||||||
| 1,383,067 | Series 2004-J4, Class A2, | ||||||
| 5.50%, 09/25/2034 | 1,370,470 | ||||||
| Green Tree Financial | |||||||
| Corporation: | |||||||
| 1,190,767 | Series 1998-2, Class A5, | ||||||
| 6.24%, 11/01/2016 | 1,186,637 | ||||||
| 1,525,177 | Series 1998-3, Class A5, | ||||||
| 6.22%, 03/01/2030 | 1,514,210 | ||||||
| 558,949 | Series 1998-4, Class A5, | ||||||
| 6.18%, 04/01/2030 | 551,317 | ||||||
| 5,213 | Series 1999-3, Class A5, | ||||||
| 6.16%, 02/01/2031 | 5,213 | ||||||
The accompanying notes are an integral part of these financial statements.
Page 3
Baird Intermediate Bond Fund
Schedule of Investments June 30, 2007 (Unaudited) |
Principal | |||||||
Amount | Value | ||||||
LONG-TERM INVESTMENTS – 94.2% (cont.) | |||||||
Asset Backed Securities – 5.2% (cont.) | |||||||
| $ | 126,036 | IMC Home Equity | |||||
| Loan Trust, | |||||||
| Series 1998-1, Class A6, | |||||||
| 7.02%, 06/20/2029 | $ | 125,697 | |||||
| 246,484 | Oakwood Mortgage | ||||||
| Investors, Inc., | |||||||
| Series 1999-B, Class A3, | |||||||
| 6.45%, 11/15/2017 | 228,063 | ||||||
| 1,500,000 | Popular Asset Backed | ||||||
| Mortgage Pass Thru Trust, | |||||||
| Series 2005-B, Class AF3, | |||||||
| 4.62%, 08/25/2035 | 1,487,915 | ||||||
| 23,748 | Residential Asset | ||||||
| Mortgage Products, Inc., | |||||||
| Series 2003-RS7, | |||||||
| Class AI6, | |||||||
| 5.34%, 08/25/2033 | 23,159 | ||||||
| 16,737,950 | |||||||
Financial – 17.9% | |||||||
| Allfirst Financial, Inc. | |||||||
| Subordinated Notes: | |||||||
| 1,550,000 | 7.20%, 07/01/2007 | 1,550,000 | |||||
| 875,000 | 6.875%, 06/01/2009 | 897,163 | |||||
| American General Finance | |||||||
| Corporation Notes: | |||||||
| 25,000 | 4.625%, 09/01/2010 | 24,335 | |||||
| 550,000 | 4.00%, 03/15/2011 | 520,365 | |||||
| 630,000 | AmSouth Bancorporation | ||||||
| Subordinated Debentures, | |||||||
| 6.75%, 11/01/2025 | 660,271 | ||||||
| 691,000 | AmSouth Bank NA | ||||||
| Subordinated Notes, | |||||||
| 6.45%, 02/01/2008 | 694,693 | ||||||
| 500,000 | AMVESCAP PLC Notes, | ||||||
5.375%, 02/27/2013 f | 485,568 | ||||||
| 1,335,000 | Anthem, Inc., | ||||||
| 6.80%, 08/01/2012 | 1,397,353 | ||||||
| 725,000 | Banco Santander | ||||||
| Chile SA, | |||||||
7.00%, 07/18/2007 f | 725,483 | ||||||
| 310,000 | Bank of America | ||||||
| Corporation | |||||||
| Subordinated Notes, | |||||||
| 10.20%, 07/15/2015 | 392,550 | ||||||
| 400,000 | Bank of Oklahoma | ||||||
| Subordinated Notes, | |||||||
| 7.125%, 08/15/2007 | 400,675 | ||||||
| 925,000 | Bank of Tokyo- | ||||||
| Mitsubishi/UFJ NY, | |||||||
| 7.40%, 06/15/2011 | 986,207 | ||||||
| Bank One Corporation | |||||||
| Subordinated Notes: | |||||||
| 180,000 | 6.00%, 02/17/2009 | 181,527 | |||||
| 1,043,000 | 10.00%, 08/15/2010 | 1,162,344 | |||||
| 1,595,000 | BankAmerica Institutional, | ||||||
| 8.07%, 12/31/2026 | |||||||
| (Acquired 01/04/2006, | |||||||
| 06/01/2006, 10/11/2006, | |||||||
| 01/24/2007, and 05/07/2007; | |||||||
| Cost $500,456, $682,331, | |||||||
| $417,508, $26,010, and | |||||||
| $52,079, respectively)* | 1,659,358 | ||||||
| 480,000 | Bankers Trust Corporation | ||||||
| Subordinated Notes, | |||||||
| 7.375%, 05/01/2008 | 485,806 | ||||||
| 2,500,000 | Banponce Trust I, Series A, | ||||||
| 8.327%, 02/01/2027 | 2,604,075 | ||||||
| 1,000,000 | BOI Capital Funding No. 2, | ||||||
| 5.571%, 02/01/2049 | |||||||
| (Acquired 01/20/2006; | |||||||
Cost $1,000,000)* f | 948,183 | ||||||
The accompanying notes are an integral part of these financial statements.
Page 4
Baird Intermediate Bond Fund
Schedule of Investments June 30, 2007 (Unaudited) |
Principal | |||||||
Amount | Value | ||||||
LONG-TERM INVESTMENTS – 94.2% (cont.) | |||||||
Financial – 17.9% (cont.) | |||||||
| $ | 300,000 | CIT Group Company | |||||
| of Canada, | |||||||
5.20%, 06/01/2015 f | $ | 278,947 | |||||
| CIT Group, Inc.: | |||||||
| 200,000 | 5.40%, 01/30/2016 | 188,617 | |||||
| 1,500,000 | 6.10%, 03/15/2067 | ||||||
| (Callable 03/15/2017) | 1,366,083 | ||||||
| 1,336,000 | Comerica Incorporated | ||||||
| Subordinated Notes, | |||||||
| 7.25%, 08/01/2007 | 1,337,862 | ||||||
| 850,000 | Compass Bank | ||||||
| Subordinated Notes, | |||||||
| 8.10%, 08/15/2009 | 891,846 | ||||||
| 260,000 | Corestates Capital Trust I, | ||||||
| 8.00%, 12/15/2026 | |||||||
| (Acquired 11/29/2005; | |||||||
| Cost $276,398)* | 269,292 | ||||||
| 1,325,000 | Countrywide Financial | ||||||
| Corporation | |||||||
| Subordinated Notes, | |||||||
| 6.25%, 05/15/2016 | 1,301,285 | ||||||
| 441,352 | First National Bank of | ||||||
| Chicago Pass Thru | |||||||
| Certificates, | |||||||
| 8.08%, 01/05/2018 | 490,802 | ||||||
| 1,100,000 | First National Bank of | ||||||
| Omaha Subordinated | |||||||
| Notes, 7.32%, 12/01/2010 | 1,122,366 | ||||||
| 1,900,000 | First Union Capital, | ||||||
| 7.9349%, 01/15/2027 | 1,975,945 | ||||||
| 775,000 | FMR Corporation Notes, | ||||||
| 4.75%, 03/01/2013 | |||||||
| (Acquired 02/26/2003; | |||||||
| Cost $777,379)* | 745,789 | ||||||
| 800,000 | General Electric Capital | ||||||
| Corporation Notes, | |||||||
| 6.00%, 06/15/2012 | 814,268 | ||||||
| 1,000,000 | Genworth Financial | ||||||
| Inc. Notes, | |||||||
| 5.75%, 06/15/2014 | 995,635 | ||||||
| 1,975,000 | Glencore Funding LLC, | ||||||
| 6.00%, 04/15/2014 | |||||||
| (Acquired 03/31/2004, | |||||||
| 02/02/2005, 04/26/2006 | |||||||
| and 12/04/2006; Cost | |||||||
| $794,280, $146,738, | |||||||
| $282,792 and $720,432, | |||||||
| respectively)* | 1,938,310 | ||||||
| 500,000 | Goldman Sachs | ||||||
| Group, Inc. Bonds, | |||||||
| 5.15%, 01/15/2014 | 480,454 | ||||||
| 1,000,000 | Great West Life & | ||||||
| Annuity Insurance, | |||||||
| 7.153%, 05/16/2046 | |||||||
| (Acquired 05/16/2006; | |||||||
| Cost $1,000,000)* | 1,024,097 | ||||||
| 1,195,000 | Health Care Service | ||||||
| Corporation Notes, | |||||||
| 7.75%, 06/15/2011 | |||||||
| (Acquired 06/20/2001, | |||||||
| 01/26/2005 and | |||||||
| 10/19/2006; Cost | |||||||
| $497,765, $373,500 and | |||||||
| $397,317, respectively)* | 1,277,051 | ||||||
| 400,000 | Highmark, Inc. Notes, | ||||||
| 6.80%, 08/15/2013 | |||||||
| (Acquired 08/14/2003; | |||||||
| Cost $399,088)* | 414,341 | ||||||
| 25,000 | HSBC Finance | ||||||
| Corporation Notes, | |||||||
| 5.00%, 06/30/2015 | 23,416 | ||||||
The accompanying notes are an integral part of these financial statements.
Page 5
Baird Intermediate Bond Fund
Schedule of Investments June 30, 2007 (Unaudited) |
Principal | |||||||
Amount | Value | ||||||
LONG-TERM INVESTMENTS – 94.2% (cont.) | |||||||
Financial – 17.9% (cont.) | |||||||
| $ | 1,050,000 | Istar Financial, Inc., | |||||
| 5.95%, 10/15/2013 | $ | 1,034,379 | |||||
| 500,000 | J.P. Morgan Chase | ||||||
| & Company | |||||||
| Subordinated Notes, | |||||||
| 6.625%, 03/15/2012 | 519,863 | ||||||
| 846,000 | Lehman Brothers | ||||||
| Holdings, Inc. Notes, | |||||||
| 8.50%, 08/01/2015 | 977,843 | ||||||
| 1,600,000 | Lehman Brothers | ||||||
| Holdings Senior Notes, | |||||||
| 8.80%, 03/01/2015 | 1,873,181 | ||||||
| 600,000 | Marsh & McLennan | ||||||
| Companies, Inc., | |||||||
| 5.375%, 07/15/2014 | 561,337 | ||||||
| 375,000 | Met Life Global | ||||||
| Funding Senior Notes, | |||||||
| 4.50%, 05/05/2010 | |||||||
| (Acquired 08/04/2005 | |||||||
| and 03/22/2007; | |||||||
| Cost $123,925 and | |||||||
| $245,931, respectively)* | 365,777 | ||||||
| 1,000,000 | Morgan Stanley | ||||||
| Dean Witter Debentures, | |||||||
| 10.00%, 06/15/2008 | 1,040,718 | ||||||
| 25,000 | Morgan Stanley | ||||||
| Subordinated Notes, | |||||||
| 4.75%, 04/01/2014 | 23,346 | ||||||
| 1,530,000 | National Australia | ||||||
| Bank Ltd. Subordinated | |||||||
| Notes, Series A, | |||||||
8.60%, 05/19/2010 f | 1,658,792 | ||||||
| 534,000 | National City Bank of | ||||||
| Kentucky Subordinated | |||||||
| Notes, 6.30%, 02/15/2011 | 546,343 | ||||||
| 1,100,000 | Navigators Group Inc. | ||||||
| Senior Unsecured Notes, | |||||||
| 7.00%, 05/01/2016 | 1,101,280 | ||||||
| 760,000 | NB Capital Trust IV, | ||||||
| 8.25%, 04/15/2027 | 790,630 | ||||||
| 1,000,000 | North Fork Capital | ||||||
| Trust II, | |||||||
| 8.00%, 12/15/2027 | 1,046,170 | ||||||
| 800,000 | Phoenix Companies, | ||||||
| 6.675%, 02/16/2008 | 802,984 | ||||||
| 1,319,000 | PNC Funding | ||||||
| Corporation, | |||||||
| 7.50%, 11/01/2009 | 1,378,330 | ||||||
| 1,500,000 | Premium Asset | ||||||
| Senior Notes, | |||||||
| 4.125%, 03/12/2009 | |||||||
| (Acquired 12/20/2006 | |||||||
| and 05/10/2007; Cost | |||||||
| $935,000 and $480,000, | |||||||
| respectively)* | 1,422,416 | ||||||
| 25,000 | Protective Life | ||||||
| Corporation Senior Notes, | |||||||
| 4.30%, 06/01/2013 | 23,459 | ||||||
| 700,000 | Residential Capital | ||||||
| Corporation, | |||||||
| 6.875%, 06/30/2015 | 678,941 | ||||||
| 805,000 | SAFECO | ||||||
| Corporation Notes, | |||||||
| 6.875%, 07/15/2007 | 805,364 | ||||||
| 546,000 | SAFECO Corporation | ||||||
| Senior Notes, | |||||||
| 7.25%, 09/01/2012 | 581,606 | ||||||
| 550,000 | Santander Central | ||||||
| Hispano Insurances, | |||||||
6.375%, 02/15/2011 f | 565,215 | ||||||
The accompanying notes are an integral part of these financial statements.
Page 6
Baird Intermediate Bond Fund
Schedule of Investments June 30, 2007 (Unaudited) |
Principal | |||||||
Amount | Value | ||||||
LONG-TERM INVESTMENTS – 94.2% (cont.) | |||||||
Financial – 17.9% (cont.) | |||||||
| SLM Corporation Notes: | |||||||
| $ | 1,516,000 | 4.50%, 07/26/2010 | $ | 1,401,715 | |||
| 25,000 | 5.375%, 05/15/2014 | 21,423 | |||||
| 1,000,000 | St. Paul Travelers, Inc., | ||||||
| 6.25%, 06/20/2016 | 1,016,514 | ||||||
| 1,046,000 | Toll Road Inv. Part II, | ||||||
| 0.00%, 02/15/2011 | |||||||
| (Acquired 09/28/2004; | |||||||
| Cost $782,046)* ^ | 854,315 | ||||||
| 1,320,000 | Transamerica Finance | ||||||
| Corporation Debentures, | |||||||
| 0.00%, 03/01/2010 ^ | 1,130,638 | ||||||
| 350,000 | UFJ Finance Aruba AEC, | ||||||
6.75%, 07/15/2013 f | 369,563 | ||||||
| 870,000 | Union Planters | ||||||
| Corporation | |||||||
| Subordinated Notes, | |||||||
| 6.50%, 03/15/2018 | 875,799 | ||||||
| 500,000 | Washington Mutual Bank | ||||||
| Subordinated Notes, | |||||||
| 6.875%, 06/15/2011 | 519,632 | ||||||
| Westdeutsche Landesbank | |||||||
Subordinated Notes: f | |||||||
| 25,000 | 6.05%, 01/15/2009 | 25,213 | |||||
| 1,495,000 | 4.796%, 07/15/2015 | 1,407,039 | |||||
| 58,132,187 | |||||||
Industrial – 17.8% | |||||||
| 450,000 | Alcan, Inc. Notes, | ||||||
5.00%, 06/01/2015 f | 418,611 | ||||||
| 1,745,000 | American Standard Inc., | ||||||
| 7.375%, 02/01/2008 | 1,759,246 | ||||||
| 1,008,000 | Ameritech | ||||||
| Capital Funding, | |||||||
| 6.45%, 01/15/2018 | 1,020,499 | ||||||
| 300,000 | Bellsouth Corporation, | ||||||
| 4.75%, 11/15/2012 | 286,706 | ||||||
| Bunge Ltd. Finance | |||||||
| Corporation Notes: | |||||||
| 800,000 | 5.35%, 04/15/2014 | 759,965 | |||||
| 1,085,000 | 5.10%, 07/15/2015 | 1,002,489 | |||||
| 375,000 | Caesars Entertainment | ||||||
| Senior Notes, | |||||||
| 7.50%, 09/01/2009 | 383,438 | ||||||
| 1,000,000 | Clear Channel | ||||||
| Communications Senior | |||||||
| Unsubordinated Notes, | |||||||
| 5.50%, 12/15/2016 | 823,960 | ||||||
| 125,000 | Comcast Cable | ||||||
| Communication Holdings, | |||||||
| 8.375%, 03/15/2013 | 139,539 | ||||||
| 525,000 | Comcast Corporation, | ||||||
| 6.50%, 01/15/2017 | 536,002 | ||||||
| 50,000 | Comcast Corporation | ||||||
| Senior Subordinated Notes, | |||||||
| 10.625%, 07/15/2012 | 59,372 | ||||||
| 50,000 | Computer Sciences | ||||||
| Corporation Notes, | |||||||
| 6.25%, 03/15/2009 | 50,427 | ||||||
| 24,815 | Continental Airlines, Inc. | ||||||
| Pass Thru Certificates, | |||||||
| Series 1998-1, | |||||||
| 6.541%, 03/15/2008 | 24,784 | ||||||
| 960,000 | Cooper Industries, | ||||||
| Inc. Notes, | |||||||
| 5.25%, 07/01/2007 | 960,000 | ||||||
| 1,281,000 | COX | ||||||
| Communications Inc., | |||||||
| 7.125%, 10/01/2012 | 1,353,343 | ||||||
| 225,000 | Daimlerchrysler Co LLC, | ||||||
| 12.375%, 05/01/2020 | 367,088 | ||||||
The accompanying notes are an integral part of these financial statements.
Page 7
Baird Intermediate Bond Fund
Schedule of Investments June 30, 2007 (Unaudited) |
Principal | |||||||
Amount | Value | ||||||
LONG-TERM INVESTMENTS – 94.2% (cont.) | |||||||
Industrial – 17.8% (cont.) | |||||||
| $ | 1,000,000 | D.R. Horton Inc. | |||||
| Unsubordinated Notes, | |||||||
| 6.50%, 04/15/2016 | $ | 956,765 | |||||
| 1,125,000 | Deutsche Telekom | ||||||
| International | |||||||
| Finance BV, | |||||||
8.00%, 06/15/2010 f | 1,199,091 | ||||||
| 300,000 | Dollar General | ||||||
| Corporation, | |||||||
| 8.625%, 06/15/2010 | 326,126 | ||||||
| 875,000 | Donnelley (R.R.) & Sons | ||||||
| Co., 6.125%, 01/15/2017 | 851,938 | ||||||
| 2,434,000 | Ensco International, | ||||||
| Inc. Notes, | |||||||
| 6.75%, 11/15/2007 | 2,444,826 | ||||||
| 500,000 | Fiserv, Inc. Notes, | ||||||
| 4.00%, 04/15/2008 | 494,108 | ||||||
| 623,000 | Ford Capital BV | ||||||
| Debentures, | |||||||
9.50%, 06/01/2010 f | 632,345 | ||||||
| 300,000 | Ford Motor | ||||||
| Company Debentures, | |||||||
| 9.215%, 09/15/2021 | 273,750 | ||||||
| General Motors Acceptance | |||||||
| Corporation Notes: | |||||||
| 1,025,000 | 7.75%, 01/19/2010 | 1,037,641 | |||||
| 200,000 | 6.75%, 12/01/2014 | 191,531 | |||||
| 550,000 | General Motors Nova | ||||||
| Scotia Finance Company, | |||||||
6.85%, 10/15/2008 f | 547,250 | ||||||
| Halliburton | |||||||
| Company Notes: | |||||||
| 475,000 | 5.625%, 12/01/2008 | 475,733 | |||||
| 675,000 | 5.50%, 10/15/2010 | 674,345 | |||||
| 700,000 | Hanson Australia Funding, | ||||||
5.25%, 03/15/2013 f | 684,305 | ||||||
| 650,000 | Hanson PLC Notes, | ||||||
6.125%, 08/15/2016 f | 665,432 | ||||||
| 975,000 | Hutchison Whampoa | ||||||
| International Limited, | |||||||
| 6.25%, 01/24/2014 | |||||||
| (Acquired 11/19/2003 | |||||||
| and 02/08/2005; Cost | |||||||
| $749,228 | |||||||
| and $244,602, | |||||||
respectively)* f | 988,794 | ||||||
| 1,000,000 | Ingersoll-Rand | ||||||
| Company Debentures, | |||||||
6.391%, 11/15/2027 f | 1,036,969 | ||||||
| 1,000,000 | International Paper | ||||||
| Company Notes, | |||||||
| 6.50%, 11/15/2007 | 1,001,806 | ||||||
| 1,100,000 | Johnson Controls Inc. | ||||||
| Senior Notes, | |||||||
| 5.50%, 01/15/2016 | 1,065,102 | ||||||
| 675,000 | Laboratory Corporation | ||||||
| of America Holdings, | |||||||
| 5.50%, 02/01/2013 | 650,282 | ||||||
| 550,000 | Lafarge SA Notes, | ||||||
6.50%, 07/15/2016 f | 562,979 | ||||||
| 500,000 | Limited Brands, Inc., | ||||||
| 5.25%, 11/01/2014 | 465,079 | ||||||
| 400,000 | Marathon | ||||||
| Oil Corporation, | |||||||
6.00%, 07/01/2012 f | 405,492 | ||||||
| 1,550,000 | Masco Corporation, | ||||||
| 6.125%, 10/03/2016 | 1,524,648 | ||||||
| 650,000 | New York Telephone | ||||||
| Company Debentures, | |||||||
| 8.625%, 11/15/2010 | 700,283 | ||||||
| 1,748,000 | Nextel Communications | ||||||
| Senior Notes, | |||||||
| 6.875%, 10/31/2013 | 1,734,941 | ||||||
The accompanying notes are an integral part of these financial statements.
Page 8
Baird Intermediate Bond Fund
Schedule of Investments June 30, 2007 (Unaudited) |
Principal | |||||||
Amount | Value | ||||||
LONG-TERM INVESTMENTS – 94.2% (cont.) | |||||||
Industrial – 17.8% (cont.) | |||||||
| $ | 700,000 | PCCW Capital II Ltd., | |||||
| 6.00%, 07/15/2013 | |||||||
| (Acquired 07/10/2003; | |||||||
Cost $696,731)* f | $ | 693,722 | |||||
| 600,000 | Pearson Dollar Finance | ||||||
| PLC, 5.70%, 06/01/2014 | |||||||
| (Acquired 09/28/2005; | |||||||
Cost $618,138)* f | 578,914 | ||||||
| 1,545,000 | Plum Creek Timberlands, | ||||||
| 5.875%, 11/15/2015 | 1,495,871 | ||||||
| 1,500,000 | Premcor Refining | ||||||
| Group Inc. Senior Notes, | |||||||
| 9.50%, 02/01/2013 | 1,597,148 | ||||||
| Qwest Capital | |||||||
| Funding, Inc.: | |||||||
| 350,000 | 7.00%, 08/03/2009 | 350,000 | |||||
| 100,000 | 7.25%, 02/15/2011 | 99,500 | |||||
| 1,000,000 | Reed Elsevier | ||||||
| Capital Notes, | |||||||
| 4.625%, 06/15/2012 | 953,533 | ||||||
| 500,000 | SBC Communications, | ||||||
| Inc. Notes, | |||||||
| 5.625%, 06/15/2016 | 488,665 | ||||||
| 650,000 | Sealed Air Corporation | ||||||
| Senior Notes, | |||||||
| 5.375%, 04/15/2008 | |||||||
| (Acquired 04/09/2003; | |||||||
| Cost $646,490)* | 646,456 | ||||||
| 209,369 | Southwest Airlines | ||||||
| Company | |||||||
| Pass Thru Certificates, | |||||||
| Series 1996-A1, | |||||||
| 7.67%, 01/02/2014 | 211,023 | ||||||
| 500,000 | Sprint Nextel | ||||||
| Corporation, | |||||||
| 6.00%, 12/01/2016 | 474,328 | ||||||
| 1,100,000 | Sunoco, Inc. | ||||||
| Senior Notes, | |||||||
| 5.75%, 01/15/2017 | 1,060,160 | ||||||
| TCI Communications, | |||||||
| Inc. Debentures: | |||||||
| 325,000 | 7.875%, 08/01/2013 | 356,126 | |||||
| 583,000 | 8.75%, 08/01/2015 | 674,181 | |||||
Telecom Italia Capital: f | |||||||
| 1,360,000 | 4.95%, 09/30/2014 | 1,260,075 | |||||
| 425,000 | 5.25%, 10/01/2015 | 395,193 | |||||
| 681,000 | Tele-Communications, | ||||||
| Inc. Debentures, | |||||||
| 9.80%, 02/01/2012 | 786,046 | ||||||
| 1,425,000 | Telefonica | ||||||
| Emisiones, S.A.U., | |||||||
6.421%, 06/20/2016 f | 1,444,882 | ||||||
| 1,000,000 | Time Warner Cable, Inc., | ||||||
| 5.85%, 05/01/2017 | |||||||
| (Acquired 04/04/2007, | |||||||
| Cost $997,690)* | 972,648 | ||||||
| 250,000 | Time Warner | ||||||
| Companies, Inc., | |||||||
| 6.875%, 06/15/2018 | 259,130 | ||||||
| 1,075,000 | Time Warner Companies | ||||||
| Inc. Debentures, | |||||||
| 9.125%, 01/15/2013 | 1,234,848 | ||||||
| 1,470,000 | Transocean, Inc., | ||||||
6.625%, 04/15/2011 f | 1,510,500 | ||||||
| 275,000 | Tribune Company, | ||||||
| 5.25%, 08/15/2015 | 218,050 | ||||||
| Tyco International | |||||||
Group S.A.: f | |||||||
| 1,425,000 | 6.375%, 10/15/2011 | 1,467,979 | |||||
| 650,000 | 6.00%, 11/15/2013 | 667,443 | |||||
The accompanying notes are an integral part of these financial statements.
Page 9
Baird Intermediate Bond Fund
Schedule of Investments June 30, 2007 (Unaudited) |
Principal | |||||||
Amount | Value | ||||||
LONG-TERM INVESTMENTS – 94.2% (cont.) | |||||||
Industrial – 17.8% (cont.) | |||||||
| United AirLines, Inc. | |||||||
| Pass Thru Certificates: | |||||||
| $ | 576,792 | 6.201%, 09/01/2008 | $ | 582,560 | |||
| 269,959 | 10.02%, 03/22/2014 | 146,115 | |||||
| 245,275 | 7.762%, 12/31/2049 | 226,420 | |||||
| 1,000,000 | Univision | ||||||
| Communication, Inc., | |||||||
| 3.50%, 10/15/2007 | 990,000 | ||||||
| 1,500,000 | Vale Overseas Limited, | ||||||
6.25%, 01/23/2017 f | 1,487,730 | ||||||
| 1,050,000 | Viacom, Inc., | ||||||
| 7.70%, 07/30/2010 | 1,110,274 | ||||||
| Waste Management, Inc.: | |||||||
| 1,175,000 | 6.875%, 05/15/2009 | 1,201,702 | |||||
| 25,000 | 5.00%, 03/15/2014 | 23,332 | |||||
| 500,000 | Willamette Industries, | ||||||
| Inc. Notes, | |||||||
| 6.60%, 06/05/2012 | 507,952 | ||||||
| 57,709,536 | |||||||
International (U.S. $ Denominated) – 1.6% | |||||||
| 275,000 | Corp Andina | ||||||
| De Fomento Notes, | |||||||
7.375%, 01/18/2011 f | 289,735 | ||||||
| Korea Development | |||||||
Bank Notes: f | |||||||
| 450,000 | 4.25%, 11/13/2007 | 447,254 | |||||
| 1,050,000 | 3.875%, 03/02/2009 | 1,023,408 | |||||
| 350,000 | 4.625%, 09/16/2010 | 341,706 | |||||
| 1,000,000 | 5.125%, 02/14/2011 | 984,933 | |||||
| 350,000 | National Bank | ||||||
| of Hungary | |||||||
| Yankee Debentures, | |||||||
8.875%, 11/01/2013 f | 409,264 | ||||||
| 1,700,000 | PEMEX Project Funding | ||||||
| Master Trust, | |||||||
9.125%, 10/13/2010 f | 1,870,000 | ||||||
| 5,366,300 | |||||||
Mortgage Backed Securities – 18.2% | |||||||
| Bank of America | |||||||
| Alternative Loan Trust: | |||||||
| 394,360 | Series 2003-11, Class 4A1, | ||||||
| 4.75%, 01/25/2019 | 374,888 | ||||||
| 1,607,196 | Series 2004-2, Class 5A1, | ||||||
| 5.50%, 03/25/2019 | 1,598,243 | ||||||
| 1,508,674 | Series 2004-11, Class 4A1, | ||||||
| 5.50%, 12/25/2019 | 1,479,444 | ||||||
| 1,627,311 | Series 2006-3, Class 6A1, | ||||||
| 6.00%, 04/25/2036 | 1,634,113 | ||||||
| 1,117,861 | Bank of America | ||||||
| Funding Corporation, | |||||||
| Series 2003-3, Class 1A41, | |||||||
| 5.50%, 10/25/2033 | 1,089,398 | ||||||
| Citicorp Mortgage | |||||||
| Securities, Inc.: | |||||||
| 1,467,531 | Series 2004-5, Class 1A25, | ||||||
| 5.50%, 10/25/2014 | 1,455,849 | ||||||
| 1,482,386 | Series 2004-4, Class A5, | ||||||
| 5.50%, 06/25/2034 | 1,450,713 | ||||||
| Countrywide Alternative | |||||||
| Loan Trust: | |||||||
| 515,960 | Series 2005-5R, Class A2, | ||||||
| 4.75%, 12/25/2018 | 507,736 | ||||||
| 1,620,952 | Series 2005-50CB, Class | ||||||
| 4A1, 5.00%, 11/25/2020 | 1,597,084 | ||||||
| 2,847,075 | Series 2006-7CB, Class | ||||||
| 3A1, 5.25%, 05/25/2021 | 2,810,658 | ||||||
| 46,490 | Series 2004-18CB, | ||||||
| 5.125%, 09/25/2034 | 46,273 | ||||||
The accompanying notes are an integral part of these financial statements.
Page 10
Baird Intermediate Bond Fund
Schedule of Investments June 30, 2007 (Unaudited) |
Principal | |||||||
Amount | Value | ||||||
LONG-TERM INVESTMENTS – 94.2% (cont.) | |||||||
Mortgage Backed Securities – 18.2% (cont.) | |||||||
| $ | 50,000 | Series 2005-10CB, | |||||
| Class 1A6, | |||||||
| 5.50%, 05/25/2035 | $ | 48,999 | |||||
| 1,876,914 | Countrywide Home | ||||||
| Loans, Inc., | |||||||
| Series 2003-18, Class A3, | |||||||
| 5.25%, 07/25/2033 | 1,858,991 | ||||||
| 4,015,251 | CS First Boston Mortgage | ||||||
| Securities Corp., | |||||||
| Series 1998-C2, Class A2, | |||||||
| 6.30%, 11/15/2030 | 4,046,794 | ||||||
| Federal Gold Loan | |||||||
| Mortgage Corporation | |||||||
| (FGLMC) Pass Through | |||||||
| Certificates: | |||||||
| 1,984,566 | 6.00%, 06/01/2021 | 1,993,454 | |||||
| 60,744 | 6.00%, 07/01/2028 | 60,645 | |||||
| Federal Home Loan | |||||||
| Mortgage Corporation | |||||||
| (FHLMC): | |||||||
| 1,641,296 | Series 3033, Class LU, | ||||||
| 5.50%, 03/15/2013 | 1,638,922 | ||||||
| 1,309,977 | Series 2695, Class UA, | ||||||
| 5.50%, 09/15/2014 | 1,303,559 | ||||||
| 620,131 | Series R001, Class AE, | ||||||
| 4.375%, 04/15/2015 | 602,392 | ||||||
| 2,070,302 | Series R003, Class VA, | ||||||
| 5.50%, 08/15/2016 | 2,058,595 | ||||||
| 2,492,618 | Series 3122, Class VA, | ||||||
| 6.00%, 01/15/2017 | 2,506,277 | ||||||
| 1,950,159 | Series R010, Class VA, | ||||||
| 5.50%, 04/15/2017 | 1,937,177 | ||||||
| 640,569 | Series R009, Class AJ, | ||||||
| 5.75%, 12/15/2018 | 635,452 | ||||||
| 55,644 | Series 1395, Class G, | ||||||
| 6.00%, 10/15/2022 | 55,547 | ||||||
| 639,363 | Series 2970, Class DA, | ||||||
| 5.50%, 01/15/2023 | 636,303 | ||||||
| Federal National | |||||||
| Mortgage Association | |||||||
| (FNMA): | |||||||
| 1,336,843 | Series 2006-B2, Class AB, | ||||||
| 5.50%, 05/25/2014 | 1,328,271 | ||||||
| 1,500,000 | Series 2003-24, Class PC, | ||||||
| 5.00%, 11/25/2015 | 1,483,295 | ||||||
| 1,330,320 | Series 2006-B1, Class AB, | ||||||
| 6.00%, 06/25/2016 | 1,330,420 | ||||||
| 50,000 | Series 2003-35, Class TD, | ||||||
| 5.00%, 12/25/2016 | 49,461 | ||||||
| 223,785 | Series 1991-137, Class H, | ||||||
| 7.00%, 10/25/2021 | 230,979 | ||||||
| 188,558 | Series 1992-136, Class PK, | ||||||
| 6.00%, 08/25/2022 | 189,392 | ||||||
| 96,269 | Series 1993-32, Class H, | ||||||
| 6.00%, 03/25/2023 | 95,447 | ||||||
| 593,831 | Series 2002-95, Class MD, | ||||||
| 5.00%, 07/25/2026 | 591,111 | ||||||
| 294,471 | Series 2002-77, Class QP, | ||||||
| 5.00%, 09/25/2026 | 293,089 | ||||||
| 2,925,944 | Series 2004-W6, | ||||||
| Class 1A6, | |||||||
| 5.50%, 07/25/2034 | 2,891,197 | ||||||
| Government National | |||||||
| Mortgage Association | |||||||
| (GNMA): | |||||||
| 308,032 | Series 2003-12, | ||||||
| Class ON, | |||||||
| 4.00%, 02/16/2028 | 306,701 | ||||||
| 495,035 | Series 1999-4, Class ZB, | ||||||
| 6.00%, 02/20/2029 | 496,128 | ||||||
The accompanying notes are an integral part of these financial statements.
Page 11
Baird Intermediate Bond Fund
Schedule of Investments June 30, 2007 (Unaudited) |
Principal | |||||||
Amount | Value | ||||||
LONG-TERM INVESTMENTS – 94.2% (cont.) | |||||||
Mortgage Backed Securities – 18.2% (cont.) | |||||||
| J.P. Morgan Alternative | |||||||
| Loan Trust: | |||||||
| $ | 1,610,777 | Series 2006-A1, | |||||
| Class 2A1, | |||||||
| 5.797%, 03/25/2036 | $ | 1,609,040 | |||||
| 3,000,000 | Series 2006-S2, | ||||||
| Class A2, | |||||||
| 5.81%, 05/25/2036 | 2,989,104 | ||||||
| 934,415 | Lehman Mortgage Trust, | ||||||
| Series 2006-4, Class 3A1, | |||||||
| 5.00%, 08/25/2021 | 917,533 | ||||||
| 606,989 | Master Alternative | ||||||
| Loans Trust, | |||||||
| Series 2004-3, Class 1A1, | |||||||
| 5.00%, 03/25/2019 | 584,038 | ||||||
| 547,937 | Salomon Brothers | ||||||
| Mortgage Securities VII, | |||||||
| Series 2003-UP2, Class A2, | |||||||
| 4.00%, 06/25/2033 | 524,984 | ||||||
| Washington Mutual: | |||||||
| 3,556,829 | Series 2004-CB3, Class 3A, | ||||||
| 5.50%, 10/25/2019 | 3,535,516 | ||||||
| 814,751 | Series 2004-CB4, Class | ||||||
| 21A, 5.50%, 12/25/2019 | 809,807 | ||||||
| Washington Mutual, Inc. | |||||||
| Pass-Thru Certificates: | |||||||
| 2,641,450 | Series 2004-CB1, Class | ||||||
| 5A, 5.00%, 06/25/2019 | 2,539,094 | ||||||
| 1,506,454 | Series 2004-CB3, Class | ||||||
| 4A, 6.00%, 10/25/2019 | 1,506,970 | ||||||
| 1,176,976 | Series 2004-CB4, Class | ||||||
| 22A, 6.00%, 12/25/2019 | 1,186,014 | ||||||
| 58,915,097 | |||||||
Taxable Municipal Bonds – 0.4% | |||||||
| Tobacco Settlement | |||||||
| Financing Corporation: | |||||||
| 185,000 | 5.92%, 06/01/2012 | 184,519 | |||||
| 1,025,864 | 6.36%, 05/15/2025 | 1,024,910 | |||||
| 1,209,429 | |||||||
Utilities – 9.2% | |||||||
| 1,715,000 | Cilcorp Inc. Senior Notes, | ||||||
| 8.70%, 10/15/2009 | 1,772,264 | ||||||
| 50,000 | Commonwealth Edison, | ||||||
| 5.95%, 08/15/2016 | 48,949 | ||||||
| 1,000,000 | Dominion Resources | ||||||
| Inc., Series C, | |||||||
| 5.15%, 07/15/2015 | 949,808 | ||||||
| 1,400,000 | Duke Capital LLC Notes, | ||||||
| 5.668%, 08/15/2014 | 1,350,377 | ||||||
| 600,000 | Energy Transfer Partners, | ||||||
| 5.65%, 08/01/2012 | 593,008 | ||||||
| 300,000 | Exelon Corporation | ||||||
| Senior Notes, | |||||||
| 6.75%, 05/01/2011 | 309,096 | ||||||
| 2,500,000 | Kinder Morgan Finance, | ||||||
5.70%, 01/05/2016 f | 2,304,192 | ||||||
| 391,379 | Kiowa Power Partners LLC, | ||||||
| 4.811%, 12/30/2013 | |||||||
| (Acquired 11/19/2004; | |||||||
| Cost $403,331)* | 376,695 | ||||||
| 300,000 | Korea Electric Power | ||||||
| Corporation, | |||||||
6.75%, 08/01/2027 f | 328,517 | ||||||
| MidAmerican Energy | |||||||
| Holdings Company | |||||||
| Senior Notes: | |||||||
| 800,000 | 4.625%, 10/01/2007 | 798,053 | |||||
| 1,500,000 | 7.52%, 09/15/2008 | 1,532,821 | |||||
The accompanying notes are an integral part of these financial statements.
Page 12
Baird Intermediate Bond Fund
Schedule of Investments June 30, 2007 (Unaudited) |
Principal | |||||||
Amount | Value | ||||||
LONG-TERM INVESTMENTS – 94.2% (cont.) | |||||||
Utilities – 9.2% (cont.) | |||||||
| $ | 1,400,000 | National Grid PLC Senior | |||||
| Unsecured Notes, | |||||||
6.30%, 08/01/2016 f | $ | 1,425,549 | |||||
| 25,000 | National Rural Utilities, | ||||||
| 4.375%, 10/01/2010 | 24,188 | ||||||
| 100,000 | Nisource Finance | ||||||
| Corporation, | |||||||
| 7.875%, 11/15/2010 | 106,478 | ||||||
| 1,500,000 | ONEOK, Inc. | ||||||
| Senior Notes, | |||||||
| 7.125%, 04/15/2011 | 1,565,347 | ||||||
| 400,000 | ONEOK Partners | ||||||
| LP Notes, | |||||||
| 5.90%, 04/01/2012 | 401,923 | ||||||
| 1,417,000 | Panhandle Eastern | ||||||
| Pipeline Senior Notes, | |||||||
| 4.80%, 08/15/2008 | 1,404,271 | ||||||
| 1,990,000 | Pepco Holdings, Inc., | ||||||
| 5.50%, 08/15/2007 | 1,990,796 | ||||||
| 1,475,000 | PPL Energy Supply, LLC | ||||||
| Bonds, Series A | |||||||
| 5.70%, 10/15/2015 | 1,424,412 | ||||||
| 388,000 | PPL Energy Supply, LLC | ||||||
| Senior Notes, | |||||||
| 6.40%, 11/01/2011 | 394,085 | ||||||
| 900,000 | Progress Energy, Inc. | ||||||
| Senior Notes, | |||||||
| 6.85%, 04/15/2012 | 943,420 | ||||||
| 175,000 | PSE&G Energy Holdings | ||||||
| LLC Senior Notes, | |||||||
| 8.50%, 06/15/2011 | 185,354 | ||||||
| PSE&G Power LLC: | |||||||
| 275,000 | 7.75%, 04/15/2011 | 293,594 | |||||
| 425,000 | 5.00%, 04/01/2014 | 402,023 | |||||
| 828,723 | RGS (I&M) Funding | ||||||
| Corporation Debentures, | |||||||
| 9.82%, 12/07/2022 | 988,534 | ||||||
| 3,500,000 | System Energy Resources | ||||||
| 1st Mortgage, | |||||||
| 4.875%, 10/01/2007 | 3,493,819 | ||||||
| 800,000 | Transcontinental Gas Pipe | ||||||
| Line Corporation | |||||||
| Senior Notes, | |||||||
| 8.875%, 07/15/2012 | 896,000 | ||||||
| 313,586 | Tristate Gen & Trans Assn, | ||||||
| Series 2003, 6.04%, | |||||||
| 01/31/2018 (Acquired | |||||||
| 10/14/2003; Cost $313,586)* | 309,805 | ||||||
| Vectren Utility Holdings: | |||||||
| 900,000 | 6.625%, 12/01/2011 | 925,628 | |||||
| 525,000 | 5.25%, 08/01/2013 | 501,713 | |||||
| 900,000 | Verizon Communications | ||||||
| Debentures, | |||||||
| 6.84%, 04/15/2018 | 945,761 | ||||||
| 25,000 | Verizon Communications | ||||||
| Senior Unsecured Notes, | |||||||
| 5.55%, 02/15/2016 | 24,357 | ||||||
| 600,000 | Williams Companies, | ||||||
| Inc. Notes, | |||||||
| 8.125%, 03/15/2012 | 636,750 | ||||||
| 325,000 | Yosemite Securities Trust I, | ||||||
| 8.25%, 11/15/2004 | |||||||
| (Acquired 04/26/2001; | |||||||
Cost $340,415)* f | 269,750 | ||||||
| 29,917,337 | |||||||
The accompanying notes are an integral part of these financial statements.
Page 13
Baird Intermediate Bond Fund
Schedule of Investments June 30, 2007 (Unaudited) |
Principal | |||||||
Amount | Value | ||||||
LONG-TERM INVESTMENTS – 94.2% (cont.) | |||||||
U.S. Government Agency Issues – 11.9% | |||||||
| Federal National Mortgage | |||||||
| Association (FNMA): | |||||||
| $ | 3,085,000 | 7.25%, 01/15/2010 | $ | 3,233,370 | |||
| 34,525,000 | 6.00%, 05/15/2011 | 35,433,525 | |||||
| 38,666,895 | |||||||
U.S. Treasury Obligations – 12.0% | |||||||
| U.S. Treasury Bonds, | |||||||
| 29,150,000 | 9.125%, 05/15/2018 | 38,792,266 | |||||
| Total Long-Term | |||||||
| Investments | |||||||
| (Cost $309,527,685) | 305,446,997 | ||||||
COLLATERAL POOL INVESTMENT | |||||||
FOR SECURITIES ON LOAN – 26.3% | |||||||
| (Cost $85,409,679) | |||||||
| (Please Refer to Note 6) | 85,409,679 | ||||||
SHORT-TERM INVESTMENTS – 5.4% | |||||||
Money Market Funds – 5.4% | |||||||
| 12,468,548 | Short-Term Investment | ||||||
| Company Liquid Assets | |||||||
| Portfolio – AIM Fund | 12,468,548 | ||||||
| 4,979,405 | AIM STIT-STIC | ||||||
| Prime Portfolio | 4,979,405 | ||||||
| Total Short-Term | |||||||
| Investments | |||||||
| (Cost $17,447,953) | 17,447,953 | ||||||
| Total Investments | |||||||
| (Cost $412,385,317) – | |||||||
| 125.9% | 408,304,629 | ||||||
| Liabilities in Excess of | |||||||
| Other Assets – (25.9)% | (84,000,988 | ) | |||||
| TOTAL NET | |||||||
| ASSETS – 100.0% | $ | 324,303,641 | |||||
| ^ | Non-Income Producing |
| * | Restricted Security Deemed Liquid |
f | Foreign Security |
The accompanying notes are an integral part of these financial statements.
Page 14
Baird Aggregate Bond Fund
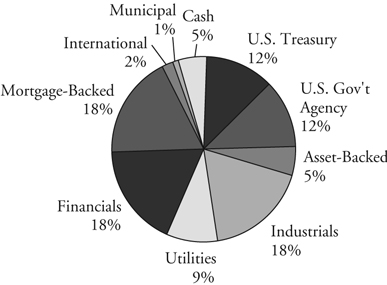
The Baird Aggregate Bond Fund seeks an annual rate of total return, before Fund expenses, greater than the annual rate of total return of the Lehman Brothers Aggregate Bond Index. The Lehman Brothers Aggregate Bond Index is an unmanaged, market value weighted index of investment grade, fixed-rate debt, including government, corporate, asset-backed, and mortgage-backed securities, with maturities of at least one year.
Portfolio Characteristics
Quality Distribution* | Sector Weightings* |
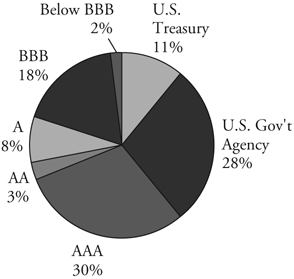 | 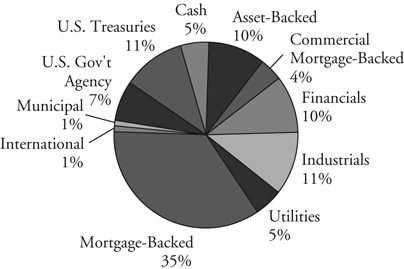 |
Net Assets: | $ | 507,158,635 | Annualized Expense Ratio: | |||||||
SEC 30-Day Yield:** | Institutional Class: | 0.30 | % | |||||||
| Institutional Class: | 5.50% | Investor Class: | 0.55 | %*** | ||||||
| Investor Class: | 5.25% | Portfolio Turnover Rate:**** | 21.5 | % | ||||||
Average Effective Duration: | 4.70 years | Total Number of Holdings: | 314 | |||||||
Average Effective Maturity: | 7.27 years | |||||||||
| * | Percentages shown are based on the Fund’s total net assets. |
| ** | SEC yields are based on SEC guidelines and are calculated for the 30 days ended June 30, 2007. |
| *** | Includes 0.25% 12b-1 fee. |
| **** | Not annualized. |
Page 15
Baird Aggregate Bond Fund
Average Annual Total Returns
Since | |||
For the Periods Ended June 30, 2007 | One Year | Five Years | Inception(1) |
| Baird Aggregate Bond Fund – Institutional Class Shares | 6.69% | 5.32% | 6.51% |
| Baird Aggregate Bond Fund – Investor Class Shares | 6.39% | 5.12% | 6.28% |
Lehman Brothers Aggregate Bond Index(2) | 6.12% | 4.48% | 5.77% |
(1) | For the period from September 29, 2000 (commencement of operations) through June 30, 2007. |
(2) | The Lehman Brothers Aggregate Bond Index is an unmanaged, market value weighted index of investment grade, fixed-rate debt, including government, corporate, asset-backed, and mortgage-backed securities, with maturities of at least one year. This index does not reflect any deduction for fees, expenses or taxes. A direct investment in an index is not possible. |
The returns shown in the table above reflect reinvestment of dividends and/or capital gains distributions in additional shares. The returns do not reflect the deduction of taxes that a shareholder would pay on Fund distributions or the redemption of Fund shares.
Past performance does not guarantee future results. Investment return and principal value will fluctuate so that an investor’s shares, when redeemed, may be worth more or less than their original cost.
For information about the performance of the Fund as of the most recent month-end, please call 1-866-44BAIRD or visit www.bairdfunds.com. Mutual fund performance changes over time and current performance may be lower or higher than that stated.
Page 16
Schedule of Investments June 30, 2007 (Unaudited) |
Principal | |||||||
Amount | Value | ||||||
LONG-TERM INVESTMENTS – 94.1% | |||||||
Asset Backed Securities – 10.1% | |||||||
| $ | 7,700,000 | American Express Credit | |||||
| Account Master Trust, | |||||||
| Series 2005-5, Class A, | |||||||
| 5.36%, 02/15/2013 | $ | 7,700,548 | |||||
| 2,000,000 | Bayview Financial | ||||||
| Acquisition Trust, | |||||||
| Series 2006-A, Class 1A2, | |||||||
| 5.483%, 02/28/2041 | 1,986,978 | ||||||
| 50,839 | Citifinancial Mortgage | ||||||
| Securities, Inc., | |||||||
| Series 2003-2, Class AF3, | |||||||
| 3.0429%, 05/25/2033 | 50,477 | ||||||
| Contimortgage Home | |||||||
| Equity Trust: | |||||||
| 15,613 | Series 1999-1, Class A7, | ||||||
| 6.97%, 12/25/2013 | 15,560 | ||||||
| 4,600 | Series 1997-2, Class A9, | ||||||
| 7.09%, 04/15/2028 | 4,591 | ||||||
| 48,753 | Series 1999-3, Class A8, | ||||||
| 5.8843%, 05/25/2029 | 48,765 | ||||||
| Countrywide Asset-Backed | |||||||
| Certificates: | |||||||
| 4,100,000 | Series 2006-S2, Class A2, | ||||||
| 5.627%, 07/25/2027 | 4,087,642 | ||||||
| 2,000,000 | Series 2005-17, Class 1AF2, | ||||||
| 5.363%, 03/25/2030 | 1,989,264 | ||||||
| 95,203 | Series 2004-12, Class AF3, | ||||||
| 4.022%, 12/25/2030 | 94,880 | ||||||
| 1,500,000 | Series 2004-15, Class AF6, | ||||||
| 4.613%, 04/25/2035 | 1,422,513 | ||||||
| 3,300,000 | Series 2005-1, Class AF6, | ||||||
| 5.03%, 07/25/2035 | 3,230,653 | ||||||
| 1,243,565 | Series 2005-10, Class AF2, | ||||||
| 4.493%, 02/25/2036 | 1,237,626 | ||||||
| 3,000,000 | Series 2005-10, Class AF6, | ||||||
| 4.915%, 02/25/2036 | 2,845,323 | ||||||
| 2,000,000 | Series 2005-17, Class 1AF, | ||||||
| 5.564%, 05/25/2036 | 1,947,600 | ||||||
| 3,000,000 | Series 2007-S1, Class A6, | ||||||
| 5.693%, 11/25/2036 | 2,898,818 | ||||||
| Credit Based Asset | |||||||
| Servicing and Securities: | |||||||
| 1,000,000 | Series 2005-CB1, Class | ||||||
| AF4, 4.615%, 01/25/2035 | 994,423 | ||||||
| 2,000,000 | Series 2005-CB8, Class | ||||||
| AF2, 5.303%, 12/25/2035 | 1,957,349 | ||||||
| 397,652 | Equivantage Home | ||||||
| Equity Loan Trust, | |||||||
| Series 1996-3, Class A3, | |||||||
| 7.70%, 09/25/2027 | 396,377 | ||||||
| GE Capital Mortgage | |||||||
| Services, Inc.: | |||||||
| 7,217 | Series 1997-HE4, Class | ||||||
| A7, 6.735%, 12/25/2028 | 7,193 | ||||||
| 88,239 | Series 1999-HE1, Class | ||||||
| A7, 6.265%, 04/25/2029 | 87,949 | ||||||
| 523,209 | GMAC Mortgage | ||||||
| Corporation Loan Trust, | |||||||
| Series 2004-GH1, Class | |||||||
| A2, 4.39%, 12/25/2025 | 518,999 | ||||||
| Green Tree Financial | |||||||
| Corporation: | |||||||
| 1,269,145 | Series 1993-3, Class A7, | ||||||
| 6.40%, 10/15/2018 | 1,279,057 | ||||||
| 180,201 | Series 1993-4, Class A5, | ||||||
| 7.05%, 01/15/2019 | 181,709 | ||||||
| 313 | Series 1995-4, Class A5, | ||||||
| 6.95%, 06/15/2025 | 313 | ||||||
| 1,030,967 | Series 1998-2, Class A5, | ||||||
| 6.24%, 11/01/2016 | 1,027,391 | ||||||
| 185,249 | Series 1997-6, Class A8, | ||||||
| 7.07%, 01/15/2029 | 189,166 | ||||||
The accompanying notes are an integral part of these financial statements.
Page 17
Baird Aggregate Bond Fund
Schedule of Investments June 30, 2007 (Unaudited) |
Principal | |||||||
Amount | Value | ||||||
LONG-TERM INVESTMENTS – 94.1% (cont.) | |||||||
Asset Backed Securities – 10.1% (cont.) | |||||||
| $ | 2,134,691 | Series 1998-3, Class A5, | |||||
| 6.22%, 03/01/2030 | $ | 2,119,342 | |||||
| 1,259,032 | Series 1998-4, Class A5, | ||||||
| 6.18%, 04/01/2030 | 1,241,841 | ||||||
| 1,997,968 | GSAA Home Equity Trust, | ||||||
| Series 2005-1, Class AF2, | |||||||
| 4.316%, 11/25/2034 | 1,948,092 | ||||||
| 415,857 | IMC Home Equity Loan | ||||||
| Trust, Series 1997-5, Class | |||||||
| A10, 6.88%, 11/20/2028 | 414,796 | ||||||
| 103,491 | Impac CMB Trust, | ||||||
| Series 2004-4, Class 2A2, | |||||||
| 5.249%, 09/25/2034 | 101,877 | ||||||
| 123,242 | Oakwood Mortgage | ||||||
| Investors, Inc., | |||||||
| Series 1999-B, Class A3, | |||||||
| 6.45%, 11/15/2017 | 114,032 | ||||||
| RAAC Series: | |||||||
| 190,842 | Series 2004-SP1, Class | ||||||
| AI2, 4.38%, 01/25/2022 | 188,990 | ||||||
| 1,200,000 | Series 2004-SP1, Class | ||||||
| AI4, 5.285%, 08/25/2027 | 1,167,544 | ||||||
| 3,000,000 | Renaissance Home | ||||||
| Equity Loan Trust, | |||||||
| Series 2007-1, Class AF3, | |||||||
| 5.612%, 04/25/2037 | 2,966,340 | ||||||
| Residential Asset | |||||||
| Mortgage Products, Inc.: | |||||||
| 1,548,397 | Series 2003-RS7, Class | ||||||
| AI6, 5.34%, 08/25/2033 | 1,509,949 | ||||||
| 1,000,000 | Series 2005-RS1, Class | ||||||
| AI6, 4.713%, 01/25/2035 | 950,179 | ||||||
| Residential Asset | |||||||
| Securities Corporation: | |||||||
| 219,836 | Series 2003-KS5, Class | ||||||
| AI6, 3.62%, 07/25/2033 | 205,549 | ||||||
| 299,801 | Series 2004-KS2, Class | ||||||
| AI6, 4.30%, 03/25/2034 | 283,161 | ||||||
| 1,600,000 | Stingray Pass Thru | ||||||
| Certificates, Series 2005, | |||||||
| 5.902%, 01/12/2015 | |||||||
| (Acquired 09/01/2006, | |||||||
| Cost $274,210)* | 1,531,168 | ||||||
| Structured Asset | |||||||
| Securities Corporation: | |||||||
| 471,991 | Series 2004-11XS, Class | ||||||
| 1A3A, 4.76%, 06/25/2034 | 469,278 | ||||||
| 38,527 | Series 2004-16XS, Class | ||||||
| A2, 4.91%, 08/25/2034 | 38,384 | ||||||
| 51,451,686 | |||||||
Financial – 10.6% | |||||||
| 600,000 | American General Finance | ||||||
| Corporation Senior Notes, | |||||||
| 8.45%, 10/15/2009 | 638,213 | ||||||
| 200,000 | AmSouth Bancorporation | ||||||
| Subordinated Debentures, | |||||||
| 6.75%, 11/01/2025 | 209,610 | ||||||
| 275,000 | AMVESCAP PLC Notes, | ||||||
5.375%, 02/27/2013 f | 267,063 | ||||||
| 300,000 | BAC Capital Trust VI, | ||||||
| 5.625%, 03/08/2035 | 267,866 | ||||||
| 1,015,000 | Bank of America | ||||||
| Corporation | |||||||
| Subordinated Notes, | |||||||
| 10.20%, 07/15/2015 | 1,285,283 | ||||||
| 400,000 | Bank of Oklahoma | ||||||
| Subordinated Notes, | |||||||
| 7.125%, 08/15/2007 | 400,675 | ||||||
| 1,435,000 | Bank of Tokyo- | ||||||
| Mitsubishi/UFJ NY, | |||||||
| 7.40%, 06/15/2011 | 1,529,954 | ||||||
The accompanying notes are an integral part of these financial statements.
Page 18
Baird Aggregate Bond Fund
Schedule of Investments June 30, 2007 (Unaudited) |
Principal | |||||||
Amount | Value | ||||||
LONG-TERM INVESTMENTS – 94.1% (cont.) | |||||||
Financial – 10.6% (cont.) | |||||||
| $ | 929,000 | Bank One Corporation | |||||
| Subordinated Notes, | |||||||
| 10.00%, 08/15/2010 | $ | 1,035,300 | |||||
| 330,000 | Bankers Trust | ||||||
| Corporation | |||||||
| Subordinated Notes, | |||||||
| 7.25%, 10/15/2011 | 349,969 | ||||||
| 2,175,000 | Banponce Trust I, | ||||||
| 8.327%, 02/01/2027 | |||||||
| (Callable 09/21/2007) | 2,265,545 | ||||||
| 2,000,000 | Capmark Financial Group, | ||||||
| Inc., 6.30%, 05/10/2017 | |||||||
| (Acquired 05/03/2007; | |||||||
| Cost $1,996,780)* | 1,968,106 | ||||||
| 325,000 | CIT Group Company | ||||||
| of Canada, | |||||||
5.20%, 06/01/2015 f | 302,192 | ||||||
| CIT Group, Inc.: | |||||||
| 500,000 | 5.40%, 01/30/2016 | 471,544 | |||||
| 1,070,000 | 6.10%, 03/15/2067 | ||||||
| (Callable 03/15/2017) | 974,473 | ||||||
| 1,181,000 | Compass Bank | ||||||
| Subordinated Notes, | |||||||
| 8.10%, 08/15/2009 | 1,239,141 | ||||||
| 875,000 | Countrywide Financial | ||||||
| Corporation | |||||||
| Subordinated Notes, | |||||||
| 6.25%, 05/15/2016 | 859,339 | ||||||
| 1,000,000 | Credit Agricole S A, | ||||||
| 6.637%, 05/29/2049 | |||||||
| (Acquired 05/23/2007; | |||||||
Cost $1,000,000)* f | 972,067 | ||||||
| 1,135,000 | First Empire Capital Trust | ||||||
| I, 8.234%, 02/01/2027 | 1,183,054 | ||||||
| 625,000 | First Empire Capital Trust | ||||||
| II, 8.277%, 06/01/2027 | 651,792 | ||||||
| 639,961 | First National Bank | ||||||
| of Chicago Pass | |||||||
| Thru Certificates, | |||||||
| 8.08%, 01/05/2018 | 711,662 | ||||||
| 2,875,000 | First National Bank of | ||||||
| Omaha Subordinated | |||||||
| Notes, 7.32%, 12/01/2010 | 2,933,457 | ||||||
| 1,748,000 | First Union Capital, | ||||||
| 7.935%, 01/15/2027 | |||||||
| (Callable 09/21/2007) | 1,817,869 | ||||||
| 2,718,000 | First Union Institutional | ||||||
| Capital I, 8.04%, | |||||||
| 12/01/2026 (Callable | |||||||
| 09/07/2007) | 2,829,870 | ||||||
| 545,000 | First Union Institutional | ||||||
| Capital II, 7.85%, | |||||||
| 01/01/2027 (Callable | |||||||
| 09/07/2007) | 566,893 | ||||||
| 675,000 | FMR Corporation Notes, | ||||||
| 4.75%, 03/01/2013 | |||||||
| (Acquired 02/26/2003 | |||||||
| and 03/15/2007; Cost | |||||||
| $250,768 and $415,463, | |||||||
| respectively)* | 649,558 | ||||||
| 1,575,000 | Glencore Funding LLC, | ||||||
| 6.00%, 04/15/2014 | |||||||
| (Acquired 03/31/2004, | |||||||
| 02/02/2005, 10/31/2005 | |||||||
| and 12/04/2006; Cost | |||||||
| $496,425, $122,281, | |||||||
| $231,168 and $695,590, | |||||||
| respectively)* | 1,545,741 | ||||||
| 850,000 | Goldman Sachs Capital I, | ||||||
| 6.345%, 02/15/2034 | 810,659 | ||||||
The accompanying notes are an integral part of these financial statements.
Page 19
Baird Aggregate Bond Fund
Schedule of Investments June 30, 2007 (Unaudited) |
Principal | |||||||
Amount | Value | ||||||
LONG-TERM INVESTMENTS – 94.1% (cont.) | |||||||
Financial – 10.6% (cont.) | |||||||
| $ | 1,000,000 | Great West Life & | |||||
| Annuity Insurance, | |||||||
| 7.153%, 05/16/2046 | |||||||
| (Acquired 05/16/2006; | |||||||
| Cost $1,000,000)* | $ | 1,024,097 | |||||
| 500,000 | Health Care Service | ||||||
| Corporation Notes, | |||||||
| 7.75%, 06/15/2011 | |||||||
| (Acquired 06/20/2001 | |||||||
| and 01/26/2005; Cost | |||||||
| $150,908 and $345,000, | |||||||
| respectively)* | 534,331 | ||||||
| 275,000 | Highmark, Inc. Notes, | ||||||
| 6.80%, 08/15/2013 | |||||||
| (Acquired 08/14/2003; | |||||||
| Cost $274,373)* | 284,860 | ||||||
| 400,000 | HSBC USA Capital Trust I, | ||||||
| 7.808%, 12/15/2026 | |||||||
| (Callable 09/07/07) | |||||||
| (Acquired 03/08/2007; | |||||||
| Cost $415,969)* | 415,616 | ||||||
| 900,000 | J.P. Morgan Chase & | ||||||
| Company Notes, | |||||||
| 5.875%, 03/15/2035 | 821,329 | ||||||
| 1,150,000 | Jefferies Group Inc., | ||||||
| 6.25%, 01/15/2036 | 1,077,603 | ||||||
| 565,000 | Liberty Mutual | ||||||
| Insurance Notes, | |||||||
| 7.697%, 10/15/2097 | |||||||
| (Acquired 03/26/2003; | |||||||
| Cost $361,510)* | 549,695 | ||||||
| 1,000,000 | Lincoln National | ||||||
| Corporation, 6.05%, | |||||||
| 04/20/2067 (Callable | |||||||
| 04/20/2017) | 954,784 | ||||||
| 300,000 | Marsh & McLennan | ||||||
| Companies, Inc., | |||||||
| 5.375%, 07/15/2014 | 280,668 | ||||||
| 475,000 | Morgan Stanley | ||||||
| Subordinated Notes, | |||||||
| 4.75%, 04/01/2014 | 443,574 | ||||||
| 1,346,000 | Navigators Group Inc. | ||||||
| Senior Unsecured Notes, | |||||||
| 7.00%, 05/01/2016 | 1,347,567 | ||||||
| 1,757,000 | NB Capital Trust IV, | ||||||
| 8.25%, 04/15/2027 | |||||||
| (Callable 09/07/2007) | 1,827,811 | ||||||
| 2,500,000 | North Fork Capital Trust II, | ||||||
| 8.00%, 12/15/2027 | |||||||
| (Callable 12/15/2007) | 2,615,425 | ||||||
| 600,000 | Phoenix Companies, | ||||||
| 6.675%, 02/16/2008 | 602,238 | ||||||
| 1,000,000 | Premium Asset Senior | ||||||
| Notes, 4.125%, 03/12/2009 | |||||||
| (Acquired 12/20/2006; | |||||||
| Cost $935,000)* | 948,277 | ||||||
| 1,000,000 | Republic New York | ||||||
| Capital I, 7.75%, | |||||||
| 11/15/2026 (Callable | |||||||
| 09/07/2007) | 1,036,600 | ||||||
| 700,000 | Republic New York | ||||||
| Corporation Debentures, | |||||||
| 9.125%, 05/15/2021 | 887,606 | ||||||
| 1,775,000 | Residential Capital | ||||||
| Corporation, | |||||||
| 6.875%, 06/30/2015 | 1,721,599 | ||||||
| 500,000 | SLM Corporation Notes, | ||||||
| 5.625%, 08/01/2033 | 389,872 | ||||||
| 1,000,000 | St. Paul Travelers, | ||||||
| 6.75%, 06/20/2036 | 1,033,749 | ||||||
The accompanying notes are an integral part of these financial statements.
Page 20
Baird Aggregate Bond Fund
Schedule of Investments June 30, 2007 (Unaudited) |
Principal | ||||||||
Amount | Value | |||||||
LONG-TERM INVESTMENTS – 94.1% (cont.) | ||||||||
Financial – 10.6% (cont.) | ||||||||
| $ | 500,000 | State Street Institutional | ||||||
| Cap B, 8.035%, | ||||||||
| 03/15/2027 (Acquired | ||||||||
| 09/06/2006; Cost | ||||||||
| $524,155)* | $ | 520,695 | ||||||
| 2,000,000 | Suntrust Capital II, | |||||||
| 7.90%, 06/15/2027 | ||||||||
| (Called 07/06/2007) | 2,081,640 | |||||||
| 1,000,000 | Symetra Financial | |||||||
| Corporation Senior Notes, | ||||||||
| 6.125%, 04/01/2016 | ||||||||
| (Acquired 03/23/2006; | ||||||||
| Cost $995,570)* | 988,918 | |||||||
| 225,000 | UFJ Finance Aruba AEC, | |||||||
6.75%, 07/15/2013 f | 237,576 | |||||||
| 1,534,000 | Westdeutsche Landesbank | |||||||
| Subordinated Notes, | ||||||||
| 4.796%, 07/15/2015 | 1,443,744 | |||||||
| 750,000 | Willis Group NA, | |||||||
| 5.625%, 07/15/2015 | 698,342 | |||||||
| 53,505,111 | ||||||||
Industrial – 10.8% | ||||||||
| 500,000 | Alcan, Inc., | |||||||
5.75%, 06/01/2035 f | 443,199 | |||||||
| Ameritech Capital | ||||||||
| Funding Debentures: | ||||||||
| 1,450,752 | 9.10%, 06/01/2016 | 1,626,531 | ||||||
| 1,000,000 | 6.45%, 01/15/2018 | 1,012,400 | ||||||
| 1,000,000 | Anadarko Petroleum | |||||||
| Corporation, | ||||||||
| 6.45%, 09/15/2036 | 961,827 | |||||||
| AOL Time Warner, Inc.: | ||||||||
| 1,100,000 | 7.625%, 04/15/2031 | 1,178,508 | ||||||
| 175,000 | 7.70%, 05/01/2032 | 189,236 | ||||||
| 875,000 | AT&T Wireless Services, | |||||||
| Inc. Senior Notes, | ||||||||
| 8.75%, 03/01/2031 | 1,090,793 | |||||||
| 450,000 | British Telecom PLC, | |||||||
8.625%, 12/15/2030 f | 588,953 | |||||||
| 600,000 | Bunge Ltd. Finance | |||||||
| Corporation Notes, | ||||||||
| 5.35%, 04/15/2014 | 569,974 | |||||||
| 275,000 | Caesars Entertainment | |||||||
| Senior Notes, | ||||||||
| 7.50%, 09/01/2009 | 281,188 | |||||||
| 800,000 | Clear Channel | |||||||
| Communications Senior | ||||||||
| Unsubordinated Notes, | ||||||||
| 5.50%, 12/15/2016 | 659,168 | |||||||
| 825,000 | Comcast Corporation | |||||||
| Senior Subordinated | ||||||||
| Notes, 10.625%, | ||||||||
| 07/15/2012 | 979,633 | |||||||
| 580,000 | ConAgra Foods, Inc. | |||||||
| Senior Unsecured Notes, | ||||||||
| 5.819%, 06/15/2017 | 564,591 | |||||||
| 120,000 | ConAgra Foods, Inc. | |||||||
| Subordinated Notes, | ||||||||
| 9.75%, 03/01/2021 | 150,777 | |||||||
| Continental Airlines, Inc. | ||||||||
| Pass Thru Certificates: | ||||||||
| 9,340 | Series 1997-4, | |||||||
| 6.80%, 07/02/2007 | 9,339 | |||||||
| 19,387 | Series 1998-1, | |||||||
| 6.541%, 09/15/2009 | 19,363 | |||||||
| 124,034 | Series 2000-2, | |||||||
| 8.312%, 10/02/2012 | 127,134 | |||||||
| 423,062 | Series 1997-4, | |||||||
| 6.90%, 01/02/2018 | 431,523 | |||||||
| 1,775,000 | COX Communications | |||||||
| Inc., 7.125%, 10/01/2012 | 1,875,241 | |||||||
The accompanying notes are an integral part of these financial statements.
Page 21
Baird Aggregate Bond Fund
Schedule of Investments June 30, 2007 (Unaudited) |
Principal | |||||||
Amount | Value | ||||||
LONG-TERM INVESTMENTS – 94.1% (cont.) | |||||||
Industrial – 10.8% (cont.) | |||||||
| $ | 2,000,000 | CVS Caremark Corp., | |||||
| 5.75%, 06/01/2017 | $ | 1,929,644 | |||||
| 1,000,000 | D.R. Horton Inc. | ||||||
| Unsubordinated Notes, | |||||||
| 6.50%, 04/15/2016 | 956,765 | ||||||
| 441,000 | DaimlerChrysler Co LLC, | ||||||
| 12.375%, 05/01/2020 | 719,493 | ||||||
| 250,000 | Deutsche Telekom | ||||||
| International Finance BV, | |||||||
8.25%, 06/15/2030 f | 299,641 | ||||||
| 1,500,000 | Donnelley (R.R.) & Sons | ||||||
| Co., 6.125%, 01/15/2017 | 1,460,466 | ||||||
| 142,574 | FedEx Corporation | ||||||
| Pass Thru Certificates, | |||||||
| 6.845%, 01/15/2019 | 150,326 | ||||||
| 475,000 | Ford Capital BV | ||||||
| Debentures, 9.50%, | |||||||
06/01/2010 f | 482,125 | ||||||
| 403,000 | Ford Motor Company | ||||||
| Debentures, 9.215%, | |||||||
| 09/15/2021 | 367,737 | ||||||
| General Motors Acceptance | |||||||
| Corporation Notes: | |||||||
| 100,000 | 7.25%, 03/02/2011 | 99,672 | |||||
| 150,000 | 6.75%, 12/01/2014 | 143,648 | |||||
| 650,000 | Health Management | ||||||
| Association, | |||||||
| 6.125%, 04/15/2016 | 611,662 | ||||||
| 625,000 | Hutchison Whampoa | ||||||
| International Limited, | |||||||
| 6.25%, 01/24/2014 | |||||||
| (Acquired 06/02/2004 | |||||||
| and 02/08/2005; Cost | |||||||
| $333,834 and $298,958, | |||||||
respectively)* f | 633,842 | ||||||
| 850,000 | Johnson Controls Inc., | ||||||
| Senior Notes, | |||||||
| 6.00%, 01/15/2036 | 800,372 | ||||||
| 1,000,000 | Jones Intercable, Inc., | ||||||
| 7.625%, 04/15/2008 | 1,014,678 | ||||||
| 650,000 | Knight-Ridder, Inc., | ||||||
| 5.75%, 09/01/2017 | 556,202 | ||||||
| 400,000 | Laboratory Corporation | ||||||
| of America, | |||||||
| 5.625%, 12/15/2015 | 385,547 | ||||||
| 900,000 | Lafarge SA Notes, | ||||||
| 7.125%, 07/15/2036 | 944,706 | ||||||
| 1,000,000 | Masco Corporation, | ||||||
| 6.125%, 10/03/2016 | 983,644 | ||||||
| 1,500,000 | Nextel Communications, | ||||||
| 7.375%, 08/01/2015 | 1,499,356 | ||||||
| 320,000 | Pactiv Corporation, | ||||||
| 7.95%, 12/15/2025 | 342,603 | ||||||
| 400,000 | PCCW Capital II Ltd., | ||||||
| 6.00%, 07/15/2013 | |||||||
| (Acquired 07/10/2003; | |||||||
Cost $398,132)* f | 396,412 | ||||||
| 745,000 | Plum Creek Timberlands, | ||||||
| 5.875%, 11/15/2015 | 721,310 | ||||||
| 2,000,000 | Premcor Refining Group | ||||||
| Inc. Senior Notes, | |||||||
| 9.50%, 02/01/2013 | 2,129,530 | ||||||
| 2,000,000 | Premcor Refining Group, | ||||||
| 7.50%, 06/15/2015 | 2,062,046 | ||||||
| Qwest Capital | |||||||
| Funding, Inc.: | |||||||
| 300,000 | 7.00%, 08/03/2009 | 300,000 | |||||
| 200,000 | 7.25%, 02/15/2011 | 199,000 | |||||
The accompanying notes are an integral part of these financial statements.
Page 22
Baird Aggregate Bond Fund
Schedule of Investments June 30, 2007 (Unaudited) |
Principal | ||||||||
Amount | Value | |||||||
LONG-TERM INVESTMENTS – 94.1% (cont.) | ||||||||
Industrial – 10.8% (cont.) | ||||||||
| $ | 3,000,000 | Sealed Air Corporation | ||||||
| Senior Notes, 5.375%, | ||||||||
| 04/15/2008 (Acquired | ||||||||
| 04/09/2003, 06/04/2007 | ||||||||
| and 06/06/2007; Cost | ||||||||
| $248,650, $2,494,950 | ||||||||
| and $249,488, | ||||||||
| respectively)* | $ | 2,983,644 | ||||||
| 358,000 | Sprint Capital | |||||||
| Corporation, | ||||||||
| 8.75%, 03/15/2032 | 402,081 | |||||||
| 957,083 | System Energy Resources, | |||||||
| 5.129%, 01/15/2014 | 925,901 | |||||||
| 680,000 | TCI Communications, | |||||||
| Inc. Debentures, | ||||||||
| 7.875%, 08/01/2013 | 745,124 | |||||||
| 2,100,000 | Telecom Italia Capital, | |||||||
7.20%, 07/18/2036 f | 2,158,932 | |||||||
| 2,000,000 | Telefonica Emisiones SA, | |||||||
6.221%, 07/03/2017 f | 1,994,992 | |||||||
| 1,000,000 | Teva Pharmaceutical | |||||||
| Finance LLC, | ||||||||
| 5.55%, 02/01/2016 | 958,186 | |||||||
| 1,000,000 | Time Warner Cable, Inc., | |||||||
| 6.55%, 05/01/2037 | ||||||||
| (Acquired 04/04/2007; | ||||||||
| Cost $993,560)* | 966,507 | |||||||
| Tyco International | ||||||||
Group S.A.: f | ||||||||
| 1,468,000 | 6.125%, 01/15/2009 | 1,486,657 | ||||||
| 875,000 | 6.375%, 10/15/2011 | 901,391 | ||||||
| 300,000 | 6.00%, 11/15/2013 | 308,051 | ||||||
| United AirLines, Inc. | ||||||||
| Pass Thru Certificates: | ||||||||
| 634,471 | 6.201%, 09/01/2008 | 640,816 | ||||||
| 269,803 | 7.762%, 12/31/2049 | 249,062 | ||||||
| 1,487,000 | Univision | |||||||
| Communication, Inc., | ||||||||
| 3.50%, 10/15/2007 | 1,472,130 | |||||||
| 479,154 | U.S. Airways Pass Thru | |||||||
| Certificate, Series 1998-1, | ||||||||
| 6.85%, 01/30/2018 | 497,122 | |||||||
Vale Overseas Limited: f | ||||||||
| 350,000 | 8.25%, 01/17/2034 | 409,395 | ||||||
| 1,400,000 | 6.875%, 11/21/2036 | 1,407,260 | ||||||
| 675,000 | Viacom, Inc., | |||||||
| 7.70%, 07/30/2010 | 713,748 | |||||||
| 1,875,000 | Vodafone Group PLC, | |||||||
6.15%, 02/27/2037 f | 1,744,294 | |||||||
| 1,000,000 | Wal-Mart Stores, | |||||||
| 5.25%, 09/01/2035 | 874,149 | |||||||
| 54,789,247 | ||||||||
International | ||||||||
(U.S. $ Denominated) – 0.7% | ||||||||
| Corp Andina | ||||||||
De Fomento Notes: f | ||||||||
| 50,000 | 7.375%, 01/18/2011 | 52,679 | ||||||
| 340,000 | 5.75%, 01/12/2017 | 333,777 | ||||||
| Korea Electric | ||||||||
Power Corporation: f | ||||||||
| 100,000 | 7.75%, 04/01/2013 | 109,748 | ||||||
| 2,165,000 | 6.70%, 08/01/2027 | 2,370,796 | ||||||
| 510,000 | National Bank of | |||||||
| Hungary Yankee | ||||||||
| Debentures, | ||||||||
8.875%, 11/01/2013 f | 596,357 | |||||||
| 301,000 | United Mexican | |||||||
| States Notes, | ||||||||
6.75%, 09/27/2034 f | 321,016 | |||||||
| 3,784,373 | ||||||||
The accompanying notes are an integral part of these financial statements.
Page 23
Baird Aggregate Bond Fund
Schedule of Investments June 30, 2007 (Unaudited) |
Principal | |||||||
Amount | Value | ||||||
LONG-TERM INVESTMENTS – 94.1% (cont.) | |||||||
Mortgage Backed Securities – 37.7% | |||||||
| Bank of America | |||||||
| Alternative Loan Trust: | |||||||
| $ | 645,024 | Series 2003-4, Class 2A1, | |||||
| 5.00%, 06/25/2018 | $ | 634,037 | |||||
| 910,060 | Series 2003-11, Class 4A1, | ||||||
| 4.75%, 01/25/2019 | 865,126 | ||||||
| 685,592 | Series 2004-6, Class 4A1, | ||||||
| 5.00%, 07/25/2019 | 671,962 | ||||||
| 705,141 | Series 2004-11, Class 4A1, | ||||||
| 5.50%, 12/25/2019 | 691,479 | ||||||
| 1,145,976 | Series 2005-2, Class 4A1, | ||||||
| 5.50%, 03/25/2020 | 1,138,128 | ||||||
| 4,903,962 | Series 2007-1, Class 1A1, | ||||||
| 6.103%, 04/25/2022 | 4,910,112 | ||||||
| 2,000,034 | Series 2003-11, Class 2A1, | ||||||
| 6.00%, 01/25/2034 | 1,989,558 | ||||||
| 1,162,135 | Series 2005-2, Class 1CB2, | ||||||
| 5.50%, 03/25/2035 | 1,147,399 | ||||||
| 1,417,085 | Series 2005-9, Class 1CB3, | ||||||
| 5.50%, 10/25/2035 | 1,400,336 | ||||||
| 848,594 | Series 2005-11, Class | ||||||
| 1CB4, 5.50%, 12/25/2035 | 838,515 | ||||||
| 2,717,250 | Series 2006-5, Class CB7, | ||||||
| 6.00%, 06/25/2036 | 2,713,224 | ||||||
| Chase Mortgage | |||||||
| Finance Corporation: | |||||||
| 1,113,689 | Series 2003-S13, Class | ||||||
| A11, 5.50%, 11/25/2033 | 1,106,009 | ||||||
| 2,000,000 | Series 2006-A1, Class 2A3, | ||||||
| 6.00%, 09/25/2036 | 1,995,112 | ||||||
| 771,819 | Citicorp Mortgage | ||||||
| Securities, Inc., | |||||||
| Series 2004-3, Class A2, | |||||||
| 5.25%, 05/25/2034 | 759,001 | ||||||
| 1,957,974 | Citigroup Mortgage | ||||||
| Loan Trust, Inc., | |||||||
| Series 2005-9, Class 2A2, | |||||||
| 5.50%, 11/25/2035 | 1,945,336 | ||||||
| Countrywide Alternative | |||||||
| Loan Trust: | |||||||
| 1,841,991 | Series 2005-50CB, Class | ||||||
| 4A1, 5.00%, 11/25/2020 | 1,814,869 | ||||||
| 4,412,912 | Series 2006-7CB, Class | ||||||
| 3A1, 5.25%, 05/25/2021 | 4,356,467 | ||||||
| 2,027,300 | Series 2006-J5, Class 3A1, | ||||||
| 6.116%, 07/25/2021 | 2,037,990 | ||||||
| 2,764,422 | Series 2006-43CB, Class | ||||||
| 2A1, 6.00%, 02/25/2022 | 2,768,072 | ||||||
| 1,500,000 | Series 2005-10CB, Class | ||||||
| 1A6, 5.50%, 05/25/2035 | 1,469,979 | ||||||
| 919,025 | Countrywide Home | ||||||
| Loans, Inc., Series | |||||||
| 2003-39, Class A5, | |||||||
| 5.00%, 05/25/2012 | 908,077 | ||||||
| 1,573,639 | CS First Boston | ||||||
| Mortgage Securities Corp., | |||||||
| Series 2004-4, Class 2A5, | |||||||
| 5.50%, 06/25/2015 | 1,558,690 | ||||||
| 2,420,545 | Deutsche Securities Inc. | ||||||
| Mortgage, Series | |||||||
| 2006-AR5, Class 21A, | |||||||
| 6.00%, 10/25/2021 | 2,431,711 | ||||||
| Federal Gold Loan | |||||||
| Mortgage Corporation | |||||||
| (FGLMC): | |||||||
| 1,903,299 | 6.00%, 06/01/2020 | 1,914,161 | |||||
| 966,237 | 5.00%, 06/01/2023 | 924,683 | |||||
| 2,024,996 | 6.50%, 06/01/2029 | 2,068,640 | |||||
| 2,757,478 | 5.50%, 01/01/2036 | 2,665,738 | |||||
| 5,612,868 | 6.00%, 12/01/2036 | 5,565,207 | |||||
The accompanying notes are an integral part of these financial statements.
Page 24
Baird Aggregate Bond Fund
Schedule of Investments June 30, 2007 (Unaudited) |
Principal | |||||||
Amount | Value | ||||||
LONG-TERM INVESTMENTS – 94.1% (cont.) | |||||||
Mortgage Backed Securities – 37.7% (cont.) | |||||||
| Federal Home Loan | |||||||
| Mortgage Corporation | |||||||
| (FHLMC): | |||||||
| $ | 260,543 | 6.50%, 07/01/2014 | $ | 266,493 | |||
| 863,591 | 5.50%, 11/01/2022 | 844,489 | |||||
| 750,570 | 5.50%, 07/01/2023 | 734,018 | |||||
| 1,168,428 | Series 3124, Class VP, | ||||||
| 6.00%, 06/15/2014 | 1,179,289 | ||||||
| 527,630 | Series 2695, Class UA, | ||||||
| 5.50%, 09/15/2014 | 525,045 | ||||||
| 2,052,259 | Series R007, Class AC, | ||||||
| 5.875%, 05/15/2016 | 2,050,164 | ||||||
| 2,378,645 | Series R003, Class VA, | ||||||
| 5.50%, 08/15/2016 | 2,365,194 | ||||||
| 2,560,632 | Series 3097, Class MC, | ||||||
| 6.00%, 11/15/2016 | 2,577,736 | ||||||
| 785,605 | Series 2391, Class QR, | ||||||
| 5.50%, 12/15/2016 | 783,240 | ||||||
| 14,277 | Series 2533, Class PC, | ||||||
| 5.00%, 10/15/2017 | 14,252 | ||||||
| 4,452,182 | Series R009, Class AJ, | ||||||
| 5.75%, 12/15/2018 | 4,416,619 | ||||||
| 244,014 | Series 206, Class E, | ||||||
| 0.00%, 07/15/2019 ^ | 241,087 | ||||||
| 951,127 | Series R010, Class AB, | ||||||
| 5.50%, 12/15/2019 | 937,724 | ||||||
| 124,349 | Series 141, Class D, | ||||||
| 5.00%, 05/15/2021 | 123,661 | ||||||
| 100,959 | Series 1074, Class I, | ||||||
| 6.75%, 05/15/2021 | 100,785 | ||||||
| 669,458 | Series 1081, Class K, | ||||||
| 7.00%, 05/15/2021 | 692,242 | ||||||
| 114,954 | Series 163, Class F, | ||||||
| 7.83%, 07/15/2021 | 114,392 | ||||||
| 219,117 | Series 188, Class H, | ||||||
| 7.00%, 09/15/2021 | 218,035 | ||||||
| 101,203 | Series 1286, Class A, | ||||||
| 6.00%, 05/15/2022 | 101,026 | ||||||
| 2,600,000 | Series 1694, Class PK, | ||||||
| 6.50%, 03/15/2024 | 2,667,661 | ||||||
| 43,499 | Series 2141, Class N, | ||||||
| 5.55%, 11/15/2027 | 43,435 | ||||||
| 1,075,000 | Series 2664, Class LG, | ||||||
| 5.50%, 07/15/2028 | 1,068,281 | ||||||
| Federal National Mortgage | |||||||
| Association (FNMA): | |||||||
| 1,440,478 | 5.50%, 07/01/2015 | 1,423,614 | |||||
| 2,459,266 | 5.00%, 02/01/2018 | 2,385,427 | |||||
| 3,045,882 | 5.00%, 12/01/2019 | 2,954,840 | |||||
| 870,373 | 5.50%, 01/01/2023 | 851,121 | |||||
| 2,662,035 | 5.50%, 07/01/2023 | 2,602,733 | |||||
| 2,522,200 | 6.00%, 03/01/2026 | 2,517,813 | |||||
| 8,366,862 | 6.00%, 05/01/2026 | 8,352,309 | |||||
| 714,641 | 6.00%, 03/01/2033 | 711,329 | |||||
| 549,399 | 5.00%, 11/01/2033 | 517,515 | |||||
| 980,794 | 6.00%, 11/01/2034 | 973,600 | |||||
| 3,142,389 | 5.50%, 02/01/2035 | 3,042,414 | |||||
| 4,057,188 | 5.00%, 11/01/2035 | 3,811,909 | |||||
| 17,020,055 | 5.50%, 04/01/2036 | 16,457,232 | |||||
| 2,362,830 | 5.50%, 11/01/2036 | 2,280,030 | |||||
| 2,506,581 | Series 2006-B2, Class AB, | ||||||
| 5.50%, 05/25/2014 | 2,490,507 | ||||||
| 1,000,000 | Series 2003-27, Class OJ, | ||||||
| 5.00%, 07/25/2015 | 989,385 | ||||||
| 500,000 | Series 2003-24, Class PC, | ||||||
| 5.00%, 11/25/2015 | 494,432 | ||||||
| 104,704 | Series 2002-56, Class MC, | ||||||
| 5.50%, 09/25/2017 | 104,088 | ||||||
| 497,571 | Series 1989-37, Class G, | ||||||
| 8.00%, 07/25/2019 | 526,620 | ||||||
| 102,141 | Series 1989-94, Class G, | ||||||
| 7.50%, 12/25/2019 | 106,787 | ||||||
The accompanying notes are an integral part of these financial statements.
Page 25
Baird Aggregate Bond Fund
Schedule of Investments June 30, 2007 (Unaudited) |
Principal | |||||||
Amount | Value | ||||||
LONG-TERM INVESTMENTS – 94.1% (cont.) | |||||||
Mortgage Backed Securities – 37.7% (cont.) | |||||||
| $ | 24,085 | Series 1990-58, Class J, | |||||
| 7.00%, 05/25/2020 | $ | 24,851 | |||||
| 265,874 | Series 1990-76, Class G, | ||||||
| 7.00%, 07/25/2020 | 272,269 | ||||||
| 106,157 | Series 1990-105, Class J, | ||||||
| 6.50%, 09/25/2020 | 107,136 | ||||||
| 39,819 | Series 1990-108, Class G, | ||||||
| 7.00%, 09/25/2020 | 40,477 | ||||||
| 40,587 | Series 1991-1, Class G, | ||||||
| 7.00%, 01/25/2021 | 41,410 | ||||||
| 87,077 | Series 1991-86, Class Z, | ||||||
| 6.50%, 07/25/2021 | 88,205 | ||||||
| 343,018 | Series 2003-28, Class KA, | ||||||
| 4.25%, 03/25/2022 | 329,177 | ||||||
| 39,812 | Series G92-30, Class Z, | ||||||
| 7.00%, 06/25/2022 | 40,892 | ||||||
| 1,053,201 | Series 1993-58, Class H, | ||||||
| 5.50%, 04/25/2023 | 1,043,933 | ||||||
| 31,295 | Series 2003-17, Class QR, | ||||||
| 4.50%, 11/25/2025 | 31,044 | ||||||
| 770,682 | Series 2003-31, Class KG, | ||||||
| 4.50%, 12/25/2028 | 763,474 | ||||||
| 673,839 | Series 1998-66, Class C, | ||||||
| 6.00%, 12/25/2028 | 668,590 | ||||||
| 106,937 | Series 2003-44, Class AB, | ||||||
| 3.75%, 05/25/2033 | 98,143 | ||||||
| 2,857,642 | Series 2004-W6, Class | ||||||
| 1A4, 5.50%, 07/25/2034 | 2,843,492 | ||||||
| 3,142,209 | Series 2004-W6, Class | ||||||
| 1A6, 5.50%, 07/25/2034 | 3,104,894 | ||||||
| 2,500,000 | Series 2004-W10, Class | ||||||
| A24, 5.00%, 08/25/2034 | 2,466,816 | ||||||
| First Horizon Alternative | |||||||
| Mortgage Securities: | |||||||
| 1,376,688 | Series 2005-FA7, Class | ||||||
| 2A1, 5.00%, 09/25/2020 | 1,354,842 | ||||||
| 2,219,795 | Series 2006-FA6, | ||||||
| Class 3A1, | |||||||
| 5.75%, 11/25/2021 | 2,209,627 | ||||||
| 3,810,524 | Series 2006-FA8, | ||||||
| Class 2A1, | |||||||
| 5.75%, 02/25/2037 | 3,792,270 | ||||||
| 2,750,000 | First Union National Bank | ||||||
| Commercial Mortgage | |||||||
| Securities Inc., Series | |||||||
| 2001-C4, Class A2, | |||||||
| 6.223%, 12/12/2033 | 2,806,256 | ||||||
| GE Capital Commercial | |||||||
| Mortgage Corporation: | |||||||
| 6,447,661 | Series 2000-1, Class A2, | ||||||
| 6.496%, 01/15/2033 | 6,610,367 | ||||||
| 1,200,000 | Series 2002-3A, Class AZ, | ||||||
| 4.996%, 12/10/2037 | 1,167,721 | ||||||
| 2,500,000 | Series 2004-C3, Class A4, | ||||||
| 5.189%, 07/10/2039 | 2,417,846 | ||||||
| 5,200,000 | GMAC Commercial | ||||||
| Mortgage Securities, Inc., | |||||||
| Series 2003-C1, Class A2, | |||||||
| 4.079%, 05/10/2036 | 4,803,163 | ||||||
| Government National | |||||||
| Mortgage Association | |||||||
| (GNMA): | |||||||
| 800,000 | Series 2004-78, Class C, | ||||||
| 4.658%, 04/16/2029 | 763,117 | ||||||
| 581,061 | 6.00%, 11/20/2033 | 579,197 | |||||
| 1,285,000 | Series 2004-100, Class B, | ||||||
| 4.603%, 02/16/2043 | 1,220,486 | ||||||
| 1,610,777 | J.P. Morgan Alternative | ||||||
| Loan Trust, Series | |||||||
| 2006-A1, Class 2A1, | |||||||
| 5.797%, 03/25/2036 | 1,609,040 | ||||||
The accompanying notes are an integral part of these financial statements.
Page 26
Baird Aggregate Bond Fund
Schedule of Investments June 30, 2007 (Unaudited) |
Principal | |||||||
Amount | Value | ||||||
LONG-TERM INVESTMENTS – 94.1% (cont.) | |||||||
Mortgage Backed Securities – 37.7% (cont.) | |||||||
| J.P. Morgan | |||||||
| Mortgage Trust: | |||||||
| $ | 3,000,000 | Series 2006-A7, | |||||
| Class 2A4R, 5.462%, | |||||||
| 01/25/2037 | $ | 2,966,159 | |||||
| 4,000,000 | Series 2007-A2, | ||||||
| Class 2A3, | |||||||
| 5.718%, 04/25/2037 | 3,966,133 | ||||||
| 999,771 | Master Alternative Loans | ||||||
| Trust, Series 2003-5, Class | |||||||
| 6A1, 6.00%, 08/25/2033 | 990,067 | ||||||
| 2,000,000 | Regions Funding Trust II, | ||||||
| 6.625%, 05/15/2047 | 1,913,134 | ||||||
| 840,921 | Residential Accredit Loans, | ||||||
| Inc., Series 2004-QS6, | |||||||
| Class A1, 5.00%, | |||||||
| 05/25/2019 | 825,285 | ||||||
| 800,000 | Residential Funding | ||||||
| Mortgage Security I, | |||||||
| Series 2003-S11, Class A2, | |||||||
| 4.00%, 06/25/2018 | 754,114 | ||||||
| 2,082,160 | Salomon Brothers | ||||||
| Mortgage Securities VII, | |||||||
| Series 2003-UP2, Class A2, | |||||||
| 4.00%, 06/25/2033 | 1,994,940 | ||||||
| 1,800,000 | Wachovia Bank | ||||||
| Commercial Mortgage | |||||||
| Trust, Series 2003-C3, | |||||||
| Class A2, 4.867%, | |||||||
| 02/15/2035 | 1,730,000 | ||||||
| Washington Mutual, Inc. | |||||||
| Pass-Through Certificates: | |||||||
| 2,687,792 | Series 2004-CB1, Class | ||||||
| 5A, 5.00%, 06/25/2019 | 2,583,640 | ||||||
| 1,852,938 | Series 2004-CB3, Class | ||||||
| 4A, 6.00%, 10/25/2019 | 1,853,573 | ||||||
| 1,181,389 | Series 2004-CB4, Class | ||||||
| 21A, 5.50%, 12/25/2019 | 1,174,220 | ||||||
| 190,998,191 | |||||||
Taxable Municipal Bonds – 0.9% | |||||||
| 1,000,000 | Cuyahoga County | ||||||
| Ohio Industrial | |||||||
| Development Revenue, | |||||||
| 9.125%, 10/01/2023 | 1,161,740 | ||||||
| 2,225,000 | Tobacco Settlement | ||||||
| Authority Iowa, | |||||||
| 6.50%, 06/01/2023 | 2,194,295 | ||||||
| Tobacco Settlement | |||||||
| Financing Corporation: | |||||||
| 300,000 | 5.92%, 06/01/2012 | 299,220 | |||||
| 760,730 | 6.36%, 05/15/2025 | 760,023 | |||||
| 4,415,278 | |||||||
Utilities – 5.4% | |||||||
| 1,025,000 | American Electric Power, | ||||||
| Inc., 5.75%, 08/16/2007 | 1,023,936 | ||||||
| 466,000 | Beaver Valley Funding | ||||||
| Corporation Debentures, | |||||||
| 9.00%, 06/01/2017 | 519,343 | ||||||
| 1,000,000 | Canadian National | ||||||
| Resources, | |||||||
| 6.25%, 03/15/2038 | 946,184 | ||||||
| Dominion Resources, Inc.: | |||||||
| 500,000 | 7.195%, 09/15/2014 | 546,174 | |||||
| 1,147,000 | 6.75%, 12/15/2032 | 1,232,872 | |||||
| 1,000,000 | Duke Capital LLC Notes, | ||||||
| 5.668%, 08/15/2014 | 964,555 | ||||||
| 750,000 | Energy Transfer Partners, | ||||||
| 5.65%, 08/01/2012 | 741,259 | ||||||
| 300,000 | Exelon Corporation | ||||||
| Senior Notes, | |||||||
| 6.75%, 05/01/2011 | 309,096 | ||||||
The accompanying notes are an integral part of these financial statements.
Page 27
Baird Aggregate Bond Fund
Schedule of Investments June 30, 2007 (Unaudited) |
Principal | |||||||
Amount | Value | ||||||
LONG-TERM INVESTMENTS – 94.1% (cont.) | |||||||
Utilities – 5.4% (cont.) | |||||||
| $ | 2,250,000 | Kinder Morgan | |||||
| Energy Partners, | |||||||
| 6.95%, 01/15/2038 | $ | 2,272,581 | |||||
| 600,000 | Kinder Morgan Energy | ||||||
| Partners Senior Notes, | |||||||
| 6.30%, 02/01/2009 | 606,437 | ||||||
| 900,000 | Kinder Morgan Finance, | ||||||
5.70%, 01/05/2016 f | 829,509 | ||||||
| 234,828 | Kiowa Power Partners LLC, | ||||||
| 4.811%, 12/30/2013 | |||||||
| (Acquired 11/19/2004; | |||||||
| Cost $241,999)* | 226,017 | ||||||
| 750,000 | MidAmerican Energy | ||||||
| Holdings Company | |||||||
| Senior Notes, | |||||||
| 7.63%, 10/15/2007 | 753,991 | ||||||
| 1,325,000 | National Grid PLC | ||||||
| Senior Unsecured Notes, | |||||||
6.30%, 08/01/2016 f | 1,349,180 | ||||||
| 1,550,000 | NiSource Finance | ||||||
| Corporation, | |||||||
| 7.875%, 11/15/2010 | 1,650,414 | ||||||
| 650,000 | Ocean Energy Inc., | ||||||
| 4.375%, 10/01/2007 | 648,101 | ||||||
| 425,000 | ONEOK, Inc. | ||||||
| Senior Notes, | |||||||
| 7.125%, 04/15/2011 | 443,515 | ||||||
| 850,000 | Pacific Gas & Electric | ||||||
| Company 1st Mortgage, | |||||||
| 6.05%, 03/01/2034 | 823,386 | ||||||
| 1,000,000 | Plains All American | ||||||
| Pipeline Senior Notes, | |||||||
| 5.625%, 12/15/2013 | 980,793 | ||||||
| 300,000 | PPL Energy Supply, LLC | ||||||
| Senior Notes, | |||||||
| 6.40%, 11/01/2011 | 304,705 | ||||||
| 175,000 | PSE&G Energy Holdings | ||||||
| LLC Senior Notes, | |||||||
| 8.50%, 06/15/2011 | 185,354 | ||||||
| PSE&G Power LLC: | |||||||
| 250,000 | 7.75%, 04/15/2011 | 266,904 | |||||
| 350,000 | 5.00%, 04/01/2014 | 331,078 | |||||
| 1,608,698 | RGS (I&M) Funding | ||||||
| Corporation Debentures, | |||||||
| 9.82%, 12/07/2022 | 1,918,919 | ||||||
| 1,400,000 | Southern Natural Gas, | ||||||
| 5.90%, 04/01/2017 | |||||||
| (Acquired 03/14/2007; | |||||||
| Cost $1,397,676)* | 1,354,105 | ||||||
| 3,000,000 | System Energy Resources | ||||||
| 1st Mortgage, | |||||||
| 4.875%, 10/01/2007 | 2,994,702 | ||||||
| 700,000 | Transcontinental Gas | ||||||
| Pipe Line Corporation | |||||||
| Senior Notes, | |||||||
| 8.875%, 07/15/2012 | 784,000 | ||||||
| 179,192 | Tristate Gen & Trans Assn, | ||||||
| 6.04%, 01/31/2018 | |||||||
| (Acquired 10/14/2003; | |||||||
| Cost $179,192)* | 177,032 | ||||||
| 500,000 | Vectren Utility Holdings, | ||||||
| 6.625%, 12/01/2011 | 514,237 | ||||||
| 1,200,000 | Verizon Communications | ||||||
| Debentures, | |||||||
| 6.84%, 04/15/2018 | 1,261,015 | ||||||
| 550,000 | Williams Companies, | ||||||
| Inc. Notes, | |||||||
| 8.125%, 03/15/2012 | 583,687 | ||||||
| 27,543,081 | |||||||
The accompanying notes are an integral part of these financial statements.
Page 28
Baird Aggregate Bond Fund
Schedule of Investments June 30, 2007 (Unaudited) |
Principal | |||||||
Amount | Value | ||||||
LONG-TERM INVESTMENTS – 94.1% (cont.) | |||||||
U.S. Government Agency Issues – 7.1% | |||||||
| Federal National Mortgage | |||||||
| Association (FNMA): | |||||||
| $ | 32,925,000 | 6.00%, 05/15/2011 | $ | 33,791,422 | |||
| 2,275,988 | 5.50%, 09/01/2034 | 2,203,578 | |||||
| 35,995,000 | |||||||
U.S. Treasury Obligations – 10.8% | |||||||
| 49,300,000 | U.S. Treasury Bond, | ||||||
| 6.25%, 08/15/2023 | 54,742,276 | ||||||
| Total Long-Term | |||||||
| Investments | |||||||
| (Cost $483,024,625) | 477,224,243 | ||||||
COLLATERAL POOL INVESTMENT | |||||||
FOR SECURITIES ON LOAN – 28.8% | |||||||
| (Cost $146,071,574) | |||||||
| (Please Refer to Note 6) | 146,071,574 | ||||||
Shares | |||||||
SHORT-TERM INVESTMENTS – 4.9% | |||||||
Money Market Funds – 4.9% | |||||||
| 19,090,708 | Short-Term Investment | ||||||
| Company Liquid Assets | |||||||
| Portfolio – AIM Fund | 19,090,708 | ||||||
| 5,647,102 | Short-Term Investment | ||||||
| Trust Prime Portfolio – | |||||||
| AIM Fund | 5,647,102 | ||||||
| Total Short-Term | |||||||
| Investments | |||||||
| (Cost $24,737,810) | 24,737,810 | ||||||
| Total Investments | |||||||
| (Cost $653,834,009) – | |||||||
| 127.8% | 648,033,627 | ||||||
| Liabilities in Excess of | |||||||
| Other Assets – (27.8)% | (140,874,992 | ) | |||||
| TOTAL NET | |||||||
| ASSETS – 100.0% | $ | 507,158,635 | |||||
^ Non-Income Producing
* Restricted Security Deemed Liquid
The accompanying notes are an integral part of these financial statements.
Page 29
Baird Intermediate Municipal Bond Fund
The Baird Intermediate Municipal Bond Fund seeks current income that is substantially exempt from federal income tax. A secondary objective is to provide total return with relatively low volatility of principal. The Fund strives to achieve an annual rate of return, before Fund expenses, greater than the annual rate of the total return of the Lehman Brothers 7-Year General Obligation Bond Index. The Lehman Brothers 7-Year General Obligation Bond Index is an unmanaged, market value weighted index consisting of investment grade state and local general obligation bonds that have been issued as part of an offering of at least $50 million; have a minimum amount outstanding of at least $5 million; have been issued within the last five years; and have a maturity of six to eight years.
Portfolio Characteristics
Quality Distribution* | Sector Weightings* |
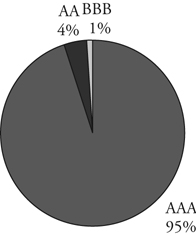 | 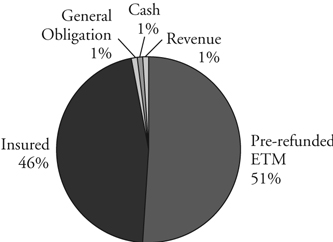 |
Net Assets: | $ | 65,086,668 | Annualized Expense Ratio: | |||||||
SEC 30-Day Yield:** | Institutional Class: | 0.30 | % | |||||||
| Institutional Class: | 4.04% | Investor Class: | 0.55 | %*** | ||||||
| Investor Class: | 3.79% | Portfolio Turnover Rate:**** | 1.5 | % | ||||||
Average Effective Duration: | 4.83 years | Total Number of Holdings: | 60 | |||||||
Average Effective Maturity: | 5.76 years | |||||||||
| * | Percentages shown are based on the Fund’s total net assets. |
| ** | SEC yields are based on SEC guidelines and are calculated for the 30 days ended June 30, 2007. |
| *** | Includes 0.25% 12b-1 fee. |
| **** | Not annualized. |
Page 30
Baird Intermediate Municipal Bond Fund
Average Annual Total Returns
Since | |||
For the Periods Ended June 30, 2007 | One Year | Five Years | Inception(1) |
| Baird Intermediate Municipal Bond Fund – Institutional Class Shares | 4.16% | 3.67% | 4.54% |
| Baird Intermediate Municipal Bond Fund – Investor Class Shares | 3.82% | 3.43% | 4.28% |
Lehman Brothers 7-Year General Obligation Bond Index(2) | 4.14% | 3.92% | 4.36% |
(1) | For the period from March 30, 2001 (commencement of operations) through June 30, 2007. |
(2) | The Lehman Brothers 7-Year General Obligation Bond Index is an unmanaged, market value weighted index comprised of investment grade state and local general obligation bonds that have been issued as part of an offering of at least $50 million, have a minimum amount outstanding of at least $5 million, have been issued within the last five years and have a maturity of six to eight years. This index does not reflect any deduction for fees, expenses or taxes. A direct investment in an index is not possible. |
The returns shown in the table above reflect reinvestment of dividends and/or capital gains distributions in additional shares. The returns do not reflect the deduction of taxes that a shareholder would pay on Fund distributions or the redemption of Fund shares.
Past performance does not guarantee future results. Investment return and principal value will fluctuate so that an investor’s shares, when redeemed, may be worth more or less than their original cost.
For information about the performance of the Fund as of the most recent month-end, please call 1-866-44BAIRD or visit www.bairdfunds.com. Mutual fund performance changes over time and current performance may be lower or higher than that stated.
Page 31
Schedule of Investments June 30, 2007 (Unaudited) |
Principal | |||||||
Amount | Value | ||||||
MUNICIPAL BONDS – 96.5% | |||||||
Arizona – 2.4% | |||||||
| $ | 1,415,000 | Arizona Health Facilities | |||||
| Authority Hospital | |||||||
| Revenue, 6.375%, | |||||||
| 12/01/2037 (Pre-refunded | |||||||
| to 12/01/2012) | $ | 1,580,230 | |||||
Arkansas – 0.8% | |||||||
| 500,000 | Springdale Arkansas Sales | ||||||
| & Use Tax Revenue, 4.00%, | |||||||
| 07/01/2016 (Pre-refunded | |||||||
| to various dates) | 498,855 | ||||||
California – 1.3% | |||||||
| 500,000 | Golden State Tobacco | ||||||
| Securitization Corporation, | |||||||
| 6.25%, 06/01/2033 | 543,785 | ||||||
| 290,000 | Santa Rosa California | ||||||
| Hospital Revenue, 10.30%, | |||||||
| 03/01/2011 (ETM) | 327,964 | ||||||
| 871,749 | |||||||
Colorado – 3.9% | |||||||
| 2,000,000 | Adams County Colorado | ||||||
| Single Family Mortgage | |||||||
| Revenue, 8.875%, | |||||||
| 08/01/2012 (ETM) | 2,439,400 | ||||||
| 90,000 | Colorado Springs Colorado | ||||||
| Utilities Revenue, 5.80%, | |||||||
| 11/15/2010 (ETM) | 92,556 | ||||||
| 2,531,956 | |||||||
Delaware – 2.5% | |||||||
| 1,500,000 | Delaware State Economic | ||||||
| Development Authority | |||||||
| Revenue, 6.75%, | |||||||
| 01/01/2013 (ETM) | 1,629,090 | ||||||
Florida – 2.7% | |||||||
| 300,000 | Jacksonville Florida Health | ||||||
| Facility Authority Hospital | |||||||
| Revenue, 11.50%, | |||||||
| 10/01/2012 (ETM) | 403,332 | ||||||
| 210,000 | Orange County Florida | ||||||
| Health Revenue, 8.75%, | |||||||
| 10/01/2009 (ETM) | 221,733 | ||||||
| 1,000,000 | Orlando Florida Utilities | ||||||
| Commission Water & | |||||||
| Electric Revenue, 6.75%, | |||||||
| 10/01/2017 (ETM) | 1,164,030 | ||||||
| 1,789,095 | |||||||
Georgia – 1.8% | |||||||
| 1,020,000 | Fulton County Georgia | ||||||
| Hospital Authority | |||||||
| Revenue, 7.875%, | |||||||
| 10/01/2013 (ETM) | 1,166,166 | ||||||
Illinois – 8.5% | |||||||
| 1,000,000 | Chicago Illinois General | ||||||
| Obligation Project and | |||||||
| Refunding, 5.00%, | |||||||
| 01/01/2017 (FSA Insured) | 1,051,520 | ||||||
| 1,440,000 | Chicago Illinois | ||||||
| Metropolitan Water | |||||||
| Reclamation District | |||||||
| General Obligation, 7.00%, | |||||||
| 12/01/2010 (ETM) | 1,580,040 | ||||||
| 1,430,000 | Cook County Illinois | ||||||
| School District No. 100, | |||||||
| 8.10%, 12/01/2016 (ETM) | 1,859,572 | ||||||
| 1,000,000 | Lake County Community | ||||||
| High School District No. | |||||||
| 128, 5.00%, 01/01/2013 | 1,044,330 | ||||||
| 5,535,462 | |||||||
The accompanying notes are an integral part of these financial statements.
Page 32
Baird Intermediate Municipal Bond Fund
Schedule of Investments June 30, 2007 (Unaudited) |
Principal | |||||||
Amount | Value | ||||||
MUNICIPAL BONDS – 96.5% (cont.) | |||||||
Indiana – 0.5% | |||||||
| $ | 285,000 | Indiana Toll Road | |||||
| Commission, 9.00%, | |||||||
| 01/01/2015 (ETM) | $ | 352,211 | |||||
Iowa – 2.4% | |||||||
| 1,010,000 | Des Moines Iowa | ||||||
| Metropolitan Wastewater | |||||||
| Reclamation Authority, | |||||||
| 5.00%, 06/01/2015 | |||||||
| (MBIA Insured) | 1,066,641 | ||||||
| 470,000 | Muscatine Iowa Electric | ||||||
| Revenue, 6.70%, | |||||||
| 01/01/2013 (ETM) | 503,441 | ||||||
| 1,570,082 | |||||||
Louisiana – 6.1% | |||||||
| 745,000 | Denham Springs-Livingston | ||||||
| Housing and Mortgage | |||||||
| Finance Authority, 7.20%, | |||||||
| 08/01/2010 (ETM) | 814,151 | ||||||
| 400,000 | Houma-Terrebonne Public | ||||||
| Trust Financing Authority, | |||||||
| 7.30%, 04/01/2010 (ETM) | 433,240 | ||||||
| 1,000,000 | Houma-Terrebonne Public | ||||||
| Trust Financing Authority | |||||||
| Single Family Mortgage | |||||||
| Revenue, 7.30%, | |||||||
| 04/01/2011 (ETM) | 1,109,790 | ||||||
| 1,450,000 | Jefferson Parish Louisiana | ||||||
| Home Mortgage | |||||||
| Authority, 7.10%, | |||||||
| 08/01/2010 (ETM) | 1,583,502 | ||||||
| 3,940,683 | |||||||
Minnesota – 1.0% | |||||||
| 600,000 | Western Minnesota | ||||||
| Municipal Power | |||||||
| Agency, 6.375%, | |||||||
| 01/01/2016 (ETM) | 651,462 | ||||||
Mississippi – 1.6% | |||||||
| 600,000 | Mississippi Housing | ||||||
| Financial Corporation, | |||||||
| 0.00%, 06/01/2015 | |||||||
| (ETM) ^ | 429,624 | ||||||
| 595,000 | Mississippi State, 6.20%, | ||||||
| 02/01/2008 (ETM) | 602,241 | ||||||
| 1,031,865 | |||||||
Nevada – 3.2% | |||||||
| 1,965,000 | Reno Nevada Capital | ||||||
| Improvement Revenue, | |||||||
| 5.50%, 06/01/2019 | |||||||
| (Pre-refunded to | |||||||
| 06/01/2012) | 2,093,236 | ||||||
New Jersey – 2.3% | |||||||
| 1,000,000 | New Jersey State | ||||||
| Transportation Trust Fund | |||||||
| Authority, 6.00%, | |||||||
| 12/15/2017 (Pre-refunded | |||||||
| 12/15/2011) | 1,083,630 | ||||||
| New Jersey State Turnpike | |||||||
| Authority: (ETM) | |||||||
| 262,000 | 6.75%, 01/01/2009 | 266,368 | |||||
| 130,000 | 6.50%, 01/01/2016 | 147,507 | |||||
| 1,497,505 | |||||||
New York – 2.0% | |||||||
| 1,000,000 | New York, New York, | ||||||
| 5.00%, 03/01/2016 | |||||||
| (FGIC Insured) | 1,053,870 | ||||||
The accompanying notes are an integral part of these financial statements.
Page 33
Schedule of Investments June 30, 2007 (Unaudited) |
Principal | |||||||
Amount | Value | ||||||
MUNICIPAL BONDS – 96.5% (cont.) | |||||||
New York – 2.0% (cont.) | |||||||
| $ | 225,000 | TSASC Inc. New York, | |||||
| 4.75%, 06/01/2022 | $ | 223,659 | |||||
| 1,277,529 | |||||||
North Carolina – 0.4% | |||||||
| 225,000 | North Carolina Eastern | ||||||
| Municipal Power Agency | |||||||
| Power Systems | |||||||
| Revenue, 6.40%, | |||||||
| 01/01/2021 (ETM) | 261,884 | ||||||
Ohio – 0.3% | |||||||
| 150,000 | Miamisburg Ohio Water | ||||||
| Revenue, 7.00%, | |||||||
| 11/15/2016 (ETM) | 168,267 | ||||||
Oklahoma – 4.0% | |||||||
| 2,360,000 | Tulsa County Oklahoma | ||||||
| Home Financing Authority | |||||||
| Single Family Mortgage | |||||||
| Revenue, 6.90%, | |||||||
| 08/01/2011 (ETM) | 2,621,299 | ||||||
Pennsylvania – 4.9% | |||||||
| 780,000 | Philadelphia Pennsylvania | ||||||
| Gas Works, 7.00%, | |||||||
| 05/15/2020 (ETM) | 907,631 | ||||||
| 1,285,000 | Pittsburgh Pennsylvania | ||||||
| Water & Sewer Authority, | |||||||
| 7.25%, 09/01/2014 (ETM) | 1,417,946 | ||||||
| 1,000,000 | Wilson Pennsylvania Area | ||||||
| School District, 0.00%, | |||||||
| 05/15/2011 (AMBAC | |||||||
| Insured) ^ | 851,410 | ||||||
| 3,176,987 | |||||||
South Carolina – 0.5% | |||||||
| 285,000 | Greenville South | ||||||
| Carolina Waterworks | |||||||
| Revenue, 7.00%, | |||||||
| 02/01/2010 (ETM) | 306,486 | ||||||
South Dakota – 1.1% | |||||||
| 665,000 | Heartland Consumers | ||||||
| Power District, 7.00%, | |||||||
| 01/01/2016 (ETM) | 740,418 | ||||||
Tennessee – 3.4% | |||||||
| 430,000 | Metropolitan Government | ||||||
| Nashville & Davidson | |||||||
| County Tennessee H&E, | |||||||
| 6.10%, 07/01/2010 (ETM) | 441,743 | ||||||
| 1,545,000 | Metropolitan Government | ||||||
| Nashville & Davidson | |||||||
| County Tennessee Water | |||||||
| & Sewer Revenue, 6.50%, | |||||||
| 12/01/2014 (ETM) | 1,762,752 | ||||||
| 2,204,495 | |||||||
Texas – 36.2% | |||||||
| 1,125,000 | Barbers Hill Texas | ||||||
| Independent School | |||||||
| District General Obligation, | |||||||
| 5.00%, 02/15/2017 | |||||||
| (PSF Guaranteed) | 1,178,584 | ||||||
| 1,000,000 | Copperas Cove | ||||||
| Texas Independent | |||||||
| School District, | |||||||
| 5.00%, 08/15/2016 | |||||||
| (PSF Guaranteed) | 1,054,470 | ||||||
| 1,500,000 | Cypress-Fairbanks | ||||||
| Texas Independent | |||||||
| School District, | |||||||
| 5.00%, 02/15/2017 | |||||||
| (PSF Guaranteed) | 1,579,245 | ||||||
The accompanying notes are an integral part of these financial statements.
Page 34
Schedule of Investments June 30, 2007 (Unaudited) |
Principal | |||||||
Amount | Value | ||||||
MUNICIPAL BONDS – 96.5% (cont.) | |||||||
Texas – 36.2% (cont.) | |||||||
| $ | 1,625,000 | Frisco Texas Independent | |||||
| School District, | |||||||
| 6.00%, 08/15/2018 | |||||||
| (PSF Guaranteed) | $ | 1,836,575 | |||||
| 1,000,000 | Georgetown | ||||||
| Texas Independent | |||||||
| School District, | |||||||
| 5.00%, 02/15/2016 | |||||||
| (PSF Guaranteed) | 1,051,610 | ||||||
| 1,920,000 | Houston Texas Sewer | ||||||
| System Revenue, 9.375%, | |||||||
| 10/01/2013 (ETM) | 2,298,835 | ||||||
| 1,315,000 | La Porte Texas | ||||||
| Independent School District, | |||||||
| 5.00%, 02/15/2018 | |||||||
| (MBIA Insured) | 1,368,954 | ||||||
| 1,735,000 | Lufkin Texas Independent | ||||||
| School District, | |||||||
| 5.00%, 08/15/2015 | |||||||
| (PSF Guaranteed) | 1,823,849 | ||||||
| 1,265,000 | Mission Consolidation | ||||||
| Independent School District, | |||||||
| 5.00%, 02/15/2019 | |||||||
| (PSF Guaranteed) | 1,317,738 | ||||||
| 1,295,000 | Rockwall Texas | ||||||
| Independent School District, | |||||||
| 5.00%, 02/15/2015 | |||||||
| (PSF Guaranteed) | 1,365,293 | ||||||
| 775,000 | Sam Rayburn Texas | ||||||
| Municipal Power Agency, | |||||||
| 6.00%, 09/01/2010 (ETM) | 810,828 | ||||||
| 1,565,000 | San Antonio Texas Electric | ||||||
| & Gas Revenue, 5.65%, | |||||||
| 02/01/2019 (ETM) | 1,732,799 | ||||||
| 2,000,000 | San Antonio Texas | ||||||
| Independent School District, | |||||||
| 5.00%, 08/15/2017 | |||||||
| (PSF Guaranteed) | 2,100,520 | ||||||
| 575,000 | Socorro Texas | ||||||
| Independent School District, | |||||||
| 5.25%, 08/15/2012 | |||||||
| (PSF Guaranteed) | 605,998 | ||||||
| 345,000 | Texas Public Building | ||||||
| Authority Revenue, 7.125%, | |||||||
| 08/01/2011 (ETM) | 370,530 | ||||||
| 1,900,000 | Trinity River Authority | ||||||
| Texas Revenue, | |||||||
| 5.50%, 02/01/2021 | |||||||
| (MBIA Insured) | 2,037,123 | ||||||
| 1,000,000 | University of Houston Texas, | ||||||
| 5.25%, 02/15/2012 | |||||||
| (FSA Insured) | 1,051,260 | ||||||
| 23,584,211 | |||||||
Utah – 1.1% | |||||||
| 605,000 | Salt Lake City Utah | ||||||
| Hospital Revenue, 8.125%, | |||||||
| 05/15/2015 (ETM) | 690,063 | ||||||
Washington – 1.6% | |||||||
| 1,000,000 | Washington State, | ||||||
| 5.00%, 09/01/2013 | |||||||
| (FGIC Insured) | 1,042,330 | ||||||
| Total Municipal Bonds | |||||||
| (Cost $63,801,191) | 62,813,616 | ||||||
The accompanying notes are an integral part of these financial statements.
Page 35
Schedule of Investments June 30, 2007 (Unaudited) |
Principal | |||||||
Amount | Value | ||||||
SHORT-TERM INVESTMENTS – 1.6% | |||||||
Money Market Fund – 1.6% | |||||||
| $ | 1,015,220 | Tax Free Investment | |||||
| Company Cash Reserve | |||||||
| Portfolio – AIM Fund | $ | 1,015,220 | |||||
| Total Short-Term | |||||||
| Investments | |||||||
| (Cost $1,015,220) | 1,015,220 | ||||||
| Total Investments | |||||||
| (Cost $64,816,411) – | |||||||
| 98.1% | 63,828,836 | ||||||
| Other Assets in Excess | |||||||
| of Liabilities – 1.9% | 1,257,832 | ||||||
| TOTAL NET | |||||||
| ASSETS – 100.0% | $ | 65,086,668 | |||||
ETM – Escrowed to Maturity
^ Non-Income Producing
The accompanying notes are an integral part of these financial statements.
Page 36
Baird Core Plus Bond Fund
The Baird Core Plus Bond Fund seeks an annual rate of total return, before Fund expenses, greater than the annual rate of total return of the Lehman Brothers U.S. Universal Bond Index. The Lehman Brothers U.S. Universal Bond Index is an unmanaged, market value weighted index of fixed income securities issued in U.S. dollars, including U.S. government and investment grade debt, non-investment grade debt, asset-backed and mortgage-backed securities, Eurobonds, 144A securities and emerging market debt, with maturities of at least one year.
Portfolio Characteristics
Quality Distribution* | Sector Weightings* |
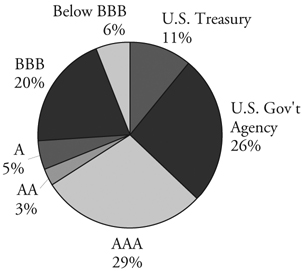 | 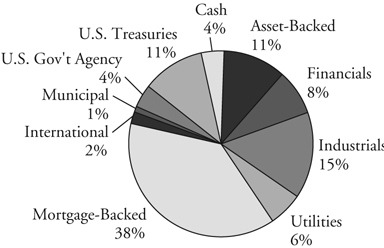 |
Net Assets: | $ | 59,540,748 | Annualized Expense Ratio: | |||||||
SEC 30-Day Yield:** | Institutional Class: | 0.30 | % | |||||||
| Institutional Class: | 5.58% | Investor Class: | 0.55 | %*** | ||||||
| Investor Class: | 5.28% | Portfolio Turnover Rate:**** | 30.0 | % | ||||||
Average Effective Duration: | 4.74 years | Total Number of Holdings: | 168 | |||||||
Average Effective Maturity: | 7.65 years | |||||||||
| * | Percentages shown are based on the Fund’s total net assets. |
| ** | SEC yields are based on SEC guidelines and are calculated for the 30 days ended June 30, 2007. |
| *** | Includes 0.25% 12b-1 fee. |
| **** | Not annualized. |
Page 37
Baird Core Plus Bond Fund
Average Annual Total Returns
Since | |||
For the Periods Ended June 30, 2007 | One Year | Five Years | Inception(1) |
| Baird Core Plus Bond Fund – Institutional Class Shares | 7.72% | 6.13% | 6.68% |
| Baird Core Plus Bond Fund – Investor Class Shares | 7.48% | 5.86% | 6.42% |
Lehman Brothers U.S. Universal Bond Index(2) | 6.62% | 5.42% | 6.43% |
(1) | For the period from September 29, 2000 (commencement of operations) through June 30, 2007. |
(2) | The Lehman Brothers U.S. Universal Bond Index is an unmanaged, market value weighted index of fixed income securities issued in U.S. dollars, including U.S. government and investment grade debt, non-investment grade debt, asset-backed and mortgage-backed securities, Eurobonds, 144A securities and emerging market debt, with maturities of at least one year. This index does not reflect any deduction for fees, expenses or taxes. A direct investment in an index is not possible. |
The returns shown in the table above reflect reinvestment of dividends and/or capital gains distributions in additional shares. The returns do not reflect the deduction of taxes that a shareholder would pay on Fund distributions or the redemption of Fund shares.
Past performance does not guarantee future results. Investment return and principal value will fluctuate so that an investor’s shares, when redeemed, may be worth more or less than their original cost.
For information about the performance of the Fund as of the most recent month-end, please call 1-866-44BAIRD or visit www.bairdfunds.com. Mutual fund performance changes over time and current performance may be lower or higher than that stated.
Page 38
Schedule of Investments June 30, 2007 (Unaudited) |
Principal | |||||||
Amount | Value | ||||||
LONG-TERM INVESTMENTS – 95.1% | |||||||
Asset Backed Securities – 10.8% | |||||||
| $ | 900,000 | American Express Credit | |||||
| Account Master Trust, | |||||||
| Series 2005-5, Class A, | |||||||
| 5.36%, 02/15/2013 | $ | 900,064 | |||||
| 106,377 | Contimortgage Home | ||||||
| Equity Loan Trust, | |||||||
| Series 1997-5, Class A6, | |||||||
| 6.87%, 03/15/2024 | 106,180 | ||||||
| Countrywide Asset-Backed | |||||||
| Certificates: | |||||||
| 600,000 | Series 2005-10, Class AF6, | ||||||
| 4.915%, 02/25/2036 | 569,065 | ||||||
| 400,000 | Series 2006-S9, Class A3, | ||||||
| 5.728%, 08/25/2036 | 393,753 | ||||||
| 300,000 | Series 2006-10, Class 1AF3, | ||||||
| 5.971%, 09/25/2046 | 300,019 | ||||||
| 325,000 | Discover Card Master Trust | ||||||
| I, Series 2005-2, Class A, | |||||||
| 5.35%, 04/17/2012 | 325,495 | ||||||
| 353,418 | Federal Express | ||||||
| Corporation Pass Thru | |||||||
| Certificates, Series B2, | |||||||
| 7.11%, 01/02/2014 | 371,177 | ||||||
| GMAC Mortgage | |||||||
| Corporation Loan Trust: | |||||||
| 56,066 | Series 2004-HE5, Class A3, | ||||||
| 3.97%, 09/25/2034 | 55,630 | ||||||
| 500,000 | Series 2005-HE3, Class A2, | ||||||
| 5.47%, 02/25/2036 | 500,302 | ||||||
| Green Tree Financial | |||||||
| Corporation: | |||||||
| 39,166 | Series 1997-1, Class A5, | ||||||
| 6.86%, 03/15/2028 | 40,024 | ||||||
| 327,579 | Series 1998-3, Class A5, | ||||||
| 6.22%, 03/01/2030 | 325,224 | ||||||
| 370,303 | Series 1998-4, Class A5, | ||||||
| 6.18%, 04/01/2030 | 365,247 | ||||||
| 70,424 | Oakwood Mortgage | ||||||
| Investors, Inc., | |||||||
| Series 1999-B, Class A3, | |||||||
| 6.45%, 11/15/2017 | 65,161 | ||||||
| Renaissance Home | |||||||
| Equity Loan Trust: | |||||||
| 300,000 | Series 2006-2, Class AF3, | ||||||
| 5.797%, 08/25/2036 | 299,692 | ||||||
| 500,000 | Series 2007-1, Class AF2, | ||||||
| 5.512%, 04/25/2037 | 496,773 | ||||||
| 290,986 | Residential Asset Mortgage | ||||||
| Products, Inc., Series | |||||||
| 2003-RS10, Class AI7, | |||||||
| 4.85%, 11/25/2033 | 279,086 | ||||||
| 395,704 | Residential Asset Securities | ||||||
| Corporation, Series | |||||||
| 2003-KS5, Class AI6, | |||||||
| 3.62%, 07/25/2033 | 369,988 | ||||||
| 400,000 | Stingray Pass Thru | ||||||
| Certificates, Series 2005, | |||||||
| 5.902%, 01/12/2015 | |||||||
| (Acquired 05/10/2007, | |||||||
| Cost $380,000)* | 382,792 | ||||||
| 300,000 | Structured Asset Securities | ||||||
| Corporation, Series | |||||||
| 2005-7XS, Class 1A4B, | |||||||
| 5.44%, 04/25/2035 | 292,586 | ||||||
| 6,438,258 | |||||||
Financial – 7.9% | |||||||
| 300,000 | Bank of America | ||||||
| Corporation | |||||||
| Subordinated Notes, | |||||||
| 10.20%, 07/15/2015 | 379,887 | ||||||
The accompanying notes are an integral part of these financial statements.
Page 39
Baird Core Plus Bond Fund
Schedule of Investments June 30, 2007 (Unaudited) |
Principal | |||||||
Amount | Value | ||||||
LONG-TERM INVESTMENTS – 95.1% (cont.) | |||||||
Financial – 7.9% (cont.) | |||||||
| $ | 200,000 | Banponce Trust I, | |||||
| 8.327%, 02/01/2027 | |||||||
| (Callable 09/21/2007) | $ | 208,326 | |||||
| 350,000 | First National | ||||||
| Bank of Omaha | |||||||
| Subordinated Notes, | |||||||
| 7.32%, 12/01/2010 | 357,116 | ||||||
| 250,000 | First Union Capital, | ||||||
| 7.935%, 01/15/2027 | |||||||
| (Callable 09/21/2007) | 259,993 | ||||||
| 350,000 | Glencore Funding LLC, | ||||||
| 6.00%, 04/15/2014 | |||||||
| (Acquired 03/31/2004 | |||||||
| and 12/04/2006; Cost | |||||||
| $148,928 and $198,740, | |||||||
| respectively)* | 343,498 | ||||||
| 30,000 | Goldman Sachs Group LP, | 33,072 | |||||
| 8.00%. 03/01/2013 | |||||||
| (Acquired 05/19/2006; | |||||||
| Cost $33,031)* | |||||||
| 100,000 | Health Care Service | ||||||
| Corporation Notes, | |||||||
| 7.75%, 06/15/2011 | |||||||
| (Acquired 01/26/2005; | |||||||
| Cost $115,000)* | 106,866 | ||||||
| 300,000 | Istar Financial, Inc., | ||||||
| 5.85%, 03/15/2017 | 287,763 | ||||||
| 300,000 | Jefferies Group, Inc., | ||||||
| 6.45%, 06/08/2027 | 292,762 | ||||||
| 350,000 | Lehman Brothers | ||||||
| Holdings Senior Notes, | |||||||
| 8.80%, 03/01/2015 | 409,758 | ||||||
| 375,000 | Liberty Mutual Insurance | ||||||
| Notes, 7.697%, 10/15/2097 | |||||||
| (Acquired 03/26/2003; | |||||||
| Cost $239,982)* | 364,842 | ||||||
| 100,000 | Marsh & McLennan | ||||||
| Companies, Inc., | |||||||
| 5.375%, 07/15/2014 | 93,556 | ||||||
| 300,000 | Martin Marietta Materials, | ||||||
| Inc., 6.25%, 05/01/2037 | 290,906 | ||||||
| 100,000 | Principal Financial Group | ||||||
| (AU) Senior Notes, 8.20%, | |||||||
| 08/15/2009 (Acquired | |||||||
| 09/16/2005; Cost | |||||||
| $112,015)* f | 105,436 | ||||||
| 300,000 | Regions Financing Trust II, | ||||||
| 6.625%, 05/01/2077 | |||||||
| (Callable 05/15/2027) | 286,970 | ||||||
| 375,000 | Residential Capital | ||||||
| Corporation, | |||||||
| 6.875%, 06/30/2015 | 363,718 | ||||||
| 200,000 | Santander | ||||||
| Financial Issuances, | |||||||
6.375%, 02/15/2011 f | 205,533 | ||||||
| 300,000 | Travelers Companies, Inc., | ||||||
| 6.25%, 03/15/2067 | 288,285 | ||||||
| 4,678,287 | |||||||
Industrial – 15.4% | |||||||
| 300,000 | AOL Time Warner, Inc., | ||||||
| 7.625%, 04/15/2031 | 321,411 | ||||||
| 100,000 | AT&T Wireless Services, | ||||||
| Inc. Senior Notes, | |||||||
| 8.75%, 03/01/2031 | 124,662 | ||||||
| 472,061 | Atlas Air, Inc. | ||||||
| Pass Thru Certificates, | |||||||
| 8.707%, 07/02/2021 | 509,826 | ||||||
| Bunge Ltd. Finance | |||||||
| Corporation Notes: | |||||||
| 150,000 | 5.35%, 04/15/2014 | 142,493 | |||||
| 100,000 | 5.10%, 07/15/2015 | 92,395 | |||||
The accompanying notes are an integral part of these financial statements.
Page 40
Baird Core Plus Bond Fund
Schedule of Investments June 30, 2007 (Unaudited) |
Principal | |||||||
Amount | Value | ||||||
LONG-TERM INVESTMENTS – 95.1% (cont.) | |||||||
Industrial – 15.4% (cont.) | |||||||
| $ | 375,000 | Clear Channel | |||||
| Communications, | |||||||
| 4.50%, 01/15/2010 | $ | 358,328 | |||||
| Continental Airlines, Inc. | |||||||
| Pass Thru Certificates: | |||||||
| 14,322 | Series 1997-4, | ||||||
| 6.80%, 07/02/2007 | 14,320 | ||||||
| 89,955 | Series 1998-1, | ||||||
| 6.541%, 09/15/2009 | 89,842 | ||||||
| 212,629 | Series 2000-2, | ||||||
| 8.312%, 10/02/2012 | 217,945 | ||||||
| 64,824 | Series 1997-4, | ||||||
| 6.90%, 01/02/2018 | 66,121 | ||||||
| 100,000 | COX Communications | ||||||
| Inc. Notes, | |||||||
| 7.875%, 08/15/2009 | 104,517 | ||||||
| 100,000 | Deutsche Telekom | ||||||
| International Finance BV, | |||||||
8.25%, 06/15/2030 f | 119,857 | ||||||
| 350,000 | Dollar General Corporation, | ||||||
| 8.625%, 06/15/2010 | 380,480 | ||||||
| 250,000 | Donnelley (R.R.) & Sons | ||||||
| Co., 6.125%, 01/15/2017 | 243,411 | ||||||
| 400,000 | Ford Motor | ||||||
| Company Debentures, | |||||||
| 9.215%, 09/15/2021 | 365,000 | ||||||
| General Motors Acceptance | |||||||
| Corporation Notes: | |||||||
| 75,000 | 7.75%, 01/19/2010 | 75,925 | |||||
| 250,000 | 6.75%, 12/01/2014 | 239,414 | |||||
| 175,000 | General Motors | ||||||
| Nova Scotia | |||||||
| Finance Company, | |||||||
6.85%, 10/15/2008 f | 174,125 | ||||||
| 350,000 | Hanson PLC Notes, | ||||||
6.125%, 08/15/2016 f | 358,309 | ||||||
| 350,000 | Health Management | ||||||
| Association, | |||||||
| 6.125%, 04/15/2016 | 329,356 | ||||||
| 150,000 | Hutchison Whampoa | ||||||
| International Limited, | |||||||
| 6.25%, 01/24/2014 | |||||||
| (Acquired 06/23/2005; | |||||||
Cost $161,474)* f | 152,122 | ||||||
| 322,000 | Marathon Oil | ||||||
| Corporation Debentures, | |||||||
| 9.125%, 01/15/2013 | 374,835 | ||||||
| 350,000 | New York Telephone | ||||||
| Company Debentures, | |||||||
| 8.625%, 11/15/2010 | 377,076 | ||||||
| 200,000 | PCCW Capital II Ltd., | ||||||
| 6.00%, 07/15/2013 | |||||||
| (Acquired 07/10/2003; | |||||||
Cost $199,066)* f | 198,206 | ||||||
| 300,000 | Plum Creek Timberlands, | ||||||
| 5.875%, 11/15/2015 | 290,460 | ||||||
| 300,000 | Sprint Capital Corporation, | ||||||
| 8.75%, 03/15/2032 | 336,939 | ||||||
| 250,000 | Sungard Data Systems Inc. | ||||||
| Notes, 3.75%, 01/15/2009 | 241,250 | ||||||
| 175,000 | TCI Communications, Inc. | ||||||
| Debentures, | |||||||
| 7.875%, 08/01/2013 | 191,760 | ||||||
| 350,000 | Telecom Italia Capital, | ||||||
7.20%, 07/18/2036 f | 359,822 | ||||||
| 200,000 | Telefonica Emisiones, | ||||||
| S.A.U., | |||||||
6.421%, 06/20/2016 f | 202,790 | ||||||
| 92,000 | Time Warner Companies, | ||||||
| Inc., 6.875%, 06/15/2018 | 95,360 | ||||||
| 25,000 | Time Warner | ||||||
| Entertainment Senior Notes, | |||||||
| 8.875%, 10/01/2012 | 28,258 | ||||||
The accompanying notes are an integral part of these financial statements.
Page 41
Baird Core Plus Bond Fund
Schedule of Investments June 30, 2007 (Unaudited) |
Principal | |||||||
Amount | Value | ||||||
LONG-TERM INVESTMENTS – 95.1% (cont.) | |||||||
Industrial – 15.4% (cont.) | |||||||
| Tyco International | |||||||
Group S.A.: f | |||||||
| $ | 150,000 | 6.125%, 01/15/2009 | $ | 151,906 | |||
| 50,000 | 6.00%, 11/15/2013 | 51,342 | |||||
| United AirLines, Inc. | |||||||
| Pass Thru Certificates: | |||||||
| 324,446 | Series 2001-1, | ||||||
| 6.201%, 09/01/2008 | 327,690 | ||||||
| 73,583 | 7.762%, 12/31/2049 | 67,926 | |||||
| Univision | |||||||
| Communication, Inc.: | |||||||
| 158,000 | 3.50%, 10/15/2007 | 156,420 | |||||
| 250,000 | 3.875%, 10/15/2008 | 240,938 | |||||
Vale Overseas Limited: f | |||||||
| 100,000 | 8.25%, 01/17/2034 | 116,970 | |||||
| 125,000 | 6.875%, 11/21/2036 | 125,648 | |||||
| 150,000 | Viacom, Inc., | ||||||
| 7.70%, 07/30/2010 | 158,611 | ||||||
| 150,000 | Viacom, Inc. Senior Notes, | ||||||
| 6.25%, 04/30/2016 | 147,742 | ||||||
| 500,000 | Vodafone Group PLC, | ||||||
6.15%, 02/27/2037 f | 465,145 | ||||||
| 9,186,953 | |||||||
International (U.S. $ Denominated) – 1.6% | |||||||
| 500,000 | Export-Import | ||||||
| Bank Korea Notes, | |||||||
4.625%, 03/16/2010 f | 489,256 | ||||||
| 400,000 | PEMEX Project Funding | ||||||
| Master Trust, | |||||||
9.125%, 10/13/2010 f | 440,000 | ||||||
| 929,256 | |||||||
Mortgage Backed Securities – 38.2% | |||||||
| Bank of America | |||||||
| Alternative Loan Trust: | |||||||
| 202,231 | Series 2005-2, Class 4A1, | ||||||
| 5.50%, 03/25/2020 | 200,846 | ||||||
| 408,356 | Series 2006-2, Class 6A1, | ||||||
| 5.50%, 03/25/2021 | 405,141 | ||||||
| 600,000 | Bayview Financial | ||||||
| Acquisition Trust, | |||||||
| Series 2007-A, | |||||||
| 6.205%, 05/28/2037 | 599,924 | ||||||
| 700,000 | Chase Mortgage | ||||||
| Finance Corporation, | |||||||
| Series 2006-A1, Class 2A3, | |||||||
| 6.00%, 09/25/2036 | 698,289 | ||||||
| Citigroup Mortgage | |||||||
| Loan Trust, Inc.: | |||||||
| 276,885 | Series 2005-9, Class 2A2, | ||||||
| 5.50%, 11/25/2035 | 275,098 | ||||||
| 392,584 | Series 2005-9, Class 22A2, | ||||||
| 6.00%, 11/25/2035 | 389,395 | ||||||
| Countrywide Alternative | |||||||
| Loan Trust: | |||||||
| 406,725 | Series 2006-7CB, Class 3A1, | ||||||
| 5.25%, 05/25/2021 | 401,523 | ||||||
| 368,590 | Series 2006-43CB, Class | ||||||
| 2A1, 6.00%, 02/25/2022 | 369,076 | ||||||
| 453,455 | Deutsche Securities Inc. | ||||||
| Mortgage, Series 2006-AR5, | |||||||
| Class 21A, 6.00%, | |||||||
| 10/25/2021 | 455,547 | ||||||
| Federal Gold Loan | |||||||
| Mortgage Corporation | |||||||
| (FGLMC): | |||||||
| 672,149 | 5.50%, 11/01/2017 | 664,483 | |||||
| 662,633 | 5.00%, 12/01/2020 | 640,876 | |||||
| 345,142 | 6.00%, 06/01/2021 | 346,688 | |||||
| 74,862 | 6.50%, 09/01/2028 | 76,478 | |||||
| 125,495 | 6.50%, 12/01/2028 | 128,204 | |||||
| 89,408 | 6.50%, 05/01/2029 | 91,335 | |||||
| 89,389 | 6.50%, 06/01/2029 | 91,315 | |||||
The accompanying notes are an integral part of these financial statements.
Page 42
Baird Core Plus Bond Fund
Schedule of Investments June 30, 2007 (Unaudited) |
Principal | |||||||
Amount | Value | ||||||
LONG-TERM INVESTMENTS – 95.1% (cont.) | |||||||
Mortgage Backed Securities – 38.2% (cont.) | |||||||
| Federal Home Loan | |||||||
| Mortgage Corporation | |||||||
| (FHLMC): | |||||||
| $ | 365,889 | Series 3122, Class VA, | |||||
| 6.00%, 01/15/2017 | $ | 367,894 | |||||
| 585,048 | Series R010, Class VA, | ||||||
| 5.50%, 04/15/2017 | 581,153 | ||||||
| 19,303 | Series 1053, Class G, | ||||||
| 7.00%, 03/15/2021 | 19,257 | ||||||
| 41,893 | Series 136, Class E, | ||||||
| 6.00%, 04/15/2021 | 41,747 | ||||||
| 300,000 | Series 2673, Class NC, | ||||||
| 5.50%, 05/15/2021 | 297,247 | ||||||
| 263,732 | Series 2804, Class VC, | ||||||
| 5.00%, 07/15/2021 | 252,698 | ||||||
| 38,149 | Series 1122, Class G, | ||||||
| 7.00%, 08/15/2021 | 38,083 | ||||||
| 89,318 | Series 1186, Class I, | ||||||
| 7.00%, 12/15/2021 | 91,265 | ||||||
| 231,701 | Series 3132, Class MA, | ||||||
| 5.50%, 12/15/2023 | 229,792 | ||||||
| 203,368 | Series 2598, Class QC, | ||||||
| 4.50%, 06/15/2027 | 200,105 | ||||||
| Federal National Mortgage | |||||||
| Association (FNMA): | |||||||
| 281,583 | 5.00%, 02/01/2018 | 273,128 | |||||
| 195,920 | 5.00%, 10/01/2018 | 190,064 | |||||
| 195,340 | 5.00%, 11/01/2018 | 189,502 | |||||
| 154,956 | 5.50%, 03/01/2023 | 151,504 | |||||
| 923,319 | 5.50%, 07/01/2023 | 902,750 | |||||
| 336,293 | 6.00%, 03/01/2026 | 335,708 | |||||
| 58,464 | 6.50%, 09/01/2028 | 59,670 | |||||
| 103,690 | 6.50%, 02/01/2029 | 105,829 | |||||
| 227,098 | 5.50%, 01/01/2032 | 220,065 | |||||
| 465,899 | 5.50%, 02/01/2035 | 451,076 | |||||
| 2,738,047 | 5.50%, 04/01/2036 | 2,647,505 | |||||
| 19,642 | Series 1989-94, Class G, | ||||||
| 7.50%, 12/25/2019 | 20,536 | ||||||
| 78,949 | Series 1990-15, Class J, | ||||||
| 7.00%, 02/25/2020 | 80,285 | ||||||
| 14,920 | Series 1991-21, Class J, | ||||||
| 7.00%, 03/25/2021 | 15,339 | ||||||
| 285,391 | Series 1991-43, Class J, | ||||||
| 7.00%, 05/25/2021 | 294,564 | ||||||
| 359,783 | Series 1991-65, Class Z, | ||||||
| 6.50%, 06/25/2021 | 367,010 | ||||||
| 359,244 | Series 1992-129, Class L, | ||||||
| 6.00%, 07/25/2022 | 360,736 | ||||||
| 111,311 | Series 1993-32, Class H, | ||||||
| 6.00%, 03/25/2023 | 110,360 | ||||||
| 594,960 | Series 1993-58, Class H, | ||||||
| 5.50%, 04/25/2023 | 589,725 | ||||||
| 252,223 | Series 2003-31, Class KG, | ||||||
| 4.50%, 12/25/2028 | 249,864 | ||||||
| 51,310 | Series 2003-44, Class AB, | ||||||
| 3.75%, 05/25/2033 | 47,091 | ||||||
| 292,594 | Series 2004-W6, Class 1A6, | ||||||
| 5.50%, 07/25/2034 | 289,120 | ||||||
| 570,676 | FHLMC Remic Series, | ||||||
| Series R010, Class AB, | |||||||
| 5.50%, 12/15/2019 | 562,634 | ||||||
| First Horizon Alternative | |||||||
| Mortgage Securities: | |||||||
| 360,210 | Series 2006-FA6, Class 3A1, | ||||||
| 5.75%, 11/25/2021 | 358,560 | ||||||
| 571,579 | Series 2006-FA8, Class 2A1, | ||||||
| 5.75%, 02/25/2037 | 568,841 | ||||||
| 825,000 | First Union National Bank | ||||||
| Commercial Mortgage | |||||||
| Securities Inc., Series | |||||||
| 2001-C4, Class A2, | |||||||
| 6.223%, 12/12/2033 | 841,877 | ||||||
The accompanying notes are an integral part of these financial statements.
Page 43
Baird Core Plus Bond Fund
Schedule of Investments June 30, 2007 (Unaudited) |
Principal | |||||||
Amount | Value | ||||||
LONG-TERM INVESTMENTS – 95.1% (cont.) | |||||||
Mortgage Backed Securities – 38.2% (cont.) | |||||||
| GE Capital Commercial | |||||||
| Mortgage Corporation: | |||||||
| $ | 796,888 | Series 2000-1, Class A2, | |||||
| 6.496%, 01/15/2033 | $ | 816,997 | |||||
| 600,000 | Series 2004-C3, Class A4, | ||||||
| 5.189%, 07/10/2039 | 580,283 | ||||||
| Government National | |||||||
| Mortgage Association | |||||||
| (GNMA): | |||||||
| 162,378 | 6.00%, 12/20/2028 | 162,077 | |||||
| 60,071 | 6.50%, 01/20/2029 | 61,410 | |||||
| 154,950 | 6.00%, 11/20/2033 | 154,453 | |||||
| J.P. Morgan Mortgage Trust: | |||||||
| 500,000 | Series 2006-A7, Class 2A4R, | ||||||
| 5.462%, 01/25/2037 | 494,360 | ||||||
| 500,000 | Series 2007-A2, Class 2A3, | ||||||
| 5.718%, 04/25/2037 | 495,767 | ||||||
| Master Alternative | |||||||
| Loans Trust: | |||||||
| 649,818 | Series 2005-3, Class 4A1, | ||||||
| 5.50%, 03/25/2020 | 643,121 | ||||||
| 196,925 | Series 2003-5, Class 6A1, | ||||||
| 6.00%, 08/25/2033 | 195,013 | ||||||
| 500,000 | Wachovia Bank Commercial | ||||||
| Mortgage Trust, | |||||||
| Series 2003-C3, Class A2, | |||||||
| 4.867%, 02/15/2035 | 480,556 | ||||||
| Washington Mutual, Inc. | |||||||
| Pass-Thru Certificates: | |||||||
| 216,259 | Series 2004-CB1, Class 5A, | ||||||
| 5.00%, 06/25/2019 | 207,879 | ||||||
| 241,033 | Series 2004-CB3, Class 4A, | ||||||
| 6.00%, 10/25/2019 | 241,115 | ||||||
| 22,769,833 | |||||||
Taxable Municipal Bonds – 0.5% | |||||||
| 265,134 | Tobacco Settlement | ||||||
| Financing Corporation, | |||||||
| 6.36%, 05/15/2025 | 264,887 | ||||||
Utilities – 5.9% | |||||||
| 200,000 | Commonwealth Edison, | ||||||
| 5.40%, 12/15/2011 | 195,904 | ||||||
| 150,000 | Energy Transfer Partners, | ||||||
| 5.65%, 08/01/2012 | 148,252 | ||||||
| Kinder Morgan Energy | |||||||
| Partners Senior Notes: | |||||||
| 350,000 | 5.35%, 08/15/2007 | 349,878 | |||||
| 250,000 | 6.95%, 01/15/2038 | 252,509 | |||||
| 78,276 | Kiowa Power Partners LLC, | ||||||
| 4.811%, 12/30/2013 | |||||||
| (Acquired 11/19/2004; | |||||||
| Cost $83,667)* | 75,339 | ||||||
| 400,000 | ONEOK, Inc. Senior Notes, | ||||||
| 7.125%, 04/15/2011 | 417,426 | ||||||
| 50,000 | Pacific Gas & Electric | ||||||
| Company 1st Mortgage, | |||||||
| 6.05%, 03/01/2034 | 48,434 | ||||||
| 300,000 | Pepco Holdings, Inc., | ||||||
| 6.125%, 06/01/2017 | 296,478 | ||||||
| 200,000 | PPL Energy Supply LLC, | ||||||
| 6.20%, 05/15/2016 | 198,171 | ||||||
| 200,000 | PSE&G Energy Holdings | ||||||
| LLC Senior Notes, | |||||||
| 8.50%, 06/15/2011 | 211,833 | ||||||
| 50,000 | PSI Energy, Inc. Debentures, | ||||||
| 7.85%, 10/15/2007 | 50,282 | ||||||
| 292,490 | RGS (I&M) Funding | ||||||
| Corporation Debentures, | |||||||
| 9.82%, 12/07/2022 | 348,894 | ||||||
| 300,000 | Southern Natural Gas, | ||||||
| 5.90%, 04/01/2017 | |||||||
| (Acquired 03/14/2007; | |||||||
| Cost $299,502)* | 290,165 | ||||||
The accompanying notes are an integral part of these financial statements.
Page 44
Baird Core Plus Bond Fund
Schedule of Investments June 30, 2007 (Unaudited) |
Principal | |||||||
Amount | Value | ||||||
LONG-TERM INVESTMENTS – 95.1% (cont.) | |||||||
Utilities – 5.9% (cont.) | |||||||
| $ | 89,596 | Tristate Gen & Trans Assn, | |||||
| 6.04%, 01/31/2018 | |||||||
| (Acquired 10/14/2003; | |||||||
| Cost $89,596)* | $ | 88,516 | |||||
| 200,000 | TXU Corporation, | ||||||
| 6.375%, 01/01/2008 | 200,497 | ||||||
| Williams Cos. Inc. Notes: | |||||||
| 100,000 | 7.125%, 09/01/2011 | 102,500 | |||||
| 200,000 | 7.875%, 09/01/2021 | 215,000 | |||||
| 3,490,078 | |||||||
U.S. Government Agency Issues – 4.3% | |||||||
| 2,500,000 | Federal National Mortgage | ||||||
| Association (FNMA), | |||||||
| 6.00%, 05/15/2011 | 2,565,788 | ||||||
U.S. Treasury Obligations – 10.5% | |||||||
| U.S. Treasury Bond, | |||||||
| 5,650,000 | 6.25%, 08/15/2023 | 6,273,709 | |||||
| Total Long-Term | |||||||
| Investments | |||||||
| $(57,317,116) | 56,597,049 | ||||||
COLLATERAL POOL INVESTMENT | |||||||
FOR SECURITIES ON LOAN – 25.8% | |||||||
| (Cost $15,379,028) | |||||||
| (Please Refer to Note 6) | 15,379,028 | ||||||
SHORT-TERM INVESTMENTS – 5.0% | |||||||
Money Market Funds – 5.0% | |||||||
| 2,325,094 | Short-Term Investment | ||||||
| Company Liquid Assets | |||||||
| Portfolio – AIM Fund | 2,325,094 | ||||||
| 667,390 | Short-Term Investment | ||||||
| Trust Prime Portfolio – | |||||||
| AIM Fund | 667,390 | ||||||
| Total Short-Term | |||||||
| Investments | |||||||
| (Cost $2,992,484) | 2,992,484 | ||||||
| Total Investments | |||||||
| (Cost $75,688,628) – | |||||||
| 125.9% | 74,968,561 | ||||||
| Liabilities in Excess of | |||||||
| Other Assets – (25.9)% | (15,427,813 | ) | |||||
| TOTAL NET | |||||||
| ASSETS – 100.0% | $ | 59,540,748 | |||||
* Restricted Security Deemed Liquid
f Foreign Security
The accompanying notes are an integral part of these financial statements.
Page 45
Baird Short-Term Bond Fund
The Baird Short-Term Bond Fund seeks an annual rate of total return, before Fund expenses, greater than the annual rate of total return of the Lehman Brothers 1-3 Year Government/Credit Bond Index. The Lehman Brothers 1-3 Year Government/Credit Bond Index is an unmanaged, market value weighted index of investment grade, fixed-rate debt, including government and corporate securities, with maturities between one and three years.
Portfolio Characteristics
Quality Distribution* | Sector Weightings* |
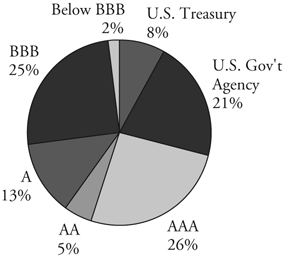 | 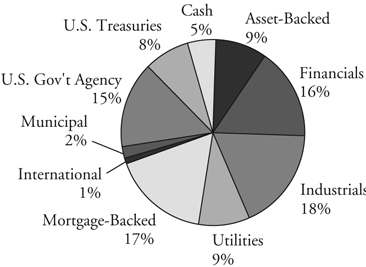 |
Net Assets: | $ | 168,490,911 | Annualized Expense Ratio: | |||||||
SEC 30-Day Yield:** | Institutional Class: | 0.30 | % | |||||||
| Institutional Class: | 5.33% | Portfolio Turnover Rate:*** | 23.8 | % | ||||||
Average Effective Duration: | 1.71 years | Total Number of Holdings: | 159 | |||||||
Average Effective Maturity: | 2.05 years | |||||||||
| * | Percentages shown are based on the Fund’s total net assets. |
| ** | SEC yields are based on SEC guidelines and are calculated for the 30 days ended June 30, 2007. |
| *** | Not annualized. |
Page 46
Baird Short-Term Bond Fund
Average Annual Total Returns
For the Periods Ended June 30, 2007 | One Year | Since Inception(1) |
| Baird Short-Term Bond Fund – Institutional Class | 5.51% | 3.08% |
Lehman Brothers 1-3 Year Government/Credit Bond Index(2) | 5.34% | 2.91% |
(1) | For the period from August 31, 2004 (commencement of operations) to June 30, 2007. |
(2) | The Lehman Brothers 1-3 Year Government/Credit Bond Index is an unmanaged, market value weighted index of investment grade, fixed-rate debt, including government and corporate securities, with maturities between one and three years. This index does not reflect any deduction for fees, expenses or taxes. A direct investment in an index is not possible. |
The returns shown in the table above reflect reinvestment of dividends and/or capital gains distributions in additional shares. Returns do not reflect the deduction of taxes that a shareholder would pay on Fund distributions or the redemption of Fund shares.
Past performance does not guarantee future results. Investment returns and principal value will fluctuate so that an investor’s shares, when redeemed, may be worth more or less than their original cost.
For information about the performance of the Fund as of the most recent month-end, please call 1-866-44BAIRD or visit www.bairdfunds.com. Mutual fund performance changes over time and current performance may be lower or higher than that stated.
Page 47
Schedule of Investments June 30, 2007 (Unaudited) |
Principal | |||||||
Amount | Value | ||||||
LONG-TERM INVESTMENTS – 93.6% | |||||||
Asset Backed Securities – 8.7% | |||||||
| $ | 400,000 | AESOP Funding II LLC, | |||||
| Series 2005-1A, Class A1, | |||||||
| 3.95%, 04/20/2009 | |||||||
| (Acquired 02/17/2005; | |||||||
| Cost $399,964)* | $ | 396,214 | |||||
| 520,966 | Bayview Financial | ||||||
| Acquisition Trust, | |||||||
| Series 2005-B, Class 1A2, | |||||||
| 4.696%, 04/28/2039 | 517,174 | ||||||
| 61,398 | Chase Manhattan | ||||||
| Auto Owner Trust, | |||||||
| Series 2003-C, Class A4, | |||||||
| 2.94%, 06/15/2010 | 61,027 | ||||||
| 545,731 | CitiFinancial Mortgage | ||||||
| Securities, Inc., | |||||||
| Series 2004-1, Class AF2, | |||||||
| 2.645%, 04/25/2034 | 529,258 | ||||||
| 164,599 | CNH Equipment Trust, | ||||||
| Series 2005-A, Class A3, | |||||||
| 4.02%, 04/15/2009 | 163,863 | ||||||
| Countrywide Asset-Backed | |||||||
| Certificates: | |||||||
| 1,500,000 | Series 2006-S7, Class A2, | ||||||
| 5.571%, 11/25/2035 | 1,492,004 | ||||||
| 829,044 | Series 2005-10, Class AF2, | ||||||
| 4.493%, 02/25/2036 | 825,084 | ||||||
| 1,153,000 | Series 2005-12, Class 1A2, | ||||||
| 4.847%, 02/25/2036 | 1,144,579 | ||||||
| 725,000 | Series 2005-13, Class AF2, | ||||||
| 5.294%, 04/25/2036 | 721,335 | ||||||
| 1,000,000 | Series 2006-13, | ||||||
| Class 1AF3, | |||||||
| 5.944%, 01/25/2037 | 999,020 | ||||||
| 1,500,000 | Series 2006-9, Class 1AF3, | ||||||
| 5.859%, 10/25/2046 | 1,498,351 | ||||||
| 500,000 | Ford Credit Auto | ||||||
| Owner Trust, | |||||||
| Series 2005-B, Class A4, | |||||||
| 4.38%, 01/15/2010 | 495,685 | ||||||
| 3,500,000 | GMAC Mortgage | ||||||
| Corporation Loan Trust, | |||||||
| Series 2005-HE3, Class | |||||||
| A2, 5.47%, 02/25/2036 | 3,502,115 | ||||||
| 834,951 | Green Tree Financial | ||||||
| Corporation, | |||||||
| Series 1998-3, Class A5, | |||||||
| 6.22%, 03/01/2030 | 828,947 | ||||||
| 698,755 | Merrill Lynch Mortgage | ||||||
| Investors Inc., | |||||||
| Series 2005-A8, | |||||||
| Class A1C1, | |||||||
| 5.25%, 08/25/2036 | 689,090 | ||||||
| Residential Asset | |||||||
| Mortgage Products, Inc.: | |||||||
| 273,164 | Series 2004-RS12, Class | ||||||
| AI3, 3.981%, 04/25/2029 | 272,098 | ||||||
| 389,474 | Series 2003-RS7, Class | ||||||
| AI6, 5.34%, 08/25/2033 | 379,803 | ||||||
| 30,934 | Residential Asset | ||||||
| Securities Corporation, | |||||||
| Series 2004-KS4, Class | |||||||
| AI3, 3.08%, 08/25/2029 | 30,682 | ||||||
| 89,130 | Residential Funding | ||||||
| Mortgage Securities, | |||||||
| Series 2003-HS3, Class | |||||||
| AI2, 3.15%, 07/25/2018 | 88,456 | ||||||
| 14,634,785 | |||||||
Financial – 15.8% | |||||||
| 1,405,000 | Allfirst Financial, Inc. | ||||||
| Subordinated Notes, | |||||||
| 7.20%, 07/01/2007 | 1,405,000 | ||||||
The accompanying notes are an integral part of these financial statements.
Page 48
Baird Short-Term Bond Fund
Schedule of Investments June 30, 2007 (Unaudited) |
Principal | |||||||
Amount | Value | ||||||
LONG-TERM INVESTMENTS – 93.6% (cont.) | |||||||
Financial – 15.8% (cont.) | |||||||
| $ | 140,000 | American General Finance | |||||
| Corporation Notes, | |||||||
| 4.50%, 11/15/2007 | $ | 139,614 | |||||
| 594,000 | Bank of Oklahoma | ||||||
| Subordinated Notes, | |||||||
| 7.125%, 08/15/2007 | 595,002 | ||||||
| 251,000 | Bank United Notes, | ||||||
| 8.00%, 03/15/2009 | 259,983 | ||||||
| 472,000 | Bankers Trust Corporation | ||||||
| Subordinated Notes, | |||||||
| 7.375%, 05/01/2008 | 477,709 | ||||||
| 1,156,000 | BNY Capital I Notes, | ||||||
| Series B, | |||||||
| 7.97%, 12/31/2026 | |||||||
| (Callable 09/07/2007) | 1,202,067 | ||||||
| 500,000 | Capital One Bank Notes, | ||||||
| 4.875%, 05/15/2008 | 497,701 | ||||||
| 100,000 | Chubb Corporation | ||||||
| Senior Notes, | |||||||
| 7.125%, 12/15/2007 | 100,658 | ||||||
| 210,000 | CIT Group Inc. | ||||||
| Senior Notes, | |||||||
| 5.50%, 11/30/2007 | 209,974 | ||||||
| 200,000 | Citicorp | ||||||
| Subordinated Notes, | |||||||
| 7.00%, 07/01/2007 | 200,000 | ||||||
| 375,000 | Citifinancial Debentures, | ||||||
| 10.00%, 05/15/2009 | 405,177 | ||||||
| 675,000 | Comerica Incorporated | ||||||
| Subordinated Notes, | |||||||
| 7.25%, 08/01/2007 | 675,941 | ||||||
| 550,000 | Compass Bank | ||||||
| Subordinated Notes, | |||||||
| 8.10%, 08/15/2009 | 577,076 | ||||||
| 388,000 | Corestates Capital Trust I, | ||||||
| 8.00%, 12/15/2026 | |||||||
| (Callable 09/07/2007) | |||||||
| (Acquired 01/26/2006 | |||||||
| and 05/31/2006; | |||||||
| Cost $211,938 and | |||||||
| $196,930, respectively)* | 401,866 | ||||||
| 500,000 | Countrywide Home | ||||||
| Loans Notes, | |||||||
| 4.125%, 09/15/2009 | 484,963 | ||||||
| 537,000 | Credit Suisse First Boston | ||||||
| USA Inc. Senior Notes, | |||||||
| 6.50%, 06/01/2008 | 541,918 | ||||||
| 1,000,000 | First National | ||||||
| Bank of Omaha | |||||||
| Subordinated Notes, | |||||||
| 7.32%, 12/01/2010 | 1,020,333 | ||||||
| 800,000 | First Union Capital, | ||||||
| 7.935%, 01/15/2027 | |||||||
| (Callable 09/21/2007) | 831,977 | ||||||
| 200,000 | Franchise Finance | ||||||
| Corporation Notes, | |||||||
| 7.07%, 01/15/2008 | 201,474 | ||||||
| 273,000 | Goldman Sachs | ||||||
| Group, Inc. Senior | |||||||
| Unsubordinated Notes, | |||||||
| 7.80%, 01/28/2010 | 288,253 | ||||||
| 575,000 | Key Bank NA | ||||||
| Subordinated Notes, | |||||||
| 6.50%, 10/15/2027 | |||||||
| (Callable and Putable | |||||||
| 04/15/2008) | 580,929 | ||||||
| 400,000 | Lehman Brothers | ||||||
| Holdings, Inc. Notes, | |||||||
| 3.50%, 08/07/2008 | 391,665 | ||||||
The accompanying notes are an integral part of these financial statements.
Page 49
Baird Short-Term Bond Fund
Schedule of Investments June 30, 2007 (Unaudited) |
Principal | |||||||
Amount | Value | ||||||
LONG-TERM INVESTMENTS – 93.6% (cont.) | |||||||
Financial – 15.8% (cont.) | |||||||
| $ | 200,000 | Marsh & McLennan | |||||
| Cos, Inc., | |||||||
| 3.625%, 02/15/2008 | $ | 197,397 | |||||
| 2,421,000 | MBNA Capital Series A, | ||||||
| 8.278%, 12/01/2026 | |||||||
| (Callable 09/07/2007) | 2,526,505 | ||||||
| 438,000 | Morgan Stanley, | ||||||
| 8.00%, 06/15/2010 | 467,798 | ||||||
| 720,000 | NB Capital Trust IV, | ||||||
| 8.25%, 04/15/2027 | |||||||
| (Callable 09/07/2007) | 749,017 | ||||||
| 625,000 | New York Life | ||||||
| Global Funding, | |||||||
| 3.875%, 01/15/2009 | |||||||
| (Acquired 01/23/2006; | |||||||
| Cost $608,075)* | 611,469 | ||||||
| 1,000,000 | North Fork Capital Trust | ||||||
| II, 8.00%, 12/15/2027 | |||||||
| (Callable 12/15/2007) | 1,046,170 | ||||||
| 700,000 | Phoenix Companies, | ||||||
| 6.675%, 02/16/2008 | 702,611 | ||||||
| 633,000 | PNC Financial Services | ||||||
| Subordinated Notes, | |||||||
| 9.65%, 06/15/2009 | 679,333 | ||||||
| 530,000 | PNC Funding | ||||||
| Corporation, | |||||||
| 6.125%, 02/15/2009 | 535,578 | ||||||
| Popular North | |||||||
| America, Inc.: | |||||||
| 1,030,000 | 4.25%, 04/01/2008 | 1,019,455 | |||||
| 365,000 | 4.70%, 06/30/2009 | 359,503 | |||||
| 350,000 | PPL Capital Funding | ||||||
| Trust I, Series A, | |||||||
| 4.33%, 03/01/2009 | 343,027 | ||||||
| 1,500,000 | Premium Asset Senior | ||||||
| Notes, 4.125%, | |||||||
| 03/12/2009 (Acquired | |||||||
| 05/10/2007; | |||||||
| Cost $1,440,000)* | 1,422,415 | ||||||
| 275,000 | Principal Life Global, | ||||||
| 3.625%, 04/30/2008 | |||||||
| (Acquired 08/17/2005; | |||||||
| Cost $268,452)* | 269,984 | ||||||
| 155,000 | Republic New York | ||||||
| Corporation | |||||||
| Subordinated Notes, | |||||||
| 9.70%, 02/01/2009 | 164,730 | ||||||
| 600,000 | Residential | ||||||
| Capital Corporation, | |||||||
| 6.125%, 11/21/2008 | 594,524 | ||||||
| 487,000 | SAFECO | ||||||
| Corporation Notes, | |||||||
| 6.875%, 07/15/2007 | 487,220 | ||||||
| 550,000 | Santander Financial | ||||||
| Issuances, | |||||||
6.375%, 02/15/2011 f | 565,215 | ||||||
| 200,000 | Transamerica Corporation | ||||||
| Debentures, | |||||||
| 9.375%, 03/01/2008 | 203,703 | ||||||
| 1,300,000 | Unitrin, Inc. | ||||||
| Senior Notes, | |||||||
| 5.75%, 07/01/2007 | 1,300,000 | ||||||
| 850,000 | Unum Group, | ||||||
| 5.859%, 05/15/2009 | 852,434 | ||||||
| 26,587,368 | |||||||
Industrial – 18.9% | |||||||
| 1,500,000 | American Standard, Inc., | ||||||
| 7.375%, 02/01/2008 | 1,512,246 | ||||||
The accompanying notes are an integral part of these financial statements.
Page 50
Baird Short-Term Bond Fund
Schedule of Investments June 30, 2007 (Unaudited) |
Principal | |||||||
Amount | Value | ||||||
LONG-TERM INVESTMENTS – 93.6% (cont.) | |||||||
Industrial – 18.9% (cont.) | |||||||
| $ | 306,000 | Bell Telephone Co. | |||||
| Pennsylvania Debentures, | |||||||
| 7.375%, 07/15/2007 | $ | 306,143 | |||||
| 150,000 | BellSouth | ||||||
| Telecommunication | |||||||
| Debentures, | |||||||
| 5.875%, 01/15/2009 | 150,832 | ||||||
| 225,000 | British Telecom | ||||||
| PLC Notes, | |||||||
8.625%, 12/15/2010 f | 245,873 | ||||||
| 1,000,000 | Bunge Limited | ||||||
| Finance Corporation, | |||||||
| 4.375%, 12/15/2008 | 983,656 | ||||||
| 874,000 | Cadbury Schweppes | ||||||
| U.S. Finance Notes, | |||||||
| 3.875%, 10/01/2008 | |||||||
| (Acquired 08/30/2005 | |||||||
| and 02/14/2007; Cost | |||||||
| $685,461 and $170,084, | |||||||
| respectively)* | 855,674 | ||||||
| 1,190,000 | Chelsea Property Group, | ||||||
| 7.25%, 10/21/2007 | 1,194,918 | ||||||
| 200,000 | Comcast Cable | ||||||
| Communications, | |||||||
| Inc. Notes, | |||||||
| 6.20%, 11/15/2008 | 201,587 | ||||||
| 1,070,000 | Computer Sciences | ||||||
| Corporation Notes, | |||||||
| 3.50%, 04/15/2008 | 1,053,383 | ||||||
| 581,000 | COX Communications | ||||||
| Inc. Notes, | |||||||
| 7.875%, 08/15/2009 | 607,244 | ||||||
| 662,000 | Devon Energy | ||||||
| Corporation Debentures, | |||||||
| 10.125%, 11/15/2009 | 724,431 | ||||||
| 1,000,000 | Donnelley (R.R.) | ||||||
| & Sons Notes, | |||||||
| 3.75%, 04/01/2009 | 969,611 | ||||||
| 1,000,000 | Fiserv Inc., | ||||||
| 3.00%, 06/27/2008 | 973,839 | ||||||
| 1,423,000 | FMC Corporation Notes, | ||||||
| 7.00%, 05/15/2008 | 1,432,069 | ||||||
| 300,000 | Ford Motor Credit | ||||||
| Company Senior Notes, | |||||||
| 4.95%, 01/15/2008 | 297,754 | ||||||
| 250,000 | General Motors | ||||||
| Acceptance Corporation | |||||||
| Notes, 6.125%, | |||||||
| 08/28/2007 | 250,170 | ||||||
| Halliburton | |||||||
| Company Notes: | |||||||
| 225,000 | 5.625%, 12/01/2008 | 225,347 | |||||
| 500,000 | 5.50%, 10/15/2010 | 499,515 | |||||
| 1,200,000 | ICI Wilmington, | ||||||
| 7.05%, 09/15/2007 | 1,202,830 | ||||||
| International Paper | |||||||
| Company Notes: | |||||||
| 885,000 | 6.50%, 11/15/2007 | 886,598 | |||||
| 675,000 | 4.00%, 04/01/2010 | 647,893 | |||||
| 700,000 | Johnson Controls | ||||||
| Inc. Notes, | |||||||
| 6.30%, 02/01/2008 | 700,963 | ||||||
| 1,013,000 | Marathon Oil | ||||||
| Corporation Notes, | |||||||
| 6.85%, 03/01/2008 | 1,021,702 | ||||||
| 1,082,000 | Motorola, Inc., | ||||||
| 4.608%, 11/16/2007 | 1,078,100 | ||||||
| 450,000 | News America Holdings, | ||||||
| 7.375%, 10/17/2008 | 458,973 | ||||||
| 1,275,000 | Pepco Holdings, Inc., | ||||||
| 5.50%, 08/15/2007 | 1,275,510 | ||||||
The accompanying notes are an integral part of these financial statements.
Page 51
Baird Short-Term Bond Fund
Schedule of Investments June 30, 2007 (Unaudited) |
Principal | |||||||
Amount | Value | ||||||
LONG-TERM INVESTMENTS – 93.6% (cont.) | |||||||
Industrial – 18.9% (cont.) | |||||||
| $ | 1,240,000 | Premcor Refining | |||||
| Group Inc. Senior Notes, | |||||||
| 9.50%, 02/01/2013 | |||||||
| (Callable 02/01/2008) | $ | 1,320,309 | |||||
| 1,575,000 | Sealed Air Corporation | ||||||
| Senior Notes, 5.375%, | |||||||
| 04/15/2008 (Acquired | |||||||
| 07/07/2006 and | |||||||
| 05/04/2007; Cost | |||||||
| $989,890 and $574,425, | |||||||
| respectively)* | 1,566,413 | ||||||
| 1,402,000 | Southwestern | ||||||
| Bell Telephone | |||||||
| Company Notes, | |||||||
| 6.625%, 07/15/2007 | 1,402,286 | ||||||
| 500,000 | Sprint Capital | ||||||
| Corporation Notes, | |||||||
| 6.375%, 05/01/2009 | 506,144 | ||||||
| 1,000,000 | Telecom Italia Capital, | ||||||
4.00%, 11/15/2008 f | 978,744 | ||||||
| 1,145,000 | Thomson Corporation, | ||||||
5.75%, 02/01/2008 f | 1,145,962 | ||||||
| 255,000 | Time Warner | ||||||
| Companies, Inc., | |||||||
| 8.18%, 08/15/2007 | 255,869 | ||||||
| 750,000 | Time Warner Companies, | ||||||
| Inc. Debentures, | |||||||
| 7.48%, 01/15/2008 | 758,896 | ||||||
| 1,500,000 | Transocean Inc., 5.56%, | ||||||
| 09/05/2008 (Callable | |||||||
09/05/2007) f | 1,500,980 | ||||||
| 480,660 | United AirLines, Inc. | ||||||
| Pass Thru Certificates, | |||||||
| 6.201%, 09/01/2008 | 485,467 | ||||||
| 1,050,000 | Univision | ||||||
| Communication, Inc., | |||||||
| 3.50%, 10/15/2007 | 1,039,500 | ||||||
| 1,105,000 | Vodafone Group PLC, | ||||||
7.75%, 02/15/2010 f | 1,160,695 | ||||||
| 31,878,126 | |||||||
International (U.S. $ Denominated) – 0.6% | |||||||
| 175,000 | Export-Import | ||||||
| Bank Korea Notes, | |||||||
4.625%, 03/16/2010 f | 171,240 | ||||||
| 600,000 | Korea Development | ||||||
| Bank Notes, | |||||||
3.875%, 03/02/2009 f | 584,804 | ||||||
| 200,000 | PEMEX Project | ||||||
| Funding Master Trust, | |||||||
6.125%, 08/15/2008 f | 201,200 | ||||||
| 957,244 | |||||||
Mortgage Backed Securities – 17.0% | |||||||
| 989,036 | Bank of America | ||||||
| Alternative Loan Trust, | |||||||
| Series 2003-4, Class 2A1, | |||||||
| 5.00%, 06/25/2018 | 972,190 | ||||||
| Citicorp Mortgage | |||||||
| Securities, Inc.: | |||||||
| 262,194 | Series 2003-11, Class 2A8, | ||||||
| 5.50%, 12/25/2033 | 259,561 | ||||||
| 771,819 | Series 2004-3, Class A2, | ||||||
| 5.25%, 05/25/2034 | 759,001 | ||||||
| 447,840 | Series 2004-4, Class A2, | ||||||
| 5.25%, 06/25/2034 | 433,596 | ||||||
| Countrywide Alternative | |||||||
| Loan Trust: | |||||||
| 1,473,593 | Series 2005-50CB, Class | ||||||
| 4A1, 5.00%, 11/25/2020 | 1,451,895 | ||||||
| 1,028,036 | Series 2005-34CB, Class | ||||||
| 1A6, 5.50%, 09/25/2035 | 1,022,955 | ||||||
The accompanying notes are an integral part of these financial statements.
Page 52
Baird Short-Term Bond Fund
Schedule of Investments June 30, 2007 (Unaudited) |
Principal | |||||||
Amount | Value | ||||||
LONG-TERM INVESTMENTS – 93.6% (cont.) | |||||||
Mortgage Backed Securities – 17.0% (cont.) | |||||||
| $ | 983,484 | Series 2005-73CB, | |||||
| Class 1A7, | |||||||
| 5.50%, 01/25/2036 | $ | 977,023 | |||||
| 1,435,023 | Series 2006-28CB, | ||||||
| Class A17, | |||||||
| 6.00%, 10/25/2036 | 1,431,503 | ||||||
| 1,784,556 | Credit Suisse First Boston | ||||||
| Mortgage Securities Corp., | |||||||
| Series 1998-C2, Class A2, | |||||||
| 6.30%, 11/15/2030 | 1,798,575 | ||||||
| Deutsche Alternative | |||||||
| Securities Inc. Mortgage: | |||||||
| 1,249,894 | Series 2003-3, Class 2A5, | ||||||
| 5.00%, 10/25/2033 | 1,241,768 | ||||||
| 2,075,000 | Series 2005-4, Class A2, | ||||||
| 5.05%, 09/25/2035 | 2,053,668 | ||||||
| Federal Home Loan | |||||||
| Mortgage Corporation | |||||||
| (FHLMC): | |||||||
| 97,485 | Series 2548, Class HA, | ||||||
| 4.50%, 01/15/2010 | 96,234 | ||||||
| 615,256 | Series 2835, Class VK, | ||||||
| 5.50%, 11/15/2012 | 613,395 | ||||||
| 600,834 | Series 3033, Class LU, | ||||||
| 5.50%, 03/15/2013 | 599,965 | ||||||
| 1,053,429 | Series 3124, Class VP, | ||||||
| 6.00%, 06/15/2014 | 1,063,221 | ||||||
| 309,829 | Series 2789, Class VM, | ||||||
| 5.50%, 04/15/2015 | 308,200 | ||||||
| 1,000,000 | Series 2390, Class PW, | ||||||
| 6.00%, 04/15/2015 | 1,005,600 | ||||||
| 238,700 | Series 2541, Class JB, | ||||||
| 5.00%, 02/15/2016 | 236,823 | ||||||
| 639,363 | Series 2970, Class DA, | ||||||
| 5.50%, 01/15/2023 | 636,303 | ||||||
| Federal National Mortgage | |||||||
| Association (FNMA): | |||||||
| 680,295 | 5.50%, 07/01/2015 | 677,875 | |||||
| 1,175,000 | Series 2003-24, Class LC, | ||||||
| 5.00%, 12/25/2015 | 1,162,899 | ||||||
| 912,219 | Series 2006-B1, Class AB, | ||||||
| 6.00%, 06/25/2016 | 912,288 | ||||||
| 113,258 | Series 2002-77, Class QP, | ||||||
| 5.00%, 09/25/2026 | 112,727 | ||||||
| 1,905,095 | Series 2004-W6, Class | ||||||
| 1A4, 5.50%, 07/25/2034 | 1,895,661 | ||||||
| 1,000,000 | Series 2004-W10, Class | ||||||
| A24, 5.00%, 08/25/2034 | 986,726 | ||||||
| 2,000,000 | J.P. Morgan Alternative | ||||||
| Loan Trust, Series | |||||||
| 2006-S2, Class A2, | |||||||
| 5.81%, 05/25/2036 | 1,992,736 | ||||||
| 1,500,000 | Renaissance Home | ||||||
| Equity Loan Trust, | |||||||
| Series 2007-2, Class AF2, | |||||||
| 5.675%, 06/25/2037 | 1,493,676 | ||||||
| 1,200,000 | Residential Accredit Loans | ||||||
| Inc., Series 2003-QS17, | |||||||
| Class CB3, 5.50%, | |||||||
| 09/25/2033 | 1,193,550 | ||||||
| Washington Mutual, Inc. | |||||||
| Pass-Thru Certificates: | |||||||
| 678,959 | Series 2004-CB4, Class | ||||||
| 21A, 5.50%, 12/25/2019 | 674,839 | ||||||
| 588,488 | Series 2004-CB4, Class | ||||||
| 22A, 6.00%, 12/25/2019 | 593,007 | ||||||
| 28,657,460 | |||||||
Taxable Municipal Bonds – 1.8% | |||||||
| 453,373 | Educational Enhancement | ||||||
| Funding Corporation, | |||||||
| 6.72%, 06/01/2025 | 452,562 | ||||||
The accompanying notes are an integral part of these financial statements.
Page 53
Baird Short-Term Bond Fund
Schedule of Investments June 30, 2007 (Unaudited) |
Principal | |||||||
Amount | Value | ||||||
LONG-TERM INVESTMENTS – 93.6% (cont.) | |||||||
Taxable Municipal Bonds – 1.8% (cont.) | |||||||
| $ | 70,000 | Erie, Pennsylvania | |||||
| General Obligation, | |||||||
| 5.60%, 11/15/2007 | $ | 70,094 | |||||
| 675,000 | Missouri State | ||||||
| Housing Development | |||||||
| Revenue Bond, | |||||||
| 5.74%, 03/01/2037 | 675,364 | ||||||
| 500,000 | Redding California | ||||||
| Redevelopment Agency | |||||||
| Tax Allocation, | |||||||
| 6.00%, 09/01/2010 | 504,620 | ||||||
| 475,000 | Richmond Joint Powers | ||||||
| Financing Authority | |||||||
| Tax Allocation, | |||||||
| 7.35%, 09/01/2010 | 489,849 | ||||||
| 897,376 | Tobacco Settlement | ||||||
| Financing Corporation, | |||||||
| Series 2001A, Class A, | |||||||
| 6.36%, 05/15/2025 | 896,542 | ||||||
| 3,089,031 | |||||||
Utilities – 8.3% | |||||||
| 1,000,000 | Baltimore Gas & | ||||||
| Electric Company Notes, | |||||||
| 5.78%, 10/01/2008 | 1,001,268 | ||||||
| 940,000 | Cilcorp Inc. Senior Notes, | ||||||
| 8.70%, 10/15/2009 | 971,387 | ||||||
| 1,610,000 | Commonwealth | ||||||
| Edison Notes, | |||||||
| 3.70%, 02/01/2008 | 1,591,272 | ||||||
| Kinder Morgan Energy | |||||||
| Partners Senior Notes: | |||||||
| 150,000 | 5.35%, 08/15/2007 | 149,948 | |||||
| 1,000,000 | 6.30%, 02/01/2009 | 1,010,728 | |||||
| MidAmerican Energy | |||||||
| Holdings Company | |||||||
| Senior Notes: | |||||||
| 200,000 | 4.625%, 10/01/2007 | 199,513 | |||||
| 1,275,000 | 7.63%, 10/15/2007 | 1,281,784 | |||||
| 500,000 | 7.52%, 09/15/2008 | 510,940 | |||||
| 1,000,000 | Nisource Finance | ||||||
| Corporation, | |||||||
| 7.875%, 11/15/2010 | 1,064,783 | ||||||
| 900,000 | Ocean Energy Inc., | ||||||
| 4.375%, 10/01/2007 | 897,370 | ||||||
| 1,332,000 | Panhandle Eastern | ||||||
| Pipeline Senior Notes, | |||||||
| 4.80%, 08/15/2008 | 1,320,035 | ||||||
| 250,000 | PSE&G Power LLC, | ||||||
| 3.75%, 04/01/2009 | 242,662 | ||||||
| 860,000 | System Energy Resources | ||||||
| 1st Mortgage, | |||||||
| 4.875%, 10/01/2007 | 858,481 | ||||||
| 598,000 | Texas-New Mexico Power | ||||||
| Co., 6.125%, 06/01/2008 | |||||||
| (Callable 09/07/2007) | 599,025 | ||||||
| 750,000 | TXU Corporation, | ||||||
| 6.375%, 01/01/2008 | 751,864 | ||||||
| 1,500,000 | TXU Electric Delivery Co., | ||||||
| 5.725%, 09/16/2008 | |||||||
| (Callable 09/16/2007) | |||||||
| (Acquired 03/13/2007; | |||||||
| Cost $1,500,000)* | 1,500,495 | ||||||
| 13,951,555 | |||||||
U.S. Government Agency Issues – 14.7% | |||||||
| 1,000,000 | Federal Home Loan | ||||||
| Bank (FHLB), | |||||||
| 4.70%, 10/07/2010 | 982,340 | ||||||
The accompanying notes are an integral part of these financial statements.
Page 54
Baird Short-Term Bond Fund
Schedule of Investments June 30, 2007 (Unaudited) |
Principal | |||||||
Amount | Value | ||||||
LONG-TERM INVESTMENTS – 93.6% (cont.) | |||||||
U.S. Government Agency Issues – 14.7% (cont.) | |||||||
| $ | 23,150,000 | Federal National Mortgage | |||||
| Association (FNMA), | |||||||
| 6.00%, 05/15/2011 | $ | 23,759,192 | |||||
| 24,741,532 | |||||||
U.S. Treasury Obligations – 7.8% | |||||||
| 13,250,000 | U.S. Treasury Note, | ||||||
| 4.875%, 04/30/2011 | 13,230,337 | ||||||
| Total Long-Term | |||||||
| Investments | |||||||
| (Cost $158,637,996) | 157,727,438 | ||||||
COLLATERAL POOL INVESTMENT | |||||||
FOR SECURITIES ON LOAN – 23.4% | |||||||
| (Cost $39,373,797) | |||||||
| (Please Refer to Note 6) | 39,373,797 | ||||||
SHORT-TERM INVESTMENTS – 5.1% | |||||||
Money Market Funds – 5.1% | |||||||
| 6,506,921 | Short-Term Investment | ||||||
| Company Liquid Assets | |||||||
| Portfolio – AIM Fund | 6,506,921 | ||||||
| 2,111,413 | Short-Term Investment | ||||||
| Trust Prime Portfolio – | |||||||
| AIM Fund | 2,111,413 | ||||||
| Total Short-Term | |||||||
| Investments | |||||||
| (Cost $8,618,334) | 8,618,334 | ||||||
| Total Investments | |||||||
| (Cost $206,630,127) – | |||||||
| 122.1% | 205,719,569 | ||||||
| Liabilities in Excess of | |||||||
| Other Assets – (22.1)% | (37,228,658 | ) | |||||
| TOTAL NET | |||||||
| ASSETS – 100.0% | $ | 168,490,911 | |||||
* Restricted Security Deemed Liquid
f Foreign Security
The accompanying notes are an integral part of these financial statements.
Page 55
Baird Funds, Inc.
Additional Information on Fund Expenses June 30, 2007 (Unaudited) |
Example
As a shareholder of a mutual fund, you incur two types of costs: (1) transaction costs, including sales charges (loads) on purchase payments, reinvested dividends, or other distributions; redemption fees; and exchange fees; and (2) ongoing costs, such as management fees; distribution and/or service (12b-1) fees; and other fund expenses. Although the Funds do not charge any sales loads, redemption fees, or other transaction fees, you will be assessed fees for outgoing wire transfers, returned checks and stop payment orders at prevailing rates charged by U. S. Bancorp Fund Services, LLC, the Funds’ transfer agent. If you request that a redemption be made by wire transfer, currently the Funds’ transfer agent charges a $15.00 fee.
This Example is intended to help you understand your ongoing costs (in dollars) of investing in each Fund and to compare these costs with the ongoing costs of investing in other mutual funds. The Example is based on an investment of $1,000 invested at the beginning of the period and held for the entire period (1/1/07 – 6/30/07).
Actual Expenses
The third and fourth columns of the following table provide information about account values based on actual returns and actual expenses. You may use the information in these columns, together with the amount you invested, to estimate the expenses that you paid over the period. Simply divide your account value by $1,000 (for example, an $8,600 account value divided by $1,000 = 8.6), then multiply the result by the number in the fourth column entitled “Expenses Paid During the Period” to estimate the expenses you paid on your account during this period.
Hypothetical Example for Comparison Purposes
The fifth and sixth columns of the following table provide information about hypothetical account values and hypothetical expenses based on the Funds’ actual expense ratios and an assumed rate of return of 5% per year before expenses, which is not the Funds’ actual return. The hypothetical account values and expenses may not be used to estimate the actual ending account balance or expenses you paid for the period. You may use this information to compare the ongoing costs of investing in the Funds and other mutual funds. To do so, compare this 5% hypothetical example with the 5% hypothetical examples that appear in the shareholder reports of the other mutual funds. Please note that the expenses shown in the table are meant to highlight your ongoing costs only and do not reflect any transactional costs. Therefore, the sixth column of the table (entitled “Expenses Paid During the Period”) is useful in comparing ongoing costs only, and will not help you determine the relative total costs of owning different mutual funds. In addition, if these transactional costs were included, your costs could have been higher.
Page 56
Baird Funds, Inc.
Additional Information on Fund Expenses June 30, 2007 (Unaudited) |
Actual vs. Hypothetical Returns
For the Six Months Ended June 30, 2007
Hypothetical (5% return | |||||||||||
Actual | before expenses) | ||||||||||
Fund’s | Beginning | Ending | Expenses | Ending | Expenses | ||||||
Annualized | Account | Account | Paid | Account | Paid | ||||||
Expense | Value | Value | During | Value | During | ||||||
Ratio(1) | 1/1/07 | 6/30/07 | Period(1) | 6/30/07 | Period(1) | ||||||
Baird Intermediate Bond Fund | |||||||||||
| Institutional Class | 0.30% | $1,000.00 | $1,015.60 | $1.50 | $1,023.31 | $1.51 | |||||
| Investor Class | 0.55% | $1,000.00 | $1,013.90 | $2.75 | $1,022.07 | $2.76 | |||||
Baird Aggregate Bond Fund | |||||||||||
| Institutional Class | 0.30% | $1,000.00 | $1,012.50 | $1.50 | $1,023.31 | $1.51 | |||||
| Investor Class | 0.55% | $1,000.00 | $1,012.00 | $2.74 | $1,022.07 | $2.76 | |||||
Baird Intermediate Municipal | |||||||||||
Bond Fund | |||||||||||
| Institutional Class | 0.30% | $1,000.00 | $1,003.10 | $1.49 | $1,023.31 | $1.51 | |||||
| Investor Class | 0.55% | $1,000.00 | $1,001.80 | $2.73 | $1,022.07 | $2.76 | |||||
Baird Core Plus Bond Fund | |||||||||||
| Institutional Class | 0.30% | $1,000.00 | $1,013.50 | $1.50 | $1,023.31 | $1.51 | |||||
| Investor Class | 0.55% | $1,000.00 | $1,013.00 | $2.75 | $1,022.07 | $2.76 | |||||
Baird Short-Term Bond Fund | |||||||||||
| Institutional Class | 0.30% | $1,000.00 | $1,021.40 | $1.50 | $1,023.31 | $1.51 | |||||
(1) | Expenses are equal to the Fund’s annualized expense ratio multiplied by the average account value over the period, multiplied by 181 days and divided by 365 to reflect the one-half year period. |
Page 57
Baird Funds, Inc.
Statements of Assets and Liabilities June 30, 2007 (Unaudited) |
Baird | ||||||||||||||||||||||
Baird | Baird | Intermediate | Baird | Baird | ||||||||||||||||||
Intermediate | Aggregate | Municipal | Core Plus | Short-Term | ||||||||||||||||||
Bond Fund | Bond Fund | Bond Fund | Bond Fund | Bond Fund | ||||||||||||||||||
ASSETS: | ||||||||||||||||||||||
| Investments, at value (cost $368,015,356; | ||||||||||||||||||||||
| $577,950,455; $64,816,411; $67,699,291 | ||||||||||||||||||||||
| & $186,175,611, respectively) | $ | 363,934,668 | $ | 572,150,073 | $ | 63,828,836 | $ | 66,979,224 | $ | 185,265,053 | ||||||||||||
| Repurchase agreements | 44,369,961 | 75,883,554 | — | 7,989,337 | 20,454,516 | |||||||||||||||||
| (cost $44,369,961; $75,883,554; $0; | ||||||||||||||||||||||
| $7,989,337; & $20,454,516, respectively) | ||||||||||||||||||||||
| Interest receivable | 3,902,664 | 5,053,039 | 1,113,759 | 636,352 | 1,749,547 | |||||||||||||||||
| Receivable for investments sold | 12,689 | 7,613 | — | 2,538 | — | |||||||||||||||||
| Receivable for Fund shares sold | 5,371,062 | 2,281,824 | 163,660 | 12,189 | 575,305 | |||||||||||||||||
| Total assets | 417,591,044 | 655,376,103 | 65,106,255 | 75,619,640 | 208,044,421 | |||||||||||||||||
LIABILITIES: | ||||||||||||||||||||||
| Payable for collateral | ||||||||||||||||||||||
| received for securities loaned | 85,409,679 | 146,071,574 | — | 15,379,028 | 39,373,797 | |||||||||||||||||
| Payable for securities purchased | 7,798,065 | 2,000,000 | — | — | 133,929 | |||||||||||||||||
| Payable for Fund shares repurchased | — | 15,972 | — | 47,641 | 4,650 | |||||||||||||||||
| Payable to Advisor and Distributor | 79,659 | 121,427 | 19,587 | 14,992 | 41,134 | |||||||||||||||||
| Payable to the Custodian | — | — | — | 602,188 | — | |||||||||||||||||
| Other liabilities | — | 8,495 | — | 35,043 | — | |||||||||||||||||
| Total liabilities | 93,287,403 | 148,217,468 | 19,587 | 16,078,892 | 39,553,510 | |||||||||||||||||
NET ASSETS | $ | 324,303,641 | $ | 507,158,635 | $ | 65,086,668 | $ | 59,540,748 | $ | 168,490,911 | ||||||||||||
NET ASSETS CONSIST OF: | ||||||||||||||||||||||
| Capital stock | $ | 331,125,290 | $ | 514,250,441 | $ | 66,096,195 | $ | 60,258,953 | $ | 169,629,137 | ||||||||||||
| Accumulated undistributed | ||||||||||||||||||||||
| net investment income | 327,776 | 591,995 | 109,075 | 70,324 | 208,989 | |||||||||||||||||
| Accumulated net realized loss | ||||||||||||||||||||||
| on investments sold | (3,068,737 | ) | (1,883,419 | ) | (131,027 | ) | (68,462 | ) | (436,657 | ) | ||||||||||||
| Net unrealized depreciation on investments | (4,080,688 | ) | (5,800,382 | ) | (987,575 | ) | (720,067 | ) | (910,558 | ) | ||||||||||||
NET ASSETS | $ | 324,303,641 | $ | 507,158,635 | $ | 65,086,668 | $ | 59,540,748 | $ | 168,490,911 | ||||||||||||
INSTITUTIONAL CLASS SHARES | ||||||||||||||||||||||
| Net Assets | $ | 323,665,311 | $ | 504,559,013 | $ | 64,769,222 | $ | 58,888,002 | $ | 168,490,911 | ||||||||||||
| Shares outstanding ($0.01 par value, | ||||||||||||||||||||||
| unlimited shares authorized) | 31,046,708 | 48,607,502 | 6,233,716 | 5,868,437 | 17,208,706 | |||||||||||||||||
| Net asset value, offering and | ||||||||||||||||||||||
| redemption price per share | $ | 10.43 | $ | 10.38 | $ | 10.39 | $ | 10.03 | $ | 9.79 | ||||||||||||
INVESTOR CLASS SHARES | ||||||||||||||||||||||
| Net Assets | $ | 638,330 | $ | 2,599,622 | $ | 317,446 | $ | 652,746 | ||||||||||||||
| Shares outstanding ($0.01 par value, | ||||||||||||||||||||||
| unlimited shares authorized) | 59,375 | 245,068 | 29,984 | 63,361 | ||||||||||||||||||
| Net asset value, offering and | ||||||||||||||||||||||
| redemption price per share | $ | 10.75 | $ | 10.61 | $ | 10.59 | $ | 10.30 | ||||||||||||||
The accompanying notes are an integral part of these financial statements.
Page 58
Statements of Operations Period Ended June 30, 2007 (Unaudited) |
Baird | ||||||||||||||||||||
Baird | Baird | Intermediate | Baird | Baird | ||||||||||||||||
Intermediate | Aggregate | Municipal | Core Plus | Short-Term | ||||||||||||||||
Bond Fund | Bond Fund | Bond Fund | Bond Fund | Bond Fund | ||||||||||||||||
INVESTMENT INCOME: | ||||||||||||||||||||
| Interest income | $ | 8,954,151 | $ | 11,403,648 | $ | 1,389,265 | $ | 1,585,436 | $ | 4,126,016 | ||||||||||
| Income from securities lending | 25,204 | 21,618 | — | 3,638 | 11,676 | |||||||||||||||
| Total investment income | 8,979,355 | 11,425,266 | 1,389,265 | 1,589,074 | 4,137,692 | |||||||||||||||
EXPENSES: | ||||||||||||||||||||
| Investment advisory fee | 413,017 | 506,223 | 81,724 | 68,996 | 198,059 | |||||||||||||||
| Administration fee | 82,603 | 101,245 | 16,345 | 13,799 | 39,612 | |||||||||||||||
| Distribution expense – Investor Class Shares | 1,565 | 2,990 | 578 | 476 | — | |||||||||||||||
| Total expenses | 497,185 | 610,458 | 98,647 | 83,271 | 237,671 | |||||||||||||||
NET INVESTMENT INCOME | 8,482,170 | 10,814,808 | 1,290,618 | 1,505,803 | 3,900,021 | |||||||||||||||
REALIZED AND UNREALIZED | ||||||||||||||||||||
GAIN (LOSS) ON INVESTMENTS: | ||||||||||||||||||||
| Net realized gain (loss) on investments | 210,440 | (701,817 | ) | (23,038 | ) | 61,308 | (79,811 | ) | ||||||||||||
| Change in unrealized appreciation/ | ||||||||||||||||||||
| depreciation on investments | (3,463,789 | ) | (5,853,007 | ) | (1,110,444 | ) | (857,648 | ) | (423,817 | ) | ||||||||||
| Net realized and unrealized | ||||||||||||||||||||
| loss on investments | (3,253,349 | ) | (6,554,824 | ) | (1,133,482 | ) | (796,340 | ) | (503,628 | ) | ||||||||||
NET INCREASE IN NET ASSETS | ||||||||||||||||||||
RESULTING FROM OPERATIONS | $ | 5,228,821 | $ | 4,259,984 | $ | 157,136 | $ | 709,463 | $ | 3,396,393 | ||||||||||
The accompanying notes are an integral part of these financial statements.
Page 59
Baird Funds, Inc.
Statements of Changes in Net Assets |
Baird Intermediate Bond Fund | ||||||||
| Period Ended | ||||||||
| June 30, 2007 | Year Ended | |||||||
| (Unaudited) | December 31, 2006 | |||||||
OPERATIONS: | ||||||||
| Net investment income | $ | 8,482,170 | $ | 13,559,600 | ||||
| Net realized gain (loss) on investments | 210,440 | (1,654,036 | ) | |||||
| Change in unrealized appreciation/depreciation on investments | (3,463,789 | ) | 1,569,947 | |||||
| Net increase in net assets resulting from operations | 5,228,821 | 13,475,511 | ||||||
CAPITAL SHARE TRANSACTIONS: | ||||||||
| Proceeds from shares sold | 42,068,068 | 111,704,742 | ||||||
| Shares issued to holders in reinvestment of dividends | 7,388,090 | 11,932,463 | ||||||
| Cost of shares redeemed | (50,062,261 | ) | (30,115,437 | ) | ||||
| Net increase (decrease) in net assets resulting | ||||||||
| from capital share transactions | (606,103 | ) | 93,521,768 | |||||
DISTRIBUTIONS TO | ||||||||
INSTITUTIONAL CLASS SHAREHOLDERS: | ||||||||
| From net investment income | (8,331,157 | ) | (13,507,486 | ) | ||||
DISTRIBUTIONS TO | ||||||||
INVESTOR CLASS SHAREHOLDERS: | ||||||||
| From net investment income | (30,533 | ) | (77,646 | ) | ||||
TOTAL INCREASE (DECREASE) IN NET ASSETS | (3,738,972 | ) | 93,412,147 | |||||
NET ASSETS: | ||||||||
| Beginning of period | 328,042,613 | 234,630,466 | ||||||
| End of period (including undistributed net investment | ||||||||
| income of $327,776 and $207,297, respectively) | $ | 324,303,641 | $ | 328,042,613 | ||||
The accompanying notes are an integral part of these financial statements.
Page 60
Baird Funds, Inc.
Statements of Changes in Net Assets |
Baird Aggregate Bond Fund | ||||||||
| Period Ended | ||||||||
| June 30, 2007 | Year Ended | |||||||
| (Unaudited) | December 31, 2006 | |||||||
OPERATIONS: | ||||||||
| Net investment income | $ | 10,814,808 | $ | 13,269,201 | ||||
| Net realized loss on investments | (701,817 | ) | (888,625 | ) | ||||
| Change in unrealized appreciation/depreciation on investments | (5,853,007 | ) | 639,350 | |||||
| Net increase in net assets resulting from operations | 4,259,984 | 13,019,926 | ||||||
CAPITAL SHARE TRANSACTIONS: | ||||||||
| Proceeds from shares sold | 200,829,278 | 155,486,669 | ||||||
| Shares issued to holders in reinvestment of dividends | 8,391,522 | 11,939,014 | ||||||
| Cost of shares redeemed | (32,678,660 | ) | (58,822,570 | ) | ||||
| Net increase in net assets resulting | ||||||||
| from capital share transactions | 176,542,140 | 108,603,113 | ||||||
DISTRIBUTIONS TO | ||||||||
INSTITUTIONAL CLASS SHAREHOLDERS: | ||||||||
| From net investment income | (10,342,159 | ) | (13,106,942 | ) | ||||
| From realized gains | — | (120,758 | ) | |||||
| Total Distributions | (10,342,159 | ) | (13,227,700 | ) | ||||
DISTRIBUTIONS TO | ||||||||
INVESTOR CLASS SHAREHOLDERS: | ||||||||
| From net investment income | (57,807 | ) | (60,662 | ) | ||||
| From realized gains | — | (525 | ) | |||||
| Total Distributions | (57,807 | ) | (61,187 | ) | ||||
TOTAL INCREASE IN NET ASSETS | 170,402,158 | 108,334,152 | ||||||
NET ASSETS: | ||||||||
| Beginning of period | 336,756,477 | 228,422,325 | ||||||
| End of period (including undistributed net investment | ||||||||
| income of $591,995 and $177,153, respectively) | $ | 507,158,635 | $ | 336,756,477 | ||||
The accompanying notes are an integral part of these financial statements.
Page 61
Baird Funds, Inc.
Statements of Changes in Net Assets |
Baird Intermediate Municipal Bond Fund | ||||||||
| Period Ended | ||||||||
| June 30, 2007 | Year Ended | |||||||
| (Unaudited) | December 31, 2006 | |||||||
OPERATIONS: | ||||||||
| Net investment income | $ | 1,290,618 | $ | 2,561,679 | ||||
| Net realized loss on investments | (23,038 | ) | (106,983 | ) | ||||
| Change in unrealized appreciation/depreciation on investments | (1,110,444 | ) | 81,453 | |||||
| Net increase in net assets resulting from operations | 157,136 | 2,536,149 | ||||||
CAPITAL SHARE TRANSACTIONS: | ||||||||
| Proceeds from shares sold | 7,819,202 | 36,672,168 | ||||||
| Shares issued to holders in reinvestment of dividends | 945,341 | 2,042,052 | ||||||
| Cost of shares redeemed | (8,124,099 | ) | (28,525,030 | ) | ||||
| Other capital contributions (Note 3) | 2,595 | — | ||||||
| Net increase in net assets resulting | ||||||||
| from capital share transactions | 643,039 | 10,189,190 | ||||||
DISTRIBUTIONS TO | ||||||||
INSTITUTIONAL CLASS SHAREHOLDERS: | ||||||||
| From net investment income | (1,183,320 | ) | (2,536,465 | ) | ||||
DISTRIBUTIONS TO | ||||||||
INVESTOR CLASS SHAREHOLDERS: | ||||||||
| From net investment income | (7,694 | ) | (34,881 | ) | ||||
TOTAL INCREASE (DECREASE) IN NET ASSETS | (390,839 | ) | 10,153,993 | |||||
NET ASSETS: | ||||||||
| Beginning of period | 65,477,507 | 55,323,514 | ||||||
| End of period (including undistributed net investment | ||||||||
| income of $109,075 and $9,471, respectively) | $ | 65,086,668 | $ | 65,477,507 | ||||
The accompanying notes are an integral part of these financial statements.
Page 62
Baird Funds, Inc.
Statements of Changes in Net Assets |
Baird Core Plus Bond Fund | ||||||||
| Period Ended | ||||||||
| June 30, 2007 | Year Ended | |||||||
| (Unaudited) | December 31, 2006 | |||||||
OPERATIONS: | ||||||||
| Net investment income | $ | 1,505,803 | $ | 1,758,723 | ||||
| Net realized gain (loss) on investments | 61,308 | (55,454 | ) | |||||
| Change in unrealized appreciation/depreciation on investments | (857,648 | ) | 405,659 | |||||
| Net increase in net assets resulting from operations | 709,463 | 2,108,928 | ||||||
CAPITAL SHARE TRANSACTIONS: | ||||||||
| Proceeds from shares sold | 9,411,216 | 35,731,850 | ||||||
| Shares issued to holders in reinvestment of dividends | 1,401,626 | 1,429,836 | ||||||
| Cost of shares redeemed | (2,353,051 | ) | (18,311,499 | ) | ||||
| Other capital contributions (Note 3) | 531 | 71 | ||||||
| Net increase in net assets resulting | ||||||||
| from capital share transactions | 8,460,322 | 18,850,258 | ||||||
DISTRIBUTIONS TO | ||||||||
INSTITUTIONAL CLASS SHAREHOLDERS: | ||||||||
| From net investment income | (1,459,054 | ) | (1,727,098 | ) | ||||
DISTRIBUTIONS TO | ||||||||
INVESTOR CLASS SHAREHOLDERS: | ||||||||
| From net investment income | (9,928 | ) | (15,311 | ) | ||||
TOTAL INCREASE IN NET ASSETS | 7,700,803 | 19,216,777 | ||||||
NET ASSETS: | ||||||||
| Beginning of period | 51,839,945 | 32,623,168 | ||||||
| End of period (including undistributed net investment | ||||||||
| income of $70,324 and $33,503, respectively) | $ | 59,540,748 | $ | 51,839,945 | ||||
The accompanying notes are an integral part of these financial statements.
Page 63
Baird Funds, Inc.
Statements of Changes in Net Assets |
Baird Short-Term Bond Fund | ||||||||
| Period Ended | ||||||||
| June 30, 2007 | Year Ended | |||||||
| (Unaudited) | December 31, 2006 | |||||||
OPERATIONS: | ||||||||
| Net investment income | $ | 3,900,021 | $ | 5,655,808 | ||||
| Net realized loss on investments | (79,811 | ) | (247,795 | ) | ||||
| Change in unrealized appreciation/depreciation on investments | (423,817 | ) | 518,820 | |||||
| Net increase in net assets resulting from operations | 3,396,393 | 5,926,833 | ||||||
CAPITAL SHARE TRANSACTIONS: | ||||||||
| Proceeds from shares sold | 28,932,211 | 79,434,155 | ||||||
| Shares issued to holders in reinvestment of dividends | 3,713,065 | 5,464,609 | ||||||
| Cost of shares redeemed | (12,386,052 | ) | (33,715,361 | ) | ||||
| Net increase in net assets resulting | ||||||||
| from capital share transactions | 20,259,224 | 51,183,403 | ||||||
DISTRIBUTIONS TO | ||||||||
INSTITUTIONAL CLASS SHAREHOLDERS: | ||||||||
| From net investment income | (3,769,417 | ) | (5,563,493 | ) | ||||
TOTAL INCREASE IN NET ASSETS | 19,886,200 | 51,546,743 | ||||||
NET ASSETS: | ||||||||
| Beginning of period | 148,604,711 | 97,057,968 | ||||||
| End of period (including undistributed net investment | ||||||||
| income of $208,989 and $78,385, respectively) | $ | 168,490,911 | $ | 148,604,711 | ||||
The accompanying notes are an integral part of these financial statements.
Page 64
Baird Funds, Inc.
Financial Highlights |
Baird Intermediate Bond Fund – Institutional Class | ||||||||||||||||||||||||
| Six Months | ||||||||||||||||||||||||
| Ended | ||||||||||||||||||||||||
| June 30, 2007 | Year Ended December 31, | |||||||||||||||||||||||
| (Unaudited) | 2006 | 2005 | 2004 | 2003 | 2002 | |||||||||||||||||||
| Per Share Data: | ||||||||||||||||||||||||
| Net asset value, beginning of period | $ | 10.52 | $ | 10.55 | $ | 10.83 | $ | 10.88 | $ | 10.86 | $ | 10.60 | ||||||||||||
| Income from investment operations: | ||||||||||||||||||||||||
| Net investment income | 0.27 | 0.51 | 0.46 | 0.47 | (1) | 0.49 | 0.56 | |||||||||||||||||
| Net realized and unrealized | ||||||||||||||||||||||||
| gains (losses) on investments | (0.10 | ) | (0.03 | ) | (0.27 | ) | (0.05 | ) | 0.14 | 0.27 | ||||||||||||||
| Total from investment operations | 0.17 | 0.48 | 0.19 | 0.42 | 0.63 | 0.83 | ||||||||||||||||||
| Less distributions: | ||||||||||||||||||||||||
| Dividends from net investment income | (0.26 | ) | (0.51 | ) | (0.47 | ) | (0.47 | ) | (0.49 | ) | (0.56 | ) | ||||||||||||
| Distributions from net realized gains | — | — | — | (0.00 | )(2) | (0.12 | ) | (0.01 | ) | |||||||||||||||
| Total distributions | (0.26 | ) | (0.51 | ) | (0.47 | ) | (0.47 | ) | (0.61 | ) | (0.57 | ) | ||||||||||||
| Net asset value, end of period | $ | 10.43 | $ | 10.52 | $ | 10.55 | $ | 10.83 | $ | 10.88 | $ | 10.86 | ||||||||||||
| Total return | 1.56 | %(3) | 4.70 | % | 1.77 | % | 3.91 | % | 5.89 | % | 8.02 | % | ||||||||||||
| Supplemental data and ratios: | ||||||||||||||||||||||||
| Net assets, end of period | $ | 323,665,311 | $ | 326,835,399 | $ | 231,800,807 | $ | 191,563,699 | $ | 149,836,855 | $ | 146,236,339 | ||||||||||||
| Ratio of expenses to average net assets | 0.30 | %(4) | 0.30 | % | 0.30 | % | 0.30 | % | 0.30 | % | 0.30 | % | ||||||||||||
| Ratio of net investment income | ||||||||||||||||||||||||
| to average net assets | 5.14 | %(4) | 4.90 | % | 4.34 | % | 4.32 | % | 4.39 | % | 5.20 | % | ||||||||||||
Portfolio turnover rate(5) | 24.1 | %(3) | 44.8 | % | 42.1 | % | 44.8 | % | 64.4 | % | 41.1 | % | ||||||||||||
(1) | Calculated using average shares outstanding during the period. |
(2) | Amount is less than $0.01. |
(3) | Not annualized. |
(4) | Annualized. |
(5) | Portfolio turnover is calculated on the basis of the Fund as a whole without distinguishing between the classes of shares issued. |
The accompanying notes are an integral part of these financial statements.
Page 65
Baird Funds, Inc.
Financial Highlights |
Baird Intermediate Bond Fund – Investor Class | ||||||||||||||||||||||||
| Six Months | ||||||||||||||||||||||||
| Ended | ||||||||||||||||||||||||
| June 30, 2007 | Year Ended December 31, | |||||||||||||||||||||||
| (Unaudited) | 2006 | 2005 | 2004 | 2003 | 2002 | |||||||||||||||||||
| Per Share Data: | ||||||||||||||||||||||||
| Net asset value, beginning of period | $ | 10.85 | $ | 10.86 | $ | 11.13 | $ | 11.17 | $ | 11.13 | $ | 10.71 | ||||||||||||
| Income from investment operations: | ||||||||||||||||||||||||
| Net investment income | 0.26 | 0.50 | (1) | 0.45 | 0.45 | (1) | 0.48 | 0.54 | (1) | |||||||||||||||
| Net realized and unrealized | ||||||||||||||||||||||||
| gains (losses) on investments | (0.11 | ) | (0.03 | ) | (0.28 | ) | (0.05 | ) | 0.14 | 0.27 | ||||||||||||||
| Total from investment operations | 0.15 | 0.47 | 0.17 | 0.40 | 0.62 | 0.81 | ||||||||||||||||||
| Less distributions: | ||||||||||||||||||||||||
| Dividends from net investment income | (0.25 | ) | (0.48 | ) | (0.44 | ) | (0.44 | ) | (0.46 | ) | (0.38 | ) | ||||||||||||
| Distributions from net realized gains | — | — | — | (0.00 | )(2) | (0.12 | ) | (0.01 | ) | |||||||||||||||
| Total distributions | (0.25 | ) | (0.48 | ) | (0.44 | ) | (0.44 | ) | (0.58 | ) | (0.39 | ) | ||||||||||||
| Net asset value, end of period | $ | 10.75 | $ | 10.85 | $ | 10.86 | $ | 11.13 | $ | 11.17 | $ | 11.13 | ||||||||||||
| Total return | 1.39 | %(3) | 4.47 | % | 1.56 | % | 3.65 | % | 5.61 | % | 7.74 | % | ||||||||||||
| Supplemental data and ratios: | ||||||||||||||||||||||||
| Net assets, end of period | $ | 638,330 | $ | 1,207,214 | $ | 2,829,659 | $ | 3,012,328 | $ | 1,321,648 | $ | 1,127,162 | ||||||||||||
| Ratio of expenses to average net assets | 0.55 | %(4) | 0.55 | % | 0.55 | % | 0.55 | % | 0.55 | % | 0.55 | % | ||||||||||||
| Ratio of net investment income | ||||||||||||||||||||||||
| to average net assets | 4.89 | %(4) | 4.65 | % | 4.09 | % | 4.07 | % | 4.14 | % | 4.95 | % | ||||||||||||
Portfolio turnover rate(5) | 24.1 | %(3) | 44.8 | % | 42.1 | % | 44.8 | % | 64.4 | % | 41.1 | % | ||||||||||||
(1) | Calculated using average shares outstanding during the period. |
(2) | Amount is less than $0.01. |
(3) | Not Annualized. |
(4) | Annualized. |
(5) | Portfolio turnover is calculated on the basis of the Fund as a whole without distinguishing between the classes of shares issued. |
The accompanying notes are an integral part of these financial statements.
Page 66
Baird Funds, Inc.
Financial Highlights |
Baird Aggregate Bond Fund – Institutional Class | ||||||||||||||||||||||||
| Six Months | ||||||||||||||||||||||||
| Ended | ||||||||||||||||||||||||
| June 30, 2007 | Year Ended December 31, | |||||||||||||||||||||||
| (Unaudited) | 2006 | 2005 | 2004 | 2003 | 2002 | |||||||||||||||||||
| Per Share Data: | ||||||||||||||||||||||||
| Net asset value, beginning of period | $ | 10.51 | $ | 10.54 | $ | 10.74 | $ | 10.71 | $ | 10.69 | $ | 10.51 | ||||||||||||
| Income from investment operations: | ||||||||||||||||||||||||
| Net investment income | 0.27 | 0.52 | 0.49 | (1) | 0.49 | (1) | 0.56 | 0.62 | ||||||||||||||||
| Net realized and unrealized | ||||||||||||||||||||||||
| gains (losses) on investments | (0.14 | ) | (0.03 | ) | (0.19 | ) | 0.07 | 0.20 | 0.23 | |||||||||||||||
| Total from investment operations | 0.13 | 0.49 | 0.30 | 0.56 | 0.76 | 0.85 | ||||||||||||||||||
| Less distributions: | ||||||||||||||||||||||||
| Dividends from net investment income | (0.26 | ) | (0.52 | ) | (0.49 | ) | (0.50 | ) | (0.56 | ) | (0.62 | ) | ||||||||||||
| Distributions from net realized gains | — | (0.00 | )(2) | (0.01 | ) | (0.03 | ) | (0.18 | ) | (0.05 | ) | |||||||||||||
| Total distributions | (0.26 | ) | (0.52 | ) | (0.50 | ) | (0.53 | ) | (0.74 | ) | (0.67 | ) | ||||||||||||
| Net asset value, end of period | $ | 10.38 | $ | 10.51 | $ | 10.54 | $ | 10.74 | $ | 10.71 | $ | 10.69 | ||||||||||||
| Total return | 1.25 | %(3) | 4.88 | % | 2.85 | % | 5.30 | % | 7.19 | % | 8.30 | % | ||||||||||||
| Supplemental data and ratios: | ||||||||||||||||||||||||
| Net assets, end of period | $ | 504,559,013 | $ | 334,907,855 | $ | 227,132,399 | $ | 115,382,862 | $ | 91,550,534 | $ | 87,847,176 | ||||||||||||
| Ratio of expenses to average net assets | 0.30 | %(4) | 0.30 | % | 0.30 | % | 0.30 | % | 0.30 | % | 0.30 | % | ||||||||||||
| Ratio of net investment income | ||||||||||||||||||||||||
| to average net assets | 5.34 | %(4) | 5.11 | % | 4.56 | % | 4.58 | % | 4.85 | % | 5.75 | % | ||||||||||||
Portfolio turnover rate(5) | 21.5 | %(3) | 52.4 | % | 46.0 | % | 72.6 | % | 106.7 | % | 51.2 | % | ||||||||||||
(1) | Calculated using average shares outstanding during the period. |
(2) | Amount is less than $0.01. |
(3) | Not annualized. |
(4) | Annualized. |
(5) | Portfolio turnover is calculated on the basis of the Fund as a whole without distinguishing between the classes of shares issued. |
The accompanying notes are an integral part of these financial statements.
Page 67
Baird Funds, Inc.
Financial Highlights |
Baird Aggregate Bond Fund – Investor Class | ||||||||||||||||||||||||
| Six Months | ||||||||||||||||||||||||
| Ended | ||||||||||||||||||||||||
| June 30, 2007 | Year Ended December 31, | |||||||||||||||||||||||
| (Unaudited) | 2006 | 2005 | 2004 | 2003 | 2002 | |||||||||||||||||||
| Per Share Data: | ||||||||||||||||||||||||
| Net asset value, beginning of period | $ | 10.73 | $ | 10.75 | $ | 10.95 | $ | 10.88 | $ | 10.84 | $ | 10.57 | ||||||||||||
| Income from investment operations: | ||||||||||||||||||||||||
| Net investment income | 0.26 | 0.50 | 0.47 | (1) | 0.48 | (1) | 0.55 | 0.60 | (1) | |||||||||||||||
| Net realized and unrealized | ||||||||||||||||||||||||
| gains (losses) on investments | (0.13 | ) | (0.02 | ) | (0.19 | ) | 0.07 | 0.19 | 0.23 | |||||||||||||||
| Total from investment operations | 0.13 | 0.48 | 0.28 | 0.55 | 0.74 | 0.83 | ||||||||||||||||||
| Less distributions: | ||||||||||||||||||||||||
| Dividends from net investment income | (0.25 | ) | (0.50 | ) | (0.47 | ) | (0.45 | ) | (0.52 | ) | (0.51 | ) | ||||||||||||
| Distributions from net realized gains | — | (0.00 | )(2) | (0.01 | ) | (0.03 | ) | (0.18 | ) | (0.05 | ) | |||||||||||||
| Total distributions | (0.25 | ) | (0.50 | ) | (0.48 | ) | (0.48 | ) | (0.70 | ) | (0.56 | ) | ||||||||||||
| Net asset value, end of period | $ | 10.61 | $ | 10.73 | $ | 10.75 | $ | 10.95 | $ | 10.88 | $ | 10.84 | ||||||||||||
| Total return | 1.20 | %(3) | 4.61 | % | 2.54 | % | 5.20 | % | 6.95 | % | 8.08 | % | ||||||||||||
| Supplemental data and ratios: | ||||||||||||||||||||||||
| Net assets, end of period | $ | 2,599,622 | $ | 1,848,622 | $ | 1,289,926 | $ | 708,858 | $ | 719,844 | $ | 845,481 | ||||||||||||
| Ratio of expenses to average net assets | 0.55 | %(4) | 0.55 | % | 0.55 | % | 0.55 | % | 0.55 | % | 0.55 | % | ||||||||||||
| Ratio of net investment income | ||||||||||||||||||||||||
| to average net assets | 5.09 | %(4) | 4.86 | % | 4.31 | % | 4.33 | % | 4.60 | % | 5.50 | % | ||||||||||||
Portfolio turnover rate(5) | 21.5 | %(3) | 52.4 | % | 46.0 | % | 72.6 | % | 106.7 | % | 51.2 | % | ||||||||||||
(1) | Calculated using average shares outstanding during the period. |
(2) | Amount is less than $0.01. |
(3) | Not annualized. |
(4) | Annualized. |
(5) | Portfolio turnover is calculated on the basis of the Fund as a whole without distinguishing between the classes of shares issued. |
The accompanying notes are an integral part of these financial statements.
Page 68
Baird Funds, Inc.
Financial Highlights |
Baird Intermediate Municipal Bond Fund – Institutional Class | ||||||||||||||||||||||||
| Six Months | ||||||||||||||||||||||||
| Ended | ||||||||||||||||||||||||
| June 30, 2007 | Year Ended December 31, | |||||||||||||||||||||||
| (Unaudited) | 2006 | 2005 | 2004 | 2003 | 2002 | |||||||||||||||||||
| Per Share Data: | ||||||||||||||||||||||||
| Net asset value, beginning of period | $ | 10.55 | $ | 10.56 | $ | 10.81 | $ | 10.91 | $ | 10.86 | $ | 10.25 | ||||||||||||
| Income from investment operations: | ||||||||||||||||||||||||
Net investment income(1) | 0.21 | 0.39 | 0.39 | 0.40 | 0.42 | 0.43 | ||||||||||||||||||
| Net realized and unrealized | ||||||||||||||||||||||||
| gains (losses) on investments | (0.18 | ) | (0.01 | ) | (0.25 | ) | (0.11 | ) | 0.10 | 0.64 | ||||||||||||||
| Total from investment operations | 0.03 | 0.38 | 0.14 | 0.29 | 0.52 | 1.07 | ||||||||||||||||||
| Less distributions: | ||||||||||||||||||||||||
| Dividends from net investment income | (0.19 | ) | (0.39 | ) | (0.39 | ) | (0.39 | ) | (0.43 | ) | (0.46 | ) | ||||||||||||
| Distributions from net realized gains | — | — | — | — | (0.04 | ) | (0.00 | )(2) | ||||||||||||||||
| Total distributions | (0.19 | ) | (0.39 | ) | (0.39 | ) | (0.39 | ) | (0.47 | ) | (0.46 | ) | ||||||||||||
| Net asset value, end of period | $ | 10.39 | $ | 10.55 | $ | 10.56 | $ | 10.81 | $ | 10.91 | $ | 10.86 | ||||||||||||
| Total return | 0.31 | %(3) | 3.69 | % | 1.33 | % | 2.69 | % | 4.91 | % | 10.72 | % | ||||||||||||
| Supplemental data and ratios: | ||||||||||||||||||||||||
| Net assets, end of period | $ | 64,769,222 | $ | 64,932,629 | $ | 53,831,848 | $ | 36,889,211 | $ | 30,234,195 | $ | 31,221,508 | ||||||||||||
| Ratio of expenses to average net assets | 0.30 | %(4) | 0.30 | % | 0.30 | % | 0.30 | % | 0.30 | % | 0.30 | % | ||||||||||||
| Ratio of net investment income | ||||||||||||||||||||||||
| to average net assets | 3.95 | %(4) | 3.72 | % | 3.64 | % | 3.70 | % | 3.88 | % | 4.11 | % | ||||||||||||
Portfolio turnover rate(5) | 1.5 | %(3) | 25.1 | % | 13.7 | % | 4.2 | % | 17.7 | % | 32.6 | % | ||||||||||||
(1) | Calculated using average shares outstanding during the period. |
(2) | Amount is less than $0.01. |
(3) | Not annualized. |
(4) | Annualized. |
(5) | Portfolio turnover is calculated on the basis of the Fund as a whole without distinguishing between the classes of shares issued. |
The accompanying notes are an integral part of these financial statements.
Page 69
Baird Funds, Inc.
Financial Highlights |
Baird Intermediate Municipal Bond Fund – Investor Class | ||||||||||||||||||||||||
| Six Months | ||||||||||||||||||||||||
| Ended | ||||||||||||||||||||||||
| June 30, 2007 | Year Ended December 31, | |||||||||||||||||||||||
| (Unaudited) | 2006 | 2005 | 2004 | 2003 | 2002 | |||||||||||||||||||
| Per Share Data: | �� | |||||||||||||||||||||||
| Net asset value, beginning of period | $ | 10.75 | $ | 10.75 | $ | 10.99 | $ | 11.09 | $ | 11.02 | $ | 10.27 | ||||||||||||
| Income from investment operations: | ||||||||||||||||||||||||
Net investment income(1) | 0.20 | 0.37 | 0.37 | 0.38 | 0.40 | 0.41 | ||||||||||||||||||
| Net realized and unrealized | ||||||||||||||||||||||||
| gains (losses) on investments | (0.18 | ) | (0.01 | ) | (0.25 | ) | (0.12 | ) | 0.10 | 0.64 | ||||||||||||||
| Total from investment operations | 0.02 | 0.36 | 0.12 | 0.26 | 0.50 | 1.05 | ||||||||||||||||||
| Less distributions: | ||||||||||||||||||||||||
| Dividends from net investment income | (0.18 | ) | (0.36 | ) | (0.36 | ) | (0.36 | ) | (0.39 | ) | (0.30 | ) | ||||||||||||
| Distributions from net realized gains | — | — | — | — | (0.04 | ) | (0.00 | )(2) | ||||||||||||||||
| Total distributions | (0.18 | ) | (0.36 | ) | (0.36 | ) | (0.36 | ) | (0.43 | ) | (0.30 | ) | ||||||||||||
| Net asset value, end of period | $ | 10.59 | $ | 10.75 | $ | 10.75 | $ | 10.99 | $ | 11.09 | $ | 11.02 | ||||||||||||
| Total return | 0.18 | %(3) | 3.44 | % | 1.13 | % | 2.40 | % | 4.69 | % | 10.46 | % | ||||||||||||
| Supplemental data and ratios: | ||||||||||||||||||||||||
| Net assets, end of period | $ | 317,446 | $ | 544,878 | $ | 1,491,666 | $ | 4,611,766 | $ | 756,792 | $ | 706,207 | ||||||||||||
| Ratio of expenses to average net assets | 0.55 | %(4) | 0.55 | % | 0.55 | % | 0.55 | % | 0.55 | % | 0.55 | % | ||||||||||||
| Ratio of net investment income | ||||||||||||||||||||||||
| to average net assets | 3.70 | %(4) | 3.47 | % | 3.39 | % | 3.45 | % | 3.63 | % | 3.86 | % | ||||||||||||
Portfolio turnover rate(5) | 1.5 | %(3) | 25.1 | % | 13.7 | % | 4.2 | % | 17.7 | % | 32.6 | % | ||||||||||||
(1) | Calculated using average shares outstanding during the period. |
(2) | Amount is less than $0.01. |
(3) | Not annualized. |
(4) | Annualized. |
(5) | Portfolio turnover is calculated on the basis of the Fund as a whole without distinguishing between the classes of shares issued. |
The accompanying notes are an integral part of these financial statements.
Page 70
Baird Funds, Inc.
Financial Highlights |
Baird Core Plus Bond Fund – Institutional Class | ||||||||||||||||||||||||
| Six Months | ||||||||||||||||||||||||
| Ended | ||||||||||||||||||||||||
| June 30, 2007 | Year Ended December 31, | |||||||||||||||||||||||
| (Unaudited) | 2006 | 2005 | 2004 | 2003 | 2002 | |||||||||||||||||||
| Per Share Data: | ||||||||||||||||||||||||
| Net asset value, beginning of period | $ | 10.16 | $ | 10.06 | $ | 10.38 | $ | 10.45 | $ | 10.45 | $ | 10.42 | ||||||||||||
| Income from investment operations: | ||||||||||||||||||||||||
| Net investment income | 0.27 | 0.55 | (1) | 0.51 | (1) | 0.54 | 0.56 | 0.62 | ||||||||||||||||
| Net realized and unrealized | ||||||||||||||||||||||||
| gains (losses) on investments | (0.13 | ) | 0.09 | (0.28 | ) | 0.10 | 0.36 | 0.07 | ||||||||||||||||
| Total from investment operations | 0.14 | 0.64 | 0.23 | 0.64 | 0.92 | 0.69 | ||||||||||||||||||
| Less distributions: | ||||||||||||||||||||||||
| Dividends from net investment income | (0.27 | ) | (0.54 | ) | (0.54 | ) | (0.53 | ) | (0.56 | ) | (0.62 | ) | ||||||||||||
| Distributions from net realized gains | — | — | (0.01 | ) | (0.18 | ) | (0.36 | ) | (0.04 | ) | ||||||||||||||
| Total distributions | (0.27 | ) | (0.54 | ) | (0.55 | ) | (0.71 | ) | (0.92 | ) | (0.66 | ) | ||||||||||||
| Net asset value, end of period | $ | 10.03 | $ | 10.16 | $ | 10.06 | $ | 10.38 | $ | 10.45 | $ | 10.45 | ||||||||||||
| Total return | 1.35 | %(2) | 6.58 | % | 2.23 | % | 6.29 | % | 8.94 | % | 6.90 | % | ||||||||||||
| Supplemental data and ratios: | ||||||||||||||||||||||||
| Net assets, end of period | $ | 58,888,002 | $ | 51,551,017 | $ | 32,173,459 | $ | 32,495,641 | $ | 42,709,634 | $ | 54,221,923 | ||||||||||||
| Ratio of expenses to average net assets | 0.30 | %(3) | 0.30 | % | 0.30 | % | 0.30 | % | 0.30 | % | 0.30 | % | ||||||||||||
| Ratio of net investment income | ||||||||||||||||||||||||
| to average net assets | 5.46 | %(3) | 5.49 | % | 4.92 | % | 4.85 | % | 4.56 | % | 6.03 | % | ||||||||||||
Portfolio turnover rate(4) | 30.0 | %(2) | 62.0 | % | 37.6 | % | 52.5 | % | 103.1 | % | 66.8 | % | ||||||||||||
(1) | Calculated using average shares outstanding during the period. |
(2) | Not annualized. |
(3) | Annualized. |
(4) | Portfolio turnover is calculated on the basis of the Fund as a whole without distinguishing between the classes of shares issued. |
The accompanying notes are an integral part of these financial statements.
Page 71
Baird Funds, Inc.
Financial Highlights |
Baird Core Plus Bond Fund – Investor Class | ||||||||||||||||||||||||
| Six Months | ||||||||||||||||||||||||
| Ended | ||||||||||||||||||||||||
| June 30, 2007 | Year Ended December 31, | |||||||||||||||||||||||
| (Unaudited) | 2006 | 2005 | 2004 | 2003 | 2002 | |||||||||||||||||||
| Per Share Data: | ||||||||||||||||||||||||
| Net asset value, beginning of period | $ | 10.42 | $ | 10.30 | $ | 10.62 | $ | 10.67 | $ | 10.65 | $ | 10.49 | ||||||||||||
| Income from investment operations: | ||||||||||||||||||||||||
| Net investment income | 0.25 | 0.54 | (1) | 0.49 | (1) | 0.53 | 0.53 | (1) | 0.60 | (1) | ||||||||||||||
| Net realized and unrealized | ||||||||||||||||||||||||
| gains (losses) on investments | (0.12 | ) | 0.09 | (0.29 | ) | 0.10 | 0.37 | 0.07 | ||||||||||||||||
| Total from investment operations | 0.13 | 0.63 | 0.20 | 0.63 | 0.90 | 0.67 | ||||||||||||||||||
| Less distributions: | ||||||||||||||||||||||||
| Dividends from net investment income | (0.25 | ) | (0.51 | ) | (0.51 | ) | (0.50 | ) | (0.52 | ) | (0.47 | ) | ||||||||||||
| Distributions from net realized gains | — | — | (0.01 | ) | (0.18 | ) | (0.36 | ) | (0.04 | ) | ||||||||||||||
| Total distributions | (0.25 | ) | (0.51 | ) | (0.52 | ) | (0.68 | ) | (0.88 | ) | (0.51 | ) | ||||||||||||
| Net asset value, end of period | $ | 10.30 | $ | 10.42 | $ | 10.30 | $ | 10.62 | $ | 10.67 | $ | 10.65 | ||||||||||||
| Total return | 1.30 | %(2) | 6.34 | % | 1.93 | % | 6.09 | % | 8.60 | % | 6.58 | % | ||||||||||||
| Supplemental data and ratios: | ||||||||||||||||||||||||
| Net assets, end of period | $ | 652,746 | $ | 288,928 | $ | 449,709 | $ | 125,847 | $ | 124,481 | $ | 296,026 | ||||||||||||
| Ratio of expenses to average net assets | 0.55 | %(3) | 0.55 | % | 0.55 | % | 0.55 | % | 0.55 | % | 0.55 | % | ||||||||||||
| Ratio of net investment income | ||||||||||||||||||||||||
| to average net assets | 5.21 | %(3) | 5.24 | % | 4.67 | % | 4.60 | % | 4.31 | % | 5.78 | % | ||||||||||||
Portfolio turnover rate(4) | 30.0 | %(2) | 62.0 | % | 37.6 | % | 52.5 | % | 103.1 | % | 66.8 | % | ||||||||||||
(1) | Calculated using average shares outstanding during the period. |
(2) | Not annualized. |
(3) | Annualized. |
(4) | Portfolio turnover is calculated on the basis of the Fund as a whole without distinguishing between the classes of shares issued. |
The accompanying notes are an integral part of these financial statements.
Page 72
Baird Funds, Inc.
Financial Highlights |
Baird Short-Term Bond Fund – Institutional Class | ||||||||||||||||
| Six Months | ||||||||||||||||
| Ended | August 31, 2004(1) | |||||||||||||||
| June 30, 2007 | Year Ended December 31, | through | ||||||||||||||
| (Unaudited) | 2006 | 2005 | December 31, 2004 | |||||||||||||
| Per Share Data: | ||||||||||||||||
| Net asset value, beginning of period | $ | 9.81 | $ | 9.79 | $ | 9.93 | $ | 10.00 | ||||||||
| Income from investment operations: | ||||||||||||||||
| Net investment income | 0.24 | 0.43 | 0.33 | 0.08 | ||||||||||||
| Net realized and unrealized | ||||||||||||||||
| gains (losses) on investments | (0.03 | ) | 0.02 | (0.15 | ) | (0.07 | ) | |||||||||
| Total from investment operations | 0.21 | 0.45 | 0.18 | 0.01 | ||||||||||||
| Less distributions: | ||||||||||||||||
| Dividends from net investment income | (0.23 | ) | (0.43 | ) | (0.32 | ) | (0.08 | ) | ||||||||
| Net asset value, end of period | $ | 9.79 | $ | 9.81 | $ | 9.79 | $ | 9.93 | ||||||||
| Total return | 2.14 | %(2) | 4.65 | % | 1.85 | % | 0.10 | %(2) | ||||||||
| Supplemental data and ratios: | ||||||||||||||||
| Net assets, end of period | $ | 168,490,911 | $ | 148,604,711 | $ | 97,057,968 | $ | 31,973,000 | ||||||||
| Ratio of expenses to average net assets | 0.30 | %(3) | 0.30 | % | 0.30 | % | 0.30 | %(3) | ||||||||
| Ratio of net investment income | ||||||||||||||||
| to average net assets | 4.92 | %(3) | 4.48 | % | 3.52 | % | 2.60 | %(3) | ||||||||
| Portfolio turnover rate | 23.8 | %(2) | 41.1 | % | 31.8 | % | 16.7 | %(2) | ||||||||
(1) | Commencement of operations. |
(2) | Not annualized. |
(3) | Annualized. |
The accompanying notes are an integral part of these financial statements.
Page 73
Baird Funds, Inc.
Notes to the Financial Statements June 30, 2007 (Unaudited) |
1. | ORGANIZATION |
Baird Funds, Inc. (the “Corporation”) was incorporated on June 9, 2000 as a Wisconsin corporation and is registered as an open-end investment management company under the Investment Company Act of 1940, as amended (the “1940 Act”). The accompanying financial statements include the Baird Intermediate Bond Fund, Baird Aggregate Bond Fund, Baird Intermediate Municipal Bond Fund, Baird Core Plus Bond Fund and Baird Short-Term Bond Fund (each, a “Fund” and collectively, the “Funds”), five of the eight portfolios comprising the Corporation, each of which is diversified within the meaning of the 1940 Act. Robert W. Baird & Co. Incorporated (“Baird” or the “Advisor”) serves as investment advisor to the Funds.
The Baird Intermediate Bond Fund, Baird Aggregate Bond Fund and Baird Core Plus Bond Fund commenced operations with the sale of both Institutional and Investor class shares on September 29, 2000. The Baird Intermediate Municipal Bond Fund commenced operations with the sale of both Institutional and Investor Class shares on March 30, 2001. The Baird Short-Term Bond Fund commenced operations with the sale of Institutional Class shares on August 31, 2004. The Institutional Class shares are not subject to a distribution and service (12b-1) fee, while the Investor Class shares are subject to a distribution and service (12b-1) fee up to 0.25%.
The investment objective of the Baird Intermediate Bond Fund is to provide an annual rate of total return, before Fund expenses, greater than the annual rate of total return of the Lehman Brothers Intermediate Government/Credit Bond Index. The Lehman Brothers Intermediate Government/Credit Bond Index is an unmanaged, market value weighted index of investment grade, fixed-rate debt, including government and corporate securities, with maturities between one and ten years.
The investment objective of the Baird Aggregate Bond Fund is to provide an annual rate of total return, before Fund expenses, greater than the annual rate of total return of the Lehman Brothers Aggregate Bond Index. The Lehman Brothers Aggregate Bond Index is an unmanaged, market value weighted index of investment grade, fixed-rate debt, including government, corporate, asset-backed, and mortgage-backed securities, with maturities of at least one year.
The primary investment objective of the Baird Intermediate Municipal Bond Fund is to provide current income that is substantially exempt from federal income tax. A secondary objective is to provide total return with relatively low volatility of principal.
The investment objective of the Baird Core Plus Bond Fund is to provide an annual rate of total return, before Fund expenses, greater than the annual rate of total return of the Lehman Brothers U.S. Universal Bond Index. The Lehman Brothers U.S. Universal Bond Index is an unmanaged, market value weighted index of fixed income securities issued in U.S. dollars, including U.S. government and investment grade debt, non-investment grade debt, asset-backed and mortgage-backed securities, Eurobonds, 144A securities and emerging market debt, with maturities of at least one year.
The investment objective of the Baird Short-Term Bond Fund is to provide an annual rate of total return, before Fund expenses, greater than the annual rate of total return of the Lehman Brothers 1-3 Year Government/Credit Bond Index. The Lehman Brothers 1-3 Year Government/Credit Bond Index is an unmanaged, market value weighted index of investment grade, fixed-rate debt, including government and corporate securities, with maturities between one and three years.
Page 74
Baird Funds, Inc.
Notes to the Financial Statements June 30, 2007 (Unaudited) |
| 2. | SIGNIFICANT ACCOUNTING POLICIES |
The following is a summary of significant accounting policies consistently followed by the Funds in the preparation of their financial statements. These policies are in conformity with accounting principles generally accepted in the United States of America.
| a) | Investment Valuation– Because market quotations for most debt securities are not readily available, debt securities are stated at fair value as furnished by an independent pricing service, which uses valuation methods such as matrix pricing and other analytical pricing models, as well as market transactions and dealer quotations. Debt securities purchased with a remaining maturity of 60 days or less are valued at acquisition cost, plus or minus any amortized discount or premium. Investments in mutual funds are valued at their stated net asset value. Common stocks that are listed on a securities exchange (other than NASDAQ) are valued at the last quoted sales price. Securities traded on NASDAQ are valued at the NASDAQ Official Closing Price. Price information on listed stocks is taken from the exchange where the security is primarily traded. Securities that were not traded on the valuation date, as well as stocks that are not listed on an exchange, including NASDAQ, are valued at the average of the current bid and asked price. Other assets and securities for which no quotations are readily available are valued at fair value as determined in good faith by the Advisor in accordance with procedures approved by the Corporation’s Board of Directors. In accordance with such procedures, the Advisor may use broker quotes or, if the broker quotes are unavailable or deemed to be unreliable, fair value will be determined by a valuation committee of the Advisor. In certain limited instances, the Advisor may also determine the fair value of a debt security for up to two trading days using a constant spread methodology authorized by the Board. In determining fair value, the valuation committee takes into account all relevant factors and available information. Consequently, the price of the security used by a Fund to calculate its NAV may differ from quoted or published prices for the same security. Fair value pricing involves subjective judgments and there is no single standard for determining a security’s fair value. As a result, different mutual funds could reasonably arrive at a different fair value for the same security. It is possible that the fair value determined for a security is materially different from the value that could be realized upon the sale of that security or from the values that other mutual funds may determine. |
| In September 2006, the Financial Accounting Standards Board (FASB) issued Statement of Financial Accounting Standards (“SFAS”) No. 157, “Fair Value Measurements.” SFAS No. 157 defines fair value, establishes a framework for measuring fair value in accordance with GAAP, and expands disclosure about fair value measurements. SFAS No. 157 is effective for financial statements issued for fiscal years beginning after November 15, 2007. Management has determined that SFAS No. 157 will have no material impact on the Funds’ financial statements. | |
| b) | Unregistered Securities– Four of the Funds own certain investment securities which are unregistered and thus restricted with respect to resale. These securities consist of securities issued pursuant to Rule 144A under the Securities Act of 1933, which are deemed to be liquid based on several factors. The value of such securities for the Baird Intermediate Bond, Baird Aggregate Bond, Baird Core Plus Bond and Baird Short-Term Bond Funds were $15,767,926 (4.86% of net assets), $19,603,917 (3.87% of net assets), $2,143,297 (3.60% of net assets) and $7,024,530 (4.17% of net assets), respectively, at June 30, 2007. |
Page 75
Baird Funds, Inc.
Notes to the Financial Statements June 30, 2007 (Unaudited) |
| 2. | SIGNIFICANT ACCOUNTING POLICIES (cont.) |
| c) | Foreign Securities– The Funds may invest in U.S. dollar-denominated debt obligations of foreign companies and foreign governments. Investing in securities of foreign companies and foreign governments involves special risks and considerations not typically associated with investing in U.S. companies and the U.S. government. These risks include currency rate fluctuations, political and economic instability and differences in financial reporting standards and less strict regulation of securities markets. Moreover, securities of many foreign companies and foreign governments and their markets may be less liquid and their prices more volatile than those of securities of comparable U.S. companies and the U.S. government. Occasionally, events that affect these values and exchange rates may occur after the close of the exchange on which such securities are traded. If such events materially affect the value of a Fund’s securities, these securities may be valued at their fair value pursuant to procedures adopted by the Board of Directors. |
| d) | Federal Income Taxes– The Funds intend to continue to qualify as regulated investment companies as provided in subchapter M of the Internal Revenue Code and to distribute substantially all of their taxable income to their shareholders in a manner which results in no tax cost to the Funds. Therefore, no federal income or excise tax provision is recorded. |
| Effective June 29, 2007, the Funds adopted Financial Accounting Standards Board (FASB) Interpretation No. 48 (FIN 48),“Accounting for Uncertainty in Income Taxes,” a clarification of FASB Statement No. 109, “Accounting for Income Taxes.” FIN 48 establishes financial reporting rules regarding recognition and measurement of tax positions taken or expected to be taken on a tax return. Management has determined that FIN 48 had no material impact on the Funds’ financial statements. | |
| e) | Allocation of Income and Expenses– Each Fund is charged for those expenses directly attributable to it. Expenses directly attributable to a class of shares, such as Rule 12b-1 distribution fees, are charged to that class of shares. Income, expenses and realized and unrealized gains and losses are allocated to the classes based on their respective net assets. Expenses that are not directly attributable to a Fund are allocated among the Funds in the series in proportion to their assets. |
| f) | Distributions to Shareholders– Dividends from net investment income are declared and paid monthly. Distributions of net realized capital gains, if any, are declared and paid at least annually. |
| g) | Use of Estimates– The preparation of financial statements in conformity with accounting principles generally accepted in the United States of America requires management to make estimates and assumptions that affect the reported amounts of assets and liabilities and disclosure of contingent assets and liabilities at the date of the financial statements and the reported amounts of revenues and expenses during the reporting period. Actual results could differ from those estimates. |
| h) | Other– Investment and shareholder transactions are recorded on trade date. The Funds determine the gain or loss realized from investment transactions by comparing the original cost of the security lot sold with the net sales proceeds. Dividend income is recognized on the ex-dividend date and interest income is recognized on an accrual basis. Premiums and discounts on the purchase of securities are amortized/accreted using the effective interest |
Page 76
Notes to the Financial Statements June 30, 2007 (Unaudited) |
| 2. | SIGNIFICANT ACCOUNTING POLICIES (cont.) |
| method. Accounting principles generally accepted in the United States of America require that permanent financial reporting and tax differences be reclassified in the capital accounts. | |
| i) | Guarantees and Indemnifications– In the normal course of business, the Funds enter into contracts with service providers that contain general indemnification clauses. The Funds’ maximum exposure under these arrangements is unknown and would involve future claims against the Funds that have not yet occurred. Based on experience, the Funds would expect the risk of loss to be remote. |
3. | CAPITAL SHARE TRANSACTIONS |
The following table summarizes the capital share transactions of each Fund for the past two fiscal periods:
BAIRD INTERMEDIATE BOND FUND
| Six Months Ended | Six Months Ended | ||||||||||||||||
| June 30, 2007 | June 30, 2007 | ||||||||||||||||
Institutional Class Shares | Shares | Amount | Investor Class Shares | Shares | Amount | ||||||||||||
| Shares sold | 3,819,189 | $ | 40,237,194 | Shares sold | 168,809 | $ | 1,830,874 | ||||||||||
| Shares issued to | Shares issued to | ||||||||||||||||
| shareholders in | shareholders in | ||||||||||||||||
| reinvestment of dividends | 700,483 | 7,365,153 | reinvestment of dividends | 2,114 | 22,937 | ||||||||||||
| Shares redeemed | (4,535,565 | ) | (47,633,480 | ) | Shares redeemed | (222,832 | ) | (2,428,781 | ) | ||||||||
| Net decrease | (15,893 | ) | $ | (31,133 | ) | Net decrease | (51,909 | ) | $ | (574,970 | ) | ||||||
| Shares Outstanding: | Shares Outstanding: | ||||||||||||||||
| Beginning of period | 31,062,601 | Beginning of period | 111,284 | ||||||||||||||
| End of period | 31,046,708 | End of period | 59,375 | ||||||||||||||
| Year Ended | Year Ended | ||||||||||||||||
| December 31, 2006 | December 31, 2006 | ||||||||||||||||
Institutional Class Shares | Shares | Amount | Investor Class Shares | Shares | Amount | ||||||||||||
| Shares sold | 10,666,486 | $ | 111,623,242 | Shares sold | 7,531 | $ | 81,500 | ||||||||||
| Shares issued to | Shares issued to | ||||||||||||||||
| shareholders in | shareholders in | ||||||||||||||||
| reinvestment of dividends | 1,136,626 | 11,873,363 | reinvestment of dividends | 5,495 | 59,100 | ||||||||||||
| Shares redeemed | (2,710,776 | ) | (28,370,722 | ) | Shares redeemed | (162,273 | ) | (1,744,715 | ) | ||||||||
| Net increase | 9,092,336 | $ | 95,125,883 | Net decrease | (149,247 | ) | $ | (1,604,115 | ) | ||||||||
| Shares Outstanding: | Shares Outstanding: | ||||||||||||||||
| Beginning of period | 21,970,265 | Beginning of period | 260,531 | ||||||||||||||
| End of period | 31,062,601 | End of period | 111,284 | ||||||||||||||
Page 77
Notes to the Financial Statements June 30, 2007 (Unaudited) |
| 3. | CAPITAL SHARE TRANSACTIONS (cont.) |
BAIRD AGGREGATE BOND FUND
| Six Months Ended | Six Months Ended | ||||||||||||||||
| June 30, 2007 | June 30, 2007 | ||||||||||||||||
Institutional Class Shares | Shares | Amount | Investor Class Shares | Shares | Amount | ||||||||||||
| Shares sold | 19,002,721 | $ | 199,548,080 | Shares sold | 119,258 | $ | 1,281,198 | ||||||||||
| Shares issued to | Shares issued to | ||||||||||||||||
| shareholders in | shareholders in | ||||||||||||||||
| reinvestment of dividends | 794,765 | 8,337,474 | reinvestment of dividends | 5,040 | 54,048 | ||||||||||||
| Shares redeemed | (3,068,786 | ) | (32,126,923 | ) | Shares redeemed | (51,483 | ) | (551,737 | ) | ||||||||
| Net increase | 16,728,700 | $ | 175,758,631 | Net increase | 72,815 | $ | 783,509 | ||||||||||
| Shares Outstanding: | Shares Outstanding: | ||||||||||||||||
| Beginning of period | 31,878,802 | Beginning of period | 172,253 | ||||||||||||||
| End of period | 48,607,502 | End of period | 245,068 | ||||||||||||||
| Year Ended | Year Ended | ||||||||||||||||
| December 31, 2006 | December 31, 2006 | ||||||||||||||||
Institutional Class Shares | Shares | Amount | Investor Class Shares | Shares | Amount | ||||||||||||
| Shares sold | 14,798,845 | $ | 154,503,654 | Shares sold | 91,604 | $ | 983,015 | ||||||||||
| Shares issued to | Shares issued to | ||||||||||||||||
| shareholders in | shareholders in | ||||||||||||||||
| reinvestment of dividends | 1,141,334 | 11,883,604 | reinvestment of dividends | 5,207 | 55,410 | ||||||||||||
| Shares redeemed | (5,615,794 | ) | (58,350,968 | ) | Shares redeemed | (44,506 | ) | (471,602 | ) | ||||||||
| Net increase | 10,324,385 | $ | 108,036,290 | Net increase | 52,305 | $ | 566,823 | ||||||||||
| Shares Outstanding: | Shares Outstanding: | ||||||||||||||||
| Beginning of period | 21,554,417 | Beginning of period | 119,948 | ||||||||||||||
| End of period | 31,878,802 | End of period | 172,253 | ||||||||||||||
Page 78
Baird Funds, Inc.
Notes to the Financial Statements June 30, 2007 (Unaudited) |
| 3. | CAPITAL SHARE TRANSACTIONS (cont.) |
BAIRD INTERMEDIATE MUNICIPAL BOND FUND
| Six Months Ended | Six Months Ended | ||||||||||||||||
| June 30, 2007 | June 30, 2007 | ||||||||||||||||
Institutional Class Shares | Shares | Amount | Investor Class Shares | Shares | Amount | ||||||||||||
| Shares sold | 741,254 | $ | 7,804,180 | Shares sold | 1,399 | $ | 15,022 | ||||||||||
| Shares issued to | Shares issued to | ||||||||||||||||
| shareholders in | shareholders in | ||||||||||||||||
| reinvestment of dividends | 89,310 | 937,720 | reinvestment of dividends | 711 | 7,621 | ||||||||||||
| Shares redeemed | (748,935 | ) | (7,879,374 | ) | Shares redeemed | (22,789 | ) | (244,725 | ) | ||||||||
| Other capital | Other capital | ||||||||||||||||
contributions(1) | — | 2,555 | contributions(1) | — | 40 | ||||||||||||
| Net increase | 81,629 | $ | 865,081 | Net decrease | (20,679 | ) | $ | (222,042 | ) | ||||||||
| Shares Outstanding: | Shares Outstanding: | ||||||||||||||||
| Beginning of period | 6,152,087 | Beginning of period | 50,663 | ||||||||||||||
| End of period | 6,233,716 | End of period | 29,984 | ||||||||||||||
| Year Ended | Year Ended | ||||||||||||||||
| December 31, 2006 | December 31, 2006 | ||||||||||||||||
Institutional Class Shares | Shares | Amount | Investor Class Shares | Shares | Amount | ||||||||||||
| Shares sold | 3,475,609 | $ | 36,579,100 | Shares sold | 8,603 | $ | 93,068 | ||||||||||
| Shares issued to | Shares issued to | ||||||||||||||||
| shareholders in | shareholders in | ||||||||||||||||
| reinvestment of dividends | 191,986 | 2,016,861 | reinvestment of dividends | 2,354 | 25,191 | ||||||||||||
| Shares redeemed | (2,611,483 | ) | (27,462,382 | ) | Shares redeemed | (98,994 | ) | (1,062,648 | ) | ||||||||
| Net increase | 1,056,112 | $ | 11,133,579 | Net decrease | (88,037 | ) | $ | (944,389 | ) | ||||||||
| Shares Outstanding: | Shares Outstanding: | ||||||||||||||||
| Beginning of period | 5,095,975 | Beginning of period | 138,700 | ||||||||||||||
| End of period | 6,152,087 | End of period | 50,663 | ||||||||||||||
| (1) | Voluntary reimbursement by Advisor of fees associated with the Fund’s investments in other investment companies. |
Page 79
Baird Funds, Inc.
Notes to the Financial Statements June 30, 2007 (Unaudited) |
3. | CAPITAL SHARE TRANSACTIONS (cont.) |
BAIRD CORE PLUS BOND FUND
| Six Months Ended | Six Months Ended | ||||||||||||||||
| June 30, 2007 | June 30, 2007 | ||||||||||||||||
Institutional Class Shares | Shares | Amount | Investor Class Shares | Shares | Amount | ||||||||||||
| Shares sold | 877,829 | $ | 8,957,172 | Shares sold | 43,595 | $ | 454,044 | ||||||||||
| Shares issued to | Shares issued to | ||||||||||||||||
| shareholders in | shareholders in | ||||||||||||||||
| reinvestment of dividends | 137,404 | 1,393,534 | reinvestment of dividends | 778 | 8,092 | ||||||||||||
| Shares redeemed | (221,971 | ) | (2,261,782 | ) | Shares redeemed | (8,736 | ) | (91,269 | ) | ||||||||
| Other capital | Other capital | ||||||||||||||||
contributions(1) | — | 526 | contributions(1) | — | 5 | ||||||||||||
| Net increase | 793,262 | $ | 8,089,450 | Net increase | 35,637 | $ | 370,872 | ||||||||||
| Shares Outstanding: | Shares Outstanding: | ||||||||||||||||
| Beginning of period | 5,075,175 | Beginning of period | 27,724 | ||||||||||||||
| End of period | 5,868,437 | End of period | 63,361 | ||||||||||||||
| Year Ended | Year Ended | ||||||||||||||||
| December 31, 2006 | December 31, 2006 | ||||||||||||||||
Institutional Class Shares | Shares | Amount | Investor Class Shares | Shares | Amount | ||||||||||||
| Shares sold | 3,548,621 | $ | 35,649,048 | Shares sold | 8,089 | $ | 82,802 | ||||||||||
| Shares issued to | Shares issued to | ||||||||||||||||
| shareholders in | shareholders in | ||||||||||||||||
| reinvestment of dividends | 141,751 | 1,416,531 | reinvestment of dividends | 1,301 | 13,305 | ||||||||||||
| Shares redeemed | (1,814,933 | ) | (18,051,110 | ) | Shares redeemed | (25,330 | ) | (260,389 | ) | ||||||||
| Other capital | Other capital | ||||||||||||||||
contributions(2) | — | 71 | contributions(2) | — | 0 | (3) | |||||||||||
| Net increase | 1,875,439 | $ | 19,014,540 | Net decrease | (15,940 | ) | $ | (164,282 | ) | ||||||||
| Shares Outstanding: | Shares Outstanding: | ||||||||||||||||
| Beginning of period | 3,199,736 | Beginning of period | 43,664 | ||||||||||||||
| End of period | 5,075,175 | End of period | 27,724 | ||||||||||||||
| (1) | Voluntary reimbursement by Advisor of fees associated with the Fund’s investments in other investment companies. |
| (2) | Reimbursement for NAV Break. |
| (3) | Amount is less than $1. |
Page 80
Baird Funds, Inc.
Notes to the Financial Statements June 30, 2007 (Unaudited) |
| 3. | CAPITAL SHARE TRANSACTIONS (cont.) |
BAIRD SHORT-TERM BOND FUND
| Six Months Ended | Year Ended | ||||||||||||||||
| June 30, 2007 | December 31, 2006 | ||||||||||||||||
Institutional Class Shares | Shares | Amount | Institutional Class Shares | Shares | Amount | ||||||||||||
| Shares sold | 2,943,265 | $ | 28,932,211 | Shares sold | 8,124,186 | $ | 79,434,155 | ||||||||||
| Shares issued to | Shares issued to | ||||||||||||||||
| shareholders in | shareholders in | ||||||||||||||||
| reinvestment of dividends | 378,446 | 3,713,065 | reinvestment of dividends | 559,203 | 5,464,609 | ||||||||||||
| Shares redeemed | (1,260,168 | ) | (12,386,052 | ) | Shares redeemed | (3,449,049 | ) | (33,715,361 | ) | ||||||||
| Net increase | 2,061,543 | $ | 20,259,224 | Net increase | 5,234,340 | $ | 51,183,403 | ||||||||||
| Shares Outstanding: | Shares Outstanding: | ||||||||||||||||
| Beginning of period | 15,147,163 | Beginning of period | 9,912,823 | ||||||||||||||
| End of period | 17,208,706 | End of period | 15,147,163 | ||||||||||||||
4. | INVESTMENT TRANSACTIONS AND INCOME TAX INFORMATION |
During the six months ended June 30, 2007, purchases and sales of investment securities (excluding short-term investments) were as follows:
| Baird | ||||||||||||||||||||
| Baird | Baird | Intermediate | Baird | Baird | ||||||||||||||||
| Intermediate | Aggregate | Municipal | Core Plus | Short-Term | ||||||||||||||||
| Bond Fund | Bond Fund | Bond Fund | Bond Fund | Bond Fund | ||||||||||||||||
| Purchases: | ||||||||||||||||||||
| U.S. Government | $ | 41,462,122 | $ | 79,461,097 | $ | — | $ | 5,301,655 | $ | 9,048,729 | ||||||||||
| Other | $ | 33,475,063 | $ | 162,142,438 | $ | 1,781,236 | $ | 17,948,644 | $ | 31,747,302 | ||||||||||
| Sales: | ||||||||||||||||||||
| U.S. Government | $ | 52,888,242 | $ | 33,458,705 | $ | — | $ | 9,213,271 | $ | 12,689,766 | ||||||||||
| Other | $ | 35,194,044 | $ | 50,941,813 | $ | 969,760 | $ | 6,686,929 | $ | 20,291,513 | ||||||||||
Page 81
Baird Funds, Inc.
Notes to the Financial Statements June 30, 2007 (Unaudited) |
| 4. | INVESTMENT TRANSACTIONS AND INCOME TAX INFORMATION (cont.) |
At December 31, 2006, gross unrealized appreciation and depreciation of investments and distributable ordinary income and long-term capital gains for federal tax purposes were as follows:
Intermediate | ||||||||||||||||||||
Intermediate | Aggregate | Municipal | Core Plus | Short-Term | ||||||||||||||||
Bond Fund | Bond Fund | Bond Fund | Bond Fund | Bond Fund | ||||||||||||||||
| Cost of Investments | $ | 352,890,822 | $ | 355,290,950 | $ | 64,184,619 | $ | 55,485,672 | $ | 162,277,229 | ||||||||||
| Gross unrealized appreciation | $ | 2,414,197 | $ | 3,195,824 | $ | 612,696 | $ | 733,192 | $ | 282,887 | ||||||||||
| Gross unrealized depreciation | (3,173,709 | ) | (3,304,445 | ) | (495,225 | ) | (614,191 | ) | (769,628 | ) | ||||||||||
| Net unrealized appreciation/depreciation | $ | (759,512 | ) | $ | (108,621 | ) | $ | 117,471 | $ | 119,001 | $ | (486,741 | ) | |||||||
| Undistributed ordinary income | $ | 207,297 | $ | 177,153 | $ | 9,471 | $ | 33,503 | $ | 78,385 | ||||||||||
| Undistributed long-term capital gain | — | — | — | — | — | |||||||||||||||
| Total distributable earnings | $ | 207,297 | $ | 177,153 | $ | 9,471 | $ | 33,503 | $ | 78,385 | ||||||||||
| Other accumulated gains (losses) | $ | (3,136,565 | ) | $ | (1,020,356 | ) | $ | (336,718 | ) | $ | (111,190 | ) | $ | (356,847 | ) | |||||
| Total accumulated earnings (losses) | $ | (3,688,780 | ) | $ | (951,824 | ) | $ | (209,776 | ) | $ | 41,314 | $ | (765,203 | ) | ||||||
On the Statements of Asset and Liabilities, the following adjustments were made for permanent tax adjustments:
Undistributed Net | Accumulated Net | Paid In | ||||||||||
Investment Income (Loss) | Realized Gain (Loss) | Capital | ||||||||||
| Baird Intermediate Bond Fund | $ | 78,450 | $ | (78,450 | ) | — | ||||||
| Baird Aggregate Bond Fund | $ | 65,084 | $ | (65,084 | ) | — | ||||||
| Baird Intermediate Municipal Bond Fund | — | $ | (38,217 | ) | $ | 38,217 | ||||||
| Baird Core Plus Bond Fund | $ | 17,189 | $ | (17,189 | ) | — | ||||||
| Baird Short-Term Bond Fund | $ | (54,150 | ) | $ | 54,150 | — | ||||||
The permanent differences primarily relate to reclasses from paydown gains and losses from asset backed securities.
Baird Funds, Inc.
Page 82
Notes to the Financial Statements June 30, 2007 (Unaudited) |
4. | INVESTMENT TRANSACTIONS AND INCOME TAX INFORMATION (cont.) |
The tax components of dividends paid during the periods shown below were as follows:
Six Months Ended | Year Ended | |||||||||||||||
June 30, 2007 | December 31, 2006 | |||||||||||||||
Ordinary | Long-Term | Ordinary | Long-Term | |||||||||||||
Income | Capital Gains | Income | Capital Gains | |||||||||||||
Distributions | Distributions | Distributions | Distributions | |||||||||||||
| Baird Intermediate Bond Fund | $ | 8,361,690 | $ | — | $ | 13,585,132 | $ | — | ||||||||
| Baird Aggregate Bond Fund | $ | 10,399,966 | $ | — | $ | 13,167,714 | $ | 121,173 | ||||||||
| Baird Intermediate Municipal Bond Fund | $ | — | $ | — | $ | — | $ | — | ||||||||
| Baird Core Plus Bond Fund | $ | 1,468,982 | $ | — | $ | 1,742,409 | $ | — | ||||||||
| Baird Short-Term Bond Fund | $ | 3,769,417 | $ | — | $ | 5,563,493 | $ | — | ||||||||
For the six months ended June 30, 2007 and the year ended December 31, 2006, distributions of $1,191,014 and $2,571,346, respectively, from the Baird Intermediate Municipal Bond Fund were tax-exempt.
Under the current tax law, capital losses realized after October 31 may be deferred and treated as occurring on the first day of the following fiscal year. For the year ended December 31, 2006, the Baird Intermediate Bond, Baird Aggregate Bond, Baird Intermediate Municipal Bond, Baird Core Plus Bond and Baird Short-Term Bond Funds elected to defer capital losses occurring between November 1, 2006 and December 31, 2006 in the amount of $6,343, $73,662, $94,149, $72,252 and $40,321, respectively.
At December 31, 2006, the Baird Intermediate Bond, Baird Aggregate Bond, Baird Intermediate Municipal Bond, Baird Core Plus Bond and Baird Short-Term Bond Funds had accumulated net realized capital loss carryovers of $3,130,445, $945,859, $242,569, $38,938 and $316,526, respectively. With respect to Baird Intermediate Bond Fund, $485,569 of the capital loss carryovers expire in 2012, $938,114 expire in 2013 and $1,706,762 expire in 2014. With respect to Baird Aggregate Bond Fund, $945,859 of the capital loss carryovers expire in 2014. With respect to Baird Intermediate Municipal Bond Fund, $6,626 of the capital loss carryovers expire in 2012, $184,660 expire in 2013 and $51,283 expire in 2014. With respect to Baird Core Plus Fund, $5,975 of the capital loss carryovers expire in 2013 and $32,963 expire in 2014. With respect to Baird Short-Term Bond Fund, $8,150 of the capital loss carryovers expire in 2012, $59,190 expire in 2013 and $249,186 expire in 2014. To the extent these Funds realize future net capital gains, those gains will be offset by any unused capital loss carryovers.
5. | INVESTMENT ADVISORY AND OTHER AGREEMENTS |
The Funds have entered into an Investment Advisory Agreement with Baird for the provision of investment advisory services. Pursuant to the Investment Advisory Agreement, the Advisor is entitled to receive a fee, calculated daily and payable monthly, at the annual rate of 0.25% for the Baird Intermediate Bond Fund, Baird Aggregate Bond Fund, Baird Intermediate Municipal Bond Fund, Baird Core Plus Bond Fund and Baird Short-Term Bond Fund as applied to the respective Fund’s average daily net assets. Certain officers of the Advisor are also officers of the Funds.
Baird Funds, Inc.
Page 83
Notes to the Financial Statements June 30, 2007 (Unaudited) |
5. | INVESTMENT ADVISORY AND OTHER AGREEMENTS (cont.) |
The Funds have entered into an Administration Agreement with Baird. Under the Administration Agreement, the Advisor assumes and pays all expenses of the applicable Fund other than the investment advisory fees, borrowing costs, commissions and other costs directly related to portfolio securities transactions, extraordinary or non-recurring expenses and fees under the 12b-1 plan. Pursuant to the Administration Agreement, the Advisor is entitled to receive a fee, calculated daily and payable monthly, at the annual rate of 0.05% for each of the Baird Intermediate Bond, Baird Aggregate Bond, Baird Intermediate Municipal Bond, Baird Core Plus Bond and Baird Short-Term Bond Funds as applied to the respective Fund’s average daily net assets.
U.S. Bancorp Fund Services, LLC serves as transfer agent, administrator, and accounting services agent for the Funds. U.S. Bank, N.A. serves as custodian for the Funds.
Baird is the distributor of the Funds pursuant to a distribution agreement.
6. | SECURITIES LENDING |
Each Fund may lend up to one-third of its total assets (including such loans) to borrowers under terms of participation in a securities lending program administered by U.S. Bancorp Asset Management, an affiliate of the Funds’ custodian, transfer agent and administrator. The securities lending agreement requires that loans are collateralized at all times in an amount equal to at least 102% of the market value of any loaned securities at the time of the loan, plus accrued interest.
The Funds receive compensation in the form of fees and earn interest on the cash collateral. The amount of fees depends on a number of factors including the type of security, length of the loan and credit standing of the borrower. Each Fund continues to receive interest payments or dividends on the securities loaned during the borrowing period. Each Fund has the right under the terms of the securities lending agreement to recover the securities from the borrower on demand.
As of June 30, 2007, the Baird Intermediate Bond, Baird Aggregate Bond, Baird Core Plus Bond and Baird Short-Term Bond Funds had loaned securities that were collateralized by cash equivalents. The cash collateral is invested by the custodian with the approval of the Advisor. Although the cash collateral is generally invested in readily marketable, high quality, short-term obligations, such investments are subject to risk of payment delays or default on the part of the issuer or counterparty or otherwise may not generate sufficient interest to support the costs associated with securities lending. A Fund could also experience delays in recovering its securities and possible loss of income or value if the borrower fails to return the borrowed securities, although this risk is mitigated by the collateral and by contract with the securities lending agent.
As of June 30, 2007, the market value of the securities on loan and payable on collateral due to broker were as follows:
Market Value of | Payable on Collateral | |||||||
Securities on Loan | due to Broker | |||||||
| Baird Intermediate Bond Fund | $ | 83,681,639 | $ | 85,409,679 | ||||
| Baird Aggregate Bond Fund | 143,130,779 | 146,071,574 | ||||||
| Baird Core Plus Bond Fund | 15,075,719 | 15,379,028 | ||||||
| Baird Short-Term Bond Fund | 38,550,441 | 39,373,797 | ||||||
Page 84
Notes to the Financial Statements June 30, 2007 (Unaudited) |
6. | SECURITIES LENDING (cont.) |
Individual reinvested cash collateral jointly pooled with collateral received by other Baird Funds as of June 30, 2007 is as follows:
Intermediate | Aggregate | Core Plus | Short-Term | Other | ||||||||||||||||||||
Bond Fund | Bond Fund | Bond Fund | Bond Fund | Baird Funds | Total | |||||||||||||||||||
| Cantor Fitzgerald | ||||||||||||||||||||||||
Repurchase Agreement(1) | $ | 13,527,427 | $ | 23,135,230 | $ | 2,435,774 | $ | 6,236,132 | $ | 4,665,437 | $ | 50,000,000 | ||||||||||||
| CS First Boston | ||||||||||||||||||||||||
Repurchase Agreement(2) | 9,469,199 | 16,194,661 | 1,705,041 | 4,365,293 | 3,265,806 | 35,000,000 | ||||||||||||||||||
| Morgan Stanley | ||||||||||||||||||||||||
Repurchase Agreement(3) | 8,657,554 | 14,806,547 | 1,558,895 | 3,991,125 | 2,985,879 | 32,000,000 | ||||||||||||||||||
| Bear Stearns | ||||||||||||||||||||||||
Repurchase Agreement(4) | 6,763,714 | 11,567,615 | 1,217,886 | 3,118,067 | 2,332,718 | 25,000,000 | ||||||||||||||||||
| Fenway Funding LLC | ||||||||||||||||||||||||
| Discount Commercial Paper | 4,328,776 | 7,403,273 | 779,448 | 1,995,563 | 1,492,940 | 16,000,000 | ||||||||||||||||||
| Duke Funding LLC | ||||||||||||||||||||||||
| Discount Commercial Paper | 3,787,680 | 6,477,864 | 682,016 | 1,746,117 | 1,306,323 | 14,000,000 | ||||||||||||||||||
| Antalis Funding | ||||||||||||||||||||||||
| Discount Commercial Paper | 3,563,124 | 6,093,819 | 641,583 | 1,642,598 | 1,228,876 | 13,170,000 | ||||||||||||||||||
| Rams Funding LLC | ||||||||||||||||||||||||
| Discount Commercial Paper | 2,976,034 | 5,089,751 | 535,870 | 1,371,949 | 1,026,396 | 11,000,000 | ||||||||||||||||||
| Valcour Bay Capital Co. LLC | ||||||||||||||||||||||||
| Discount Commercial Paper | 2,976,034 | 5,089,751 | 535,870 | 1,371,949 | 1,026,396 | 11,000,000 | ||||||||||||||||||
| KKR Atlantic Funding Trust | ||||||||||||||||||||||||
| Discount Commercial Paper | 2,705,485 | 4,627,046 | 487,155 | 1,247,227 | 933,087 | 10,000,000 | ||||||||||||||||||
| Laguna Discount | ||||||||||||||||||||||||
| Commercial Paper | 2,705,485 | 4,627,046 | 487,155 | 1,247,227 | 933,087 | 10,000,000 | ||||||||||||||||||
| Lehman Brothers | ||||||||||||||||||||||||
Repurchase Agreement(5) | 2,705,485 | 4,627,046 | 487,155 | 1,247,227 | 933,087 | 10,000,000 | ||||||||||||||||||
| Ocala Funding LLC | ||||||||||||||||||||||||
| Discount Commercial Paper | 2,705,485 | 4,627,046 | 487,155 | 1,247,227 | 933,087 | 10,000,000 | ||||||||||||||||||
| Sashsen Funding | ||||||||||||||||||||||||
| Discount Commercial Paper | 2,705,485 | 4,627,046 | 487,155 | 1,247,227 | 933,087 | 10,000,000 | ||||||||||||||||||
| Concord Minutemen Capital | ||||||||||||||||||||||||
| Company Interest Bearing | ||||||||||||||||||||||||
| Commercial Paper | 2,434,937 | 4,164,341 | 438,438 | 1,122,504 | 839,780 | 9,000,000 | ||||||||||||||||||
Page 85
Notes to the Financial Statements June 30, 2007 (Unaudited) |
6. | SECURITIES LENDING (cont.) |
Intermediate | Aggregate | Core Plus | Short-Term | Other | ||||||||||||||||||||
Bond Fund | Bond Fund | Bond Fund | Bond Fund | Baird Funds | Total | |||||||||||||||||||
| Morgan Stanley | ||||||||||||||||||||||||
Repurchase Agreement(6) | 2,164,388 | 3,701,637 | 389,724 | 997,781 | 746,470 | 8,000,000 | ||||||||||||||||||
| Park Granada LLC | ||||||||||||||||||||||||
| Discount Commercial Paper | 1,893,840 | 3,238,932 | 341,008 | 873,059 | 653,161 | 7,000,000 | ||||||||||||||||||
| Thornburg Mortgage Capital | ||||||||||||||||||||||||
| Discount Commercial Paper | 1,893,840 | 3,238,932 | 341,008 | 873,059 | 653,161 | 7,000,000 | ||||||||||||||||||
| Concord Minutemen Capital | ||||||||||||||||||||||||
| Company Interest Bearing | ||||||||||||||||||||||||
| Commercial Paper | 1,352,743 | 2,313,523 | 243,578 | 623,613 | 466,543 | 5,000,000 | ||||||||||||||||||
| Laguna ABS Ltd. | ||||||||||||||||||||||||
| Discount Commercial Paper | 1,352,743 | 2,313,523 | 243,578 | 623,613 | 466,543 | 5,000,000 | ||||||||||||||||||
| KKR Atlantic Funding Trust | ||||||||||||||||||||||||
| Discount Commercial Paper | 1,082,194 | 1,850,818 | 194,862 | 498,891 | 373,235 | 4,000,000 | ||||||||||||||||||
| Morgan Stanley | ||||||||||||||||||||||||
Repurchase Agreement(7) | 1,082,194 | 1,850,818 | 194,862 | 498,891 | 373,235 | 4,000,000 | ||||||||||||||||||
| Rams Funding LLC | ||||||||||||||||||||||||
| Discount Commercial Paper | 1,082,194 | 1,850,818 | 194,862 | 498,891 | 373,235 | 4,000,000 | ||||||||||||||||||
| Valcour Bay Capital Co. LLC | ||||||||||||||||||||||||
| Discount Commercial Paper | 1,082,194 | 1,850,818 | 194,862 | 498,891 | 373,235 | 4,000,000 | ||||||||||||||||||
| Merrill Lynch Premier | ||||||||||||||||||||||||
| Institutional Fund | 292,556 | 500,342 | 52,678 | 134,868 | 100,899 | 1,081,343 | ||||||||||||||||||
| Federated Prime | ||||||||||||||||||||||||
| Obligations Fund | 118,889 | 203,331 | 21,410 | 54,808 | 41,002 | 439,440 | ||||||||||||||||||
| $ | 85,409,679 | $ | 146,071,574 | $ | 15,379,028 | $ | 39,373,797 | $ | 29,456,705 | $ | 315,690,783 | |||||||||||||
| (1) | (Dated 06/29/07), 5.36%, Due 07/02/07 (Repurchase Proceeds $50,029,370), (Collateralized by Mortgage Backed Securities) |
| (2) | (Dated 06/29/07), 5.425%, Due 07/02/07 (Repurchase Proceeds $35,020,808), (Collateralized by Agency Mortgage Backed Securities) |
| (3) | (Dated 06/29/07), 5.44%, Due 07/02/07 (Repurchase Proceeds $32,019,077), (Collateralized by Mortgage Backed Securities) |
| (4) | (Dated 06/29/07), 5.50%, Due 07/02/07 (Repurchase Proceeds $25,015,068), (Collateralized by Mortgage Backed Securities) |
| (5) | (Dated 06/29/07), 5.49%, Due 07/02/07 (Repurchase Proceeds $10,006,016), (Collateralized by Corporate Bonds) |
| (6) | (Dated 06/29/07), 5.44%, Due 07/02/07 (Repurchase Proceeds $8,004,769), (Collateralized by Mortgage Backed Securities) |
| (7) | (Dated 06/29/07), 5.44%, Due 07/02/07 (Repurchase Proceeds $4,002,385), (Collateralized by Mortgage Backed Securities) |
Page 86
Baird Funds, Inc.
Notes to the Financial Statements June 30, 2007 (Unaudited) |
7. | LINE OF CREDIT |
The Corporation maintains an uncommitted, senior secured line of credit (“LOC”) with U.S. Bank, N.A. to provide the Funds a temporary liquidity source to meet unanticipated redemptions. Under the terms of the LOC, borrowings for each Fund are limited to one-third of the total assets (including the amount borrowed) of the respective Fund, or as otherwise indicated within the Funds’ agreement with the Bank. The Bank charges interest at the Bank’s Prime Rate less 1%. During the period January 1, 2007 through June 30, 2007, the Baird Bond Funds did not draw upon the line of credit.
8. | DISTRIBUTION AND SHAREHOLDER SERVICE PLAN |
The Funds have adopted a distribution and shareholder service plan (the “Plan”) pursuant to Rule 12b-1 under the 1940 Act. The Plan allows the Funds to compensate Baird for the costs incurred in distributing the Funds’ Investor Class shares, including amounts paid to brokers or dealers, at an annual rate not to exceed 0.25% of the average daily net assets of the Funds’ Investor Class shares. The Baird Intermediate Bond, Baird Aggregate Bond, Baird Intermediate Municipal Bond and Baird Core Plus Bond Funds incurred $1,565, $2,990, $578 and $476, respectively, in fees pursuant to the Plan during the six months ended June 30, 2007.
Page 87
Additional Information
Proxy Voting
A description of the policies and procedures that the Funds use to determine how to vote proxies relating to portfolio securities is available without charge, upon request, by calling toll free, 1-866-44BAIRD, or by accessing the Funds’ website at www.bairdfunds.com; and by accessing the SEC’s website at www.sec.gov.
Each Fund’s proxy voting record for the most recent 12-month period ended June 30, if applicable, is available without charge, upon request, by calling toll free, 1-866-44BAIRD, or by accessing the Funds��� website at www.bairdfunds.com; and by accessing the SEC’s website at www.sec.gov. The Funds generally do not vote proxies because the securities held in their portfolios, consisting of bonds and other fixed-income securities, are not entitled to vote.
Portfolio Holdings Disclosure
The Funds file a complete schedule of portfolio holdings with the SEC for the first and third quarters of each fiscal year on Form N-Q. The Funds’ Forms N-Q are available on the SEC website at www.sec.gov and may be reviewed and copied at the SEC’s Public Reference Room in Washington, D.C. Information on the operation of the Public Reference Room may be obtained by calling 1-800-732-0330. The Funds’ Forms N-Q may also be obtained by calling toll-free 1-866-44BAIRD.
Page 88
(This Page Intentionally Left Blank.)
Baird Funds, Inc.
c/o U.S. Bancorp Fund Services, LLC
P.O. Box 701
Milwaukee, WI 53201-0701
1-866-44BAIRD
Board of Directors
G. Frederick Kasten, Jr. (Chairman)
John W. Feldt
George C. Kaiser
Frederick P. Stratton, Jr.
Investment Advisor and Distributor
Robert W. Baird & Co. Incorporated
777 East Wisconsin Avenue
Milwaukee, WI 53202
Administrator and Transfer Agent
U.S. Bancorp Fund Services, LLC
P.O. Box 701
615 East Michigan Street
Milwaukee, WI 53202
Custodian
U.S. Bank, N.A.
1555 N. RiverCenter Drive, Suite 302
Milwaukee, WI 53212
Legal Counsel
Godfrey & Kahn, S.C.
780 North Water Street
Milwaukee, WI 53202
Independent Registered Public Accounting Firm
Grant Thornton LLP
175 West Jackson Boulevard, 13th Floor
Chicago, IL 60604
Semi-Annual Report - Baird Funds
Baird LargeCap Fund
Baird MidCap Fund
Baird SmallCap Fund
TABLE OF CONTENTS
Page
| BAIRD LARGECAP FUND | 1 |
| BAIRD MIDCAP FUND | 5 |
| BAIRD SMALLCAP FUND | 9 |
| ADDITIONAL INFORMATION ON FUND EXPENSES | 13 |
| STATEMENTS OF ASSETS AND LIABILITIES | 15 |
| STATEMENTS OF OPERATIONS | 16 |
| STATEMENTS OF CHANGES IN NET ASSETS | 17 |
| FINANCIAL HIGHLIGHTS | 20 |
| NOTES TO THE FINANCIAL STATEMENTS | 26 |
| ADDITIONAL INFORMATION | 36 |
This report has been prepared for shareholders and may be distributed to others only if preceded or accompanied by a current prospectus.
Cautionary Note on Analyses, Opinions and Outlooks: In this report we offer analyses and opinions on the performance of individual securities, companies, industries, sectors, markets, interest rates and governmental policies, including predictions, forecasts and outlooks regarding possible future events. These can generally be identified as such because the context of the statements may include such words as “believe,” “should,” “will,” “expects,” “anticipates,” “hopes” and words of similar effect. These statements reflect the portfolio managers’ good faith beliefs and judgments and involve risks and uncertainties, including the risk that the portfolio managers’ analyses, opinions and outlooks are or will prove to be inaccurate. It is inherently difficult to correctly assess and explain the performance of particular securities, sectors, markets, interest rate movements, governmental actions or general economic trends and conditions, and many unforeseen factors contribute to the performance of Baird Funds. Investors are, therefore, cautioned not to place undue reliance on subjective judgments contained in this report.
Baird LargeCap Fund
A June 30, 2007 summary of the Fund’s top 10 holdings and equity sector analysis compared to the Russell 1000® Growth Index is shown below.
Top 10 Holdings* | ||
| Praxair, Inc. | 3.0% | |
| ITT Industries, Inc. | 2.8% | |
| Cisco Systems, Inc. | 2.8% | |
| Emerson Electric Company | 2.8% | |
| Costco Wholesale Corporation | 2.8% | |
| Corning Incorporated | 2.8% | |
| Abbott Laboratories | 2.8% | |
| Illinois Tool Works, Inc. | 2.8% | |
| Johnson Controls, Inc. | 2.7% | |
| State Street Corporation | 2.6% | |
Net Assets: | $29,740,828 | |
Portfolio Turnover Rate: | 41.1% | # |
Number of Equity Holdings: | 46 | |
Annualized Portfolio Expense Ratio:*** | ||
| INSTITUTIONAL CLASS: | 0.75% | |
| INVESTOR CLASS: | 1.00% | **** |
Equity Sector Analysis**
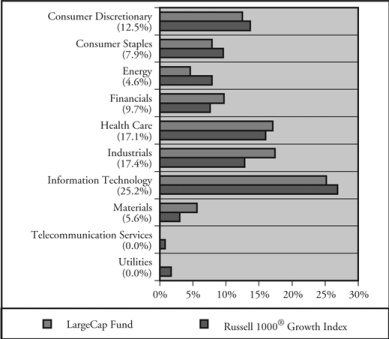
| * | The Fund’s portfolio composition is subject to change and there is no assurance that the Fund will continue to hold any particular security. Percentages shown relate to the Fund’s total net assets as of June 30, 2007. |
| ** | Percentages shown in parentheses relate to the Fund’s total equity investments as of June 30, 2007, and may not add up to 100% due to rounding. |
| *** | The Advisor has contractually agreed to limit the Fund’s total annual fund operating expenses to 0.75% of average daily net assets for the Institutional Class shares and 1.00% of average daily net assets for the Investor Class shares, at least through April 30, 2008. |
| **** | Includes 0.25% 12b-1 fee. |
| # | Not annualized. |
Page 1
Baird LargeCap Fund
Average Annual Total Returns
For the Periods Ended June 30, 2007 | One Year | Five Years | Since Inception(1) |
| Baird LargeCap Fund – Institutional Class Shares | 12.53% | 5.64% | -1.05% |
| Baird LargeCap Fund – Investor Class Shares | 12.18% | 5.33% | -1.32% |
Russell 1000® Growth Index(2) | 19.05% | 9.28% | -3.75% |
(1) | For the period from September 29, 2000 (commencement of operations) through June 30, 2007. |
(2) | The Russell 1000® Growth Index measures the performance of those Russell 1000® companies with higher price-to-book ratios and higher forecasted growth rates. The Russell 1000® Index consists of the 1,000 largest companies in the Russell 3000® Index, which represents approximately 90% of the total market capitalization of the Russell 3000® Index, which in turn is comprised of the 3,000 largest U.S. domiciled publicly traded common stocks by market capitalization. These indices do not reflect any deduction for fees, expenses or taxes. A direct investment in an index is not possible. |
The returns shown in the table above reflect reinvestment of dividends and/or capital gains distributions in additional shares. The returns do not reflect the deduction of taxes that a shareholder would pay on Fund distributions or the redemption of Fund shares.
Past performance does not guarantee future results. Investment return and principal value will fluctuate so that an investor’s shares, when redeemed, may be worth more or less than their original cost.
For information about the performance of the Fund as of the most recent month-end, please call 1-866-44BAIRD or visit www.bairdfunds.com. Mutual fund performance changes over time and current performance may be lower or higher than that stated.
Page 2
Baird LargeCap Fund
Schedule of Investments June 30, 2007 (Unaudited) |
Shares | Value | ||||||
COMMON STOCKS – 99.4% | |||||||
Air Freight & Logistics – 1.6% | |||||||
| 11,200 | Expeditors International | ||||||
| of Washington, Inc. | $ | 462,560 | |||||
Auto Components – 2.7% | |||||||
| 6,970 | Johnson Controls, Inc. | 806,917 | |||||
Biotechnology – 4.6% | |||||||
| 9,726 | Genentech, Inc.* | 735,869 | |||||
| 16,124 | Gilead Sciences, Inc.* | 625,127 | |||||
| 1,360,996 | |||||||
Capital Markets – 5.1% | |||||||
| 7,295 | Legg Mason, Inc. | 717,682 | |||||
| 11,512 | State Street Corporation | 787,421 | |||||
| 1,505,103 | |||||||
Chemicals – 5.5% | |||||||
| 17,642 | Ecolab, Inc. | 753,313 | |||||
| 12,484 | Praxair, Inc. | 898,723 | |||||
| 1,652,036 | |||||||
Commercial Banks – 2.0% | |||||||
| 12,644 | Marshall & Ilsley Corp. | 602,234 | |||||
Communications Equipment – 5.6% | |||||||
| 30,153 | Cisco Systems, Inc.* | 839,761 | |||||
| 32,430 | Corning Incorporated* | 828,587 | |||||
| 1,668,348 | |||||||
Computers & Peripherals – 3.9% | |||||||
| 4,860 | Apple Computer, Inc.* | 593,114 | |||||
| 19,877 | Network Appliance, Inc.* | 580,408 | |||||
| 1,173,522 | |||||||
Consumer Finance – 2.6% | |||||||
| 9,727 | Capital One Financial | ||||||
| Corporation | 762,986 | ||||||
Electrical Equipment – 4.6% | |||||||
| 13,781 | Agilent Technologies, Inc.* | 529,742 | |||||
| 17,841 | Emerson Electric Company | 834,959 | |||||
| 1,364,701 | |||||||
Energy Equipment & Services – 3.4% | |||||||
| 7,140 | Schlumberger Limited f | 606,472 | |||||
| 7,460 | Weatherford | ||||||
International Ltd.* f | 412,090 | ||||||
| 1,018,562 | |||||||
Food & Staples Retailing – 7.9% | |||||||
| 14,250 | Costco Wholesale Corp. | 833,910 | |||||
| 22,531 | Sysco Corporation | 743,298 | |||||
| 17,476 | Walgreen Company | 760,905 | |||||
| 2,338,113 | |||||||
Health Care Equipment & Supplies – 4.4% | |||||||
| 7,275 | Cytyc Corporation* | 313,625 | |||||
| 14,014 | St Jude Medical, Inc.* | 581,441 | |||||
| 5,057 | Zimmer Holdings, Inc.* | 429,289 | |||||
| 1,324,355 | |||||||
Health Care Providers & Services – 2.2% | |||||||
| 9,239 | Cardinal Health, Inc. | 652,643 | |||||
Hotels Restaurants & Leisure – 1.3% | |||||||
| 14,595 | Starbucks Corporation* | 382,973 | |||||
IT Services – 5.6% | |||||||
| 21,821 | Iron Mountain | ||||||
| Incorporated* | 570,183 | ||||||
| 11,406 | Paychex, Inc. | 446,203 | |||||
| 31,445 | Western Union Company | 654,999 | |||||
| 1,671,385 | |||||||
Machinery – 10.8% | |||||||
| 10,213 | Danaher Corporation | 771,081 | |||||
| 15,198 | Illinois Tool Works, Inc. | 823,580 | |||||
| 12,350 | ITT Industries, Inc. | 843,258 | |||||
| 12,322 | Oshkosh Truck | ||||||
| Corporation | 775,300 | ||||||
| 3,213,219 | |||||||
Multiline Retail – 4.2% | |||||||
| 6,882 | Kohl’s Corporation* | 488,828 | |||||
| 12,100 | Target Corporation | 769,560 | |||||
| 1,258,388 | |||||||
The accompanying notes are an integral part of these financial statements.
Page 3
Baird LargeCap Fund
Schedule of Investments June 30, 2007 (Unaudited) |
Shares | Value | ||||||
COMMON STOCKS – 99.4% (cont.) | |||||||
Oil & Gas – 1.2% | |||||||
| 7,785 | Southwestern Energy | ||||||
| Company* | $ | 346,433 | |||||
Pharmaceuticals – 5.8% | |||||||
| 15,406 | Abbott Laboratories | 824,991 | |||||
| 7,460 | Allergan, Inc. | 429,994 | |||||
| 8,186 | Novartis AG – ADR f | 458,989 | |||||
| 1,713,974 | |||||||
Semiconductor & Semiconductor Equipment – 2.4% | |||||||
| 18,646 | Texas Instruments | ||||||
| Incorporated* | 701,649 | ||||||
Software – 5.7% | |||||||
| 13,476 | Adobe Systems, | ||||||
| Incorporated* | 541,062 | ||||||
| 12,157 | Electronic Arts Inc.* | 575,269 | |||||
| 19,617 | Microsoft Corporation | 578,113 | |||||
| 1,694,444 | |||||||
Specialty Retail – 4.2% | |||||||
| 15,080 | Best Buy Co, Inc. | 703,784 | |||||
| 23,343 | Staples, Inc. | 553,929 | |||||
| 1,257,713 | |||||||
Trading Companies & Distributors – 2.1% | |||||||
| 15,236 | Fastenal Company | 637,779 | |||||
| Total Common Stocks | |||||||
| (Cost $24,982,295) | 29,571,033 | ||||||
COLLATERAL POOL INVESTMENT | |||||||
FOR SECURITIES ON LOAN – 34.0% | |||||||
| (Cost $10,095,119) | |||||||
| (Please Refer to Note 6) | 10,095,119 | ||||||
Principal | |||||||
Amount | |||||||
SHORT-TERM INVESTMENTS – 0.6% | |||||||
Money Market Fund – 0.6% | |||||||
| $ | 175,680 | Short-Term Investment | |||||
| Company Liquid Assets | |||||||
| Portfolio – AIM Fund | 175,680 | ||||||
| Total Short-Term | |||||||
| Investments | |||||||
| (Cost $175,680) | 175,680 | ||||||
| Total Investments | |||||||
| (Cost $35,253,094) – | |||||||
| 134.0% | 39,841,832 | ||||||
| Liabilities in Excess of | |||||||
| Other Assets – (34.0)% | (10,101,004 | ) | |||||
| TOTAL NET | |||||||
| ASSETS – 100.0% | $ | 29,740,828 | |||||
ADR – American Depository Receipt
| * | Non-Income Producing |
f | Foreign Security |
The accompanying notes are an integral part of these financial statements.
Page 4
Baird MidCap Fund
A June 30, 2007 summary of the Fund’s top 10 holdings and equity sector analysis compared to the Russell Midcap® Growth Index is shown below.
Top 10 Holdings* | ||
| Cytyc Corporation | 3.3% | |
| Harsco Corporation | 2.9% | |
| Harris Corporation | 2.8% | |
| GameStop Corporation – Class A | 2.7% | |
| Tractor Supply Company | 2.7% | |
| Stericycle, Inc. | 2.7% | |
| Advance Auto Parts, Inc. | 2.6% | |
| Roper Industries, Inc. | 2.6% | |
| Gentex Corporation | 2.5% | |
| Joy Global Inc. | 2.5% | |
Net Assets: | $40,018,215 | |
Portfolio Turnover Rate: | 35.2% | # |
Number of Equity Holdings: | 47 | |
Annualized Portfolio Expense Ratio:*** | ||
| INSTITUTIONAL CLASS: | 0.85% | |
| INVESTOR CLASS: | 1.10% | **** |
Equity Sector Analysis**
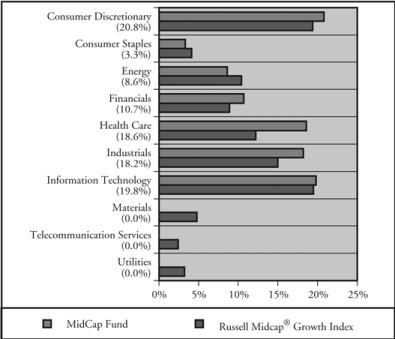
| * | The Fund’s portfolio composition is subject to change and there is no assurance that the Fund will continue to hold any particular security. Percentages shown relate to the Fund’s total net assets as of June 30, 2007. |
| ** | Percentages shown in parentheses relate to the Fund’s total equity investments as of June 30, 2007, and may not add up to 100% due to rounding. |
| *** | The Advisor has contractually agreed to limit the Fund’s total annual fund operating expenses to 0.85% of average daily net assets for the Institutional Class shares and 1.10% of average daily net assets for the Investor Class shares, at least through April 30, 2008. |
| **** | Includes 0.25% 12b-1 fee. |
| # | Not annualized. |
Page 5
Baird MidCap Fund
Average Annual Total Returns
For the Periods Ended June 30, 2007 | One Year | Five Years | Since Inception(1) |
| Baird MidCap Fund – Institutional Class Shares | 13.56% | 9.75% | 4.82% |
| Baird MidCap Fund – Investor Class Shares | 13.28% | 9.47% | 4.58% |
Russell Midcap® Growth Index(2) | 19.73% | 15.45% | 3.88% |
(1) | For the period from December 29, 2000 (commencement of operations) through June 30, 2007. |
(2) | The Russell Midcap® Growth Index measures the performance of those Russell Midcap® Index companies with higher price-to-book ratios and higher forecasted growth rates. The Russell Midcap® Index consists of the 800 smallest companies in the Russell 1000® Index, which represent approximately 30% of the total market capitalization of the Russell 1000® Index. The Russell 1000® Index consists of the largest companies in the Russell 3000® Index, which in turn is comprised of the 3,000 largest U.S. domiciled publicly traded common stocks by market capitalization. These indices do not reflect any deduction for fees, expenses or taxes. A direct investment in an index is not possible. |
The returns shown in the table above reflect reinvestment of dividends and/or capital gains distributions in additional shares. The returns do not reflect the deduction of taxes that a shareholder would pay on Fund distributions or the redemption of Fund shares.
Past performance does not guarantee future results. Investment return and principal value will fluctuate so that an investor’s shares, when redeemed, may be worth more or less than their original cost.
For information about the performance of the Fund as of the most recent month-end, please call 1-866-44BAIRD or visit www.bairdfunds.com. Mutual fund performance changes over time and current performance may be lower or higher than that stated.
Page 6
Schedule of Investments June 30, 2007 (Unaudited) |
Shares | Value | ||||||
COMMON STOCKS – 97.2% | |||||||
Air Freight & Logistics – 1.1% | |||||||
| 10,725 | Expeditors International | ||||||
| of Washington, Inc. | $ | 442,943 | |||||
Auto Components – 2.5% | |||||||
| 51,347 | Gentex Corporation | 1,011,022 | |||||
Biotechnology – 2.4% | |||||||
| 12,149 | Cephalon, Inc.* | 976,658 | |||||
Capital Markets – 1.8% | |||||||
| 16,076 | Eaton Vance Corporation | 710,238 | |||||
Commercial Banks – 8.6% | |||||||
| 23,241 | East West Bancorp, Inc. | 903,610 | |||||
| 16,895 | Marshall & Ilsley | ||||||
| Corporation | 804,709 | ||||||
| 19,111 | Wintrust Financial | ||||||
| Corporation | 838,017 | ||||||
| 11,747 | Zions Bancorporation | 903,462 | |||||
| 3,449,798 | |||||||
Commercial Services & Supplies – 3.9% | |||||||
| 13,908 | Brady Corporation – | ||||||
| Class A | 516,543 | ||||||
| 23,884 | Stericycle, Inc.* | 1,061,883 | |||||
| 1,578,426 | |||||||
Communications Equipment – 2.8% | |||||||
| 20,785 | Harris Corporation | 1,133,822 | |||||
Electrical Equipment – 4.8% | |||||||
| 18,181 | Roper Industries, Inc. | 1,038,135 | |||||
| 26,904 | Trimble Navigation | ||||||
| Limited* | 866,309 | ||||||
| 1,904,444 | |||||||
Energy Equipment & Services – 6.3% | |||||||
| 13,184 | Cameron International | ||||||
| Corporation* | 942,260 | ||||||
| 11,665 | Oceaneering | ||||||
| International, Inc.* | 614,046 | ||||||
| 16,113 | Smith International, Inc. | 944,866 | |||||
| 2,501,172 | |||||||
Food & Staples Retailing – 3.2% | |||||||
| 24,483 | United Natural | ||||||
| Foods, Inc.* | 650,758 | ||||||
| 16,475 | Whole Foods Market, Inc. | 630,993 | |||||
| 1,281,751 | |||||||
Health Care Equipment & Supplies – 10.5% | |||||||
| 31,029 | Cytyc Corporation* | 1,337,660 | |||||
| 13,361 | Gen-Probe, Incorporated* | 807,272 | |||||
| 13,747 | Hologic, Inc.* | 760,347 | |||||
| 13,243 | ResMed, Inc.* | 546,406 | |||||
| 17,926 | Varian Medical | ||||||
| Systems, Inc.* | 762,034 | ||||||
| 4,213,719 | |||||||
Health Care Technology – 1.5% | |||||||
| 10,971 | Cerner Corporation* | 608,561 | |||||
Hotels Restaurants & Leisure – 3.4% | |||||||
| 24,927 | The Cheesecake | ||||||
| Factory Incorporated* | 611,210 | ||||||
| 8,775 | Chipotle Mexican | ||||||
| Grill, Inc.* | 748,332 | ||||||
| 1,359,542 | |||||||
Internet Software & Services – 1.7% | |||||||
| 13,835 | Akamai Technologies, Inc.* | 672,934 | |||||
IT Services – 5.4% | |||||||
| 6,979 | Cognizant Technology | ||||||
| Solutions Corporation* | 524,053 | ||||||
| 23,652 | Global Payments, Inc. | 937,802 | |||||
| 26,578 | Iron Mountain | ||||||
| Incorporated* | 694,483 | ||||||
| 2,156,338 | |||||||
Life Sciences Tools & Services – 3.6% | |||||||
| 10,323 | Covance Inc.* | 707,745 | |||||
| 19,131 | Pharmaceutical Product | ||||||
| Development, Inc. | 732,143 | ||||||
| 1,439,888 | |||||||
The accompanying notes are an integral part of these financial statements.
Page 7
Baird MidCap Fund
Schedule of Investments June 30, 2007 (Unaudited) |
Shares | Value | ||||||
COMMON STOCKS – 97.2% (cont.) | |||||||
Machinery – 7.8% | |||||||
| 22,478 | Harsco Corporation | $ | 1,168,856 | ||||
| 17,223 | Joy Global Inc. | 1,004,618 | |||||
| 15,135 | Oshkosh Truck | ||||||
| Corporation | 952,294 | ||||||
| 3,125,768 | |||||||
Media – 1.9% | |||||||
| 12,305 | Lamar Advertising | ||||||
| Co. – Class A | 772,262 | ||||||
Office Electronics – 2.0% | |||||||
| 20,579 | Zebra Technologies | ||||||
| Corporation – Class A* | 797,230 | ||||||
Oil & Gas – 2.1% | |||||||
| 19,197 | Southwestern | ||||||
| Energy Company* | 854,267 | ||||||
Semiconductor & Semiconductor Equipment – 2.5% | |||||||
| 26,591 | Microchip Technology | ||||||
| Incorporated | 984,931 | ||||||
Software – 2.8% | |||||||
| 30,318 | Activision, Inc.* | 566,037 | |||||
| 12,713 | NAVTEQ* | 538,268 | |||||
| 1,104,305 | |||||||
Specialty Retail – 12.4% | |||||||
| 25,656 | Advance Auto Parts, Inc. | 1,039,838 | |||||
| 37,537 | Chico’s FAS, Inc.* | 913,651 | |||||
| 14,254 | Dick’s Sporting | ||||||
| Goods, Inc.* | 829,155 | ||||||
| 28,030 | GameStop Corporation – | ||||||
| Class A* | 1,095,973 | ||||||
| 20,408 | Tractor Supply Company* | 1,062,236 | |||||
| 4,940,853 | |||||||
Trading Companies & Distributors – 2.2% | |||||||
| 21,276 | Fastenal Company | 890,613 | |||||
| Total Common Stocks | |||||||
| (Cost $29,745,424) | 38,911,485 | ||||||
COLLATERAL POOL INVESTMENT FOR SECURITIES ON LOAN – 48.4% | |||||||
| (Cost $19,361,586) | |||||||
| (Please Refer to Note 6) | 19,361,586 | ||||||
Principal | |||||||
Amount | |||||||
SHORT-TERM INVESTMENTS – 6.0% | |||||||
Money Market Funds – 6.0% | |||||||
| $ | 1,601,632 | Short-Term Investment | |||||
| Company Liquid Assets | |||||||
| Portfolio – AIM Fund | 1,601,632 | ||||||
| 796,870 | Short-Term Investment | ||||||
| Trust Prime Portfolio – | |||||||
| AIM Fund | 796,870 | ||||||
| 2,398,502 | |||||||
| Total Short-Term | |||||||
| Investments | |||||||
| (Cost $2,398,502) | 2,398,502 | ||||||
| Total Investments | |||||||
| (Cost $51,505,512) – | |||||||
| 151.6% | 60,671,573 | ||||||
| Liabilities in Excess of | |||||||
| Other Assets – (51.6)% | (20,653,358 | ) | |||||
| TOTAL NET | |||||||
| ASSETS – 100.0% | $ | 40,018,215 | |||||
| * | Non-Income Producing |
The accompanying notes are an integral part of these financial statements.
Page 8
Baird SmallCap Fund
A June 30, 2007 summary of the Fund’s top 10 holdings and equity sector analysis compared to the Russell 2000® Growth Index is shown below.
Top 10 Holdings* | ||
| Illumina, Inc. | 3.3% | |
| Oceaneering International, Inc. | 3.3% | |
| DTS, Inc. | 3.1% | |
| Natus Medical Incorporated | 3.0% | |
| Tractor Supply Company | 3.0% | |
| Allscripts Healthcare Solutions, Inc. | 3.0% | |
| SRA International, Inc. – Class A | 3.0% | |
| LKQ Corporation | 2.9% | |
| Plexus Corp. | 2.8% | |
| Heartland Payment Systems, Inc. | 2.7% | |
Net Assets: | $34,877,558 | |
Portfolio Turnover Rate: | 47.8% | # |
Number of Equity Holdings: | 44 | |
Annualized Portfolio Expense Ratio:*** | ||
| INSTITUTIONAL CLASS: | 0.95% | |
| INVESTOR CLASS: | 1.20% | **** |
Equity Sector Analysis**
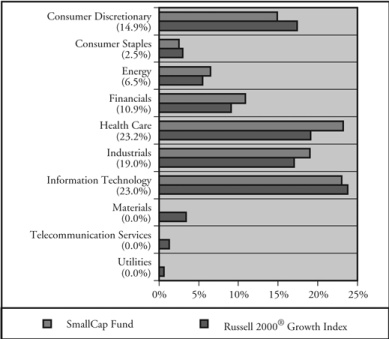
| * | The Fund’s portfolio composition is subject to change and there is no assurance that the Fund will continue to hold any particular security. Percentages shown relate to the Fund’s total net assets as of June 30, 2007. |
| ** | Percentages shown in parentheses relate to the Fund’s total equity investments as of June 30, 2007, and may not add up to 100% due to rounding. |
| *** | The Advisor has contractually agreed to limit the Fund’s total annual fund operating expenses to 0.95% of average daily net assets for the Institutional Class shares and 1.20% of average daily net assets for the Investor Class shares, at least through April 30, 2008. |
| **** | Includes 0.25% 12b-1 fee. |
| # | Not annualized. |
Page 9
Baird SmallCap Fund
Average Annual Total Returns
For the Periods Ended June 30, 2007 | One Year | Since Inception(1) |
| Baird SmallCap Fund – Institutional Class Shares | 5.60% | 7.09% |
| Baird SmallCap Fund – Investor Class Shares | 5.63% | 6.92% |
Russell 2000® Growth Index(2) | 16.83% | 11.76% |
(1) | For the period from June 30, 2004 (commencement of operations) through June 30, 2007. |
(2) | The Russell 2000® Growth Index measures the performance of those Russell 2000® Index companies with higher price-to-book and higher forecasted growth rates. The Russell 2000® Index consists of the 2,000 smallest U.S. domiciled publicly-traded common stocks that are included in the Russell 3000® Index. These common stocks represent approximately 10% of the U.S. equity market. These indices do not reflect any deduction for fees, expenses or taxes. A direct investment in an index is not possible. |
The returns shown in the table above reflect reinvestment of dividends and/or capital gains distributions in additional shares. The returns do not reflect the deduction of taxes that a shareholder would pay on Fund distributions or the redemption of Fund shares.
Past performance does not guarantee future results. Investment return and principal value will fluctuate so that an investor’s shares, when redeemed, may be worth more or less than their original cost.
For information about the performance of the Fund as of the most recent month-end, please call 1-866-44BAIRD or visit www.bairdfunds.com. Mutual fund performance changes over time and current performance may be lower or higher than that stated.
Page 10
Schedule of Investments June 30, 2007 (Unaudited) |
Shares | Value | ||||||
COMMON STOCKS – 99.1% | |||||||
Airlines – 1.7% | |||||||
| 24,696 | SkyWest, Inc. | $ | 588,506 | ||||
Commercial Banks – 8.1% | |||||||
| 23,942 | Boston Private Financial | ||||||
| Holdings, Inc. | 643,322 | ||||||
| 24,694 | Pinnacle Financial | ||||||
| Partners, Inc.* | 725,016 | ||||||
| 24,443 | United Community | ||||||
| Banks, Inc. | 632,829 | ||||||
| 18,894 | Wintrust Financial | ||||||
| Corporation | 828,502 | ||||||
| 2,829,669 | |||||||
Commercial Services & Supplies – 6.6% | |||||||
| 19,153 | Brady Corporation – | ||||||
| Class A | 711,342 | ||||||
| 36,785 | Marlin Business | ||||||
| Services Corporation* | 783,888 | ||||||
| 26,964 | Mobile Mini, Inc.* | 787,349 | |||||
| 2,282,579 | |||||||
Distributors – 2.9% | |||||||
| 40,823 | LKQ Corporation* | 1,006,695 | |||||
Diversified Financial Services – 2.7% | |||||||
| 32,001 | Heartland Payment | ||||||
| Systems, Inc.* | 938,589 | ||||||
Electronic Equipment & Instruments – 12.1% | |||||||
| 31,744 | Argon ST, Inc.* | 736,778 | |||||
| 34,232 | Daktronics, Inc. | 735,303 | |||||
| 49,388 | DTS, Inc.* | 1,075,177 | |||||
| 42,832 | Plexus Corp.* | 984,708 | |||||
| 21,975 | ScanSource, Inc.* | 702,980 | |||||
| 4,234,946 | |||||||
Energy Equipment & Services – 6.5% | |||||||
| 9,070 | Dawson Geophysical | ||||||
| Company* | 557,442 | ||||||
| 10,585 | GulfMark Offshore, Inc.* | 542,164 | |||||
| 21,928 | Oceaneering | ||||||
| International, Inc.* | 1,154,290 | ||||||
| 2,253,896 | |||||||
Food & Staples Retailing – 2.4% | |||||||
| 31,997 | United Natural | ||||||
| Foods, Inc.* | 850,480 | ||||||
Health Care Equipment & Supplies – 5.5% | |||||||
| 18,142 | Kyphon Inc.* | 873,537 | |||||
| 66,011 | Natus Medical | ||||||
| Incorporated* | 1,050,895 | ||||||
| 1,924,432 | |||||||
Health Care Providers & Services – 14.2% | |||||||
| 40,813 | Allscripts Healthcare | ||||||
| Solutions, Inc.* | 1,039,915 | ||||||
| 29,729 | Computer Programs | ||||||
| & Systems, Inc. | 921,004 | ||||||
| 19,149 | HealthExtras, Inc.* | 566,428 | |||||
| 16,886 | Healthways, Inc.* | 799,890 | |||||
| 37,549 | Nighthawk Radiology | ||||||
| Holdings, Inc.* | 677,760 | ||||||
| 34,767 | Providence Service | ||||||
| Corporation* | 928,974 | ||||||
| 4,933,971 | |||||||
Hotels Restaurants & Leisure – 4.8% | |||||||
| 11,588 | Panera Bread | ||||||
| Company – Class A* | 533,743 | ||||||
| 14,617 | PF Chang’s China | ||||||
| Bistro, Inc.* | 514,518 | ||||||
| 15,373 | Red Robin Gourmet | ||||||
| Burgers, Inc.* | 620,608 | ||||||
| 1,668,869 | |||||||
IT Services – 5.2% | |||||||
| 27,967 | Forrester Research, Inc.* | 786,712 | |||||
The accompanying notes are an integral part of these financial statements.
Page 11
Baird SmallCap Fund
Schedule of Investments June 30, 2007 (Unaudited) |
Shares | Value | ||||||
COMMON STOCKS – 99.1% (cont.) | |||||||
IT Services – 5.2% (cont.) | |||||||
| 41,073 | SRA International, | ||||||
| Inc. – Class A* | $ | 1,037,504 | |||||
| 1,824,216 | |||||||
Leisure Equipment & Products – 2.1% | |||||||
| 18,146 | RC2 Corporation* | 726,021 | |||||
Life Sciences Tools & Services – 3.3% | |||||||
| 28,471 | Illumina, Inc.* | 1,155,638 | |||||
Machinery – 4.6% | |||||||
| 11,338 | Bucyrus International, | ||||||
| Inc. – Class A | 802,504 | ||||||
| 22,391 | ESCO Technologies, Inc.* | 811,898 | |||||
| 1,614,402 | |||||||
Road & Rail – 1.6% | |||||||
| 29,235 | Knight | ||||||
| Transportation, Inc. | 566,574 | ||||||
Software – 5.5% | |||||||
| 30,743 | ANSYS, Inc.* | 814,690 | |||||
| 37,507 | Cogent Inc.* | 550,978 | |||||
| 17,637 | THQ Inc.* | 538,281 | |||||
| 1,903,949 | |||||||
Specialty Retail – 5.0% | |||||||
| 25,443 | Hibbett Sporting | ||||||
| Goods, Inc.* | 696,629 | ||||||
| 20,156 | Tractor Supply Company* | 1,049,120 | |||||
| 1,745,749 | |||||||
Trading Companies & Distributors – 4.3% | |||||||
| 23,683 | Applied Industrial | ||||||
| Technologies, Inc. | 698,649 | ||||||
| 14,867 | Watsco, Inc. | 808,765 | |||||
| 1,507,414 | |||||||
| Total Common Stocks | |||||||
| (Cost $28,645,212) | 34,556,595 | ||||||
Principal | |||||||
Amount | |||||||
SHORT-TERM INVESTMENTS – 2.0% | |||||||
Money Market Fund – 2.0% | |||||||
| $ | 709,392 | Short-Term Investment | |||||
| Company Liquid Assets | |||||||
| Portfolio – AIM Fund | 709,392 | ||||||
| Total Short-Term | |||||||
| Investments | |||||||
| (Cost $709,392) | 709,392 | ||||||
| Total Investments | |||||||
| (Cost $29,354,604) – | |||||||
| 101.1% | 35,265,987 | ||||||
| Liabilities in Excess of | |||||||
| Other Assets – (1.1)% | (388,429 | ) | |||||
| TOTAL NET | |||||||
| ASSETS – 100.0% | $ | 34,877,558 | |||||
| * | Non-Income Producing |
The accompanying notes are an integral part of these financial statements.
Page 12
Additional Information on Fund Expenses June 30, 2007 (Unaudited) |
Example
As a shareholder of a mutual fund, you incur two types of costs: (1) transaction costs, including sales charges (loads) on purchase payments, reinvested dividends, or other distributions; redemption fees; and exchange fees; and (2) ongoing costs, such as management fees; distribution and/or service (12b-1) fees; and other fund expenses. Although the Funds do not charge any sales loads, redemption fees, or other transaction fees, you will be assessed fees for outgoing wire transfers, returned checks and stop payment orders at prevailing rates charged by U. S. Bancorp Fund Services, LLC, the Funds’ transfer agent. If you request that a redemption be made by wire transfer, currently the Funds’ transfer agent charges a $15.00 fee.
This Example is intended to help you understand your ongoing costs (in dollars) of investing in each Fund and to compare these costs with the ongoing costs of investing in other mutual funds. The Example is based on an investment of $1,000 invested at the beginning of the period and held for the entire period (1/1/07 – 6/30/07).
Actual Expenses
The third and fourth columns of the following table provide information about account values based on actual returns and actual expenses. You may use the information in these columns, together with the amount you invested, to estimate the expenses that you paid over the period. Simply divide your account value by $1,000 (for example, an $8,600 account value divided by $1,000 = 8.6), then multiply the result by the number in the fourth column entitled “Expenses Paid During the Period” to estimate the expenses you paid on your account during this period.
Hypothetical Example for Comparison Purposes
The fifth and sixth columns of the table below provide information about hypothetical account values and hypothetical expenses based on the Funds’ actual expense ratios and an assumed rate of return of 5% per year before expenses, which is not the Funds’ actual return. The hypothetical account values and expenses may not be used to estimate the actual ending account balance or expenses you paid for the period. You may use this information to compare the ongoing costs of investing in the Funds and other mutual funds. To do so, compare this 5% hypothetical example with the 5% hypothetical examples that appear in the shareholder reports of the other mutual funds. Please note that the expenses shown in the table are meant to highlight your ongoing costs only and do not reflect any transactional costs. Therefore, the sixth column of the table (entitled “Expenses Paid During the Period”) is useful in comparing ongoing costs only, and will not help you determine the relative total costs of owning different mutual funds. In addition, if these transactional costs were included, your costs could have been higher.
Baird Funds, Inc.
Page 13
Additional Information on Fund Expenses June 30, 2007 (Unaudited) |
Actual vs. Hypothetical Returns
For the Six Months Ended June 30, 2007
Hypothetical (5% return | |||||||||||
Actual | before expenses) | ||||||||||
Fund’s | Beginning | Ending | Expenses | Ending | Expenses | ||||||
Annualized | Account | Account | Paid | Account | Paid | ||||||
Expense | Value | Value | During | Value | During | ||||||
Ratio(1) | 01/1/07 | 06/30/07 | Period(1) | 06/30/07 | Period(1) | ||||||
Baird LargeCap Fund | |||||||||||
| Institutional Class | 0.75% | $1,000.00 | $1,062.10 | $3.83 | $1,021.08 | $3.76 | |||||
| Investor Class | 1.00% | $1,000.00 | $1,060.00 | $5.11 | $1,019.84 | $5.01 | |||||
Baird MidCap Fund | |||||||||||
| Institutional Class | 0.85% | $1,000.00 | $1,132.90 | $4.50 | $1,020.58 | $4.26 | |||||
| Investor Class | 1.10% | $1,000.00 | $1,130.90 | $5.81 | $1,019.34 | $5.51 | |||||
Baird SmallCap Fund | |||||||||||
| Institutional Class | 0.95% | $1,000.00 | $1,014.10 | $4.74 | $1,020.08 | $4.76 | |||||
| Investor Class | 1.20% | $1,000.00 | $1,015.00 | $6.00 | $1,018.84 | $6.01 | |||||
(1) | Expenses are equal to the Fund’s annualized expense ratio multiplied by the average account value over the period, multiplied by 181 days and divided by 365 to reflect the one-half year period. |
Page 14
Baird Funds, Inc.
Statements of Assets and Liabilities June 30, 2007 (Unaudited) |
Baird LargeCap | Baird MidCap | Baird SmallCap | ||||||||||
Fund | Fund | Fund | ||||||||||
ASSETS: | ||||||||||||
| Investments, at value (cost $30,008,723; | $ | 34,597,461 | $ | 50,613,312 | $ | 35,265,987 | ||||||
| $41,447,251; and $29,354,604, respectively) | ||||||||||||
| Repurchase agreements (cost $5,244,371; | 5,244,371 | 10,058,261 | — | |||||||||
| $10,058,261; and $0, respectively) | ||||||||||||
| Dividends receivable | 13,897 | 4,181 | 3,028 | |||||||||
| Interest receivable | 1,962 | 8,528 | 7,114 | |||||||||
| Receivable for investments sold | — | 588,854 | 268,395 | |||||||||
| Receivable for fund shares sold | 4,330 | 128 | 2,000 | |||||||||
| Other assets | 15,340 | 13,028 | 18,744 | |||||||||
| Total assets | 39,877,361 | 61,286,292 | 35,565,268 | |||||||||
LIABILITIES: | ||||||||||||
| Payable for collateral received for securities loaned | 10,095,119 | 19,361,586 | — | |||||||||
| Payable to Advisor and Distributor | 8,591 | 22,407 | 10,176 | |||||||||
| Payable for securities purchased | — | 1,843,545 | — | |||||||||
| Payable for fund shares repurchased | — | 122 | 621,647 | |||||||||
| Accrued expenses and other liabilities | 32,823 | 40,417 | 55,887 | |||||||||
| Total liabilities | 10,136,533 | 21,268,077 | 687,710 | |||||||||
NET ASSETS | $ | 29,740,828 | $ | 40,018,215 | $ | 34,877,558 | ||||||
NET ASSETS CONSIST OF: | ||||||||||||
| Capital stock | $ | 27,419,727 | $ | 28,653,884 | $ | 28,165,298 | ||||||
| Accumulated undistributed net investment income | 40,621 | — | — | |||||||||
| Accumulated net realized gain (loss) on investments sold | (2,308,258 | ) | 2,198,270 | 800,877 | ||||||||
| Net unrealized appreciation on investments | 4,588,738 | 9,166,061 | 5,911,383 | |||||||||
NET ASSETS | $ | 29,740,828 | $ | 40,018,215 | $ | 34,877,558 | ||||||
INSTITUTIONAL CLASS SHARES | ||||||||||||
| Net Assets | $ | 28,765,921 | $ | 35,102,331 | $ | 34,545,151 | ||||||
| Shares outstanding | ||||||||||||
| ($0.01 par value, unlimited shares authorized) | 3,175,778 | 3,322,474 | 2,830,787 | |||||||||
| Net asset value, offering and redemption price per share | $ | 9.06 | $ | 10.57 | $ | 12.20 | ||||||
INVESTOR CLASS SHARES | ||||||||||||
| Net Assets | $ | 974,907 | $ | 4,915,884 | $ | 332,407 | ||||||
| Shares outstanding | ||||||||||||
| ($0.01 par value, unlimited shares authorized) | 108,163 | 474,112 | 27,367 | |||||||||
| Net asset value, offering and redemption price per share | $ | 9.01 | $ | 10.37 | $ | 12.15 | ||||||
The accompanying notes are an integral part of these financial statements.
Page 15
Baird Funds, Inc.
Statements of Operations Six Months Ended June 30, 2007 (Unaudited) |
Baird LargeCap | Baird MidCap | Baird SmallCap | ||||||||||
Fund | Fund | Fund | ||||||||||
INVESTMENT INCOME: | ||||||||||||
| Dividends (net of foreign taxes withheld | ||||||||||||
| of $1,637, $0, $0, respectively) | $ | 125,080 | $ | 101,659 | $ | 94,336 | ||||||
| Interest | 19,522 | 32,257 | 67,694 | |||||||||
| Income from securities lending | 3,488 | 10,281 | 15,130 | |||||||||
| Total investment income | 148,090 | 144,197 | 177,160 | |||||||||
EXPENSES: | ||||||||||||
| Investment advisory fees | 92,171 | 141,485 | 225,665 | |||||||||
| Administration fees | 5,635 | 7,171 | 12,232 | |||||||||
| Shareholder servicing fees | 8,588 | 8,697 | 40,984 | |||||||||
| Fund accounting fees | 13,091 | 13,628 | 15,965 | |||||||||
| Professional fees | 12,902 | 12,302 | 13,302 | |||||||||
| Federal and state registration | 14,580 | 13,258 | 16,710 | |||||||||
| Directors fees | 4,268 | 4,218 | 4,268 | |||||||||
| Custody fees | 3,449 | 5,716 | 5,676 | |||||||||
| Reports to shareholders | 1,634 | 4,833 | 6,177 | |||||||||
| Distribution fees – Investor Class Shares (Note 8) | 1,316 | 5,672 | 5,978 | |||||||||
| Interest Expense (Note 7) | 954 | 155 | 226 | |||||||||
| Miscellaneous expenses | 869 | 1,930 | 2,227 | |||||||||
| Total expenses | 159,457 | 219,065 | 349,410 | |||||||||
| Expense reimbursement by Advisor | (51,784 | ) | (53,043 | ) | (91,219 | ) | ||||||
| Total expenses | 107,673 | 166,022 | 258,191 | |||||||||
NET INVESTMENT INCOME (LOSS) | 40,417 | (21,825 | ) | (81,031 | ) | |||||||
REALIZED AND UNREALIZED | ||||||||||||
GAIN (LOSS) ON INVESTMENTS: | ||||||||||||
| Net realized gain on investments | 453,813 | 2,915,255 | 709,436 | |||||||||
| Change in unrealized appreciation/depreciation | ||||||||||||
| on investments | 1,285,261 | 1,837,947 | (877,644 | ) | ||||||||
| Net realized and unrealized gain (loss) on investments | 1,739,074 | 4,753,202 | (168,208 | ) | ||||||||
NET INCREASE (DECREASE) IN NET ASSETS | ||||||||||||
RESULTING FROM OPERATIONS | $ | 1,779,491 | $ | 4,731,377 | $ | (249,239 | ) | |||||
The accompanying notes are an integral part of these financial statements.
Page 16
Baird Funds, Inc.
Statements of Changes in Net Assets |
Baird LargeCap Fund | ||||||||
| Six Months Ended | ||||||||
| June 30, 2007 | Year Ended | |||||||
| (Unaudited) | December 31, 2006 | |||||||
OPERATIONS: | ||||||||
| Net investment income | $ | 40,417 | $ | 112,242 | ||||
| Net realized gain on investments | 453,813 | 3,822,130 | ||||||
| Change in unrealized appreciation/depreciation on investments | 1,285,261 | (3,222,372 | ) | |||||
| Net increase in net assets resulting from operations | 1,779,491 | 712,000 | ||||||
CAPITAL SHARE TRANSACTIONS: | ||||||||
| Proceeds from shares sold | 5,302,047 | 8,900,784 | ||||||
| Shares issued to holders in reinvestment of dividends | — | 112,014 | ||||||
| Cost of shares redeemed | (5,870,987 | ) | (10,858,598 | ) | ||||
| Net decrease in net assets resulting from | ||||||||
| capital share transactions | (568,940 | ) | (1,845,800 | ) | ||||
DISTRIBUTIONS TO | ||||||||
INSTITUTIONAL CLASS SHAREHOLDERS: | ||||||||
| From net investment income | — | (110,900 | ) | |||||
DISTRIBUTIONS TO | ||||||||
INVESTOR CLASS SHAREHOLDERS: | ||||||||
| From net investment income | — | (1,174 | ) | |||||
TOTAL INCREASE (DECREASE) IN NET ASSETS | 1,210,551 | (1,245,874 | ) | |||||
NET ASSETS: | ||||||||
| Beginning of period | 28,530,277 | 29,776,151 | ||||||
| End of period (including undistributed net investment income | ||||||||
| of $40,621 and $203, respectively) | $ | 29,740,828 | $ | 28,530,277 | ||||
The accompanying notes are an integral part of these financial statements.
Page 17
Baird Funds, Inc.
Statements of Changes in Net Assets |
Baird MidCap Fund | ||||||||
| Six Months Ended | ||||||||
| June 30, 2007 | Year Ended | |||||||
| (Unaudited) | December 31, 2006 | |||||||
OPERATIONS: | ||||||||
| Net investment loss | $ | (21,825 | ) | $ | (134,222 | ) | ||
| Net realized gain on investments | 2,915,255 | 5,175,206 | ||||||
| Change in unrealized appreciation/depreciation on investments | 1,837,947 | (5,482,914 | ) | |||||
| Net increase (decrease) in net assets resulting from operations | 4,731,377 | (441,930 | ) | |||||
CAPITAL SHARE TRANSACTIONS: | ||||||||
| Proceeds from shares sold | 5,543,768 | 27,770,122 | ||||||
| Shares issued to holders in reinvestment of dividends | — | 6,860,350 | ||||||
| Cost of shares redeemed | (7,337,765 | ) | (80,341,536 | ) | ||||
| Net decrease in net assets resulting from | ||||||||
| capital share transactions | (1,793,997 | ) | (45,711,064 | ) | ||||
DISTRIBUTIONS TO | ||||||||
INSTITUTIONAL CLASS SHAREHOLDERS: | ||||||||
| From net realized gains | — | (5,953,538 | ) | |||||
DISTRIBUTIONS TO | ||||||||
INVESTOR CLASS SHAREHOLDERS: | ||||||||
| From net realized gains | — | (990,249 | ) | |||||
TOTAL INCREASE (DECREASE) IN NET ASSETS | 2,937,380 | (53,096,781 | ) | |||||
NET ASSETS: | ||||||||
| Beginning of period | 37,080,835 | 90,177,616 | ||||||
| End of period | $ | 40,018,215 | $ | 37,080,835 | ||||
The accompanying notes are an integral part of these financial statements.
Page 18
Baird Funds, Inc.
Statements of Changes in Net Assets |
Baird SmallCap Fund | ||||||||
| Six Months Ended | ||||||||
| June 30, 2007 | Year Ended | |||||||
| (Unaudited) | December 31, 2006 | |||||||
OPERATIONS: | ||||||||
| Net investment loss | $ | (81,031 | ) | $ | (293,827 | ) | ||
| Net realized gain on investments | 709,436 | 1,686,398 | ||||||
| Change in unrealized appreciation/depreciation on investments | (877,644 | ) | 2,986,275 | |||||
| Net increase (decrease) in net assets resulting from operations | (249,239 | ) | 4,378,846 | |||||
CAPITAL SHARE TRANSACTIONS: | ||||||||
| Proceeds from shares sold | 9,005,260 | 36,379,202 | ||||||
| Shares issued to holders in reinvestments of dividends | — | 420,515 | ||||||
| Cost of shares redeemed | (45,590,637 | ) | (16,364,194 | ) | ||||
| Net increase (decrease) in net assets resulting from | ||||||||
| capital share transactions | (36,585,377 | ) | 20,435,523 | |||||
DISTRIBUTIONS TO | ||||||||
INSTITUTIONAL CLASS SHAREHOLDERS: | ||||||||
| From net realized gains | — | (425,164 | ) | |||||
DISTRIBUTIONS TO | ||||||||
INVESTOR CLASS SHAREHOLDERS: | ||||||||
| From net realized gains | — | (50,691 | ) | |||||
TOTAL INCREASE (DECREASE) IN NET ASSETS | (36,834,616 | ) | 24,338,514 | |||||
NET ASSETS: | ||||||||
| Beginning of period | 71,712,174 | 47,373,660 | ||||||
| End of period | $ | 34,877,558 | $ | 71,712,174 | ||||
The accompanying notes are an integral part of these financial statements.
Page 19
Baird Funds, Inc.
Financial Highlights |
Baird LargeCap Fund – Institutional Class | ||||||||||||||||||||||||
| Six Months | ||||||||||||||||||||||||
| Ended | ||||||||||||||||||||||||
| June 30, 2007 | Year Ended December 31, | |||||||||||||||||||||||
| (Unaudited) | 2006 | 2005 | 2004 | 2003 | 2002 | |||||||||||||||||||
| Per Share Data: | ||||||||||||||||||||||||
| Net asset value, beginning of period | $ | 8.53 | $ | 8.33 | $ | 8.13 | $ | 7.78 | $ | 6.41 | $ | 8.63 | ||||||||||||
| Income from investment operations: | ||||||||||||||||||||||||
| Net investment income | 0.01 | 0.04 | 0.04 | (1) | 0.06 | (1) | 0.02 | 0.02 | ||||||||||||||||
| Net realized and unrealized | ||||||||||||||||||||||||
| gains (losses) on investments | 0.52 | 0.20 | 0.24 | 0.35 | 1.37 | (2.22 | ) | |||||||||||||||||
| Total from investment operations | 0.53 | 0.24 | 0.28 | 0.41 | 1.39 | (2.20 | ) | |||||||||||||||||
| Less distributions: | ||||||||||||||||||||||||
| Dividends from net investment income | — | (0.04 | ) | (0.08 | ) | (0.06 | ) | (0.02 | ) | (0.02 | ) | |||||||||||||
| Net asset value, end of period | $ | 9.06 | $ | 8.53 | $ | 8.33 | $ | 8.13 | $ | 7.78 | $ | 6.41 | ||||||||||||
| Total return | 6.21 | %(2) | 2.89 | % | 3.39 | % | 5.21 | % | 21.75 | % | (25.53 | )% | ||||||||||||
| Supplemental data and ratios: | ||||||||||||||||||||||||
| Net assets, end of period | $ | 28,765,921 | $ | 27,442,329 | $ | 27,375,626 | $ | 64,754,140 | $ | 59,743,783 | $ | 48,900,767 | ||||||||||||
| Ratio of expenses to average net assets | 0.75 | %(3) | 0.75 | % | 0.75 | % | 0.75 | % | 0.75 | % | 0.75 | % | ||||||||||||
| Ratio of expenses to average | ||||||||||||||||||||||||
| net assets (before waivers) | 1.12 | %(3) | 1.12 | % | 0.93 | % | 0.93 | % | 0.95 | % | 0.95 | % | ||||||||||||
| Ratio of net investment income | ||||||||||||||||||||||||
| to average net assets | 0.30 | %(3) | 0.44 | % | 0.46 | % | 0.72 | % | 0.34 | % | 0.23 | % | ||||||||||||
| Ratio of net investment income (loss) | ||||||||||||||||||||||||
| to average net assets (before waivers) | (0.07 | )%(3) | 0.07 | % | 0.28 | % | 0.54 | % | 0.14 | % | 0.03 | % | ||||||||||||
Portfolio turnover rate(4) | 41.1 | %(2) | 63.9 | % | 28.6 | % | 23.2 | % | 24.8 | % | 16.2 | % | ||||||||||||
(1) | Calculated using average shares outstanding during the period. |
(2) | Not annualized. |
(3) | Annualized. |
(4) | Portfolio turnover is calculated on the basis of the Fund as a whole without distinguishing between the classes of shares issued. |
The accompanying notes are an integral part of these financial statements.
Page 20
Baird Funds, Inc.
Financial Highlights |
Baird LargeCap Fund – Investor Class | ||||||||||||||||||||||||
| Six Months | ||||||||||||||||||||||||
| Ended | ||||||||||||||||||||||||
| June 30, 2007 | Year Ended December 31, | |||||||||||||||||||||||
| (Unaudited) | 2006 | 2005 | 2004 | 2003 | 2002 | |||||||||||||||||||
| Per Share Data: | ||||||||||||||||||||||||
| Net asset value, beginning of period | $ | 8.50 | $ | 8.29 | $ | 8.09 | $ | 7.75 | $ | 6.40 | $ | 8.61 | ||||||||||||
| Income from investment operations: | ||||||||||||||||||||||||
| Net investment income | 0.00 | (1)(2) | 0.01 | 0.02 | (1) | 0.04 | (1) | 0.01 | 0.00 | (2) | ||||||||||||||
| Net realized and unrealized | ||||||||||||||||||||||||
| gains (losses) on investments | 0.51 | 0.21 | 0.23 | 0.35 | 1.35 | (2.21 | ) | |||||||||||||||||
| Total from investment operations | 0.51 | 0.22 | 0.25 | 0.39 | 1.36 | (2.21 | ) | |||||||||||||||||
| Less distributions: | ||||||||||||||||||||||||
| Dividends from net investment income | — | (0.01 | ) | (0.05 | ) | (0.05 | ) | (0.01 | ) | (0.00 | )(2) | |||||||||||||
| Net asset value, end of period | $ | 9.01 | $ | 8.50 | $ | 8.29 | $ | 8.09 | $ | 7.75 | $ | 6.40 | ||||||||||||
| Total return | 6.00 | %(3) | 2.64 | % | 3.15 | % | 5.00 | % | 21.20 | % | (25.65 | )% | ||||||||||||
| Supplemental data and ratios: | ||||||||||||||||||||||||
| Net assets, end of period | $ | 974,907 | $ | 1,087,948 | $ | 2,400,525 | $ | 1,900,053 | $ | 634,160 | $ | 647,018 | ||||||||||||
| Ratio of expenses to average net assets | 1.00 | %(4) | 1.00 | % | 1.00 | % | 1.00 | % | 1.00 | % | 1.00 | % | ||||||||||||
| Ratio of expenses to average | ||||||||||||||||||||||||
| net assets (before waivers) | 1.37 | %(4) | 1.37 | % | 1.18 | % | 1.18 | % | 1.20 | % | 1.20 | % | ||||||||||||
| Ratio of net investment income (loss) | �� | |||||||||||||||||||||||
| to average net assets | 0.05 | %(4) | 0.19 | % | 0.21 | % | 0.47 | % | 0.09 | % | (0.02 | )% | ||||||||||||
| Ratio of net investment income (loss) | ||||||||||||||||||||||||
| to average net assets (before waivers) | (0.32 | )%(4) | (0.18 | )% | 0.03 | % | 0.29 | % | (0.11 | )% | (0.22 | )% | ||||||||||||
Portfolio turnover rate(5) | 41.1 | %(3) | 63.9 | % | 28.6 | % | 23.2 | % | 24.8 | % | 16.2 | % | ||||||||||||
(1) | Calculated using average shares outstanding during the period. |
(2) | Amount is less than $0.01. |
(3) | Not annualized. |
(4) | Annualized. |
(5) | Portfolio turnover is calculated on the basis of the Fund as a whole without distinguishing between the classes of shares issued. |
The accompanying notes are an integral part of these financial statements.
Page 21
Baird Funds, Inc.
Financial Highlights |
Baird MidCap Fund – Institutional Class | ||||||||||||||||||||||||
| Six Months | ||||||||||||||||||||||||
| Ended | ||||||||||||||||||||||||
| June 30, 2007 | Year Ended December 31, | |||||||||||||||||||||||
| (Unaudited) | 2006 | 2005 | 2004 | 2003 | 2002 | |||||||||||||||||||
| Per Share Data: | ||||||||||||||||||||||||
| Net asset value, beginning of period | $ | 9.33 | $ | 11.12 | $ | 10.91 | $ | 9.72 | $ | 7.66 | $ | 9.11 | ||||||||||||
| Income from investment operations: | ||||||||||||||||||||||||
| Net investment loss | (0.00 | )(2) | (0.02 | )(1) | (0.02 | )(1) | (0.04 | )(1) | (0.07 | ) | (0.07 | )(1) | ||||||||||||
| Net realized and unrealized | ||||||||||||||||||||||||
| gains (losses) on investments | 1.24 | 0.46 | 0.63 | 1.25 | 2.13 | (1.38 | ) | |||||||||||||||||
| Total from investment operations | 1.24 | 0.44 | 0.61 | 1.21 | 2.06 | (1.45 | ) | |||||||||||||||||
| Less distributions: | ||||||||||||||||||||||||
| Distributions from net realized gains | — | (2.23 | ) | (0.40 | ) | (0.02 | ) | — | — | |||||||||||||||
| Net asset value, end of period | $ | 10.57 | $ | 9.33 | $ | 11.12 | $ | 10.91 | $ | 9.72 | $ | 7.66 | ||||||||||||
| Total return | 13.29 | %(3) | 3.93 | % | 5.56 | % | 12.44 | % | 26.89 | % | (15.92 | )% | ||||||||||||
| Supplemental data and ratios: | ||||||||||||||||||||||||
| Net assets, end of period | $ | 35,102,331 | $ | 32,057,214 | $ | 85,670,669 | $ | 86,476,869 | $ | 28,629,656 | $ | 20,864,264 | ||||||||||||
| Ratio of expenses to average net assets | 0.85 | %(4) | 0.85 | % | 0.85 | % | 0.85 | % | 1.20 | % | 1.25 | % | ||||||||||||
| Ratio of expenses to average | ||||||||||||||||||||||||
| net assets (before waivers) | 1.13 | %(4) | 1.01 | % | 0.98 | % | 1.05 | % | 1.20 | % | 1.39 | % | ||||||||||||
| Ratio of net investment loss | ||||||||||||||||||||||||
| to average net assets | (0.09 | )%(4) | (0.17 | )% | (0.21 | )% | (0.43 | )% | (0.81 | )% | (0.84 | )% | ||||||||||||
| Ratio of net investment loss | ||||||||||||||||||||||||
| to average net assets (before waivers) | (0.37 | )%(4) | (0.33 | )% | (0.34 | )% | (0.63 | )% | (0.81 | )% | (0.98 | )% | ||||||||||||
Portfolio turnover rate(5) | 35.2 | %(3) | 78.6 | % | 77.4 | % | 77.9 | % | 81.8 | % | 55.4 | % | ||||||||||||
(1) | Calculated using average shares outstanding during the period. |
(2) | Net investment loss per share is calculated using the ending balance of undistributed net investment loss prior to consideration of adjustments for permanent book to tax differences. |
(3) | Not annualized. |
(4) | Annualized. |
(5) | Portfolio turnover is calculated on the basis of the Fund as a whole without distinguishing between the classes of shares issued. |
The accompanying notes are an integral part of these financial statements.
Page 22
Baird Funds, Inc.
Financial Highlights |
Baird MidCap Fund – Investor Class | ||||||||||||||||||||||||
| Six Months | ||||||||||||||||||||||||
| Ended | ||||||||||||||||||||||||
| June 30, 2007 | Year Ended December 31, | |||||||||||||||||||||||
| (Unaudited) | 2006 | 2005 | 2004 | 2003 | 2002 | |||||||||||||||||||
| Per Share Data: | ||||||||||||||||||||||||
| Net asset value, beginning of period | $ | 9.17 | $ | 10.99 | $ | 10.82 | $ | 9.65 | $ | 7.63 | $ | 9.09 | ||||||||||||
| Income from investment operations: | ||||||||||||||||||||||||
| Net investment loss | (0.02 | )(2) | (0.04 | ) | (0.05 | )(1) | (0.07 | )(1) | (0.09 | ) | (0.09 | )(1) | ||||||||||||
| Net realized and unrealized | ||||||||||||||||||||||||
| gains (losses) on investments | 1.22 | 0.45 | 0.62 | 1.26 | 2.11 | (1.37 | ) | |||||||||||||||||
| Total from investment operations | 1.20 | 0.41 | 0.57 | 1.19 | 2.02 | (1.46 | ) | |||||||||||||||||
| Less distributions: | ||||||||||||||||||||||||
| Distributions from net realized gains | — | (2.23 | ) | (0.40 | ) | (0.02 | ) | — | — | |||||||||||||||
| Net asset value, end of period | $ | 10.37 | $ | 9.17 | $ | 10.99 | $ | 10.82 | $ | 9.65 | $ | 7.63 | ||||||||||||
| Total return | 13.09 | %(3) | 3.73 | % | 5.24 | % | 12.32 | % | 26.47 | % | (16.06 | )% | ||||||||||||
| Supplemental data and ratios: | ||||||||||||||||||||||||
| Net assets, end of period | $ | 4,915,884 | $ | 5,023,621 | $ | 4,506,947 | $ | 3,944,857 | $ | 959,209 | $ | 801,703 | ||||||||||||
| Ratio of expenses to average net assets | 1.10 | %(4) | 1.10 | % | 1.10 | % | 1.10 | % | 1.45 | % | 1.50 | % | ||||||||||||
| Ratio of expenses to average | ||||||||||||||||||||||||
| net assets (before waivers) | 1.38 | %(4) | 1.26 | % | 1.23 | % | 1.30 | % | 1.45 | % | 1.64 | % | ||||||||||||
| Ratio of net investment loss | ||||||||||||||||||||||||
| to average net assets | (0.34 | )%(4) | (0.42 | )% | (0.46 | )% | (0.68 | )% | (1.06 | )% | (1.09 | )% | ||||||||||||
| Ratio of net investment loss | ||||||||||||||||||||||||
| to average net assets (before waivers) | (0.62 | )%(4) | (0.58 | )% | (0.59 | )% | (0.88 | )% | (1.06 | )% | (1.23 | )% | ||||||||||||
Portfolio turnover rate(5) | 35.2 | %(3) | 78.6 | % | 77.4 | % | 77.9 | % | 81.8 | % | 55.4 | % | ||||||||||||
(1) | Calculated using average shares outstanding during the period. |
(2) | Net investment loss per share is calculated using the ending balance of undistributed net investment loss prior to consideration of adjustments for permanent book to tax differences. |
(3) | Not annualized. |
(4) | Annualized. |
(5) | Portfolio turnover is calculated on the basis of the Fund as a whole without distinguishing between the classes of shares issued. |
The accompanying notes are an integral part of these financial statements.
Page 23
Baird Funds, Inc.
Financial Highlights |
Baird SmallCap Fund – Institutional Class | ||||||||||||||||
| Six Months | ||||||||||||||||
| Ended | Year Ended | Year Ended | June 30, 2004(1) | |||||||||||||
| June 30, 2007 | December 31, | December 31, | through | |||||||||||||
| (Unaudited) | 2006 | 2005 | December 31, 2004 | |||||||||||||
| Per Share Data: | ||||||||||||||||
| Net asset value, beginning of period | $ | 12.03 | $ | 11.20 | $ | 10.84 | $ | 10.00 | ||||||||
| Income from investment operations: | ||||||||||||||||
Net investment loss(2) | (0.02 | ) | (0.05 | ) | (0.06 | ) | (0.03 | ) | ||||||||
| Net realized and unrealized | ||||||||||||||||
| gains on investments | 0.19 | 0.96 | 0.42 | 0.87 | ||||||||||||
| Total from investment operations | 0.17 | 0.91 | 0.36 | 0.84 | ||||||||||||
| Less distributions: | ||||||||||||||||
| Distributions from net realized gains | — | (0.08 | ) | — | — | |||||||||||
| Net asset value, end of period | $ | 12.20 | $ | 12.03 | $ | 11.20 | $ | 10.84 | ||||||||
| Total return | 1.41 | %(3) | 8.13 | % | 3.32 | % | 8.40 | %(3) | ||||||||
| Supplemental data and ratios: | ||||||||||||||||
| Net assets, end of period | $ | 34,545,151 | $ | 64,008,514 | $ | 45,010,093 | $ | 17,331,262 | ||||||||
| Ratio of expenses to average net assets | 0.95 | %(4) | 0.95 | % | 0.95 | % | 0.95 | %(4) | ||||||||
| Ratio of expenses to average | ||||||||||||||||
| net assets (before waivers) | 1.29 | %(4) | 1.23 | % | 1.31 | % | 1.89 | %(4) | ||||||||
| Ratio of net investment loss | ||||||||||||||||
| to average net assets | (0.28 | )%(4) | (0.46 | )% | (0.57 | )% | (0.65 | )%(4) | ||||||||
| Ratio of net investment loss | ||||||||||||||||
| to average net assets (before waivers) | (0.62 | )%(4) | (0.74 | )% | (0.93 | )% | (1.59 | )%(4) | ||||||||
Portfolio turnover rate(5) | 47.8 | %(3) | 52.8 | % | 56.4 | % | 34.7 | %(3) | ||||||||
(1) | Commencement of operations. |
(2) | Calculated using average shares outstanding during the period. |
(3) | Not annualized. |
(4) | Annualized. |
(5) | Portfolio turnover is calculated on the basis of the Fund as a whole without distinguishing between the classes of shares issued. |
The accompanying notes are an integral part of these financial statements.
Page 24
Baird Funds, Inc.
Financial Highlights |
Baird SmallCap Fund – Investor Class | ||||||||||||||||
| Six Months | ||||||||||||||||
| Ended | Year Ended | Year Ended | June 30, 2004(1) | |||||||||||||
| June 30, 2007 | December 31, | December 31, | through | |||||||||||||
| (Unaudited) | 2006 | 2005 | December 31, 2004 | |||||||||||||
| Per Share Data: | ||||||||||||||||
| Net asset value, beginning of period | $ | 11.96 | $ | 11.16 | $ | 10.83 | $ | 10.00 | ||||||||
| Income from investment operations: | ||||||||||||||||
Net investment loss(2) | (0.03 | ) | (0.08 | ) | (0.09 | ) | (0.05 | ) | ||||||||
| Net realized and unrealized | ||||||||||||||||
| gains on investments | 0.22 | 0.96 | 0.42 | 0.88 | ||||||||||||
| Total from investment operations | 0.19 | 0.88 | 0.33 | 0.83 | ||||||||||||
| Less distributions: | ||||||||||||||||
| Distributions from net realized gains | — | (0.08 | ) | — | — | |||||||||||
| Net asset value, end of period | $ | 12.15 | $ | 11.96 | $ | 11.16 | $ | 10.83 | ||||||||
| Total return | 1.50 | %(3) | 7.89 | % | 3.05 | % | 8.30 | %(3) | ||||||||
| Supplemental data and ratios: | ||||||||||||||||
| Net assets, end of period | $ | 332,407 | $ | 7,703,660 | $ | 2,363,567 | $ | 68,184 | ||||||||
| Ratio of expenses to average net assets | 1.20 | %(4) | 1.20 | % | 1.20 | % | 1.20 | %(4) | ||||||||
| Ratio of expenses to average | ||||||||||||||||
| net assets (before waivers) | 1.54 | %(4) | 1.48 | % | 1.56 | % | 2.14 | %(4) | ||||||||
| Ratio of net investment loss | ||||||||||||||||
| to average net assets | (0.53 | )%(4) | (0.71 | )% | (0.82 | )% | (0.90 | )%(4) | ||||||||
| Ratio of net investment loss | ||||||||||||||||
| to average net assets (before waivers) | (0.87 | )%(4) | (0.99 | )% | (1.18 | )% | (1.84 | )%(4) | ||||||||
Portfolio turnover rate(5) | 47.8 | %(3) | 52.8 | % | 56.4 | % | 34.7 | %(3) | ||||||||
(1) | Commencement of operations. |
(2) | Calculated using average shares outstanding during the period. |
(3) | Not annualized. |
(4) | Annualized. |
(5) | Portfolio turnover is calculated on the basis of the Fund as a whole without distinguishing between the classes of shares issued. |
The accompanying notes are an integral part of these financial statements.
Page 25
Baird Funds, Inc.
Notes to the Financial Statements June 30, 2007 (Unaudited) |
1. | ORGANIZATION |
Baird Funds, Inc. (the “Corporation”) was incorporated on June 9, 2000 as a Wisconsin corporation and is registered as an open-end management investment company under the Investment Company Act of 1940, as amended (the “1940 Act”). The accompanying financial statements include the Baird LargeCap Fund, the Baird MidCap Fund and the Baird SmallCap Fund (each a “Fund” and collectively the “Funds”), three of the eight portfolios comprising the Corporation. Pursuant to the 1940 Act, the Funds are “diversified” series of the Corporation. The investment advisor to the Funds is Robert W. Baird & Co. Incorporated (“Baird” or the “Advisor”).
The Baird LargeCap Fund commenced operations with the sale of both Institutional and Investor Class Shares on September 29, 2000. The Baird MidCap Fund commenced operations with the sale of both Institutional and Investor Class Shares on December 29, 2000. The Baird SmallCap Fund commenced operations with the sale of both Institutional and Investor Class Shares on June 30, 2004. The Institutional Class Shares are not subject to a distribution and service (12b-1) fee, while the Investor Class Shares are subject to a distribution and service (12b-1) fee up to 0.25%.
The Baird LargeCap Fund seeks long-term growth of capital through investments in equity securities of large-capitalization companies. Dividend income is a secondary consideration.
The Baird MidCap Fund seeks long-term growth of capital through investments in equity securities of mid-capitalization companies.
The Baird SmallCap Fund seeks long-term growth of capital through investments in equity securities of small-capitalization companies.
On June 30, 2007, one shareholder related to the Advisor held 46% of the Baird LargeCap Fund and 37% of the Baird SmallCap Fund.
2. | SIGNIFICANT ACCOUNTING POLICIES |
The following is a summary of significant accounting policies consistently followed by the Funds in the preparation of their financial statements. These policies are in conformity with accounting principles generally accepted in the United States of America.
| a) | Investment Valuation– Common stocks that are listed on a securities exchange (other than NASDAQ) are valued at the last quoted sales price. Securities traded on NASDAQ are valued at the NASDAQ Official Closing Price. Price information on listed stocks is taken from the exchange where the security is primarily traded. Securities that were not traded on the valuation date, as well as stocks that are not listed on an exchange, including NASDAQ, are valued at the average of the current bid and asked price. Because market quotations for most debt securities are not readily available, debt securities are stated at fair value as furnished by an independent pricing service, which uses valuation methods such as matrix pricing and other analytical pricing models, as well as market transactions and dealer quotations. Debt securities purchased with a remaining maturity of 60 days or less are valued at acquisition cost plus or minus any amortized discount or premium. Investments in mutual funds are valued at their stated net asset value. |
Page 26
Notes to the Financial Statements June 30, 2007 (Unaudited) |
2. | SIGNIFICANT ACCOUNTING POLICIES (cont.) |
| Other assets and securities for which no quotations are readily available are valued at fair value as determined in good faith by the Advisor in accordance with procedures approved by the Corporation’s Board of Directors. In accordance with such procedures, the Advisor may use broker quotes or, if the broker quotes are unavailable or deemed to be unreliable, fair value will be determined by a valuation committee of the Advisor. In determining fair value, the valuation committee takes into account all relevant factors and available information. Consequently, the price of the security used by a Fund to calculate its NAV may differ from quoted or published prices for the same security. Fair value pricing involves subjective judgments and there is no single standard for determining a security’s fair value. As a result, different mutual funds could reasonably arrive at a different fair value for the same security. It is possible that the fair value determined for a security is materially different from the value that could be realized upon the sale of that security or from the values that other mutual funds may determine. | |
| In September 2006, the Financial Accounting Standards Board (FASB) issued Statement of Financial Accounting Standards (“SFAS”) No. 157, “Fair Value Measurements.” SFAS No. 157 defines fair value, establishes a framework for measuring fair value in accordance with GAAP, and expands disclosure about fair value measurements. SFAS No. 157 is effective for financial statements issued for fiscal years beginning after November 15, 2007. Management has determined that SFAS No. 157 will have no material impact on the Funds’ financial statements. | |
| b) | Foreign Securities– Investing in securities of foreign companies and foreign governments involves special risks and considerations not typically associated with investing in U.S. companies and the U.S. government. These risks include revaluation of currencies and future adverse political and economic developments. Moreover, securities of many foreign companies and foreign governments and their markets may be less liquid and their prices more volatile than those of securities of comparable U.S. companies and the U.S. government. Occasionally, events that affect those values and exchange rates may occur after the close of the exchange on which such securities are traded. If such events materially affect the value of a Fund’s securities, these securities may be valued at their fair value pursuant to procedures adopted by the Board of Directors. |
| c) | Federal Income Taxes– The Funds intend to continue to qualify as regulated investment companies as provided in subchapter M of the Internal Revenue Code and to distribute substantially all of their taxable income to their shareholders in a manner which results in no tax cost to the Funds. Therefore, no federal income or excise tax provision is recorded. |
| Effective June 29, 2007, the Funds adopted Financial Accounting Standards Board (FASB) Interpretation No. 48 (FIN 48),“Accounting for Uncertainty in Income Taxes,” a clarification of FASB Statement No. 109, “Accounting for Income Taxes.” FIN 48 establishes financial reporting rules regarding recognition and measurement of tax positions taken or expected to be taken on a tax return. Management has determined that FIN 48 had no material impact on the Funds’ financial statements. | |
| d) | Distributions to Shareholders– Dividends from net investment income are declared and paid annually. Distributions of net realized gains, if any, are declared and paid at least annually. |
Page 27
Baird Funds, Inc.
Notes to the Financial Statements June 30, 2007 (Unaudited) |
2. SIGNIFICANT ACCOUNTING POLICIES (cont.)
| e) | Allocation of Income and Expenses– Each Fund is charged for those expenses directly attributable to it. Expenses directly attributable to a class of shares, such as Rule 12b-1 distribution fees, are charged to that class of shares. Income, expenses, and realized and unrealized gains and losses are allocated to the classes based on their respective net assets. Expenses that are not directly attributable to a Fund are allocated among the Funds in the series in proportion to their assets. |
| f) | Use of Estimates– The preparation of financial statements in conformity with accounting principles generally accepted in the United States requires management to make estimates and assumptions that affect the reported amounts of assets and liabilities and disclosure of contingent assets and liabilities at the date of the financial statements and the reported amounts of revenues and expenses during the reporting period. Actual results could differ from those estimates. |
| g) | Other– Investment and shareholder transactions are recorded on trade date. The Funds determine the gain or loss realized from investment transactions by comparing the original cost of the security lot sold with the net sales proceeds. Dividend income is recognized on the ex-dividend date and interest income is recognized on an accrual basis. Accounting principles generally accepted in the United States require that permanent financial reporting and tax differences be reclassified in the capital accounts. |
| h) | Guarantees and Indemnifications– In the normal course of business, the Funds enter into contracts with service providers that contain general indemnification clauses. The Funds’ maximum exposure under these arrangements is unknown and this would involve future claims against the Funds that have not yet occurred. Based on experience, the Funds would expect the risk of loss to be remote. |
3. | CAPITAL SHARE TRANSACTIONS |
The following table summarizes the capital share transactions of each Fund for the past two fiscal periods:
BAIRD LARGECAP FUND
| Six Months Ended | Six Months Ended | ||||||||||||||||
| June 30, 2007 | June 30, 2007 | ||||||||||||||||
Institutional Class Shares | Shares | Amount | Investor Class Shares | Shares | Amount | ||||||||||||
| Shares sold | 605,740 | $ | 5,240,468 | Shares sold | 7,111 | $ | 61,579 | ||||||||||
| Shares redeemed | (647,058 | ) | (5,633,317 | ) | Shares redeemed | (26,966 | ) | (237,670 | ) | ||||||||
| Net decrease | (41,318 | ) | $ | (392,849 | ) | Net decrease | (19,855 | ) | $ | (176,091 | ) | ||||||
| Shares Outstanding: | Shares Outstanding: | ||||||||||||||||
| Beginning of period | 3,217,096 | Beginning of period | 128,018 | ||||||||||||||
| End of period | 3,175,778 | End of period | 108,163 | ||||||||||||||
Page 28
Notes to the Financial Statements June 30, 2007 (Unaudited) |
3. CAPITAL SHARE TRANSACTIONS (cont.)
| Year Ended | Year Ended | ||||||||||||||||
| December 31, 2006 | December 31, 2006 | ||||||||||||||||
Institutional Class Shares | Shares | Amount | Investor Class Shares | Shares | Amount | ||||||||||||
| Shares sold | 1,011,084 | $ | 8,494,502 | Shares sold | 48,746 | $ | 406,282 | ||||||||||
| Shares issued to | Shares issued to | ||||||||||||||||
| shareholders in | shareholders in | ||||||||||||||||
| reinvestment of dividends | 12,995 | 110,843 | reinvestment of dividends | 138 | 1,171 | ||||||||||||
| Shares redeemed | (1,094,378 | ) | (9,118,187 | ) | Shares redeemed | (210,595 | ) | (1,740,411 | ) | ||||||||
| Net decrease | (70,299 | ) | $ | (512,842 | ) | Net decrease | (161,711 | ) | $ | (1,332,958 | ) | ||||||
| Shares Outstanding: | Shares Outstanding: | ||||||||||||||||
| Beginning of period | 3,287,395 | Beginning of period | 289,729 | ||||||||||||||
| End of period | 3,217,096 | End of period | 128,018 | ||||||||||||||
BAIRD MIDCAP FUND
| Six Months Ended | Six Months Ended | ||||||||||||||||
| June 30, 2007 | June 30, 2007 | ||||||||||||||||
Institutional Class Shares | Shares | Amount | Investor Class Shares | Shares | Amount | ||||||||||||
| Shares sold | 334,244 | $ | 3,258,875 | Shares sold | 238,285 | $ | 2,284,893 | ||||||||||
| Shares redeemed | (448,361 | ) | (4,388,443 | ) | Shares redeemed | (312,283 | ) | (2,949,322 | ) | ||||||||
| Net decrease | (114,117 | ) | $ | (1,129,568 | ) | Net decrease | (73,998 | ) | $ | (664,429 | ) | ||||||
| Shares Outstanding: | Shares Outstanding: | ||||||||||||||||
| Beginning of period | 3,436,591 | Beginning of period | 548,110 | ||||||||||||||
| End of period | 3,322,474 | End of period | 474,112 | ||||||||||||||
| Year Ended | Year Ended | ||||||||||||||||
| December 31, 2006 | December 31, 2006 | ||||||||||||||||
Institutional Class Shares | Shares | Amount | Investor Class Shares | Shares | Amount | ||||||||||||
| Shares sold | 2,109,560 | $ | 24,906,207 | Shares sold | 250,734 | $ | 2,863,915 | ||||||||||
| Shares issued to | Shares issued to | ||||||||||||||||
| shareholders in | shareholders in | ||||||||||||||||
| reinvestment of dividends | 625,975 | 5,870,101 | reinvestment of dividends | 107,988 | 990,249 | ||||||||||||
| Shares redeemed | (7,000,989 | ) | (77,918,215 | ) | Shares redeemed | (220,539 | ) | (2,423,321 | ) | ||||||||
| Net decrease | (4,265,454 | ) | $ | (47,141,907 | ) | Net increase | 138,183 | $ | 1,430,843 | ||||||||
| Shares Outstanding: | Shares Outstanding: | ||||||||||||||||
| Beginning of period | 7,702,045 | Beginning of period | 409,927 | ||||||||||||||
| End of period | 3,436,591 | End of period | 548,110 | ||||||||||||||
Page 29
Notes to the Financial Statements June 30, 2007 (Unaudited) |
3. CAPITAL SHARE TRANSACTIONS (cont.)
BAIRD SMALLCAP FUND
| Six Months Ended | Six Months Ended | ||||||||||||||||
| June 30, 2007 | June 30, 2007 | ||||||||||||||||
Institutional Class Shares | Shares | Amount | Investor Class Shares | Shares | Amount | ||||||||||||
| Shares sold | 635,006 | $ | 7,488,091 | Shares sold | 129,076 | $ | 1,517,169 | ||||||||||
| Shares redeemed | (3,123,756 | ) | (36,748,544 | ) | Shares redeemed | (746,047 | ) | (8,842,093 | ) | ||||||||
| Net decrease | (2,488,750 | ) | $ | (29,260,453 | ) | Net decrease | (616,971 | ) | $ | (7,324,924 | ) | ||||||
| Shares Outstanding: | Shares Outstanding: | ||||||||||||||||
| Beginning of period | 5,319,537 | Beginning of period | 644,338 | ||||||||||||||
| End of period | 2,830,787 | End of period | 27,367 | ||||||||||||||
| Year Ended | Year Ended | ||||||||||||||||
| December 31, 2006 | December 31, 2006 | ||||||||||||||||
Institutional Class Shares | Shares | Amount | Investor Class Shares | Shares | Amount | ||||||||||||
| Shares sold | 2,601,055 | $ | 30,531,287 | Shares sold | 501,916 | $ | 5,847,915 | ||||||||||
| Shares issued to | Shares issued to | ||||||||||||||||
| shareholders in | shareholders in | ||||||||||||||||
| reinvestment of dividends | 30,717 | 369,831 | reinvestment of dividends | 4,238 | 50,684 | ||||||||||||
| Shares redeemed | (1,330,621 | ) | (15,510,501 | ) | Shares redeemed | (73,644 | ) | (853,693 | ) | ||||||||
| Net increase | 1,301,151 | $ | 15,390,617 | Net increase | 432,510 | $ | 5,044,906 | ||||||||||
| Shares Outstanding: | Shares Outstanding: | ||||||||||||||||
| Beginning of period | 4,018,386 | Beginning of period | 211,828 | ||||||||||||||
| End of period | 5,319,537 | End of period | 644,338 | ||||||||||||||
4. | INVESTMENT TRANSACTIONS AND INCOME TAX INFORMATION |
During the six months ended June 30, 2007, purchases and sales of investment securities (excluding short-term investments) were as follows:
| Baird | Baird | Baird | |
LargeCap Fund | MidCap Fund | SmallCap Fund | |
| Purchases: | $11,465,908 | $11,116,290 | $24,297,885 |
| Sales: | $11,438,851 | $14,230,275 | $56,464,689 |
Page 30
Baird Funds, Inc.
Notes to the Financial Statements June 30, 2007 (Unaudited) |
| 4. | INVESTMENT TRANSACTIONS AND INCOME TAX INFORMATION (cont.) |
At December 31, 2006, accumulated earnings/losses on a tax basis were as follows:
LargeCap | MidCap | SmallCap | ||||||||||
Fund | Fund | Fund | ||||||||||
| Cost of Investments | $ | 26,810,528 | $ | 34,871,277 | $ | 73,693,370 | ||||||
| Gross unrealized appreciation | $ | 3,834,888 | $ | 8,153,894 | $ | 9,953,396 | ||||||
| Gross unrealized depreciation | (591,998 | ) | (1,740,551 | ) | (3,222,596 | ) | ||||||
| Net unrealized appreciation | $ | 3,242,890 | $ | 6,413,343 | $ | 6,730,800 | ||||||
| Undistributed ordinary income | $ | 203 | $ | — | $ | 221,455 | ||||||
| Undistributed long-term capital gain | — | 219,611 | 12 | |||||||||
| Total distributable earnings | $ | 203 | $ | 219,611 | $ | 221,467 | ||||||
| Other accumulated losses | $ | (2,701,484 | ) | $ | — | $ | (71,754 | ) | ||||
| Total accumulated earnings | $ | 541,609 | $ | 6,632,954 | $ | 6,880,513 | ||||||
Undistributed income or net realized gains for financial statement purposes may differ from amounts recognized for federal income tax purposes due to differences in the recognition and characterization of income, expense and capital gain items.
Under the current tax law, capital losses realized after October 31 may be deferred and treated as occurring on the first day of the following fiscal year. For the year ended December 31, 2006, the Baird SmallCap Fund elected to defer capital losses occurring between November 1, 2006 and December 31, 2006 in the amount of $71,754.
At December 31, 2006, the Baird LargeCap Fund had accumulated net realized capital loss carryovers of $1,167,011 that expire in 2012 and $1,534,473 that expire in 2011. To the extent the Funds realize future net capital gains, taxable distributions to shareholders will be offset by any unused capital loss carryovers. During the year ended December 31, 2006, the Baird LargeCap Fund utilized $3,842,197 in capital loss carryovers from previous years. During the year ended December 31, 2006, the Baird SmallCap Fund utilized $545,967 in capital loss carryovers from previous years.
During the six months ended June 30, 2007, the Funds have not made any capital gain distributions or income dividends.
During the year ended December 31, 2006, the Funds paid the following dividends:
Ordinary Income Dividends | Net Long-Term Capital Gains | |||||||
| Baird LargeCap Fund | $ | 112,074 | — | |||||
| Baird MidCap Fund | 355,507 | $ | 6,588,280 | |||||
| Baird SmallCap Fund | — | 475,855 | ||||||
Page 31
Notes to the Financial Statements June 30, 2007 (Unaudited) |
5. | INVESTMENT ADVISORY AND OTHER AGREEMENTS |
The Funds have entered into an Investment Advisory Agreement with Baird for the provision of investment advisory services. Pursuant to the Investment Advisory Agreement, the Advisor is entitled to receive a fee, calculated daily and payable monthly, at the annual rate of 0.65% for the Baird LargeCap Fund, 0.75% for the Baird MidCap Fund and 0.85% for the Baird SmallCap Fund as applied to the respective Fund’s average daily net assets. Certain officers of the Advisor are also officers of the Funds.
For the six months ended June 30, 2007 and through April 30, 2008, the Advisor has contractually agreed to waive its investment advisory fee and/or reimburse the Funds’ operating expenses (exclusive of brokerage, taxes, and extraordinary expenses) to the extent necessary to ensure that each Fund’s annual operating expenses do not exceed the following percentages of average daily net assets:
Institutional Class Shares | Investor Class Shares | |
| Baird LargeCap Fund | 0.75% | 1.00% |
| Baird MidCap Fund | 0.85% | 1.10% |
| Baird SmallCap Fund | 0.95% | 1.20% |
To the extent that the Advisor reimburses or absorbs fees and expenses, it may seek payment of such amounts for three years after the year in which expenses were reimbursed or absorbed. A Fund will make no such payment, however, if its total annual operating expenses exceed the expense limits in effect at the time the expenses were reimbursed or at the time these payments are proposed.
| Six Months | ||||||||||||||||
| Ended | Fiscal Period Ended December 31, | |||||||||||||||
| June 30, | ||||||||||||||||
| 2007 | 2006 | 2005 | 2004 | |||||||||||||
Reimbursed / Absorbed Expenses Subject | ||||||||||||||||
to Recovery by Advisor Until: | 2010 | 2009 | 2008 | 2007 | ||||||||||||
Baird LargeCap Fund | $ | 51,784 | $ | 98,794 | $ | 109,024 | $ | 114,127 | ||||||||
Baird MidCap Fund | $ | 53,043 | $ | 117,213 | $ | 129,774 | $ | 116,179 | ||||||||
Baird SmallCap Fund | $ | 91,219 | $ | 168,361 | $ | 104,335 | $ | 72,320 | ||||||||
U.S. Bancorp Fund Services, LLC serves as transfer agent, administrator, and accounting services agent for the Funds. U.S. Bank, N.A. serves as custodian for the Funds.
Robert W. Baird & Co. Incorporated (the “Distributor”) is the sole distributor of the Funds pursuant to a distribution agreement.
No commissions were earned by the Distributor for services rendered as a registered broker-dealer in securities transactions for the Baird LargeCap Fund, Baird MidCap Fund and Baird SmallCap Fund for the six months ended June 30, 2007.
Page 32
Baird Funds, Inc.
Notes to the Financial Statements June 30, 2007 (Unaudited) |
6. | SECURITIES LENDING |
Each Fund may lend up to one-third of its total assets (including such loans) to borrowers under terms of participation in a securities lending program administered by U.S. Bancorp Asset Management, an affiliate of the Funds’ custodian, transfer agent and administrator. The securities lending agreement requires that loans are collateralized at all times in an amount equal to at least 102% of the market value of any loaned securities at the time of the loan, plus accrued interest.
The Funds receive compensation in the form of fees and earn interest on the cash collateral. The amount of fees depends on a number of factors including the type of security, length of the loan and credit standing of the borrower. Each Fund continues to receive interest payments or dividends on the securities loaned during the borrowing period. Each Fund has the right under the terms of the securities lending agreement to recover the securities from the borrower on demand.
As of June 30, 2007, the Baird LargeCap, Baird MidCap and Baird SmallCap Funds had loaned securities that were collateralized by cash equivalents. The cash collateral is invested by the custodian with the approval of the Advisor. Although the cash collateral is generally invested in readily marketable, high quality, short-term obligations, such investments are subject to risk of payment delays or default on the part of the issuer or counterparty or otherwise may not generate sufficient interest to support the costs associated with securities lending. A Fund could also experience delays in recovering its securities and possible loss of income or value if the borrower fails to return the borrowed securities, although this risk is mitigated by the collateral and by contract with the securities lending agent.
As of June 30, 2007, the market value of the securities on loan and payable on collateral due to broker were as follows:
Market Value of | Payable on Collateral | |||||||
Securities on Loan | due to Broker | |||||||
| Baird LargeCap Fund | $ | 9,679,534 | $ | 10,095,119 | ||||
| Baird MidCap Fund | 18,616,479 | 19,361,586 | ||||||
| Baird SmallCap Fund | — | — | ||||||
Individual reinvested cash collateral jointly pooled with collateral received by other Baird Funds as of June 30, 2007 is as follows:
LargeCap | MidCap | SmallCap | Other | |||||||||||||||||
Fund | Fund | Fund | Baird Funds | Total | ||||||||||||||||
| Cantor Fitzgerald | ||||||||||||||||||||
Repurchase Agreement(1) | $ | 1,598,894 | $ | 3,066,543 | $ | — | $ | 45,334,563 | $ | 50,000,000 | ||||||||||
| CS First Boston | ||||||||||||||||||||
Repurchase Agreement(2) | 1,119,226 | 2,146,580 | — | 31,734,194 | 35,000,000 | |||||||||||||||
| Morgan Stanley | ||||||||||||||||||||
Repurchase Agreement(3) | 1,023,291 | 1,962,588 | — | 29,014,121 | 32,000,000 | |||||||||||||||
| Bear Stearns | ||||||||||||||||||||
Repurchase Agreement(4) | 799,447 | 1,533,271 | — | 22,667,282 | 25,000,000 | |||||||||||||||
| Fenway Funding LLC | ||||||||||||||||||||
| Discount Commercial Paper | 511,646 | 981,294 | — | 14,507,060 | 16,000,000 | |||||||||||||||
Page 33
Baird Funds, Inc.
Notes to the Financial Statements June 30, 2007 (Unaudited) |
6. | SECURITIES LENDING (cont.) |
LargeCap | MidCap | SmallCap | Other | |||||||||||||||||
Fund | Fund | Fund | Baird Funds | Total | ||||||||||||||||
| Duke Funding LLC | ||||||||||||||||||||
| Discount Commercial Paper | 447,691 | 858,632 | — | 12,693,677 | 14,000,000 | |||||||||||||||
| Antalis Funding | ||||||||||||||||||||
| Discount Commercial Paper | 421,149 | 807,727 | — | 11,941,124 | 13,170,000 | |||||||||||||||
| Rams Funding LLC | ||||||||||||||||||||
| Discount Commercial Paper | 351,757 | 674,639 | — | 9,973,604 | 11,000,000 | |||||||||||||||
| Valcour Bay Capital Co. LLC | ||||||||||||||||||||
| Discount Commercial Paper | 351,757 | 674,639 | — | 9,973,604 | 11,000,000 | |||||||||||||||
| KKR Atlantic Funding Trust | ||||||||||||||||||||
| Discount Commercial Paper | 319,778 | 613,309 | — | 9,066,913 | 10,000,000 | |||||||||||||||
| Laguna Discount Commercial Paper | 319,778 | 613,309 | — | 9,066,913 | 10,000,000 | |||||||||||||||
| Lehman Brothers | ||||||||||||||||||||
Repurchase Agreement(5) | 319,778 | 613,309 | — | 9,066,913 | 10,000,000 | |||||||||||||||
| Ocala Funding LLC | ||||||||||||||||||||
| Discount Commercial Paper | 319,778 | 613,309 | — | 9,066,913 | 10,000,000 | |||||||||||||||
| Sashsen Funding | ||||||||||||||||||||
| Discount Commercial Paper | 319,778 | 613,309 | — | 9,066,913 | 10,000,000 | |||||||||||||||
| Concord Minutemen | ||||||||||||||||||||
| Capital Company Interest | ||||||||||||||||||||
| Bearing Commercial Paper | 287,802 | 551,978 | — | 8,160,220 | 9,000,000 | |||||||||||||||
| Morgan Stanley | ||||||||||||||||||||
Repurchase Agreement(6) | 255,823 | 490,647 | — | 7,253,530 | 8,000,000 | |||||||||||||||
| Park Granada LLC | ||||||||||||||||||||
| Discount Commercial Paper | 223,845 | 429,316 | — | 6,346,839 | 7,000,000 | |||||||||||||||
| Thornburg Mortgage Capital | ||||||||||||||||||||
| Discount Commercial Paper | 223,845 | 429,316 | — | 6,346,839 | 7,000,000 | |||||||||||||||
| Concord Minutemen | ||||||||||||||||||||
| Capital Company Interest | ||||||||||||||||||||
| Bearing Commercial Paper | 159,889 | 306,654 | — | 4,533,457 | 5,000,000 | |||||||||||||||
| Laguna ABS Ltd. | ||||||||||||||||||||
| Discount Commercial Paper | 159,889 | 306,654 | — | 4,533,457 | 5,000,000 | |||||||||||||||
| KKR Atlantic Funding Trust | ||||||||||||||||||||
| Discount Commercial Paper | 127,912 | 245,323 | — | 3,626,765 | 4,000,000 | |||||||||||||||
Page 34
Baird Funds, Inc.
Notes to the Financial Statements June 30, 2007 (Unaudited) |
6. | SECURITIES LENDING (cont.) |
LargeCap | MidCap | SmallCap | Other | |||||||||||||||||
Fund | Fund | Fund | Baird Funds | Total | ||||||||||||||||
| Morgan Stanley | ||||||||||||||||||||
Repurchase Agreement(7) | 127,912 | 245,323 | — | 3,626,765 | 4,000,000 | |||||||||||||||
| Rams Funding LLC | ||||||||||||||||||||
| Discount Commercial Paper | 127,912 | 245,323 | — | 3,626,765 | 4,000,000 | |||||||||||||||
| Valcour Bay Capital Co. LLC | ||||||||||||||||||||
| Discount Commercial Paper | 127,912 | 245,323 | — | 3,626,765 | 4,000,000 | |||||||||||||||
| Merrill Lynch Premier | ||||||||||||||||||||
| Institutional Fund | 34,579 | 66,320 | — | 980,444 | 1,081,343 | |||||||||||||||
| Federated Prime | ||||||||||||||||||||
| Obligations Fund | 14,051 | 26,951 | — | 398,438 | 439,440 | |||||||||||||||
| $ | 10,095,119 | $ | 19,361,586 | $ | — | $ | 286,234,078 | $ | 315,690,783 | |||||||||||
| (1) | (Dated 06/29/07), 5.36%, Due 07/02/07 (Repurchase Proceeds $50,029,370), (Collateralized by Mortgage Backed Securities) |
| (2) | (Dated 06/29/07), 5.425%, Due 07/02/07 (Repurchase Proceeds $35,020,808), (Collateralized by Agency Mortgage Backed Securities) |
| (3) | (Dated 06/29/07), 5.44%, Due 07/02/07 (Repurchase Proceeds $32,019,077), (Collateralized by Mortgage Backed Securities) |
| (4) | (Dated 06/29/07), 5.50%, Due 07/02/07 (Repurchase Proceeds $25,015,068), (Collateralized by Mortgage Backed Securities) |
| (5) | (Dated 06/29/07), 5.49%, Due 07/02/07 (Repurchase Proceeds $10,006,016), (Collateralized by Corporate Bonds) |
| (6) | (Dated 06/29/07), 5.44%, Due 07/02/07 (Repurchase Proceeds $8,004,769), (Collateralized by Mortgage Backed Securities) |
| (7) | (Dated 06/29/07), 5.44%, Due 07/02/07 (Repurchase Proceeds $4,002,385), (Collateralized by Mortgage Backed Securities) |
7. | LINE OF CREDIT |
The Corporation maintains an uncommitted, senior secured line of credit (“LOC”) with U.S. Bank, N.A. (the “Bank”) to provide the Funds a temporary liquidity source to meet unanticipated redemptions. Under the terms of the LOC, borrowings for each Fund are limited to one-third of the total assets (including the amount borrowed) of the respective Fund, or as otherwise indicated within the Funds’ agreement with the Bank. The Bank charges interest at the Bank’s Prime Rate less 1% (weighted average rate of 7.25% for the first six months of 2007). For the six months ended June 30, 2007, the Baird LargeCap Fund, Baird MidCap Fund and Baird SmallCap Fund incurred $954, $155, and $226 in interest charges, respectively, on average daily loan balances of $26,182, $1,961 and $6,215, respectively.
8. | DISTRIBUTION AND SHAREHOLDER SERVICE PLAN |
The Funds have adopted a distribution and shareholder service plan (the “Plan”) pursuant to Rule 12b-1 under the 1940 Act. The Plan allows the Funds to compensate the Distributor for the costs incurred in distributing the Funds’ Investor Class Shares, including amounts paid to brokers or dealers, at an annual rate not to exceed 0.25% of the average daily net assets of the Funds’ Investor Class Shares. The Baird LargeCap Fund, Baird MidCap Fund and Baird SmallCap Fund incurred $1,316, $5,672 and $5,978, respectively, in fees pursuant to the Plan during the six months ended June 30, 2007.
Page 35
Additional Information
Proxy Voting
A description of the policies and procedures that the Funds use to determine how to vote proxies relating to portfolio securities is available without charge, upon request, by calling toll free, 1-866-44BAIRD, or by accessing the Funds’ website at www.bairdfunds.com; and by accessing the SEC’s website at www.sec.gov.
Information regarding how each Fund voted proxies relating to portfolio securities during the most recent 12-month period ended June 30 is available without charge, upon request, by calling toll free, 1-866-44BAIRD, or by accessing the Funds’ website at www.bairdfunds.com; and by accessing the SEC’s website at www.sec.gov.
Portfolio Holdings Disclosure
The Funds file a complete schedule of portfolio holdings with the SEC for the first and third quarters of each fiscal year on Form N-Q. The Funds’ Forms N-Q are available on the SEC website at www.sec.gov and may be reviewed and copied at the SEC’s Public Reference Room in Washington, D.C. Information on the operation of the Public Reference Room may be obtained by calling 1-800-732-0330. The Funds’ Forms N-Q may also be obtained by calling toll-free 1-866-44BAIRD.
Page 36
(This Page Intentionally Left Blank.)
Baird Funds, Inc.
c/o U.S. Bancorp Fund Services, LLC
P.O. Box 701
Milwaukee, WI 53201-0701
1-866-44BAIRD
Board of Directors
G. Frederick Kasten, Jr. (Chairman)
John W. Feldt
George C. Kaiser
Frederick P. Stratton, Jr.
Investment Advisor and Distributor
Robert W. Baird & Co. Incorporated
777 East Wisconsin Avenue
Milwaukee, WI 53202
Administrator and Transfer Agent
U.S. Bancorp Fund Services, LLC
P.O. Box 701
615 East Michigan Street
Milwaukee, WI 53202
Custodian
U.S. Bank, N.A.
1555 N. RiverCenter Drive, Suite 302
Milwaukee, WI 53212
Legal Counsel
Godfrey & Kahn, S.C.
780 North Water Street
Milwaukee, WI 53202
Independent Registered Public Accounting Firm
Grant Thornton LLP
175 West Jackson Boulevard, 13th Floor
Chicago, IL 60604
Item 2. Code of Ethics.
Not applicable - only required for annual reports on Form N-CSR.
Item 3. Audit Committee Financial Expert.
Not applicable - only required for annual reports on Form N-CSR.
Item 4. Principal Accountant Fees and Services.
Not applicable - only required for annual reports on Form N-CSR.
Item 5. Audit Committee of Listed Registrants.
Not applicable because the Registrant is not a "listed issuer" within the meaning of Rule 10A-3 under the Securities Exchange Act of 1934.
Item 6. Schedule of Investments.
The Schedules of Investments are included as part of the semi-annual reports to shareholders filed under Item 1 of this Form N-CSR.
Item 7. Disclosure of Proxy Voting Policies and Procedures for Closed-End Management Investment Companies.
Not applicable because the Registrant is not a closed-end management investment company.
Item 8. Portfolio Managers of Closed-End Management Investment Companies.
Not applicable because the Registrant is not a closed-end management investment company.
Item 9. Purchases of Equity Securities by Closed-End Management Investment Company and Affiliated Purchasers.
Not applicable because the Registrant is not a closed-end management investment company.
Item 10. Submission of Matters to a Vote of Security Holders.
There have been no material changes to the procedures by which shareholders may recommend nominees to the Registrant’s board of directors.
Item 11. Controls and Procedures.
| (a) | The Registrant’s management, with the participation of its principal executive and principal financial officers, has evaluated the effectiveness of the Registrant's disclosure controls and procedures (as defined in Rule 30a-3(c) under the Investment Company Act of 1940 (the “Act”)), as of a date within 90 days prior to the filing date of this Form N-CSR. Based on such evaluation, the Registrant's principal executive and principal financial officers have concluded that the design and operation of the Registrant's disclosure controls and procedures are effective in providing reasonable assurance that the information required to be disclosed on Form N-CSR is recorded, processed, summarized and reported within the applicable time period. |
| (b) | There were no changes in the Registrant's internal control over financial reporting (as defined in Rule 30a-3(d) under the Act) that occurred during the second fiscal quarter of the period covered by this report that has materially affected, or is reasonably likely to materially affect, the Registrant's internal control over financial reporting. |
Item 12. Exhibits.
(a) | (1) Any code of ethics or amendment thereto, that is subject of the disclosure required by Item 2, to the extent that the registrant intends to satisfy Item 2 requirements through filing an exhibit. Not Applicable to semi-annual reports. |
(2) Certifications pursuant to Section 302 of the Sarbanes-Oxley Act of 2002. Filed herewith.
(3) Any written solicitation to purchase securities under Rule 23c-1 under the Act sent or given during the period covered by the report by or on behalf of the registrant to 10 or more persons. Not applicable because the Registrant is not a closed-end management investment company.
(b) | Certification pursuant to Section 906 of the Sarbanes-Oxley Act of 2002. Furnished herewith. |
SIGNATURES
Pursuant to the requirements of the Securities Exchange Act of 1934 and the Investment Company Act of 1940, the registrant has duly caused this report to be signed on its behalf by the undersigned, thereunto duly authorized.
BAIRD FUNDS, INC.
By: /s/Mary Ellen Stanek
Mary Ellen Stanek, President
Date: August 28, 2007
Pursuant to the requirements of the Securities Exchange Act of 1934 and the Investment Company Act of 1940, this report has been signed below by the following persons on behalf of the registrant and in the capacities and on the dates indicated.
By: /s/Mary Ellen Stanek
Mary Ellen Stanek, President
Date: August 28, 2007
By: /s/Leonard M. Rush
Leonard M. Rush, Treasurer
Date: August 28, 2007