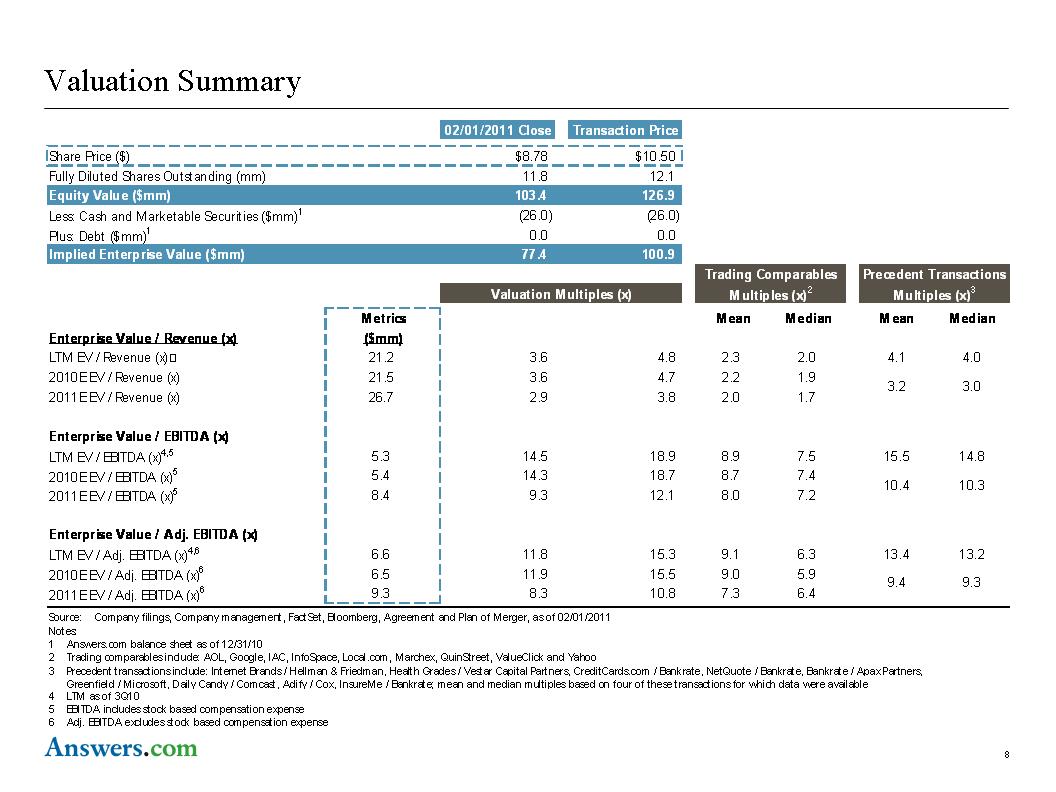
Valuation Summary 02/01/2011 Close Transaction Price Share Price ($) $8.78 $10.50 Fully Diluted Shares Outstanding (mm) 11.8 12.1 Equity Value ($mm) 103.4 126.9 Less: Cash and Marketable Securities ($mm)1 (26.0) (26.0) Plus: Debt ($mm)1 0.0 0.0 Implied Enterprise Value ($mm) 77.4 100.9 Trading Comparables Precedent Transactions Valuation Multiples (x) Multiples (x)2 Multiples (x)3 Median Mean Median 2.0 4.1 4.0 1.9 3.2 3.0 1.7 7.5 15.5 14.8 7.4 10.4 10.3 7.2 6.3 13.4 13.2 5.9 9.4 9.3 6.4 Metrics Mean Enterprise Value / Revenue (x) ($mm) LTM EV / Revenue (x) 21.2 3.6 4.8 2.3 2010E EV / Revenue (x) 21.5 3.6 4.7 2.2 2011E EV / Revenue (x) 26.7 2.9 3.8 2.0 Enterprise Value / EBITDA (x) LTM EV / EBITDA (x)4,5 5.3 14.5 18.9 8.9 2010E EV / EBITDA (x)5 5.4 14.3 18.7 8.7 2011E EV / EBITDA (x)5 8.4 9.3 12.1 8.0 Enterprise Value / Adj. EBITDA (x) LTM EV / Adj. EBITDA (x)4,6 6.6 11.8 15.3 9.1 2010E EV / Adj. EBITDA (x)6 6.5 11.9 15.5 9.0 2011E EV / Adj. EBITDA (x)6 9.3 8.3 10.8 7.3 Source: Company filings, Company management, FactSet, Bloomberg, Agreement and Plan of Merger, as of 02/01/2011 Notes: 1 Answers.com balance sheet as of 12/31/10 2 Trading comparables include: AOL, Google, IAC, InfoSpace, Local.com, Marchex, QuinStreet, ValueClick and Yahoo 3 Precedent transactions include: Internet Brands / Hellman & Friedman, Health Grades / Vestar Capital Partners, CreditCards.com / Bankrate, NetQuote / Bankrate, Bankrate / Apax Partners, Greenfield / Microsoft, Daily Candy / Comcast, Adify / Cox, InsureMe / Bankrate; mean and median multiples based on four of these transactions for which data were available 4 LTM as of 3Q10 5 EBITDA includes stock based compensation expense 6 Adj. EBITDA excludes stock based compensation expense 8 |