Washington, D.C. 20549
Wade R. Bridge, Esq.
Form N-CSR is to be used by management investment companies to file reports with the Commission not later than 10 days after the transmission to stockholders of any report that is required to be transmitted to stockholders under Rule 30e-1 under the Investment Company Act of 1940 (17 CFR 270.30e-1). The Commission may use the information provided on Form N-CSR in its regulatory, disclosure review, inspection, and policymaking roles.
A registrant is required to disclose the information specified by Form N-CSR, and the Commission will make this information public. A registrant is not required to respond to the collection of information contained in Form N-CSR unless the Form displays a currently valid Office of Management and Budget ("OMB") control number. Please direct comments concerning the accuracy of the information collection burden estimate and any suggestions for reducing the burden to the Secretary, Securities and Exchange Commission, 450 Fifth Street, NW, Washington, DC 20549-0609. The OMB has reviewed this collection of information under the clearance requirements of 44 U.S.C. § 3507.
ANNUAL REPORT
October 31, 2016

For more information or assistance in opening an account,
please call toll-free 1-888-534-2001.
LETTER TO SHAREHOLDERS
December 21, 2016
Dear Shareholder,
Enclosed is the Annual Report to shareholders of the TFS Market Neutral Fund (ticker: TFSMX), the TFS Small Cap Fund (ticker: TFSSX) and the TFS Hedged Futures Fund (ticker: TFSHX) for the year ended October 31, 2016. On behalf of the investment manager, TFS Capital LLC, we would like to thank you for your continued investment.
TFS Market Neutral Fund (ticker: TFSMX)
| 1-year
return | 3-year
return | 5-year
return | 10-year
return | Since Inception (9/7/2004) |
TFS Market Neutral Fund | -7.79% | -1.24% | 1.93% | 4.06% | 5.32% |
S&P 500® Index | 4.51% | 8.84% | 13.57% | 6.70% | 7.63% |
Average annual total returns for periods ended October 31, 2016. Past performance is not a guarantee of future results.
For the fiscal year ended October 31, 2016, the TFS Market Neutral Fund produced significant negative alpha versus the S&P 500 Index. In terms of both absolute and relative performance, this was the worst fiscal year in the Fund’s history.
The significant underperformance was mostly limited to our small cap equity holdings, which make up a majority of the portfolio. The Fund saw positive alpha from its holdings in large cap stocks, closed end funds, and volatility futures. These gains provided a small offset to the larger losses in small cap equities.
During October, the final month of our fiscal year, we observed a reversal of the trend we observed over most of the rest of the year. The small cap equity short positions that hurt performance during most of the prior eleven months contributed positively to the portfolio. The Fund’s alpha in October 2016 was the highest it had been in any month since 2009. (The Fund was up 2.83% in October, while both the S&P 500 and Russell 2000 declined.)
Historically, we have observed that periods of the Fund’s underperformance have been typically followed by periods of outperformance. However, past performance is no guarantee of future results and there is no way to predict how long any period of underperformance will continue or whether it will be followed by outperformance.
We have attempted to improve our portfolio optimization methodology to reduce sector exposures in an effort to position the Fund to benefit from a return of alpha. In addition, we have lowered the beta of the portfolio, which means that moves in the equity markets should have less of an impact on the Fund’s performance.
We believe that many of our investment models have been negatively impacted by historically low interest rates. Based on recent performance we believe this is because our models may function more effectively in a market where interest rates are not so extraordinarily low. In our view, this interest rate environment has allowed companies with weak fundamentals access to money to finance their operations even though their business prospects appear challenging. This, in essence, has propped up company valuations and we believe it has skewed the effectiveness of our models in identifying short sale opportunities among companies with weak fundamentals.
1
We are encouraged by the recent increase in the federal-funds target interest rate. However, there can be no assurance that this or further increases, if any, will positively impact the Fund’s performance.
The strategies used in managing TFSMX have resulted in returns that have a relatively low correlation to other asset classes. According to Modern Portfolio Theory, portfolios may benefit by combining non-correlated investments. For your reference, below are the TFS Market Neutral Fund’s correlations to several other asset classes since inception.
Index | Correlation Since Inception |
S&P 500® Index | 0.59 |
Russell 2000® Index | 0.58 |
MSCI EAFE Index | 0.46 |
Barclays U.S. Aggregate Bond Index | -0.16 |
Dow Jones REIT ETF Index | 0.42 |
Dow Jones Commodity Futures | 0.38 |
Since inception, TFSMX has produced positive alpha, with lower volatility and market exposure than the S&P 500® Index. From inception through October 31, 2016, TFSMX has had an average annual return of 5.32%, as compared to S&P 500® Index performance during the same period of 7.63%. During this period, the Fund’s beta was 0.23 vs. the S&P 500. This means that the Fund’s risk exposure to the S&P 500 performed as if 23% of it was allocated to the market. In addition, during this time period, the Fund’s average annual volatility measure was 6.7%, compared to S&P 500® Index volatility of 19.0%.
Given the Fund’s recent poor performance, TFSMX ranked in the 74th and 37th percentile, respectively, for the 3-year and 5-year periods ending October 31, 2016, among funds in the Morningstar Market Neutral category. However, TFSMX performance ranked in the top percentile over the 10-year period ending October 31, 2016, among the funds in that category.1
TFS Small Cap Fund (ticker: TFSSX)
| 1-year
return | 3-year
return | 5-year
return | 10-year
return | Since Inception (3/7/2006) |
TFS Small Cap Fund | 2.46% | 4.09% | 12.86% | 9.82% | 9.97% |
Russell 2000® Index | 4.11% | 4.12% | 11.51% | 5.96% | 6.27% |
Average annual total returns for periods ended October 31, 2016. Past performance is not a guarantee of future results.
TFSSX underperformed its benchmark, the Russell 2000® Index, by 1.65% during the 2016 fiscal year. Most of this underperformance occurred in the first calendar quarter of 2016, when equity volatility increased dramatically; sector exposures during the quarter hurt the Fund’s performance. Due to a new portfolio construction methodology, current sector exposures in the Fund are somewhat closer to the benchmark exposures.
Given its “long-only” mandate, TFSSX is expected to have a high correlation to U.S. small-cap equity market movements with most of the performance deviation attributable to TFS Capital’s equity selection.
2
Despite a year with negative alpha for TFSSX, the Fund’s 10-year track record remains strong. Over the last 10 years, the Fund has generated an average annual return that is 3.86% higher than that of the Russell 2000. TFSSX performance ranked in the top percentile of funds in the Morningstar Small Blend category over the 10-year period ending October 31, 2016.2
TFS Hedged Futures Fund (ticker: TFSHX)
| 1-year
return | 3-year
return | Since Inception (12/29/2011) |
TFS Hedged Futures Fund | 0.28% | 2.23% | 1.67% |
S&P Diversified Trends Indicator | -0.93% | 0.27% | -1.75% |
Bloomberg Commodity Index | -2.89% | -12.15% | -9.81% |
S&P 500 Index | 4.51% | 8.84% | 13.75% |
Average annual total return for the periods ended October 31, 2016. Past performance is not a guarantee of future results.
TFS Hedged Futures Fund had a minimal gain of 0.28% during the fiscal year. However, both its short-term and long-term performance compare favorably to the Diversified Trends Indicator; the Fund is outperforming that benchmark over the 1-year and 3-year return periods, as well as since inception.
The Fund’s performance this year was driven by modestly positive returns from its futures volatility strategies, coupled with generally negative performance from its commodities strategies.
During the month of June, we increased the maximum target exposure of each of the Fund’s strategies. This change will cause an increased exposure to the performance of the underlying strategies, both up and down. The amount of money the Fund has invested will also increase. However, even with this increase in exposure, the recent volatility of the Fund’s daily NAV movements has still been well below the average fund in the managed futures mutual fund category.
TFSHX exhibits low-to-negative correlation to all major asset classes including global equities, fixed income, and commodities. The Fund, which does not employ trend-following strategies, also has a low average correlation to the S&P DTI and other funds in Morningstar’s Managed Futures Category. For your reference, below are the TFS Hedged Futures Fund’s correlations to several other asset classes, and the TFS Market Neutral Fund.
Index | Correlation Since Inception |
S&P Diversified Trends Indicator | -0.05 |
S&P 500® Index | 0.12 |
MSCI EAFE Index | 0.09 |
S&P GSCI Index | -0.05 |
Barclays U.S. Aggregate Bond Index | -0.02 |
TFS Market Neutral Fund (ticker: TFSMX) | 0.20 |
3
As always, we do not recommend allocating a high percentage of one’s assets to any single investment fund managed by TFS Capital given the risks inherent in each product. Rather, we believe that they are best used as a component of a diversified portfolio of investments. If you have any questions regarding the information presented here, please contact us.
Best regards,
Eric Newman |
Kevin Gates |
Richard Gates |
David Hall |
Co-Portfolio Managers |
TFS Capital LLC |
The performance data quoted represents past performance, which is not a guarantee of future results. Current performance may be lower or higher than the performance data quoted. Performance information current through the most recent month-end is available at www.tfscapital.com. The investment return and principal value of an investment in the mutual funds discussed in this report (the “Funds”) will fluctuate so that an investor’s shares, when redeemed, may be worth more or less than their original cost. Fee reductions and/or expense reimbursements by the Adviser have positively impacted the Funds’ performance. Without such reductions and/or reimbursements, performance would have been lower. An investor should consider the investment objectives, risks, charges and expenses of the Funds carefully before investing. To obtain a summary prospectus and/or prospectus, which each contain this and other important information, go to www.TFSCapital.com or call (888) 534-2001. Please read the summary prospectus and/or prospectus carefully before investing. The Funds may not be suitable for all investors. Futures investing is speculative. Each Fund’s current NAV per share is available at www.TFSCapital.com.
1 | Based on Morningstar data for the periods ended 10/31/16. Category % ranking for TFSMX was 74th percentile out of 121 funds for the 3-year period, 37th percentile out of 79 funds for the 5-year period and 1st percentile out of 37 funds for the 10-year period. Past performance is not a guarantee of future results. |
2 | Based on Morningstar data for the periods ended 10/31/16. Category % ranking for TFSSX was 43rd percentile out of 659 funds for the 3-year period, 1st quartile for the 5-year period out of 5760 funds and 1st percentile for the 10-year periodout of 389 funds. Past performance is not a guarantee of future results. |
Investments are placed into Morningstar Categories based on their compositions and portfolio statistics so that investors can make meaningful comparisons. Morningstar Category % Rank is a fund’s total-return percentile rank relative to all funds in the same category. The highest (or most favorable) percentile rank is one and the lowest (or least favorable) percentile rank is 100. The Category % Rank complements the Morningstar Rating, especially for funds in smaller categories because these funds may have received a 3-star rating, but could be in the top half of their category performance.
4
TFS MARKET NEUTRAL FUND
PERFORMANCE INFORMATION (Unaudited) |
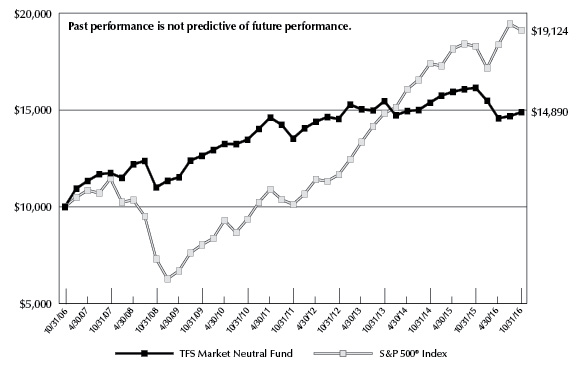
Comparison of the Change in Value of a $10,000 Investment in
TFS Market Neutral Fund versus the S&P 500® Index
Average Annual Total Returns
For the periods ended October 31, 2016 |
| | 1 Year | 5 Years | 10 Years |
TFS Market Neutral Fund(a) | (7.79%) | 1.93% | 4.06% |
S&P 500® Index | 4.51% | 13.57% | 6.70% |
(a) | The total returns shown do not reflect the deduction of taxes a shareholder would pay on Fund distributions or the redemption of Fund shares. |
5
TFS SMALL CAP FUND
PERFORMANCE INFORMATION (Unaudited) |
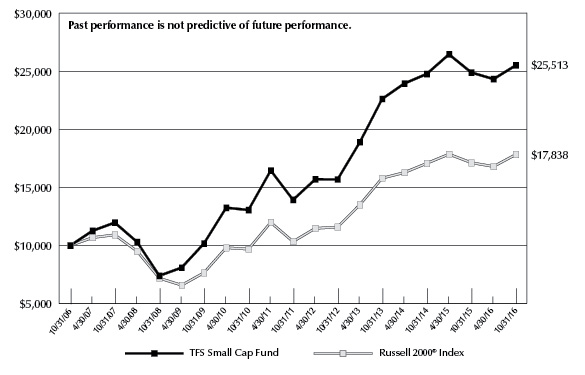
Comparison of the Change in Value of a $10,000 Investment in
TFS Small Cap Fund versus the Russell 2000® Index
Average Annual Total Returns
For the periods ended October 31, 2016 |
| | 1 Year | 5 Years | 10 Years |
TFS Small Cap Fund(a) | 2.46% | 12.86% | 9.82% |
Russell 2000® Index | 4.11% | 11.51% | 5.96% |
(a) | The total returns shown do not reflect the deduction of taxes a shareholder would pay on Fund distributions or the redemption of Fund shares. |
6
TFS HEDGED FUTURES FUND
PERFORMANCE INFORMATION (Unaudited) |
Comparison of the Change in Value of a $10,000 Investment in
TFS Hedged Futures Fund versus the
S&P Diversified Trends Indicator and the S&P 500® Index

Average Annual Total Returns
For the periods ended October 31, 2016 |
| | 1 Year | Since
Inception(b) |
TFS Hedged Futures Fund(a) | 0.28% | 1.67% |
S&P Diversified Trends Indicator | (0.93%) | (1.75%) |
S&P 500® Index | 4.51% | 13.75% |
(a) | The total returns shown do not reflect the deduction of taxes a shareholder would pay on Fund distributions or the redemption of Fund shares. |
(b) | Initial public offering of shares was December 29, 2011. |
7
TFS MARKET NEUTRAL FUND
PORTFOLIO INFORMATION
October 31, 2016 (Unaudited)
Common Stocks vs.
the S&P 500® Index Net Sector Exposure*
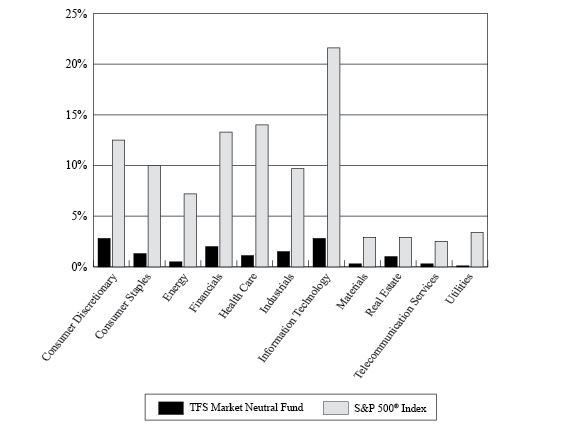
* | The net percentages for TFS Market Neutral Fund are computed by taking the net dollar exposure, including short positions, and dividing by the net assets of the Fund. Consequently, the percentages will not total to 100%. |
Top 10 Long Common Stocks | | Top 10 Short Common Stocks |
Security Description | % of
Net Assets | | Security Description | % of
Net Assets |
Huntsman Corporation | 0.53% | | Square, Inc. - Class A | 0.50% |
Regal Beloit Corporation | 0.53% | | LPL Financial Holdings, Inc. | 0.49% |
Telephone and Data Systems, Inc. | 0.51% | | Tempur Sealy International, Inc. | 0.48% |
Murphy USA, Inc. | 0.51% | | Alnylam Pharmaceuticals, Inc. | 0.47% |
Rackspace Hosting, Inc. | 0.51% | | Fitbit, Inc. - Class A | 0.47% |
Terex Corporation | 0.50% | | Sprouts Farmers Market, Inc. | 0.46% |
Hill-Rom Holdings, Inc. | 0.49% | | Pandora Media, Inc. | 0.46% |
Jabil Circuit, Inc. | 0.49% | | SunPower Corporation | 0.45% |
Alexandria Real Estate Equities, Inc. | 0.49% | | Transocean Ltd. | 0.45% |
Hudson Pacific Properties, Inc. | 0.48% | | GameStop Corporation - Class A | 0.45% |
8
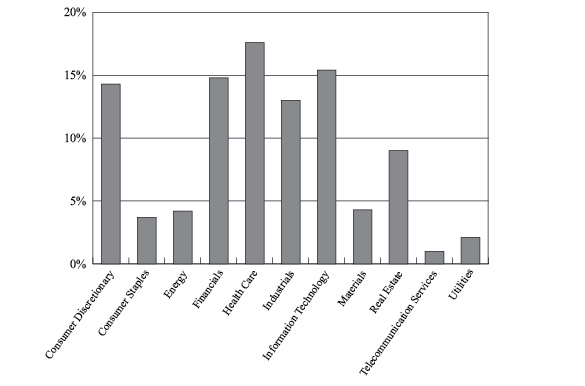
TFS SMALL CAP FUND
PORTFOLIO INFORMATION
October 31, 2016 (Unaudited)
Sector Allocation (% of Net Assets)
Top 10 Equity Positions |
Security Description | % of
Net Assets |
Hudson Pacific Properties, Inc. | 0.81% |
TIER REIT, Inc. | 0.73% |
CBL & Associates Properties, Inc. | 0.68% |
Washington Prime Group, Inc. | 0.66% |
CorEnergy Infrastructure Trust, Inc. | 0.63% |
Government Properties Income Trust | 0.62% |
Ramco-Gershenson Properties Trust | 0.61% |
Washington Real Estate Investment Trust | 0.61% |
Mack-Cali Realty Corporation | 0.60% |
ICU Medical, Inc. | 0.60% |
9
TFS HEDGED FUTURES FUND
PORTFOLIO INFORMATION
October 31, 2016 (Unaudited)
Exposure by Type of Futures Contract
(Notional Value as a % of Net Assets)
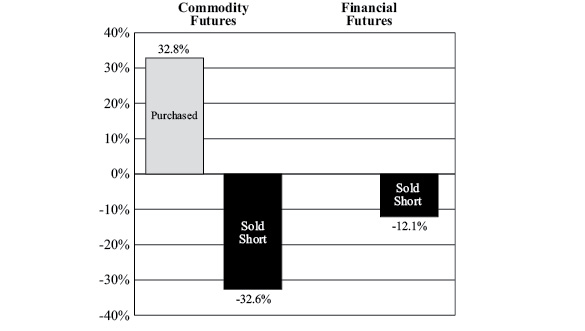
Net Exposure by Type of Futures Contract
(Net as a % of Net Assets) |
Net Commodity Futures Exposure | 0.2% |
Net Financial Futures Exposure | (12.1%) |
10
TFS MARKET NEUTRAL FUND
SUMMARY SCHEDULE OF INVESTMENTS*
October 31, 2016 | |
COMMON STOCKS — 95.0% | | Shares | | | Value | |
Consumer Discretionary — 15.3% | | | | | | |
American Axle & Manufacturing Holdings, Inc. (a) | | | 74,480 | | | $ | 1,334,682 | |
Bloomin' Brands, Inc. | | | 78,158 | | | | 1,352,133 | |
Callaway Golf Company | | | 137,539 | | | | 1,404,273 | |
Capella Education Company | | | 18,748 | | | | 1,370,479 | |
Johnson Outdoors, Inc. - Class A | | | 37,622 | | | | 1,353,640 | |
Liberty TripAdvisor Holdings, Inc. - Series A (a) | | | 65,070 | | | | 1,444,554 | |
MarineMax, Inc. (a) | | | 64,834 | | | | 1,293,438 | |
Murphy USA, Inc. (a) | | | 22,812 | | | | 1,569,009 | |
Office Depot, Inc. | | | 421,572 | | | | 1,327,952 | |
Other Consumer Discretionary (b) | | | | | | | 34,690,898 | |
| | | | | | | | 47,141,058 | |
Consumer Staples — 5.2% | | | | | | | | |
Darling Ingredients, Inc. (a) | | | 102,076 | | | | 1,388,234 | |
Fresh Del Monte Produce, Inc. | | | 22,110 | | | | 1,334,339 | |
Performance Food Group Company (a) | | | 55,084 | | | | 1,322,016 | |
SpartanNash Company | | | 47,329 | | | | 1,325,212 | |
Other Consumer Staples (b) | | | | | | | 10,709,879 | |
| | | | | | | | 16,079,680 | |
Energy — 5.4% | | | | | | | | |
Nabors Industries Ltd. | | | 117,763 | | | | 1,401,380 | |
Other Energy (b) | | | | | | | 15,347,430 | |
| | | | | | | | 16,748,810 | |
Financials — 8.3% | | | | | | | | |
Other Financials (b) | | | | | | | 25,419,268 | |
| | | | | | | | | |
Health Care — 18.6% | | | | | | | | |
BioSpecifics Technologies Corporation (a) | | | 29,948 | | | | 1,299,444 | |
Cantel Medical Corporation | | | 18,545 | | | | 1,320,960 | |
Cepheid (a) | | | 24,944 | | | | 1,319,538 | |
Genomic Health, Inc. (a) | | | 43,404 | | | | 1,293,873 | |
Haemonetics Corporation (a) | | | 38,896 | | | | 1,299,515 | |
Halyard Health, Inc. (a) | | | 40,286 | | | | 1,303,252 | |
Hill-Rom Holdings, Inc. | | | 27,453 | | | | 1,521,171 | |
INC Research Holdings, Inc. - Class A (a) | | | 31,633 | | | | 1,445,628 | |
Kindred Healthcare, Inc. | | | 134,465 | | | | 1,324,480 | |
Orthofix International N.V. (a) | | | 36,146 | | | | 1,324,751 | |
Phibro Animal Health Corporation - Class A | | | 54,659 | | | | 1,418,401 | |
Other Health Care (b) | | | | | | | 42,436,500 | |
| | | | | | | | 57,307,513 | |
Industrials — 11.9% | | | | | | | | |
Encore Wire Corporation | | | 38,495 | | | | 1,314,604 | |
Matson, Inc. | | | 32,457 | | | | 1,296,332 | |
Regal Beloit Corporation | | | 27,507 | | | | 1,625,664 | |
11
TFS MARKET NEUTRAL FUND
SUMMARY SCHEDULE OF INVESTMENTS* (Continued) | |
COMMON STOCKS — 95.0% (Continued) | | Shares | | | Value | |
Industrials — 11.9% (Continued) | | | | | | |
SkyWest, Inc. | | | 44,903 | | | $ | 1,353,825 | |
Terex Corporation | | | 65,199 | | | | 1,556,952 | |
Viad Corporation | | | 35,558 | | | | 1,475,657 | |
Other Industrials (b) | | | | | | | 28,039,018 | |
| | | | | | | | 36,662,052 | |
Information Technology — 16.5% | | | | | | | | |
Eastman Kodak Company (a) | | | 86,572 | | | | 1,289,923 | |
Jabil Circuit, Inc. | | | 70,557 | | | | 1,505,686 | |
Mentor Graphics Corporation | | | 46,316 | | | | 1,338,532 | |
Rackspace Hosting, Inc. (a) | | | 48,912 | | | | 1,562,249 | |
Rudolph Technologies, Inc. (a) | | | 75,048 | | | | 1,358,369 | |
Super Micro Computer, Inc. (a) | | | 58,861 | | | | 1,395,005 | |
Other Information Technology (b) | | | | | | | 42,414,717 | |
| | | | | | | | 50,864,481 | |
Materials — 5.4% | | | | | | | | |
Huntsman Corporation | | | 96,845 | | | | 1,641,523 | |
Other Materials (b) | | | | | | | 15,127,007 | |
| | | | | | | | 16,768,530 | |
Real Estate — 5.4% | | | | | | | | |
Alexandria Real Estate Equities, Inc. | | | 13,918 | | | | 1,500,500 | |
CBL & Associates Properties, Inc. | | | 122,981 | | | | 1,315,897 | |
CorEnergy Infrastructure Trust, Inc. | | | 47,714 | | | | 1,292,095 | |
Corporate Office Properties Trust | | | 53,968 | | | | 1,440,406 | |
Forest City Realty Trust, Inc. - Class A | | | 63,197 | | | | 1,364,423 | |
Hudson Pacific Properties, Inc. | | | 44,143 | | | | 1,484,088 | |
Kilroy Realty Corporation | | | 20,614 | | | | 1,480,704 | |
SL Green Realty Corporation | | | 13,902 | | | | 1,365,454 | |
TIER REIT, Inc. | | | 93,535 | | | | 1,379,641 | |
Other Real Estate (b) | | | | | | | 4,113,771 | |
| | | | | | | | 16,736,979 | |
Telecommunication Services — 1.6% | | | | | | | | |
IDT Corporation - Class B | | | 72,997 | | | | 1,305,916 | |
Telephone and Data Systems, Inc. | | | 61,438 | | | | 1,587,558 | |
Other Telecommunication Services (b) | | | | | | | 1,951,335 | |
| | | | | | | | 4,844,809 | |
Utilities — 1.4% | | | | | | | | |
Talen Energy Corporation (a) | | | 99,892 | | | | 1,391,496 | |
Other Utilities (b) | | | | | | | 2,930,309 | |
| | | | | | | | 4,321,805 | |
| | | | | | | | | |
Total Common Stocks (Cost $289,972,798) | | | | | | $ | 292,894,985 | |
12
TFS MARKET NEUTRAL FUND
SUMMARY SCHEDULE OF INVESTMENTS* (Continued) | |
INVESTMENT COMPANIES — 3.6% | Shares | | Value | |
Other Investment Companies (Cost $11,176,369)(b) | | | $ | 11,134,446 | |
| |
WARRANTS — 0.0% | | Shares | | | Value | |
Imperial Holdings, Inc. (d) (Cost $0) | | | 1,663 | | | $ | 0 | |
| |
MONEY MARKET FUNDS — 1.5% | | Shares | | | Value | |
Federated Government Obligations Fund - Institutional Class, 0.27% (e) (Cost $4,653,154) | | | 4,653,154 | | | $ | 4,653,154 | |
| | | | | | | | | |
Total Investments at Value — 100.1% (Cost $305,802,321) | | | | | | $ | 308,682,585 | |
| | | | | | | | | |
Liabilities in Excess of Other Assets — (0.1%) (f) | | | | | | | (259,608 | ) |
| | | | | | | | | |
Net Assets — 100.0% | | | | | | $ | 308,422,977 | |
| * | A complete Schedule of Investments is available without charge upon request by calling toll-free 1-888-534-2001 or on the SEC’s website at http://www.sec.gov. |
| (a) | Non-income producing security. |
| (b) | Represents issuers not identified as either a top 50 holding in terms of value and issues or issuers not exceeding 1% of net assets individually or in the aggregate, respectively, or not a fair-valued security as of October 31, 2016. |
| (c) | Percentage rounds to less than 0.1%. |
| (d) | Security has been valued at fair value pursuant to procedures adopted by and under the supervision of the Board of Trustees. The total value of such securities is $0 at October 31, 2016 representing 0.0% of net assets (Note 2). |
| (e) | The rate shown is the 7-day effective yield as of October 31, 2016. |
| (f) | Includes cash held as margin deposits for open short positions. |
See accompanying notes to financial statements.
13
TFS MARKET NEUTRAL FUND
SCHEDULE OF SECURITIES SOLD SHORT
October 31, 2016 | |
COMMON STOCKS — 81.3% | | Shares | | | Value | |
Consumer Discretionary — 12.5% | | | | | | |
Auto Components — 0.4% | | | | | | |
Ballard Power Systems, Inc. | | | 73,593 | | | $ | 144,978 | |
China XD Plastics Company Ltd. | | | 13 | | | | 57 | |
Clean Diesel Technologies, Inc. | | | 595 | | | | 1,660 | |
Motorcar Parts of America, Inc. | | | 39,827 | | | | 1,045,060 | |
Spartan Motors, Inc. | | | 56 | | | | 479 | |
Strattec Security Corporation | | | 109 | | | | 3,869 | |
Unique Fabricating, Inc. | | | 16 | | | | 200 | |
| | | | | | | | 1,196,303 | |
Automobiles — 0.6% | | | | | | | | |
Harley-Davidson, Inc. | | | 858 | | | | 48,923 | |
Kandi Technologies Group, Inc. | | | 241,586 | | | | 1,207,930 | |
Tesla Motors, Inc. | | | 2,100 | | | | 415,233 | |
Workhorse Group, Inc. | | | 22,846 | | | | 151,697 | |
| | | | | | | | 1,823,783 | |
Distributors — 0.0% (a) | | | | | | | | |
Educational Development Corporation | | | 270 | | | | 2,524 | |
Fenix Parts, Inc. | | | 967 | | | | 3,307 | |
VOXX International Corporation | | | 21,681 | | | | 88,892 | |
Weyco Group, Inc. | | | 76 | | | | 1,924 | |
| | | | | | | | 96,647 | |
Diversified Consumer Services — 0.6% | | | | | | | | |
2U, Inc. | | | 3,705 | | | | 129,156 | |
Carriage Services, Inc. | | | 2,341 | | | | 55,341 | |
DeVry Education Group, Inc. | | | 2,077 | | | | 47,148 | |
H&R Block, Inc. | | | 15,371 | | | | 353,072 | |
Matthews International Corporation - Class A | | | 449 | | | | 26,895 | |
Sotheby's | | | 365 | | | | 13,096 | |
Universal Technical Institute, Inc. | | | 2,672 | | | | 4,062 | |
Weight Watchers International, Inc. | | | 124,890 | | | | 1,283,869 | |
| | | | | | | | 1,912,639 | |
Hotels, Restaurants & Leisure — 2.0% | | | | | | | | |
Amaya, Inc. | | | 81,612 | | | | 1,097,681 | |
Caesars Entertainment Corporation | | | 9,585 | | | | 68,053 | |
Chipotle Mexican Grill, Inc. | | | 1,048 | | | | 378,076 | |
Chuy's Holdings, Inc. | | | 189 | | | | 5,368 | |
Dave & Buster's Entertainment, Inc. | | | 127 | | | | 5,251 | |
Dunkin' Brands Group, Inc. | | | 6,840 | | | | 330,782 | |
El Pollo Loco Holdings, Inc. | | | 334 | | | | 4,075 | |
Gaming Partners International Corporation | | | 1,202 | | | | 12,489 | |
Intrawest Resorts Holdings, Inc. | | | 9,233 | | | | 151,514 | |
J. Alexander's Holdings, Inc. | | | 1,204 | | | | 10,836 | |
Jamba, Inc. | | | 12,830 | | | | 135,357 | |
14
TFS MARKET NEUTRAL FUND
SCHEDULE OF SECURITIES SOLD SHORT (Continued) | |
COMMON STOCKS — 81.3% (Continued) | | Shares | | | Value | |
Consumer Discretionary — 12.5% (Continued) | | | | | | |
Hotels, Restaurants & Leisure — 2.0% (Continued) | | | | | | |
Kona Grill, Inc. | | | 727 | | | $ | 7,815 | |
Lindblad Expeditions Holdings, Inc. | | | 11,450 | | | | 93,776 | |
Noodles & Company | | | 8,353 | | | | 39,259 | |
Papa Murphy's Holdings, Inc. | | | 9,298 | | | | 51,697 | |
Peak Resorts, Inc. | | | 1,758 | | | | 8,526 | |
Popeyes Louisiana Kitchen, Inc. | | | 28 | | | | 1,495 | |
Rave Restaurant Group, Inc. | | | 41 | | | | 114 | |
RCI Hospitality Holdings, Inc. | | | 323 | | | | 3,750 | |
Ruby Tuesday, Inc. | | | 5,503 | | | | 16,344 | |
Scientific Games Corporation - Class A | | | 1,222 | | | | 15,153 | |
SeaWorld Entertainment, Inc. | | | 1,814 | | | | 25,414 | |
Shake Shack, Inc. - Class A | | | 34,319 | | | | 1,094,433 | |
Sonic Corporation | | | 46,205 | | | | 1,058,557 | |
Town Sports International Holdings, Inc. | | | 11,626 | | | | 29,065 | |
Wynn Resorts Ltd. | | | 4,097 | | | | 387,371 | |
Zoe's Kitchen, Inc. | | | 48,885 | | | | 1,108,223 | |
| | | | | | | | 6,140,474 | |
Household Durables — 1.5% | | | | | | | | |
CSS Industries, Inc. | | | 100 | | | | 2,510 | |
Ethan Allen Interiors, Inc. | | | 171 | | | | 5,250 | |
Garmin Ltd. | | | 8,584 | | | | 415,122 | |
GoPro, Inc. - Class A | | | 12,570 | | | | 160,645 | |
Green Brick Partners, Inc. | | | 70 | | | | 535 | |
iRobot Corporation | | | 2,131 | | | | 108,042 | |
LGI Homes, Inc. | | | 176 | | | | 5,238 | |
MDC Holdings, Inc. | | | 722 | | | | 17,119 | |
New Home Company, Inc. (The) | | | 5,158 | | | | 51,683 | |
Nova Lifestyle, Inc. | | | 28,302 | | | | 101,887 | |
Skyline Corporation | | | 1,329 | | | | 15,376 | |
SodaStream International Ltd. | | | 110 | | | | 2,847 | |
Tempur Sealy International, Inc. | | | 27,551 | | | | 1,489,683 | |
Turtle Beach Corporation | | | 82,462 | | | | 112,973 | |
UCP, Inc. | | | 427 | | | | 3,886 | |
Vuzix Corporation | | | 134,999 | | | | 985,493 | |
WCI Communities, Inc. | | | 10,730 | | | | 248,399 | |
William Lyon Homes - Class A | | | 3,628 | | | | 64,796 | |
ZAGG, Inc. | | | 145,551 | | | | 946,081 | |
| | | | | | | | 4,737,565 | |
Internet & Direct Marketing Retail — 1.0% | | | | | | | | |
Blue Nile, Inc. | | | 149 | | | | 5,205 | |
Gaia, Inc. | | | 4,613 | | | | 34,136 | |
Lands' End, Inc. | | | 80,108 | | | | 1,249,685 | |
MakeMyTrip Ltd. | | | 37,239 | | | | 1,057,588 | |
15
TFS MARKET NEUTRAL FUND
SCHEDULE OF SECURITIES SOLD SHORT (Continued) | |
COMMON STOCKS — 81.3% (Continued) | | Shares | | | Value | |
Consumer Discretionary — 12.5% (Continued) | | | | | | |
Internet & Direct Marketing Retail — 1.0% (Continued) | | | | | | |
Netflix, Inc. | | | 3,359 | | | $ | 419,438 | |
PetMed Express, Inc. | | | 9,438 | | | | 187,533 | |
U.S. Auto Parts Network, Inc. | | | 60 | | | | 184 | |
| | | | | | | | 2,953,769 | |
Leisure Products — 0.3% | | | | | | | | |
Arctic Cat, Inc. | | | 1,666 | | | | 24,973 | |
Escalade, Inc. | | | 10,240 | | | | 124,416 | |
JAKKS Pacific, Inc. | | | 26,941 | | | | 180,505 | |
Marine Products Corporation | | | 3,093 | | | | 28,919 | |
Mattel, Inc. | | | 102 | | | | 3,216 | |
Performance Sports Group Ltd. | | | 137,677 | | | | 479,116 | |
Polaris Industries, Inc. | | | 321 | | | | 24,592 | |
Smith & Wesson Holding Corporation | | | 604 | | | | 15,964 | |
| | | | | | | | 881,701 | |
Media — 1.2% | | | | | | | | |
AMC Entertainment Holdings, Inc. - Class A | | | 61 | | | | 1,918 | |
Central European Media Enterprises Ltd. - Class A | | | 33,135 | | | | 81,181 | |
Cinemark Holdings, Inc. | | | 97 | | | | 3,861 | |
Clear Channel Outdoor Holdings, Inc. - Class A | | | 51 | | | | 293 | |
E.W. Scripps Company (The) - Class A | | | 230 | | | | 3,050 | |
Entercom Communications Corporation - Class A | | | 2,707 | | | | 35,732 | |
Eros International plc | | | 5,701 | | | | 101,193 | |
Global Eagle Entertainment, Inc. | | | 4,803 | | | | 38,664 | |
Lee Enterprises, Inc. | | | 14,607 | | | | 37,248 | |
Liberty Broadband - Series C | | | 74 | | | | 4,932 | |
MDC Partners, Inc. - Class A | | | 106,830 | | | | 902,714 | |
New Media Investment Group, Inc. | | | 460 | | | | 6,624 | |
Nexstar Broadcasting Group, Inc. - Class A | | | 1,028 | | | | 50,166 | |
Pandora Media, Inc. | | | 125,883 | | | | 1,426,254 | |
Radio One, Inc. - Class D | | | 22,357 | | | | 55,893 | |
Reading International, Inc. | | | 1,935 | | | | 25,523 | |
Regal Entertainment Group - Class A | | | 18,567 | | | | 399,376 | |
Saga Communications, Inc. - Class A | | | 91 | | | | 3,822 | |
Scripps Networks Interactive, Inc. - Class A | | | 5,611 | | | | 361,124 | |
Starz - Series A | | | 111 | | | | 3,492 | |
| | | | | | | | 3,543,060 | |
Multiline Retail — 0.5% | | | | | | | | |
Bon-Ton Stores, Inc. (The) | | | 508 | | | | 701 | |
Dillard's, Inc. - Class A | | | 27 | | | | 1,655 | |
Fred's, Inc. - Class A | | | 68,472 | | | | 625,149 | |
J. C. Penney Company, Inc. | | | 37,716 | | | | 323,981 | |
Nordstrom, Inc. | | | 6,496 | | | | 337,792 | |
Ollie's Bargain Outlet Holdings, Inc. | | | 193 | | | | 5,279 | |
16
TFS MARKET NEUTRAL FUND
SCHEDULE OF SECURITIES SOLD SHORT (Continued) | |
COMMON STOCKS — 81.3% (Continued) | | Shares | | | Value | |
Consumer Discretionary — 12.5% (Continued) | | | | | | |
Multiline Retail — 0.5% (Continued) | | | | | | |
Sears Holdings Corporation | | | 16,611 | | | $ | 184,548 | |
| | | | | | | | 1,479,105 | |
Specialty Retail — 3.5% | | | | | | | | |
Abercrombie & Fitch Company - Class A | | | 2,138 | | | | 31,236 | |
America's Car-Mart, Inc. | | | 16,482 | | | | 673,290 | |
Ascena Retail Group, Inc. | | | 8,959 | | | | 43,810 | |
Birks Group, Inc. | | | 2,252 | | | | 3,063 | |
Boot Barn Holdings, Inc. | | | 85,755 | | | | 1,097,664 | |
Buckle, Inc. (The) | | | 26,613 | | | | 554,881 | |
Build-A-Bear Workshop, Inc. | | | 34,996 | | | | 472,446 | |
Cabela's, Inc. | | | 530 | | | | 32,653 | |
Chico's FAS, Inc. | | | 984 | | | | 11,483 | |
China Auto Logistics, Inc. | | | 1,509 | | | | 4,391 | |
Christopher & Banks Corporation | | | 432 | | | | 553 | |
Conn's, Inc. | | | 56,156 | | | | 533,482 | |
DavidsTea, Inc. | | | 3,429 | | | | 36,176 | |
Dick's Sporting Goods, Inc. | | | 37 | | | | 2,059 | |
Express, Inc. | | | 2,630 | | | | 31,613 | |
Finish Line, Inc. (The) - Class A | | | 216 | | | | 4,253 | |
Five Below, Inc. | | | 290 | | | | 10,898 | |
Foot Locker, Inc. | | | 5,151 | | | | 343,932 | |
GameStop Corporation - Class A | | | 57,181 | | | | 1,375,203 | |
GNC Acquisition Holdings, Inc. - Class A | | | 49,538 | | | | 665,295 | |
Guess?, Inc. | | | 2,432 | | | | 32,832 | |
Haverty Furniture Companies, Inc. | | | 244 | | | | 4,331 | |
hhgregg, Inc. | | | 920 | | | | 1,564 | |
Hibbett Sports, Inc. | | | 2,258 | | | | 87,723 | |
Lithia Motors, Inc. - Class A | | | 2 | | | | 172 | |
Lumber Liquidators Holdings, Inc. | | | 46,948 | | | | 728,163 | |
Monro Muffler Brake, Inc. | | | 18,595 | | | | 1,022,725 | |
Pier 1 Imports, Inc. | | | 5,283 | | | | 22,770 | |
Rent-A-Center, Inc. | | | 53,872 | | | | 543,568 | |
Restoration Hardware Holdings, Inc. | | | 38,416 | | | | 1,112,912 | |
Sears Hometown and Outlet Stores, Inc. | | | 21,312 | | | | 103,363 | |
Select Comfort Corporation | | | 563 | | | | 10,804 | |
Signet Jewelers Ltd. | | | 5,237 | | | | 425,559 | |
Sonic Automotive, Inc. - Class A | | | 289 | | | | 5,173 | |
Stein Mart, Inc. | | | 3,224 | | | | 19,408 | |
Tailored Brands, Inc. | | | 1,615 | | | | 25,517 | |
Tiffany & Company | | | 5,791 | | | | 425,175 | |
Ulta Salon Cosmetics & Fragrance, Inc. | | | 1,437 | | | | 349,680 | |
Vitamin Shoppe, Inc. | | | 2,193 | | | | 54,935 | |
Winmark Corporation | | | 34 | | | | 3,636 | |
17
TFS MARKET NEUTRAL FUND
SCHEDULE OF SECURITIES SOLD SHORT (Continued) | |
COMMON STOCKS — 81.3% (Continued) | | Shares | | | Value | |
Consumer Discretionary — 12.5% (Continued) | | | | | | |
Specialty Retail — 3.5% (Continued) | | | | | | |
Zumiez, Inc. | | | 58 | | | $ | 1,291 | |
| | | | | | | | 10,909,682 | |
Textiles, Apparel & Luxury Goods — 0.9% | | | | | | | | |
Delta Apparel, Inc. | | | 107 | | | | 1,766 | |
Differential Brands Group, Inc. | | | 1,187 | | | | 4,986 | |
Fossil Group, Inc. | | | 193 | | | | 5,263 | |
G-III Apparel Group Ltd. | | | 1,024 | | | | 26,747 | |
Iconix Brand Group, Inc. | | | 114,375 | | | | 901,275 | |
Kingold Jewelry, Inc. | | | 61,588 | | | | 121,328 | |
NIKE, Inc. - Class B | | | 6,727 | | | | 337,561 | |
Sequential Brands Group, Inc. | | | 143,212 | | | | 1,031,126 | |
Skechers U.S.A., Inc. - Class A | | | 302 | | | | 6,351 | |
Under Armour, Inc. - Class A | | | 12,922 | | | | 401,874 | |
| | | | | | | | 2,838,277 | |
Consumer Staples — 3.9% | | | | | | | | |
Beverages — 0.2% | | | | | | | | |
Brown-Forman Corporation - Class B | | | 7,499 | | | | 346,229 | |
Craft Brewers Alliance, Inc. | | | 1,577 | | | | 25,311 | |
MGP Ingredients, Inc. | | | 6,843 | | | | 240,942 | |
National Beverage Corporation | | | 514 | | | | 24,281 | |
| | | | | | | | 636,763 | |
Food & Staples Retailing — 1.1% | | | | | | | | |
Chefs' Warehouse, Inc. (The) | | | 19,152 | | | | 218,333 | |
Diplomat Pharmacy, Inc. | | | 55 | | | | 1,274 | |
Natural Grocers by Vitamin Cottage, Inc. | | | 88,416 | | | | 1,050,382 | |
Rite Aid Corporation | | | 60,628 | | | | 406,814 | |
Sprouts Farmers Market, Inc. | | | 64,541 | | | | 1,429,583 | |
SUPERVALU, Inc. | | | 3,303 | | | | 14,170 | |
Whole Foods Market, Inc. | | | 11,960 | | | | 338,349 | |
| | | | | | | | 3,458,905 | |
Food Products — 1.7% | | | | | | | | |
Alico, Inc. | | | 121 | | | | 3,164 | |
Amira Nature Foods Ltd. | | | 23,724 | | | | 185,996 | |
Amplify Snack Brands, Inc. | | | 354 | | | | 5,129 | |
Arcadia Biosciences, Inc. | | | 3,306 | | | | 5,356 | |
Blue Buffalo Pet Products, Inc. | | | 180 | | | | 4,522 | |
Cal-Maine Foods, Inc. | | | 32,938 | | | | 1,273,054 | |
Campbell Soup Company | | | 43 | | | | 2,337 | |
Dean Foods Company | | | 3,345 | | | | 61,080 | |
Flowers Foods, Inc. | | | 27,279 | | | | 423,370 | |
Freshpet, Inc. | | | 125,602 | | | | 1,067,617 | |
Hormel Foods Corporation | | | 11,175 | | | | 430,238 | |
Inventure Foods, Inc. | | | 3,018 | | | | 25,532 | |
18
TFS MARKET NEUTRAL FUND
SCHEDULE OF SECURITIES SOLD SHORT (Continued) | |
COMMON STOCKS — 81.3% (Continued) | | Shares | | | Value | |
Consumer Staples — 3.9% (Continued) | | | | | | |
Food Products — 1.7% (Continued) | | | | | | |
John B. Sanfilippo & Son, Inc. | | | 8 | | | $ | 405 | |
Lifeway Foods, Inc. | | | 2,698 | | | | 48,240 | |
Limoneira Company | | | 241 | | | | 4,745 | |
Origin Agritech Ltd. | | | 4,703 | | | | 11,993 | |
Pilgrim's Pride Corporation | | | 16,580 | | | | 362,107 | |
Skypeople Fruit Juice, Inc. | | | 16,432 | | | | 104,672 | |
Sunopta, Inc. | | | 155,302 | | | | 1,032,758 | |
Tootsie Roll Industries, Inc. | | | 670 | | | | 23,751 | |
Tyson Foods, Inc. - Class A | | | 2,155 | | | | 152,682 | |
| | | | | | | | 5,228,748 | |
Household Products — 0.1% | | | | | | | | |
HRG Group, Inc. | | | 305 | | | | 4,587 | |
Orchids Paper Products Company | | | 4,642 | | | | 119,114 | |
| | | | | | | | 123,701 | |
Personal Products — 0.8% | | | | | | | | |
22nd Century Group, Inc. | | | 103,994 | | | | 134,152 | |
China-Biotics, Inc. (b) | | | 535,616 | | | | 0 | |
Herbalife Ltd. | | | 5,542 | | | | 336,289 | |
LifeVantage Corporation | | | 81,412 | | | | 667,578 | |
Natural Health Trends Corporation | | | 48,970 | | | | 1,142,470 | |
Synutra International, Inc. | | | 10,471 | | | | 40,837 | |
United-Guardian, Inc. | | | 3,272 | | | | 51,043 | |
| | | | | | | | 2,372,369 | |
Tobacco — 0.0% (a) | | | | | | | | |
Universal Corporation | | | 1,261 | | | | 68,346 | |
| | | | | | | | | |
Energy — 4.9% | | | | | | | | |
Energy Equipment & Services — 1.8% | | | | | | | | |
Aspen Aerogels, Inc. | | | 12,655 | | | | 78,081 | |
Atwood Oceanics, Inc. | | | 4,513 | | | | 34,434 | |
Bristow Group, Inc. | | | 64,675 | | | | 647,397 | |
CARBO Ceramics, Inc. | | | 1,728 | | | | 10,541 | |
Dawson Geophysical Company | | | 384 | | | | 2,515 | |
Diamond Offshore Drilling, Inc. | | | 1,745 | | | | 28,775 | |
Dril-Quip, Inc. | | | 50 | | | | 2,375 | |
Frank's International N.V. | | | 68,097 | | | | 766,091 | |
Geospace Technologies Corporation | | | 4,130 | | | | 76,116 | |
Helmerich & Payne, Inc. | | | 5,365 | | | | 338,585 | |
Hornbeck Offshore Services, Inc. | | | 177,896 | | | | 706,247 | |
Ion Geophysical Corporation | | | 18,897 | | | | 111,492 | |
National Oilwell Varco, Inc. | | | 8,992 | | | | 288,643 | |
Noble Corporation plc | | | 6,474 | | | | 31,982 | |
Nordic American Offshore Ltd. | | | 24,894 | | | | 82,150 | |
19
TFS MARKET NEUTRAL FUND
SCHEDULE OF SECURITIES SOLD SHORT (Continued) | |
COMMON STOCKS — 81.3% (Continued) | | Shares | | | Value | |
Energy — 4.9% (Continued) | | | | | | |
Energy Equipment & Services — 1.8% (Continued) | | | | | | |
Ocean Rig UDW, Inc. | | | 120,700 | | | $ | 127,942 | |
Oil States International, Inc. | | | 20 | | | | 585 | |
Pioneer Energy Services Corporation | | | 3,999 | | | | 14,197 | |
RPC, Inc. | | | 20,655 | | | | 356,712 | |
SAExploration Holdings, Inc. | | | 14,583 | | | | 119,726 | |
SEACOR Holdings, Inc. | | | 454 | | | | 22,387 | |
Seadrill Ltd. | | | 86,205 | | | | 183,617 | |
Tesco Corporation | | | 3,704 | | | | 25,372 | |
Tidewater, Inc. | | | 82,802 | | | | 143,248 | |
Transocean Ltd. | | | 144,107 | | | | 1,384,868 | |
| | | | | | | | 5,584,078 | |
Oil, Gas & Consumable Fuels — 3.1% | | | | | | | | |
Amyris, Inc. | | | 92,733 | | | | 95,515 | |
Approach Resources, Inc. | | | 273,846 | | | | 780,461 | |
Ardmore Shipping Corporation | | | 83 | | | | 485 | |
Bonanza Creek Energy, Inc. | | | 221,429 | | | | 207,523 | |
California Resources Corporation | | | 95,333 | | | | 978,117 | |
Centrus Energy Corporation - Class A | | | 375 | | | | 1,466 | |
Chesapeake Energy Corporation | | | 54,739 | | | | 301,612 | |
Clayton Williams Energy, Inc. | | | 323 | | | | 28,201 | |
Clean Energy Fuels Corporation | | | 6,226 | | | | 25,589 | |
Cobalt International Energy, Inc. | | | 131,850 | | | | 124,480 | |
Comstock Resources, Inc. | | | 122,392 | | | | 1,194,546 | |
CONSOL Energy, Inc. | | | 21,819 | | | | 369,832 | |
Denbury Resources, Inc. | | | 111,908 | | | | 267,460 | |
Dorian LPG Ltd. | | | 12,278 | | | | 69,125 | |
Earthstone Energy, Inc. | | | 6,158 | | | | 52,528 | |
EnLink Midstream, LLC | | | 164 | | | | 2,501 | |
EP Energy Corporation - Class A | | | 4,403 | | | | 15,675 | |
Evolution Petroleum Corporation | | | 426 | | | | 3,280 | |
EXCO Resources, Inc. | | | 7,410 | | | | 8,003 | |
Frontline Ltd. | | | 123,286 | | | | 883,961 | |
Gastar Exploration, Inc. | | | 23,349 | | | | 25,217 | |
Golar LNG Ltd. | | | 218 | | | | 4,772 | |
Jones Energy, Inc. - Class A | | | 10,502 | | | | 43,058 | |
Kosmos Energy Ltd. | | | 57,756 | | | | 300,909 | |
Lucas Energy, Inc. | | | 50,312 | | | | 63,896 | |
Magellan Petroleum Corporation | | | 11,349 | | | | 56,404 | |
Matador Resources Company | | | 227 | | | | 4,951 | |
Navios Maritime Acquisition Corporation | | | 5,017 | | | | 6,372 | |
New Concept Energy, Inc. | | | 46,273 | | | | 89,307 | |
Nordic American Tankers Ltd. | | | 137,380 | | | | 1,122,395 | |
Northern Oil & Gas, Inc. | | | 489,762 | | | | 1,028,500 | |
20
TFS MARKET NEUTRAL FUND
SCHEDULE OF SECURITIES SOLD SHORT (Continued) | |
COMMON STOCKS — 81.3% (Continued) | | Shares | | | Value | |
Energy — 4.9% (Continued) | | | | | | |
Oil, Gas & Consumable Fuels — 3.1% (Continued) | | | | | | |
Panhandle Oil & Gas, Inc. - Class A | | | 493 | | | $ | 8,874 | |
Parsley Energy, Inc. - Class A | | | 12,098 | | | | 398,024 | |
PBF Energy, Inc. - Class A | | | 987 | | | | 21,517 | |
Range Resources Corporation | | | 4,881 | | | | 164,929 | |
Renewable Energy Group, Inc. | | | 10,280 | | | | 89,950 | |
Resolute Energy Corporation | | | 547 | | | | 14,167 | |
Sanchez Energy Corporation | | | 146 | | | | 930 | |
Ship Finance International Ltd. | | | 682 | | | | 8,627 | |
Stone Energy Corporation | | | 23,764 | | | | 98,858 | |
Synergy Resources Corporation | | | 708 | | | | 4,843 | |
Uranium Resources, Inc. | | | 317 | | | | 403 | |
W&T Offshore, Inc. | | | 102,221 | | | | 148,220 | |
Westmoreland Coal Company | | | 1,942 | | | | 17,245 | |
Whiting Petroleum Corporation | | | 46,716 | | | | 384,940 | |
WPX Energy, Inc. | | | 1,091 | | | | 11,848 | |
| | | | | | | | 9,529,516 | |
Financials — 6.3% | | | | | | | | |
Banks — 1.9% | | | | | | | | |
American River Bankshares | | | 68 | | | | 832 | |
Ameris Bancorp | | | 77 | | | | 2,795 | |
Ames National Corporation | | | 77 | | | | 2,087 | |
Associated Banc-Corp | | | 67 | | | | 1,360 | |
Bancorp of New Jersey, Inc. | | | 568 | | | | 6,418 | |
Bank of Marin Bancorp | | | 30 | | | | 1,523 | |
Bay Bancorp, Inc. | | | 451 | | | | 2,413 | |
BCB Bancorp, Inc. | | | 1,283 | | | | 15,139 | |
Blue Hills Bancorp, Inc. | | | 78 | | | | 1,213 | |
BOK Financial Corporation | | | 5,994 | | | | 425,694 | |
Boston Private Financial Holdings, Inc. | | | 2 | | | | 26 | |
Bridge Bancorp, Inc. | | | 185 | | | | 5,097 | |
Capital Bank Financial Corporation - Class A | | | 848 | | | | 27,772 | |
Carolina Bank Holdings, Inc. | | | 68 | | | | 1,359 | |
Carolina Financial Corporation | | | 52 | | | | 1,186 | |
City Holding Company | | | 713 | | | | 37,269 | |
Civista Bancshares, Inc. | | | 41 | | | | 604 | |
CoBiz Financial, Inc. | | | 293 | | | | 3,727 | |
Commerce Union Bancshares, Inc. | | | 48 | | | | 973 | |
Community Bank System, Inc. | | | 18,197 | | | | 857,261 | |
CVB Financial Corporation | | | 2,592 | | | | 43,494 | |
Enterprise Bancorp, Inc. | | | 18 | | | | 470 | |
Enterprise Financial Services Corporation | | | 43 | | | | 1,423 | |
First Bancorp (North Carolina) | | | 5,502 | | | | 108,775 | |
First Financial Bankshares, Inc. | | | 31,862 | | | | 1,153,404 | |
21
TFS MARKET NEUTRAL FUND
SCHEDULE OF SECURITIES SOLD SHORT (Continued) | |
COMMON STOCKS — 81.3% (Continued) | | Shares | | | Value | |
Financials — 6.3% (Continued) | | | | | | |
Banks — 1.9% (Continued) | | | | | | |
First Horizon National Corporation | | | 650 | | | $ | 10,017 | |
First Internet Bancorp | | | 139 | | | | 3,649 | |
First Interstate BancSystem, Inc. - Class A | | | 23 | | | | 734 | |
First Merchants Corporation | | | 109 | | | | 3,068 | |
First NBC Bank Holding Company | | | 121,271 | | | | 654,863 | |
FNB Corporation | | | 389 | | | | 5,084 | |
Glacier Bancorp, Inc. | | | 182 | | | | 5,143 | |
Hancock Holding Company | | | 225 | | | | 7,549 | |
Heritage Oaks Bancorp | | | 31 | | | | 246 | |
Hope Bancorp, Inc. | | | 8,338 | | | | 134,575 | |
LegacyTexas Financial Group, Inc. | | | 24 | | | | 821 | |
Mackinac Financial Corporation | | | 297 | | | | 3,433 | |
MainSource Financial Group, Inc. | | | 16 | | | | 399 | |
Merchants Bancshares, Inc. | | | 63 | | | | 2,709 | |
MidSouth Bancorp, Inc. | | | 11,727 | | | | 120,202 | |
MidWestOne Financial Group, Inc. | | | 27 | | | | 785 | |
National Bankshares, Inc. | | | 354 | | | | 12,302 | |
OFG Bancorp | | | 2,351 | | | | 25,038 | |
Old National Bancorp | | | 356 | | | | 5,233 | |
Opus Bank | | | 51,843 | | | | 1,039,452 | |
Pacific Mercantile Bancorp | | | 2,518 | | | | 14,101 | |
Park National Corporation | | | 2,740 | | | | 265,588 | |
Penns Woods Bancorp, Inc. | | | 2,173 | | | | 92,353 | |
Peoples Financial Services Corporation | | | 2,318 | | | | 92,349 | |
People's Utah Bancorp | | | 94 | | | | 1,885 | |
Republic First Bancorp, Inc. | | | 2,924 | | | | 11,550 | |
S&T Bancorp, Inc. | | | 118 | | | | 3,704 | |
Sandy Spring Bancorp, Inc. | | | 88 | | | | 2,790 | |
South State Corporation | | | 328 | | | | 24,059 | |
Southside Bancshares, Inc. | | | 3,168 | | | | 103,340 | |
State Bank Financial Corporation | | | 1,123 | | | | 24,762 | |
Summit Financial Group, Inc. | | | 3,839 | | | | 75,897 | |
Summit State Bank | | | 790 | | | | 10,428 | |
Sun Bancorp, Inc./NJ | | | 191 | | | | 4,393 | |
Tompkins Financial Corporation | | | 672 | | | | 53,276 | |
TowneBank | | | 159 | | | | 3,943 | |
Trustmark Corporation | | | 770 | | | | 21,314 | |
United Bankshares, Inc. | | | 362 | | | | 13,647 | |
Valley National Bancorp | | | 518 | | | | 5,107 | |
WesBanco, Inc. | | | 130 | | | | 4,278 | |
West Bancorporation, Inc. | | | 101 | | | | 1,949 | |
Westamerica Bancorporation | | | 7,043 | | | | 349,051 | |
22
TFS MARKET NEUTRAL FUND
SCHEDULE OF SECURITIES SOLD SHORT (Continued) | |
COMMON STOCKS — 81.3% (Continued) | | Shares | | | Value | |
Financials — 6.3% (Continued) | | | | | | |
Banks — 1.9% (Continued) | | | | | | |
Xenith Banchares, Inc. | | | 6,886 | | | $ | 16,113 | |
| | | | | | | | 5,933,493 | |
Capital Markets — 1.1% | | | | | | | | |
American Capital Senior Floating Ltd. | | | 149 | | | | 1,661 | |
BGC Partners, Inc. - Class A | | | 1,854 | | | | 15,926 | |
Cowen Group, Inc. - Class A | | | 96,614 | | | | 313,995 | |
FBR & Company | | | 6,471 | | | | 89,947 | |
Fidus Investment Corporation | | | 4,319 | | | | 64,699 | |
Fifth Street Senior Floating Rate Corporation | | | 107 | | | | 919 | |
Financial Engines, Inc. | | | 3,457 | | | | 95,586 | |
FS Investment Corporation | | | 51,701 | | | | 496,330 | |
FXCM, Inc. - Class A | | | 557 | | | | 4,345 | |
Gladstone Capital Corporation | | | 2,115 | | | | 16,455 | |
Goldman Sachs Group, Inc. (The) | | | 1,890 | | | | 336,874 | |
Greenhill & Company, Inc. | | | 217 | | | | 5,089 | |
GSV Capital Corporation | | | 23,181 | | | | 111,037 | |
Harvest Capital Credit Corporation | | | 183 | | | | 2,216 | |
KCAP Financial, Inc. | | | 4,725 | | | | 19,939 | |
Ladenburg Thalmann Financial Services, Inc. | | | 1,266 | | | | 2,583 | |
LPL Financial Holdings, Inc. | | | 48,638 | | | | 1,505,832 | |
Main Street Capital Corporation | | | 64 | | | | 2,148 | |
OFS Capital Corporation | | | 121 | | | | 1,591 | |
OHA Investment Corporation | | | 927 | | | | 2,651 | |
PennantPark Floating Rate Capital Ltd. | | | 209 | | | | 2,711 | |
PJT Partners, Inc. - Class A | | | 999 | | | | 27,512 | |
Prospect Capital Corporation | | | 4,578 | | | | 36,120 | |
Safeguard Scientifics, Inc. | | | 265 | | | | 3,127 | |
Solar Senior Capital Ltd. | | | 238 | | | | 3,689 | |
Stellus Capital Investment Corporation | | | 139 | | | | 1,515 | |
TICC Capital Corporation | | | 24 | | | | 134 | |
Virtu Financial, Inc. - Class A | | | 1 | | | | 13 | |
Virtus Investment Partners, Inc. | | | 16 | | | | 1,717 | |
Wins Finance Holdings, Inc. | | | 596 | | | | 17,582 | |
WisdomTree Investments, Inc. | | | 2,399 | | | | 20,583 | |
ZAIS Group Holdings, Inc. | | | 2,034 | | | | 3,580 | |
| | | | | | | | 3,208,106 | |
Consumer Finance — 0.6% | | | | | | | | |
Credit Acceptance Corporation | | | 2,268 | | | | 417,539 | |
Encore Capital Group, Inc. | | | 9,255 | | | | 183,712 | |
Enova International, Inc. | | | 2,691 | | | | 25,296 | |
FirstCash, Inc. | | | 74 | | | | 3,489 | |
OneMain Holdings, Inc. | | | 80 | | | | 2,267 | |
PRA Group, Inc. | | | 2,243 | | | | 71,552 | |
23
TFS MARKET NEUTRAL FUND
SCHEDULE OF SECURITIES SOLD SHORT (Continued) | |
COMMON STOCKS — 81.3% (Continued) | | Shares | | | Value | |
Financials — 6.3% (Continued) | | | | | | |
Consumer Finance — 0.6% (Continued) | | | | | | |
Regional Management Corporation | | | 649 | | | $ | 14,453 | |
Santander Consumer USA Holdings, Inc. | | | 26,677 | | | | 325,459 | |
World Acceptance Corporation | | | 16,983 | | | | 807,032 | |
| | | | | | | | 1,850,799 | |
Diversified Financial Services — 0.2% | | | | | | | | |
CME Group, Inc. | | | 3,169 | | | | 317,217 | |
Manhattan Bridge Capital, Inc. | | | 3,672 | | | | 22,215 | |
Medallion Financial Corporation | | | 20,055 | | | | 68,989 | |
On Deck Capital, Inc. | | | 3,830 | | | | 18,729 | |
PICO Holdings, Inc. | | | 152 | | | | 1,839 | |
Tiptree Financial, Inc. | | | 700 | | | | 4,060 | |
| | | | | | | | 433,049 | |
Insurance — 1.5% | | | | | | | | |
Allied World Assurance Company Holdings, AG | | | 293 | | | | 12,593 | |
AmTrust Financial Services, Inc. | | | 16,184 | | | | 427,096 | |
Argo Group International Holdings Ltd. | | | 15 | | | | 834 | |
Assurant, Inc. | | | 42 | | | | 3,382 | |
Baldwin & Lyons, Inc. - Class B | | | 40 | | | | 984 | |
Blue Capital Holdings Ltd. | | | 4,014 | | | | 71,048 | |
Citizens, Inc. | | | 81,714 | | | | 635,735 | |
CNA Financial Corporation | | | 9,989 | | | | 365,298 | |
Conifer Holdings, Inc. | | | 2,465 | | | | 18,980 | |
Crawford & Company - Class B | | | 3,874 | | | | 43,582 | |
Federated National Holding Company | | | 891 | | | | 15,958 | |
Fidelity & Guaranty Life | | | 1,087 | | | | 24,023 | |
Hallmark Financial Services, Inc. | | | 456 | | | | 4,724 | |
HCI Group, Inc. | | | 39,680 | | | | 1,075,725 | |
Heritage Insurance Holdings, Inc. | | | 800 | | | | 9,432 | |
Infinity Property & Casualty Corporation | | | 22 | | | | 1,803 | |
MBIA, Inc. | | | 1,556 | | | | 11,981 | |
National Western Life Group, Inc. - Class A | | | 10 | | | | 2,154 | |
OneBeacon Insurance Group Ltd. - Class A | | | 222 | | | | 3,050 | |
Patriot National, Inc. | | | 117,304 | | | | 743,707 | |
Primerica, Inc. | | | 1,591 | | | | 87,028 | |
United Insurance Holdings Corporation | | | 864 | | | | 12,528 | |
Universal Insurance Holdings, Inc. | | | 51,317 | | | | 1,093,052 | |
| | | | | | | | 4,664,697 | |
Mortgage Real Estate Investment Trusts — 0.0% (a) | | | | | | | | |
ZAIS Financial Corporation | | | 1,044 | | | | 13,990 | |
| | | | | | | | | |
Thrifts & Mortgage Finance — 1.0% | | | | | | | | |
Banc of California, Inc. | | | 85,582 | | | | 1,138,241 | |
BankFinancial Corporation | | | 124 | | | | 1,559 | |
24
TFS MARKET NEUTRAL FUND
SCHEDULE OF SECURITIES SOLD SHORT (Continued) | |
COMMON STOCKS — 81.3% (Continued) | | Shares | | | Value | |
Financials — 6.3% (Continued) | | | | | | |
Thrifts & Mortgage Finance — 1.0% (Continued) | | | | | | |
BBX Capital Corporation - Class A | | | 240 | | | $ | 4,886 | |
BofI Holding, Inc. | | | 5,340 | | | | 99,484 | |
Capitol Federal Financial, Inc. | | | 1,606 | | | | 23,560 | |
Charter Financial Corporation | | | 161 | | | | 2,037 | |
Clifton Bancorp, Inc. | | | 1,769 | | | | 27,048 | |
Impac Mortgage Holdings, Inc. | | | 3,124 | | | | 49,515 | |
Lake Sunapee Bank Group | | | 95 | | | | 1,731 | |
LendingTree, Inc. | | | 324 | | | | 25,871 | |
Meridian Bancorp, Inc. | | | 206 | | | | 3,286 | |
MMA Capital Management, LLC | | | 26 | | | | 458 | |
Nationstar Mortgage Holdings, Inc. | | | 7,188 | | | | 108,611 | |
Northwest Bancshares, Inc. | | | 1,641 | | | | 25,829 | |
OceanFirst Financial Corporation | | | 710 | | | | 14,683 | |
Ocwen Financial Corporation | | | 16,770 | | | | 71,608 | |
People's United Financial, Inc. | | | 26,106 | | | | 423,961 | |
Stonegate Mortgage Corporation | | | 20,469 | | | | 82,285 | |
Timberland Bancorp, Inc. | | | 3 | | | | 49 | |
Walter Investment Management Corporation | | | 200,369 | | | | 1,001,845 | |
Washington Federal, Inc. | | | 34 | | | | 927 | |
Western New England Bancorp, Inc. | | | 10,687 | | | | 84,427 | |
WSFS Financial Corporation | | | 10 | | | | 351 | |
| | | | | | | | 3,192,252 | |
Health Care — 17.5% | | | | | | | | |
Biotechnology — 7.2% | | | | | | | | |
ACADIA Pharmaceuticals, Inc. | | | 18,001 | | | | 419,603 | |
Acorda Therapeutics, Inc. | | | 169 | | | | 2,991 | |
Actinium Pharmaceuticals, Inc. | | | 140,235 | | | | 133,223 | |
Adamas Pharmaceuticals, Inc. | | | 358 | | | | 4,919 | |
Aduro Biotech, Inc. | | | 458 | | | | 4,923 | |
Advaxis, Inc. | | | 2,188 | | | | 17,701 | |
Aeterna Zentaris, Inc. | | | 27,704 | | | | 106,660 | |
Alder Biopharmaceuticals, Inc. | | | 894 | | | | 21,679 | |
Alnylam Pharmaceuticals, Inc. | | | 40,753 | | | | 1,450,807 | |
Amicus Therapeutics, Inc. | | | 686 | | | | 4,733 | |
Anavex Life Sciences Corporation | | | 58,165 | | | | 162,280 | |
Anthera Pharmaceuticals, Inc. | | | 18,544 | | | | 40,797 | |
Applied Genetic Technologies Corporation | | | 2,032 | | | | 14,529 | |
Aquinox Pharmaceuticals, Inc. | | | 102,372 | | | | 1,071,835 | |
Arbutus Biopharma Corporation | | | 3,215 | | | | 10,127 | |
Argos Therapeutics, Inc. | | | 3,997 | | | | 16,787 | |
Array BioPharma, Inc. | | | 5,438 | | | | 30,997 | |
Arrowhead Pharmaceuticals, Inc. | | | 33,918 | | | | 196,724 | |
Asterias Biotherapeutics, Inc. - Class A | | | 12,343 | | | | 40,732 | |
25
TFS MARKET NEUTRAL FUND
SCHEDULE OF SECURITIES SOLD SHORT (Continued) | |
COMMON STOCKS — 81.3% (Continued) | | Shares | | | Value | |
Health Care — 17.5% (Continued) | | | | | | |
Biotechnology — 7.2% (Continued) | | | | | | |
Athersys, Inc. | | | 8,181 | | | $ | 14,808 | |
aTyr Pharma, Inc. | | | 1,497 | | | | 4,117 | |
Aurinia Pharmaceuticals, Inc. | | | 44,126 | | | | 133,702 | |
Bio Blast Pharma Ltd. | | | 285 | | | | 433 | |
BioTime, Inc. | | | 6,382 | | | | 20,550 | |
bluebird bio, Inc. | | | 20,971 | | | | 1,001,365 | |
Calithera Biosciences, Inc. | | | 6,554 | | | | 18,023 | |
Cara Therapeutics, Inc. | | | 7,150 | | | | 49,979 | |
CareDx, Inc. | | | 4,550 | | | | 16,380 | |
Cascadian Therapeutics, Inc. | | | 15,900 | | | | 16,377 | |
Catabasis Pharmaceuticals, Inc. | | | 32,435 | | | | 111,901 | |
Catalyst Pharmaceutical, Inc. | | | 32,208 | | | | 33,818 | |
Celldex Therapeutics, Inc. | | | 228,101 | | | | 718,518 | |
Cellectar Biosciences, Inc. | | | 742 | | | | 1,358 | |
Cellular Biomedicine Group, Inc. | | | 224 | | | | 2,699 | |
Chiasma, Inc. | | | 45,802 | | | | 103,055 | |
Clovis Oncology, Inc. | | | 35,571 | | | | 1,034,405 | |
Contrafect Corporation | | | 1,762 | | | | 4,053 | |
Corbus Pharmaceuticals Holdings, Inc. | | | 170,802 | | | | 956,491 | |
CorMedix, Inc. | | | 15,031 | | | | 31,264 | |
Dynavax Technologies Corporation | | | 109,948 | | | | 1,017,019 | |
Eagle Pharmaceuticals, Inc. | | | 82 | | | | 4,582 | |
Eleven Biotherapeutics, Inc. | | | 51,471 | | | | 90,589 | |
Enanta Pharmaceuticals, Inc. | | | 210 | | | | 4,939 | |
Esperion Therapeutics, Inc. | | | 374 | | | | 3,852 | |
Exact Sciences Corporation | | | 198 | | | | 3,085 | |
Exelixis, Inc. | | | 331 | | | | 3,505 | |
Fate Therapeutics, Inc. | | | 14,580 | | | | 30,618 | |
Fortress Biotech, Inc. | | | 5,352 | | | | 12,738 | |
Foundation Medicine, Inc. | | | 68 | | | | 1,544 | |
Genocea Biosciences, Inc. | | | 80,496 | | | | 276,906 | |
Geron Corporation | | | 78,141 | | | | 144,561 | |
Global Blood Therapeutics, Inc. | | | 259 | | | | 4,520 | |
GlycoMimetics, Inc. | | | 75 | | | | 452 | |
Heat Biologics, Inc. | | | 73,131 | | | | 97,996 | |
Heron Therapeutics, Inc. | | | 45,420 | | | | 674,487 | |
Idera Pharmaceuticals, Inc. | | | 582,500 | | | | 902,875 | |
Ignyta, Inc. | | | 577 | | | | 2,885 | |
Immunomedics, Inc. | | | 295,335 | | | | 679,271 | |
Infinity Pharmaceuticals, Inc. | | | 46,191 | | | | 55,891 | |
Inotek Pharmaceuticals Corporation | | | 2,510 | | | | 17,570 | |
Inovio Pharmaceuticals, Inc. | | | 4,223 | | | | 27,323 | |
Insys Therapeutics, Inc. | | | 113,704 | | | | 1,229,140 | |
26
TFS MARKET NEUTRAL FUND
SCHEDULE OF SECURITIES SOLD SHORT (Continued) | |
COMMON STOCKS — 81.3% (Continued) | | Shares | | | Value | |
Health Care — 17.5% (Continued) | | | | | | |
Biotechnology — 7.2% (Continued) | | | | | | |
Intercept Pharmaceuticals, Inc. | | | 2,486 | | | $ | 307,618 | |
Intrexon Corporation | | | 16,135 | | | | 421,124 | |
Invitae Corporation | | | 2,301 | | | | 17,672 | |
Juno Therapeutics, Inc. | | | 235 | | | | 5,708 | |
Keryx Biopharmaceuticals, Inc. | | | 5,876 | | | | 26,501 | |
Kindred Biosciences, Inc. | | | 354 | | | | 1,912 | |
Kura Oncology, Inc. | | | 911 | | | | 3,690 | |
Lexicon Pharmaceuticals, Inc. | | | 3,216 | | | | 47,693 | |
Ligand Pharmaceuticals, Inc. - Class B | | | 55 | | | | 5,265 | |
Lion Biotechnologies, Inc. | | | 2,843 | | | | 17,769 | |
MacroGenics, Inc. | | | 80 | | | | 1,895 | |
MediciNova, Inc. | | | 923 | | | | 6,267 | |
Merrimack Pharmaceuticals, Inc. | | | 210,802 | | | | 1,100,386 | |
MiMedx Group, Inc. | | | 8,051 | | | | 71,734 | |
Mirati Therapeutics, Inc. | | | 12,637 | | | | 63,817 | |
Myriad Genetics, Inc. | | | 82 | | | | 1,616 | |
NantKwest, Inc. | | | 2,811 | | | | 16,838 | |
Neurocrine Biosciences, Inc. | | | 9,249 | | | | 404,829 | |
Novavax, Inc. | | | 714,158 | | | | 1,085,520 | |
Nymox Pharmaceutical Corporation | | | 11,626 | | | | 36,971 | |
Ohr Pharmaceutical, Inc. | | | 33,305 | | | | 104,911 | |
Omeros Corporation | | | 135,462 | | | | 1,110,788 | |
Opexa Therapeutics, Inc. | | | 258 | | | | 219 | |
OpGen, Inc. | | | 56,197 | | | | 58,445 | |
Ophthotech Corporation | | | 6,022 | | | | 215,708 | |
OPKO Health, Inc. | | | 45,393 | | | | 427,602 | |
Organovo Holdings, Inc. | | | 10,982 | | | | 27,345 | |
PDL BioPharma, Inc. | | | 745 | | | | 2,399 | |
Pieris Pharmaceuticals, Inc. | | | 37,615 | | | | 57,175 | |
Portola Pharmaceuticals, Inc. | | | 284 | | | | 5,163 | |
Proteon Therapeutics, Inc. | | | 36 | | | | 358 | |
PTC Therapeutics, Inc. | | | 2,648 | | | | 16,444 | |
Retrophin, Inc. | | | 269 | | | | 5,071 | |
Sage Therapeutics, Inc. | | | 60 | | | | 2,612 | |
Sarepta Therapeutics, Inc. | | | 642 | | | | 25,192 | |
Seres Therapeutics, Inc. | | | 63,826 | | | | 688,683 | |
Sophiris Bio, Inc. | | | 38,514 | | | | 107,454 | |
Sorrento Therapeutics, Inc. | | | 112 | | | | 644 | |
Stellar Biotechnologies, Inc. | | | 1,413 | | | | 2,925 | |
Stemcells, Inc. | | | 3,664 | | | | 2,855 | |
Stemline Therapeutics, Inc. | | | 228 | | | | 2,599 | |
Stonebridge Biopharma plc | | | 1,200 | | | | 5,400 | |
Synergy Pharmaceuticals, Inc. | | | 3,151 | | | | 14,463 | |
27
TFS MARKET NEUTRAL FUND
SCHEDULE OF SECURITIES SOLD SHORT (Continued) | |
COMMON STOCKS — 81.3% (Continued) | | Shares | | | Value | |
Health Care — 17.5% (Continued) | | | | | | |
Biotechnology — 7.2% (Continued) | | | | | | |
Synthetic Biologics, Inc. | | | 86,322 | | | $ | 120,851 | |
T2 Biosystems, Inc. | | | 43,615 | | | | 275,647 | |
TG Therapeutics, Inc. | | | 50,721 | | | | 271,357 | |
Tracon Pharmaceuticals, Inc. | | | 201 | | | | 1,126 | |
Trovagene, Inc. | | | 2,399 | | | | 8,277 | |
Vascular Biogenics Ltd. | | | 16,086 | | | | 79,626 | |
vTv Therapeutics, Inc. - Class A | | | 497 | | | | 2,679 | |
XBiotech, Inc. | | | 10,444 | | | | 138,383 | |
Zafgen, Inc. | | | 37,717 | | | | 113,528 | |
ZIOPHARM Oncology, Inc. | | | 228,446 | | | | 1,297,573 | |
| | | | | | | | 22,150,018 | |
Health Care Equipment & Supplies — 3.6% | | | | | | | | |
Accuray, Inc. | | | 68 | | | | 333 | |
Alere, Inc. | | | 67 | | | | 2,994 | |
Align Technology, Inc. | | | 1,247 | | | | 107,142 | |
Analogic Corporation | | | 176 | | | | 14,406 | |
Antares Pharma, Inc. | | | 2,334 | | | | 4,108 | |
AtriCure, Inc. | | | 33,433 | | | | 609,818 | |
Avinger, Inc. | | | 38,227 | | | | 133,794 | |
AxoGen, Inc. | | | 59,752 | | | | 528,805 | |
Baxter International, Inc. | | | 7 | | | | 333 | |
Biolase, Inc. | | | 1,279 | | | | 1,829 | |
Bovie Medical Corporation | | | 4,019 | | | | 22,145 | |
Cerus Corporation | | | 2,033 | | | | 9,799 | |
Cesca Therapeutics, Inc. | | | 31,929 | | | | 96,106 | |
Check Cap Ltd. | | | 12,846 | | | | 28,518 | |
ConforMIS, Inc. | | | 5,181 | | | | 39,531 | |
Corindus Vascular Robotics, Inc. | | | 63,484 | | | | 48,895 | |
CytoSorbents Corporation | | | 8,004 | | | | 47,224 | |
Derma Sciences, Inc. | | | 530 | | | | 2,358 | |
DexCom, Inc. | | | 5,298 | | | | 414,515 | |
Digirad Corporation | | | 5,486 | | | | 24,138 | |
Ekso Bionics Holdings, Inc. | | | 34,641 | | | | 156,231 | |
EndoChoice Holdings, Inc. | | | 93,604 | | | | 744,152 | |
Endologix, Inc. | | | 22,824 | | | | 238,739 | |
Entellus Medical, Inc. | | | 96 | | | | 1,963 | |
GenMark Diagnostics, Inc. | | | 34 | | | | 363 | |
IDEXX Laboratories, Inc. | | | 1,334 | | | | 142,925 | |
Innocoll Holdings plc | | | 19,484 | | | | 94,692 | |
InVivo Therapeutics Holdings Corporation | | | 16,619 | | | | 72,293 | |
Invuity, Inc. | | | 7,325 | | | | 74,349 | |
iRadimed Corporation | | | 61,796 | | | | 583,972 | |
IRIDEX Corporation | | | 101 | | | | 1,369 | |
28
TFS MARKET NEUTRAL FUND
SCHEDULE OF SECURITIES SOLD SHORT (Continued) | |
COMMON STOCKS — 81.3% (Continued) | | Shares | | | Value | |
Health Care — 17.5% (Continued) | | | | | | |
Health Care Equipment & Supplies — 3.6% (Continued) | | | | | | |
K2M Group Holdings, Inc. | | | 1,491 | | | $ | 25,451 | |
Navidea Biopharmaceuticals, Inc. | | | 5,000 | | | | 4,283 | |
Nevro Corporation | | | 11,593 | | | | 1,065,629 | |
Novadaq Technologies, Inc. | | | 96,591 | | | | 1,073,126 | |
Novocure Ltd. | | | 126,733 | | | | 766,735 | |
Obalon Therapeutics, Inc. | | | 4,001 | | | | 51,733 | |
Oxford Immunotec Global plc | | | 2,186 | | | | 28,112 | |
Quidel Corporation | | | 3,022 | | | | 58,325 | |
Quotient Ltd. | | | 8,407 | | | | 45,482 | |
Retractable Technologies, Inc. | | | 1,650 | | | | 4,356 | |
ReWalk Robotics Ltd. | | | 11,789 | | | | 38,314 | |
Rockwell Medical, Inc. | | | 193,240 | | | | 1,122,724 | |
Second Sight Medical Products, Inc. | | | 241,905 | | | | 631,372 | |
Sientra, Inc. | | | 14,886 | | | | 116,855 | |
St. Jude Medical, Inc. | | | 4,406 | | | | 342,963 | |
Tandem Diabetes Care, Inc. | | | 2,691 | | | | 16,281 | |
TransEnterix, Inc. | | | 787,842 | | | | 1,181,763 | |
Unilife Corporation | | | 38,462 | | | | 107,309 | |
Vascular Solutions, Inc. | | | 23 | | | | 1,049 | |
ViewRay, Inc. | | | 35,674 | | | | 95,606 | |
Volitionrx Ltd. | | | 2,210 | | | | 9,790 | |
ZELTIQ Aesthetics, Inc. | | | 357 | | | | 11,817 | |
| | | | | | | | 11,046,914 | |
Health Care Providers & Services — 2.9% | | | | | | | | |
AAC Holdings, Inc. | | | 61,958 | | | | 1,015,492 | |
Acadia Healthcare Company, Inc. | | | 10,985 | | | | 395,021 | |
Aceto Corporation | | | 1,264 | | | | 23,169 | |
Adeptus Health, Inc. - Class A | | | 19,488 | | | | 586,979 | |
Air Methods Corporation | | | 43,402 | | | | 1,147,983 | |
AmSurg Corporation | | | 1,600 | | | | 95,600 | |
Anthem, Inc. | | | 20 | | | | 2,437 | |
BioScrip, Inc. | | | 1,688 | | | | 4,541 | |
Community Health Systems, Inc. | | | 5,867 | | | | 30,978 | |
Cross Country Healthcare, Inc. | | | 120 | | | | 1,340 | |
Express Scripts Holding Company | | | 37 | | | | 2,494 | |
Five Star Quality Care, Inc. | | | 9,514 | | | | 26,639 | |
InfuSystems Holdings, Inc. | | | 234 | | | | 597 | |
Landauer, Inc. | | | 81 | | | | 3,523 | |
LifePoint Health, Inc. | | | 6,973 | | | | 417,334 | |
Nobilis Health Corporation | | | 296,111 | | | | 991,972 | |
Patterson Companies, Inc. | | | 6,838 | | | | 292,051 | |
Psychemedics Corporation | | | 57 | | | | 1,338 | |
Sharps Compliance Corporation | | | 24,955 | | | | 92,583 | |
29
TFS MARKET NEUTRAL FUND
SCHEDULE OF SECURITIES SOLD SHORT (Continued) | |
COMMON STOCKS — 81.3% (Continued) | | Shares | | | Value | |
Health Care — 17.5% (Continued) | | | | | | |
Health Care Providers & Services — 2.9% (Continued) | | | | | | |
Surgery Partners, Inc. | | | 188 | | | $ | 3,027 | |
Team Health Holdings, Inc. | | | 27,056 | | | | 1,159,350 | |
Teladoc, Inc. | | | 77,792 | | | | 1,264,120 | |
Tenet Healthcare Corporation | | | 44 | | | | 867 | |
Triple-S Management Corporation - Class B | | | 68 | | | | 1,406 | |
Trupanion, Inc. | | | 76,665 | | | | 1,241,206 | |
Veracyte, Inc. | | | 500 | | | | 3,630 | |
| | | | | | | | 8,805,677 | |
Health Care Technology — 0.4% | | | | | | | | |
Castlight Health, Inc. - Class B | | | 41,606 | | | | 180,986 | |
Computer Programs & Systems, Inc. | | | 35,196 | | | | 918,616 | |
Connecture, Inc. | | | 1,929 | | | | 3,588 | |
Evolent Health, Inc. - Class A | | | 49 | | | | 1,031 | |
Inovalon Holdings, Inc. - Class A | | | 12,362 | | | | 168,123 | |
Nanthealth, Inc. | | | 8,216 | | | | 107,876 | |
Quality Systems, Inc. | | | 165 | | | | 2,127 | |
| | | | | | | | 1,382,347 | |
Life Sciences Tools & Services — 1.4% | | | | | | | | |
Accelerate Diagnostics, Inc. | | | 51,892 | | | | 1,102,705 | |
Albany Molecular Research, Inc. | | | 60,857 | | | | 948,761 | |
Chromadex Corporation | | | 8,032 | | | | 22,168 | |
Combimatrix Corporation | | | 251 | | | | 565 | |
Fluidigm Corporation | | | 145,919 | | | | 675,605 | |
Illumina, Inc. | | | 3,076 | | | | 418,767 | |
NeoGenomics, Inc. | | | 73 | | | | 588 | |
Pacific Biosciences of California, Inc. | | | 127,660 | | | | 1,085,110 | |
pSivida Corporation | | | 31,516 | | | | 65,553 | |
| | | | | | | | 4,319,822 | |
Pharmaceuticals — 2.0% | | | | | | | | |
AcelRx Pharmaceuticals, Inc. | | | 14,076 | | | | 39,413 | |
Achaogen, Inc. | | | 12,165 | | | | 55,837 | |
Aclaris Therapeutics, Inc. | | | 169 | | | | 3,591 | |
Adamis Pharmaceuticals Corporation | | | 23,927 | | | | 61,014 | |
Aerie Pharmaceuticals, Inc. | | | 544 | | | | 18,088 | |
Akorn, Inc. | | | 363 | | | | 8,694 | |
Alcobra Ltd. | | | 55,556 | | | | 106,668 | |
Aralez Pharmaceuticals, Inc. | | | 17,146 | | | | 69,784 | |
Auris Medical Holding A.G. | | | 2,182 | | | | 2,247 | |
BioDelivery Sciences International, Inc. | | | 22,575 | | | | 51,923 | |
Bio-Path Holdings, Inc. | | | 2,014 | | | | 2,014 | |
Biostar Pharmaceuticals, Inc. | | | 29,577 | | | | 98,196 | |
Cempra, Inc. | | | 1,396 | | | | 25,302 | |
Collegium Pharmaceutical, Inc. | | | 2,192 | | | | 32,814 | |
30
TFS MARKET NEUTRAL FUND
SCHEDULE OF SECURITIES SOLD SHORT (Continued) | |
COMMON STOCKS — 81.3% (Continued) | | Shares | | | Value | |
Health Care — 17.5% (Continued) | | | | | | |
Pharmaceuticals — 2.0% (Continued) | | | | | | |
Concordia International Corporation | | | 298,211 | | | $ | 1,016,900 | |
ContraVir Pharmaceuticals, Inc. | | | 71,430 | | | | 144,289 | |
Corcept Therapeutics, Inc. | | | 696 | | | | 4,830 | |
Depomed, Inc. | | | 222 | | | | 4,964 | |
Dipexium Pharmaceuticals, Inc. | | | 27 | | | | 45 | |
DURECT Corporation | | | 51,630 | | | | 57,826 | |
Egalet Corporation | | | 179,733 | | | | 1,008,302 | |
Evoke Pharma, Inc. | | | 1,361 | | | | 2,164 | |
Eyegate Pharmaceuticals, Inc. | | | 59 | | | | 87 | |
Flex Pharma, Inc. | | | 23,810 | | | | 115,717 | |
Innoviva, Inc. | | | 7,480 | | | | 77,044 | |
Intellipharmaceutics International, Inc. | | | 36,207 | | | | 100,293 | |
Intra-Cellular Therapies, Inc. | | | 58,425 | | | | 724,470 | |
Jaguar Animal Health, Inc. | | | 3,193 | | | | 3,001 | |
KemPharm, Inc. | | | 654 | | | | 2,420 | |
Lannett Company, Inc. | | | 727 | | | | 15,921 | |
Lipocine, Inc. | | | 35,294 | | | | 113,294 | |
Neos Therapeutics, Inc. | | | 5,173 | | | | 30,521 | |
Ocular Therapeutix, Inc. | | | 170,300 | | | | 963,898 | |
Paratek Pharmaceuticals, Inc. | | | 970 | | | | 10,379 | |
Pernix Therapeutics Holdings, Inc. | | | 28,000 | | | | 99,400 | |
Reata Pharmaceuticals, Inc. - Class A | | | 4,382 | | | | 99,208 | |
Revance Therapeutics, Inc. | | | 49,203 | | | | 656,860 | |
SCYNEXIS, Inc. | | | 34,483 | | | | 110,690 | |
Supernus Pharmaceuticals, Inc. | | | 244 | | | | 4,831 | |
Teligent, Inc. | | | 9,635 | | | | 62,724 | |
TherapeuticsMD, Inc. | | | 8,886 | | | | 51,006 | |
Titan Pharmaceuticals, Inc. | | | 12,039 | | | | 54,777 | |
VIVUS, Inc. | | | 3,909 | | | | 4,104 | |
Wave Life Science Ltd. | | | 1,054 | | | | 33,570 | |
Zogenix, Inc. | | | 4,326 | | | | 35,257 | |
Zynerba Pharmaceuticals, Inc. | | | 10,198 | | | | 117,481 | |
| | | | | | | | 6,301,858 | |
Industrials — 10.4% | | | | | | | | |
Aerospace & Defense — 1.4% | | | | | | | | |
Aerojet Rocketdyne Holdings, Inc. | | | 48,449 | | | | 852,702 | |
Astrotech Corporation | | | 596 | | | | 1,097 | |
B/E Aerospace, Inc. | | | 7,120 | | | | 423,782 | |
CPI Aerostructures, Inc. | | | 3,688 | | | | 24,894 | |
DigitalGlobe, Inc. | | | 994 | | | | 24,949 | |
KEYW Holding Corporation (The) | | | 66,836 | | | | 701,110 | |
KLX, Inc. | | | 152 | | | | 5,232 | |
Kratos Defense & Security Solutions, Inc. | | | 133,885 | | | | 752,434 | |
31
TFS MARKET NEUTRAL FUND
SCHEDULE OF SECURITIES SOLD SHORT (Continued) | |
COMMON STOCKS — 81.3% (Continued) | | Shares | | | Value | |
Industrials — 10.4% (Continued) | | | | | | |
Aerospace & Defense — 1.4% (Continued) | | | | | | |
National Presto Industries, Inc. | | | 1,984 | | | $ | 173,104 | |
TASER International, Inc. | | | 48,768 | | | | 1,091,428 | |
TransDigm Group, Inc. | | | 1,246 | | | | 339,485 | |
Vectrus, Inc. | | | 2,490 | | | | 41,757 | |
| | | | | | | | 4,431,974 | |
Air Freight & Logistics — 0.0% (a) | | | | | | | | |
Echo Global Logistics, Inc. | | | 238 | | | | 5,046 | |
Forward Air Corporation | | | 73 | | | | 3,016 | |
Park-Ohio Holdings Corporation | | | 47 | | | | 1,502 | |
| | | | | | | | 9,564 | |
Airlines — 0.6% | | | | | | | | |
Copa Holdings S.A. - Class A | | | 4,564 | | | | 420,938 | |
Spirit Airlines, Inc. | | | 5,219 | | | | 250,146 | |
Virgin America, Inc. | | | 19,394 | | | | 1,054,064 | |
| | | | | | | | 1,725,148 | |
Building Products — 0.1% | | | | | | | | |
Advanced Drainage Systems, Inc. | | | 1,853 | | | | 35,392 | |
Apogee Enterprises, Inc. | | | 999 | | | | 40,709 | |
Armstrong Flooring, Inc. | | | 162 | | | | 2,623 | |
Armstrong World Industries, Inc. | | | 8,270 | | | | 310,125 | |
Griffon Corporation | | | 3,884 | | | | 64,863 | |
Insteel Industries, Inc. | | | 375 | | | | 10,087 | |
MFRI, Inc. | | | 831 | | | | 6,648 | |
PGT, Inc. | | | 72 | | | | 706 | |
Trex Company, Inc. | | | 28 | | | | 1,507 | |
| | | | | | | | 472,660 | |
Commercial Services & Supplies — 1.4% | | | | | | | | |
Acme United Corporation | | | 3 | | | | 65 | |
Aqua Metals, Inc. | | | 99,843 | | | | 893,595 | |
ARC Document Solutions, Inc. | | | 161 | | | | 552 | |
Avery Dennison Corporation | | | 43 | | | | 3,001 | |
CompX International, Inc. | | | 258 | | | | 2,877 | |
Covanta Holding Corporation | | | 24,438 | | | | 366,570 | |
Deluxe Corporation | | | 84 | | | | 5,141 | |
EnerNOC, Inc. | | | 934 | | | | 4,857 | |
Healthcare Services Group, Inc. | | | 3,404 | | | | 125,846 | |
Hudson Technologies, Inc. | | | 166,649 | | | | 1,016,559 | |
Interface, Inc. | | | 35 | | | | 555 | |
Mobile Mini, Inc. | | | 25,582 | | | | 648,504 | |
R.R. Donnelley & Sons Company | | | 42 | | | | 751 | |
Ritchie Bros. Auctioneers, Inc. | | | 30,662 | | | | 1,060,599 | |
Team, Inc. | | | 996 | | | | 30,627 | |
Tetra Tech, Inc. | | | 9 | | | | 346 | |
32
TFS MARKET NEUTRAL FUND
SCHEDULE OF SECURITIES SOLD SHORT (Continued) | |
COMMON STOCKS — 81.3% (Continued) | | Shares | | | Value | |
Industrials — 10.4% (Continued) | | | | | | |
Commercial Services & Supplies — 1.4% (Continued) | | | | | | |
Virco Manufacturing Corporation | | | 3,634 | | | $ | 15,444 | |
| | | | | | | | 4,175,889 | |
Construction & Engineering — 0.4% | | | | | | | | |
Ameresco, Inc. - Class A | | | 11,387 | | | | 54,658 | |
Comfort Systems USA, Inc. | | | 94 | | | | 2,712 | |
Dycom Industries, Inc. | | | 19 | | | | 1,462 | |
Goldfield Corporation (The) | | | 134 | | | | 368 | |
HC2 Holdings, Inc. | | | 179 | | | | 712 | |
IES Holdings, Inc. | | | 36,149 | | | | 540,428 | |
Layne Christensen Company | | | 69,067 | | | | 591,904 | |
Northwest Pipe Company | | | 5 | | | | 66 | |
Orion Marine Group, Inc. | | | 75 | | | | 606 | |
Primoris Services Corporation | | | 370 | | | | 7,411 | |
| | | | | | | | 1,200,327 | |
Electrical Equipment — 1.8% | | | | | | | | |
Acuity Brands, Inc. | | | 1,420 | | | | 317,469 | |
American Superconductor Corporation | | | 17,751 | | | | 113,784 | |
China BAK Battery, Inc. | | | 1,689 | | | | 2,956 | |
Energous Corporation | | | 11,913 | | | | 162,374 | |
Energy Focus, Inc. | | | 9,051 | | | | 37,019 | |
Enphase Energy, Inc. | | | 98,891 | | | | 98,891 | |
Ensync, Inc. | | | 25,379 | | | | 17,765 | |
FuelCell Energy, Inc. | | | 294,287 | | | | 985,862 | |
Generac Holdings, Inc. | | | 2,338 | | | | 89,054 | |
Highpower International, Inc. | | | 388 | | | | 1,125 | |
Ideal Power, Inc. | | | 7,579 | | | | 39,411 | |
LSI Industries, Inc. | | | 330 | | | | 2,838 | |
Ocean Power Technologies, Inc. | | | 34,091 | | | | 79,091 | |
Plug Power, Inc. | | | 795,209 | | | | 1,216,670 | |
Real Goods Solar, Inc. | | | 58,659 | | | | 75,084 | |
SolarCity Corporation | | | 55,829 | | | | 1,094,248 | |
Sunrun, Inc. | | | 203,996 | | | | 1,062,819 | |
Ultralife Corporation | | | 7,069 | | | | 28,983 | |
| | | | | | | | 5,425,443 | |
Industrial Conglomerates — 0.1% | | | | | | | | |
General Electric Company | | | 10,306 | | | | 299,904 | |
Raven Industries, Inc. | | | 244 | | | | 5,234 | |
| | | | | | | | 305,138 | |
Machinery — 2.2% | | | | | | | | |
Actuant Corporation - Class A | | | 231 | | | | 5,151 | |
Altra Industrial Motion Corporation | | | 3,744 | | | | 110,448 | |
American Railcar Industries, Inc. | | | 18,197 | | | | 669,286 | |
Blue Bird Corporation | | | 3,547 | | | | 52,318 | |
33
TFS MARKET NEUTRAL FUND
SCHEDULE OF SECURITIES SOLD SHORT (Continued) | |
COMMON STOCKS — 81.3% (Continued) | | Shares | | | Value | |
Industrials — 10.4% (Continued) | | | | | | |
Machinery — 2.2% (Continued) | | | | | | |
Briggs & Stratton Corporation | | | 17,682 | | | $ | 329,239 | |
CIRCOR International, Inc. | | | 100 | | | | 5,378 | |
Cleantech Solutions International, Inc. | | | 2,902 | | | | 2,105 | |
Eastern Company (The) | | | 701 | | | | 13,810 | |
Energy Recovery, Inc. | | | 625 | | | | 7,631 | |
ExOne Company (The) | | | 1,812 | | | | 21,617 | |
Gencor Industries, Inc. | | | 10,256 | | | | 124,098 | |
Greenbrier Companies, Inc. (The) | | | 2,671 | | | | 84,137 | |
John Bean Technologies Corporation | | | 6,448 | | | | 514,873 | |
Kornit Digital Ltd. | | | 12,048 | | | | 124,094 | |
Lincoln Electric Holdings, Inc. | | | 50 | | | | 3,291 | |
Lindsay Corporation | | | 15,430 | | | | 1,208,169 | |
Manitowoc Foodservice, Inc. | | | 9,105 | | | | 137,577 | |
Miller Industries, Inc. | | | 2,294 | | | | 50,353 | |
Navistar International Corporation | | | 2,018 | | | | 45,001 | |
Omega Flex, Inc. | | | 425 | | | | 16,163 | |
Proto Labs, Inc. | | | 22,985 | | | | 1,027,430 | |
Snap-on, Inc. | | | 1,465 | | | | 225,757 | |
Sun Hydraulics Corporation | | | 918 | | | | 27,017 | |
Supreme Industries, Inc. - Class A | | | 89,770 | | | | 1,094,296 | |
Tennant Company | | | 32 | | | | 2,014 | |
Valmont Industries, Inc. | | | 2,715 | | | | 347,384 | |
Wabash National Corporation | | | 1,041 | | | | 11,711 | |
Westinghouse Air Brake Technologies Corporation | | | 5,406 | | | | 417,938 | |
Westport Innovations, Inc. | | | 135,154 | | | | 209,489 | |
| | | | | | | | 6,887,775 | |
Marine — 0.3% | | | | | | | | |
Costamare, Inc. | | | 4,534 | | | | 29,471 | |
Diana Shipping, Inc. | | | 11,653 | | | | 29,133 | |
Eagle Bulk Shipping, Inc. | | | 30,401 | | | | 124,948 | |
Global Ship Lease, Inc. - Class A | | | 146 | | | | 191 | |
Navios Maritime Holdings, Inc. | | | 24,204 | | | | 25,656 | |
Scorpio Bulkers, Inc. | | | 183,709 | | | | 716,465 | |
Seanergy Maritime Holdings Corporation | | | 531 | | | | 1,168 | |
Star Bulk Carriers Corporation | | | 8,321 | | | | 37,944 | |
| | | | | | | | 964,976 | |
Professional Services — 0.9% | | | | | | | | |
Advisory Board Company (The) | | | 447 | | | | 17,791 | |
CDI Corporation | | | 437 | | | | 2,687 | |
Cogint, Inc. | | | 139,918 | | | | 531,688 | |
Huron Consulting Group, Inc. | | | 2 | | | | 112 | |
Korn/Ferry International | | | 51,532 | | | | 1,050,737 | |
Paylocity Holding Corporation | | | 544 | | | | 23,659 | |
34
TFS MARKET NEUTRAL FUND
SCHEDULE OF SECURITIES SOLD SHORT (Continued) | |
COMMON STOCKS — 81.3% (Continued) | | Shares | | | Value | |
Industrials — 10.4% (Continued) | | | | | | |
Professional Services — 0.9% (Continued) | | | | | | |
Resources Connection, Inc. | | | 68,128 | | | $ | 1,011,701 | |
TriNet Group, Inc. | | | 645 | | | | 12,107 | |
VSE Corporation | | | 82 | | | | 2,365 | |
| | | | | | | | 2,652,847 | |
Road & Rail — 0.5% | | | | | | | | |
Avis Budget Group, Inc. | | | 50 | | | | 1,618 | |
Celadon Group, Inc. | | | 4,164 | | | | 27,066 | |
Heartland Express, Inc. | | | 57,512 | | | | 1,058,221 | |
Norfolk Southern Corporation | | | 3,644 | | | | 338,892 | |
Providence and Worcester Railroad Company | | | 230 | | | | 5,748 | |
Student Transportation, Inc. | | | 20,374 | | | | 117,965 | |
Swift Transportation Company | | | 1,313 | | | | 29,385 | |
Universal Logistics Holdings, Inc. | | | 32 | | | | 398 | |
USA Truck, Inc. | | | 168 | | | | 1,383 | |
| | | | | | | | 1,580,676 | |
Trading Companies & Distributors — 0.7% | | | | | | | | |
CAI International, Inc. | | | 587 | | | | 4,467 | |
DXP Enterprises, Inc. | | | 17,865 | | | | 389,278 | |
Fastenal Company | | | 10,999 | | | | 428,741 | |
GATX Corporation | | | 1,791 | | | | 78,392 | |
Houston Wire & Cable Company | | | 510 | | | | 2,728 | |
Huttig Building Products, Inc. | | | 641 | | | | 3,096 | |
Kaman Corporation | | | 1,180 | | | | 51,519 | |
Neff Corporation - Class A | | | 114 | | | | 1,032 | |
Nexeo Solutions, Inc. | | | 134,945 | | | | 1,014,786 | |
NOW, Inc. | | | 610 | | | | 13,152 | |
W.W. Grainger, Inc. | | | 1,547 | | | | 321,962 | |
| | | | | | | | 2,309,153 | |
Transportation Infrastructure — 0.0% (a) | | | | | | | | |
Sino-Global Shipping America Ltd. | | | 2,905 | | | | 3,079 | |
| | | | | | | | | |
Information Technology — 13.7% | | | | | | | | |
Communications Equipment — 1.5% | | | | | | | | |
Applied Optoelectronics, Inc. | | | 75 | | | | 1,442 | |
Arista Networks, Inc. | | | 4,095 | | | | 347,051 | |
Blackberry Ltd. | | | 140,496 | | | | 990,497 | |
CalAmp Corporation | | | 81,072 | | | | 1,047,450 | |
Ciena Corporation | | | 2,287 | | | | 44,322 | |
ClearOne, Inc. | | | 1,930 | | | | 20,940 | |
DragonWave, Inc. | | | 28,000 | | | | 99,400 | |
EMCORE Corporation | | | 30,214 | | | | 197,902 | |
Extreme Networks, Inc. | | | 376 | | | | 1,583 | |
Finisar Corporation | | | 4,885 | | | | 133,751 | |
35
TFS MARKET NEUTRAL FUND
SCHEDULE OF SECURITIES SOLD SHORT (Continued) | |
COMMON STOCKS — 81.3% (Continued) | | Shares | | | Value | |
Information Technology — 13.7% (Continued) | | | | | | |
Communications Equipment — 1.5% (Continued) | | | | | | |
Harmonic, Inc. | | | 232,671 | | | $ | 1,186,622 | |
Novatel Wireless, Inc. | | | 12,219 | | | | 32,014 | |
Numerex Corporation - Class A | | | 11,637 | | | | 82,739 | |
Oclaro, Inc. | | | 5 | | | | 37 | |
ORBCOMM, Inc. | | | 576 | | | | 5,144 | |
Palo Alto Networks, Inc. | | | 1,162 | | | | 178,750 | |
ParkerVision, Inc. | | | 26,988 | | | | 101,745 | |
PCTEL, Inc. | | | 231 | | | | 1,173 | |
Resonant, Inc. | | | 21,288 | | | | 91,113 | |
ViaSat, Inc. | | | 342 | | | | 24,166 | |
Wi-Lan, Inc. | | | 1,476 | | | | 2,111 | |
| | | | | | | | 4,589,952 | |
Electronic Equipment, Instruments & Components — 1.5% | | | | | | | | |
Agilysys, Inc. | | | 3,125 | | | | 30,156 | |
Anixter International, Inc. | | | 425 | | | | 27,944 | |
Applied DNA Science, Inc. | | | 17,370 | | | | 48,636 | |
Clearfield, Inc. | | | 7,385 | | | | 123,699 | |
ClearSign Combustion Corporation | | | 13,699 | | | | 71,920 | |
CUI Global, Inc. | | | 2,320 | | | | 10,997 | |
DTS, Inc. | | | 98 | | | | 4,150 | |
Fabrinet | | | 9,886 | | | | 375,273 | |
Fitbit, Inc. - Class A | | | 108,974 | | | | 1,444,995 | |
Ingram Micro, Inc. - Class A | | | 793 | | | | 29,500 | |
InvenSense, Inc. | | | 46,564 | | | | 356,215 | |
Knowles Corporation | | | 77,566 | | | | 1,158,836 | |
Maxwell Technologies, Inc. | | | 15,735 | | | | 76,157 | |
Mesa Laboratories, Inc. | | | 927 | | | | 117,024 | |
MicroVision, Inc. | | | 103,448 | | | | 105,517 | |
MTS Systems Corporation | | | 304 | | | | 14,455 | |
Neonode, Inc. | | | 98,507 | | | | 131,014 | |
Netlist, Inc. | | | 97,966 | | | | 106,783 | |
Park Electrochemical Corporation | | | 116 | | | | 1,790 | |
PCM, Inc. | | | 8,353 | | | | 177,084 | |
RadiSys Corporation | | | 14,102 | | | | 58,805 | |
Research Frontiers, Inc. | | | 5,980 | | | | 13,096 | |
SuperCom Ltd. | | | 256 | | | | 686 | |
Uni-Pixel, Inc. | | | 4,574 | | | | 6,221 | |
Vishay Intertechnology, Inc. | | | 6,330 | | | | 89,253 | |
| | | | | | | | 4,580,206 | |
Internet Software & Services — 2.1% | | | | | | | | |
Angie's List, Inc. | | | 12,593 | | | | 96,966 | |
Apigee Corporation | | | 57,309 | | | | 994,311 | |
Benefitfocus, Inc. | | | 353 | | | | 11,473 | |
36
TFS MARKET NEUTRAL FUND
SCHEDULE OF SECURITIES SOLD SHORT (Continued) | |
COMMON STOCKS — 81.3% (Continued) | | Shares | | | Value | |
Information Technology — 13.7% (Continued) | | | | | | |
Internet Software & Services — 2.1% (Continued) | | | | | | |
Care.com, Inc. | | | 55 | | | $ | 499 | |
Chegg, Inc. | | | 11,550 | | | | 76,808 | |
Cimpress N.V. | | | 62 | | | | 5,162 | |
Envestnet, Inc. | | | 637 | | | | 22,518 | |
Five9, Inc. | | | 215 | | | | 3,079 | |
Gogo, Inc. | | | 106,465 | | | | 1,076,361 | |
Great Elm Capital Group, Inc. | | | 21,845 | | | | 80,827 | |
GTT Communications, Inc. | | | 1,012 | | | | 22,770 | |
Hortonworks, Inc. | | | 143,610 | | | | 1,097,180 | |
inContact, Inc. | | | 369 | | | | 5,133 | |
Internet Gold-Golden Lines Ltd. | | | 20 | | | | 240 | |
iPass, Inc. | | | 27,104 | | | | 48,245 | |
LendingClub Corporation | | | 198,209 | | | | 977,170 | |
Live Ventures, Inc. | | | 1,310 | | | | 2,450 | |
LogMeIn, Inc. | | | 21 | | | | 1,995 | |
Marchex, Inc. - Class B | | | 1,467 | | | | 3,697 | |
MeetMe, Inc. | | | 196,747 | | | | 962,093 | |
Net Element, Inc. | | | 1,502 | | | | 1,712 | |
New Relic, Inc. | | | 118 | | | | 4,301 | |
Perion Network Ltd. | | | 2,611 | | | | 2,715 | |
Piksel, Inc. - Series A-2 (b) | | | 346,880 | | | | 0 | |
Q2 Holdings, Inc. | | | 183 | | | | 5,142 | |
Reis, Inc. | | | 5,994 | | | | 117,782 | |
Rocket Fuel, Inc. | | | 5,497 | | | | 10,884 | |
Shutterstock, Inc. | | | 86 | | | | 5,073 | |
Stamps.com, Inc. | | | 299 | | | | 29,168 | |
Synacor, Inc. | | | 22,848 | | | | 63,403 | |
Tremor Video, Inc. | | | 7,337 | | | | 12,400 | |
TrueCar, Inc. | | | 2,939 | | | | 28,361 | |
Tucows, Inc. - Class A | | | 171 | | | | 5,104 | |
Twilio, Inc. - Class A | | | 2,720 | | | | 92,806 | |
Twitter, Inc. | | | 17,614 | | | | 316,171 | |
Zillow Group, Inc. - Class A | | | 12,989 | | | | 429,027 | |
| | | | | | | | 6,613,026 | |
IT Services — 2.1% | | | | | | | | |
Accenture plc - Class A | | | 36 | | | | 4,185 | |
Blackhawk Network Holdings, Inc. | | | 105 | | | | 3,617 | |
China Customer Relations Centers, Inc. | | | 6,291 | | | | 84,425 | |
CIBER, Inc. | | | 16,045 | | | | 16,366 | |
Cognizant Technology Solutions Corporation | | | 8,393 | | | | 430,981 | |
Computer Sciences Corporation | | | 6,497 | | | | 353,762 | |
FleetCor Technologies, Inc. | | | 18 | | | | 3,155 | |
Forrester Research, Inc. | | | 42 | | | | 1,565 | |
37
TFS MARKET NEUTRAL FUND
SCHEDULE OF SECURITIES SOLD SHORT (Continued) | |
COMMON STOCKS — 81.3% (Continued) | | Shares | | | Value | |
Information Technology — 13.7% (Continued) | | | | | | |
Internet Software & Services — 2.1% (Continued) | | | | | | |
Mattersight Corporation | | | 24,975 | | | $ | 102,398 | |
ModusLink Global Solutions, Inc. | | | 114,868 | | | | 156,221 | |
NeuStar, Inc. - Class A | | | 4,416 | | | | 99,139 | |
Paychex, Inc. | | | 6,192 | | | | 341,798 | |
Planet Payment, Inc. | | | 67,276 | | | | 234,793 | |
Rightside Group Ltd. | | | 408 | | | | 3,431 | |
ServiceSource International, Inc. | | | 135,888 | | | | 645,468 | |
Square, Inc. - Class A | | | 137,477 | | | | 1,539,742 | |
VeriFone Systems, Inc. | | | 68,540 | | | | 1,060,999 | |
Virtusa Corporation | | | 51,961 | | | | 984,141 | |
Visa, Inc. - Class A | | | 4,199 | | | | 346,460 | |
| | | | | | | | 6,412,646 | |
Semiconductors & Semiconductor Equipment — 3.0% | | | | | | | | |
Adesto Technologies Corporation | | | 3,178 | | | | 6,515 | |
Ambarella, Inc. | | | 363 | | | | 22,277 | |
Amtech Systems, Inc. | | | 1 | | | | 5 | |
Camtek Ltd. | | | 697 | | | | 2,021 | |
Canadian Solar, Inc. | | | 43,264 | | | | 624,732 | |
Cavium, Inc. | | | 1,577 | | | | 89,022 | |
Cirrus Logic, Inc. | | | 307 | | | | 16,572 | |
Cree, Inc. | | | 60,783 | | | | 1,355,461 | |
DSP Group, Inc. | | | 230 | | | | 2,507 | |
First Solar, Inc. | | | 647 | | | | 26,197 | |
FormFactor, Inc. | | | 100,190 | | | | 899,205 | |
GigPeak, Inc. | | | 423,252 | | | | 1,003,107 | |
Kopin Corporation | | | 57,971 | | | | 121,159 | |
M/A-COM Technology Solutions Holdings, Inc. | | | 15,038 | | | | 552,797 | |
Microchip Technology, Inc. | | | 5,593 | | | | 338,656 | |
MKS Instruments, Inc. | | | 10,081 | | | | 508,587 | |
Nova Measuring Instruments Ltd. | | | 98 | | | | 1,173 | �� |
NVE Corporation | | | 1,940 | | | | 109,164 | |
NVIDIA Corporation | | | 5,913 | | | | 420,769 | |
Photronics, Inc. | | | 1,013 | | | | 9,826 | |
Pixelworks, Inc. | | | 7,488 | | | | 20,966 | |
QuickLogic Corporation | | | 62,882 | | | | 51,563 | |
SemiLEDs Corporation | | | 9,531 | | | | 40,507 | |
Skyworks Solutions, Inc. | | | 4,410 | | | | 339,306 | |
SolarEdge Technologies, Inc. | | | 83,436 | | | | 1,143,073 | |
SunPower Corporation | | | 192,250 | | | | 1,391,890 | |
Sunworks, Inc. | | | 5,610 | | | | 17,784 | |
Ultratech, Inc. | | | 84 | | | | 1,788 | |
Veeco Instruments, Inc. | | | 3,999 | | | | 86,778 | |
| | | | | | | | 9,203,407 | |
38
TFS MARKET NEUTRAL FUND
SCHEDULE OF SECURITIES SOLD SHORT (Continued) | |
COMMON STOCKS — 81.3% (Continued) | | Shares | | | Value | |
Information Technology — 13.7% (Continued) | | | | | | |
Software — 2.4% | | | | | | |
ACI Worldwide, Inc. | | | 768 | | | $ | 13,916 | |
Allot Communications Ltd. | | | 6 | | | | 31 | |
Attunity Ltd. | | | 14,066 | | | | 86,787 | |
Blackbaud, Inc. | | | 84 | | | | 5,158 | |
Bottomline Technologies (de), Inc. | | | 981 | | | | 22,259 | |
BroadSoft, Inc. | | | 307 | | | | 12,756 | |
BSQUARE Corporation | | | 909 | | | | 3,772 | |
Covisint Corporation | | | 1,057 | | | | 2,378 | |
Digimarc Corporation | | | 2,373 | | | | 74,987 | |
Ebix, Inc. | | | 17,970 | | | | 1,006,320 | |
ePlus, inc. | | | 558 | | | | 51,085 | |
Evolving Systems, Inc. | | | 545 | | | | 2,316 | |
Exa Corporation | | | 727 | | | | 10,178 | |
FireEye, Inc. | | | 53,666 | | | | 623,599 | |
Globant S.A. | | | 346 | | | | 15,051 | |
Glu Mobile, Inc. | | | 36,964 | | | | 73,189 | |
Guidance Software, Inc. | | | 21,700 | | | | 111,972 | |
Imperva, Inc. | | | 28,866 | | | | 1,065,155 | |
Mitek Systems, Inc. | | | 87,107 | | | | 587,972 | |
MobileIron, Inc. | | | 140,058 | | | | 511,212 | |
Model N, Inc. | | | 653 | | | | 6,726 | |
Net 1 UEPS Technologies, Inc. | | | 172 | | | | 1,767 | |
NetScout Systems, Inc. | | | 980 | | | | 26,901 | |
NetSol Technologies, Inc. | | | 316 | | | | 2,038 | |
Nxt-ID, Inc. | | | 10,488 | | | | 31,988 | |
Park City Group, Inc. | | | 5,461 | | | | 71,812 | |
PROS Holdings, Inc. | | | 1,332 | | | | 29,197 | |
QAD, Inc. | | | 30 | | | | 722 | |
Sapiens International Corporation | | | 114 | | | | 1,552 | |
Seachange International, Inc. | | | 17,034 | | | | 44,799 | |
ServiceNow, Inc. | | | 5,326 | | | | 468,209 | |
Sito Mobile Ltd. | | | 591 | | | | 2,837 | |
SS&C Technologies Holdings, Inc. | | | 10,658 | | | | 340,310 | |
Symantec Corporation | | | 13,883 | | | | 347,492 | |
TubeMogul, Inc. | | | 2,087 | | | | 15,235 | |
Tyler Technologies, Inc. | | | 1,959 | | | | 314,224 | |
VASCO Data Security International, Inc. | | | 320 | | | | 4,400 | |
VirnetX Holding Corporation | | | 386,647 | | | | 1,179,273 | |
Workday, Inc. - Class A | | | 3,844 | | | | 333,198 | |
Workiva, Inc. | | | 477 | | | | 7,894 | |
| | | | | | | | 7,510,667 | |
39
TFS MARKET NEUTRAL FUND
SCHEDULE OF SECURITIES SOLD SHORT (Continued) | |
COMMON STOCKS — 81.3% (Continued) | | Shares | | | Value | |
Information Technology — 13.7% (Continued) | | | | | | |
Technology Hardware, Storage & Peripherals — 1.1% | | | | | | |
3D Systems Corporation | | | 77,790 | | | $ | 1,078,947 | |
Apple, Inc. | | | 3,461 | | | | 392,962 | |
Concurrent Computer Corporation | | | 27 | | | | 167 | |
CPI Card Group, Inc. | | | 30,730 | | | | 169,015 | |
Electronics for Imaging, Inc. | | | 145 | | | | 6,167 | |
Immersion Corporation | | | 69,248 | | | | 565,064 | |
Intevac, Inc. | | | 1,142 | | | | 6,566 | |
Pure Storage, Inc. - Class A | | | 85,806 | | | | 1,058,846 | |
USA Technologies, Inc. | | | 906 | | | | 4,077 | |
| | | | | | | | 3,281,811 | |
Materials — 5.1% | | | | | | | | |
Chemicals — 1.4% | | | | | | | | |
A. Schulman, Inc. | | | 851 | | | | 24,466 | |
Advanced Emissions Solutions, Inc. | | | 2,184 | | | | 17,734 | |
AgroFresh Solutions, Inc. | | | 24,925 | | | | 117,148 | |
American Vanguard Corporation | | | 341 | | | | 5,183 | |
Balchem Corporation | | | 7,882 | | | | 598,244 | |
BioAmber, Inc. | | | 23,589 | | | | 109,925 | |
CF Industries Holdings, Inc. | | | 16,641 | | | | 399,551 | |
Chemours Company (The) | | | 191 | | | | 3,138 | |
China Green Agriculture, Inc. | | | 1,818 | | | | 2,400 | |
E.I. du Pont de Nemours and Company | | | 6,105 | | | | 419,963 | |
Flotek Industries, Inc. | | | 83,568 | | | | 984,431 | |
LSB Industries, Inc. | | | 2,352 | | | | 12,442 | |
NL Industries, Inc. | | | 455 | | | | 1,456 | |
Olin Corporation | | | 14 | | | | 307 | |
Platform Specialty Products Corporation | | | 100 | | | | 729 | |
Rayonier Advanced Materials, Inc. | | | 1,218 | | | | 15,749 | |
Senomyx, Inc. | | | 410,066 | | | | 479,777 | |
Terravia Holdings, Inc. | | | 483,995 | | | | 1,137,388 | |
Tronox Ltd. - Class A | | | 614 | | | | 4,973 | |
Valhi, Inc. | | | 1,400 | | | | 2,744 | |
| | | | | | | | 4,337,748 | |
Construction Materials — 0.4% | | | | | | | | |
Caesarstone Sdot-Yam Ltd. | | | 141 | | | | 4,984 | |
Summit Materials, Inc. - Class A | | | 56,479 | | | | 1,058,416 | |
U.S. Concrete, Inc. | | | 105 | | | | 5,240 | |
| | | | | | | | 1,068,640 | |
Containers & Packaging — 0.6% | | | | | | | | |
AEP Industries, Inc. | | | 16 | | | | 1,753 | |
AptarGroup, Inc. | | | 4,777 | | | | 341,269 | |
Ball Corporation | | | 5,329 | | | | 410,706 | |
Myers Industries, Inc. | | | 273 | | | | 3,290 | |
40
TFS MARKET NEUTRAL FUND
SCHEDULE OF SECURITIES SOLD SHORT (Continued) | |
COMMON STOCKS — 81.3% (Continued) | | Shares | | | Value | |
Materials — 5.1% (Continued) | | | | | | |
Containers & Packaging — 0.6% (Continued) | | | | | | |
Sealed Air Corporation | | | 80 | | | $ | 3,650 | |
Silgan Holdings, Inc. | | | 20,873 | | | | 1,063,479 | |
UFP Technologies, Inc. | | | 4,454 | | | | 118,922 | |
| | | | | | | | 1,943,069 | |
Metals & Mining — 2.7% | | | | | | | | |
AK Steel Holding Corporation | | | 4,084 | | | | 21,237 | |
Alamos Gold, Inc. - Class A | | | 2,764 | | | | 21,697 | |
Alexco Resource Corporation | | | 38,791 | | | | 68,272 | |
Allegheny Technologies, Inc. | | | 1,432 | | | | 19,533 | |
Asanko Gold, Inc. | | | 281,158 | | | | 1,040,285 | |
Avino Silver & Gold Mines Ltd. | | | 64,171 | | | | 125,133 | |
B2Gold Corporation | | | 131,697 | | | | 380,604 | |
Carpenter Technology Corporation | | | 1,494 | | | | 47,225 | |
Century Aluminum Company | | | 3,537 | | | | 25,856 | |
Cliffs Natural Resources, Inc. | | | 206,916 | | | | 1,142,176 | |
Coeur Mining, Inc. | | | 1,897 | | | | 21,209 | |
Compass Minerals International, Inc. | | | 658 | | | | 47,277 | |
Eldorado Gold Corporation | | | 251 | | | | 793 | |
Endeavour Silver Corporation | | | 8,397 | | | | 36,947 | |
Exeter Resource Corporation | | | 3,353 | | | | 3,856 | |
First Majestic Silver Corporation | | | 140,912 | | | | 1,134,342 | |
Gold Resource Corporation | | | 198,204 | | | | 1,125,799 | |
Gold Standard Ventures Corporation | | | 292,988 | | | | 700,241 | |
Great Panther Silver Ltd. | | | 57,169 | | | | 77,750 | |
Hecla Mining Company | | | 3,562 | | | | 21,336 | |
HudBay Minerals, Inc. | | | 657 | | | | 2,792 | |
IAMGOLD Corporation | | | 8,335 | | | | 33,423 | |
Kaiser Aluminum Corporation | | | 300 | | | | 21,747 | |
McEwen Mining, Inc. | | | 55,703 | | | | 181,035 | |
Mountain Province Diamonds, Inc. | | | 701 | | | | 3,680 | |
NN, Inc. | | | 53,465 | | | | 943,657 | |
NOVAGOLD Resources, Inc. | | | 3,817 | | | | 19,085 | |
Olympic Steel, Inc. | | | 36 | | | | 831 | |
Paramount Gold Nevada Corporation | | | 174 | | | | 305 | |
Pretium Resources, Inc. | | | 492 | | | | 4,817 | |
Primero Mining Corporation | | | 180,957 | | | | 247,911 | |
Royal Gold, Inc. | | | 4,206 | | | | 289,457 | |
Sandstorm Gold Ltd. | | | 7,003 | | | | 33,755 | |
Seabridge Gold, Inc. | | | 5,060 | | | | 55,407 | |
Stillwater Mining Company | | | 1,854 | | | | 24,695 | |
Tahoe Resources, Inc. | | | 34,525 | | | | 416,372 | |
United States Steel Corporation | | | 30 | | | | 580 | |
Worthington Industries, Inc. | | | 236 | | | | 11,092 | |
| | | | | | | | 8,352,209 | |
41
TFS MARKET NEUTRAL FUND
SCHEDULE OF SECURITIES SOLD SHORT (Continued) | |
COMMON STOCKS — 81.3% (Continued) | | Shares | | | Value | |
Materials — 5.1% (Continued) | | | | | | |
Paper & Forest Products — 0.0% (a) | | | | | | |
Boise Cascade Company | | | 27 | | | $ | 520 | |
Domtar Corporation | | | 701 | | | | 25,201 | |
Rentech, Inc. | | | 69 | | | | 166 | |
| | | | | | | | 25,887 | |
Real Estate — 4.4% | | | | | | | | |
Equity Real Estate Investment Trusts (REITs) — 4.4% | | | | | | | | |
Acadia Realty Trust | | | 32,946 | | | | 1,109,951 | |
Agree Realty Corporation | | | 21,661 | | | | 1,047,309 | |
American Campus Communities, Inc. | | | 5,617 | | | | 292,702 | |
American Farmland Company | | | 15,813 | | | | 116,700 | |
City Office REIT, Inc. | | | 41,840 | | | | 525,510 | |
Cousins Properties, Inc. | | | 34,473 | | | | 267,855 | |
DCT Industrial Trust, Inc. | | | 17,686 | | | | 826,821 | |
Education Realty Trust, Inc. | | | 19,043 | | | | 811,041 | |
Farmland Partners, Inc. | | | 51,177 | | | | 544,523 | |
Gladstone Commercial Corporation | | | 249 | | | | 4,445 | |
Healthcare Realty Trust, Inc. | | | 1,628 | | | | 51,917 | |
Independence Realty Trust, Inc. | | | 135,982 | | | | 1,132,730 | |
Investors Real Estate Trust | | | 38,214 | | | | 231,959 | |
Medical Properties Trust, Inc. | | | 83,300 | | | | 1,161,202 | |
Monogram Residential Trust, Inc. | | | 36,038 | | | | 379,841 | |
New York REIT, Inc. | | | 127,404 | | | | 1,200,146 | |
Physicians Realty Trust | | | 21,557 | | | | 426,182 | |
Preferred Apartment Communities, Inc. - Class A | | | 6,466 | | | | 84,187 | |
Realty Income Corporation | | | 19,380 | | | | 1,148,071 | |
Retail Properties of America, Inc. - Class A | | | 93 | | | | 1,448 | |
STAG Industrial, Inc. | | | 52,181 | | | | 1,203,816 | |
Terreno Realty Corporation | | | 40,307 | | | | 1,052,013 | |
| | | | | | | | 13,620,369 | |
Real Estate Management & Development — 0.0% (a) | | | | | | | | |
Griffin Industrial Realty, Inc. | | | 113 | | | | 3,520 | |
Realogy Holdings Corporation | | | 636 | | | | 14,558 | |
| | | | | | | | 18,078 | |
Telecommunication Services — 1.3% | | | | | | | | |
Diversified Telecommunication Services — 0.8% | | | | | | | | |
Cogent Communications Holdings, Inc. | | | 136 | | | | 5,018 | |
Frontier Communications Corporation | | | 103,406 | | | | 415,692 | |
Globalstar, Inc. | | | 51,702 | | | | 47,855 | |
Intelsat S.A. | | | 97,107 | | | | 263,160 | |
Iridium Communications, Inc. | | | 14,885 | | | | 121,313 | |
magicJack VocalTec Ltd. | | | 17,890 | | | | 110,024 | |
pdvWireless, Inc. | | | 30,170 | | | | 712,012 | |
Straight Path Communications, Inc. - Class B | | | 38,310 | | | | 930,167 | |
42
TFS MARKET NEUTRAL FUND
SCHEDULE OF SECURITIES SOLD SHORT (Continued) | |
COMMON STOCKS — 81.3% (Continued) | | Shares | | | Value | |
Telecommunication Services — 1.3% (Continued) | | | | | | |
Diversified Telecommunication Services — 0.8% (Continued) | | | | | | |
Windstream Holdings, Inc. | | | 3,520 | | | $ | 27,632 | |
Zayo Group Holdings, Inc. | | | 73 | | | | 2,349 | |
| | | | | | | | 2,635,222 | |
Wireless Telecommunication Services — 0.5% | | | | | | | | |
NII Holdings, Inc. | | | 9,285 | | | | 22,748 | |
Shenandoah Telecommunications Company | | | 40,460 | | | | 1,068,144 | |
Sprint Corporation | | | 65,385 | | | | 402,772 | |
| | | | | | | | 1,493,664 | |
Utilities — 1.3% | | | | | | | | |
Electric Utilities — 0.3% | | | | | | | | |
ALLETE, Inc. | | | 16 | | | | 980 | |
Duke Energy Corporation | | | 39 | | | | 3,121 | |
Fortis, Inc. | | | 1,934 | | | | 63,540 | |
Otter Tail Corporation | | | 31 | | | | 1,114 | |
Spark Energy, Inc. - Class A | | | 25,754 | | | | 623,247 | |
Westar Energy, Inc. | | | 6,102 | | | | 349,767 | |
| | | | | | | | 1,041,769 | |
Gas Utilities — 0.0% (a) | | | | | | | | |
Chesapeake Utilities Corporation | | | 43 | | | | 2,754 | |
Gas Natural, Inc. | | | 83 | | | | 1,025 | |
South Jersey Industries, Inc. | | | 475 | | | | 14,084 | |
| | | | | | | | 17,863 | |
Independent Power and Renewable Electricity
Producers — 0.7% | | | | | | | | |
Atlantica Yield plc | | | 288 | | | | 5,178 | |
Dynegy, Inc. | | | 168 | | | | 1,789 | |
TerraForm Global, Inc. - Class A | | | 285,547 | | | | 1,070,801 | |
TerraForm Power, Inc. - Class A | | | 2,362 | | | | 29,313 | |
Vivint Solar, Inc. | | | 362,361 | | | | 1,123,319 | |
| | | | | | | | 2,230,400 | |
Multi-Utilities — 0.3% | | | | | | | | |
Black Hills Corporation | | | 11,848 | | | | 732,799 | |
CenterPoint Energy, Inc. | | | 165 | | | | 3,762 | |
| | | | | | | | 736,561 | |
Water Utilities — 0.0% (a) | | | | | | | | |
Cadiz, Inc. | | | 15,013 | | | | 111,096 | |
| | | | | | | | | |
Total Common Stocks (Proceeds $296,178,947) | | | | | | $ | 250,787,392 | |
43
TFS MARKET NEUTRAL FUND
SCHEDULE OF SECURITIES SOLD SHORT (Continued) | |
RIGHTS — 0.0% (a) | | Shares | | | Value | |
Great Elm Capital Group, Inc. (Proceeds $18,647) | | | 21,845 | | | $ | 934 | |
| |
WARRANTS — 0.1% | | Shares | | | Value | |
Central European Media Enterprises Ltd. | | | 113,022 | | | $ | 163,882 | |
Sears Holdings Corporation | | | 36 | | | | 120 | |
Total Warrants (Proceeds $538,828) | | | | | | $ | 164,002 | |
| | | | | | | | | |
Total Securities Sold Short — 81.4% (Proceeds $296,736,422) | | | | | | $ | 250,952,328 | |
| (a) | Percentage rounds to less than 0.1%. |
| (b) | Security has been valued at fair value pursuant to procedures adopted by and under the supervision of the Board of Trustees. The total value of such securities is $0 at October 31, 2016 representing 0.0% of net assets (Note 2). |
See accompanying notes to financial statements.
44
TFS SMALL CAP FUND
SUMMARY SCHEDULE OF INVESTMENTS*
October 31, 2016 | |
COMMON STOCKS — 99.5% | | Shares | | | Value | |
Consumer Discretionary — 14.3% | | | | | | |
American Axle & Manufacturing Holdings, Inc. (a) | | | 14,797 | | | $ | 265,162 | |
Callaway Golf Company | | | 36,132 | | | | 368,908 | |
Capella Education Company | | | 4,880 | | | | 356,728 | |
Genesco, Inc. (a) | | | 4,850 | | | | 260,930 | |
Johnson Outdoors, Inc. - Class A | | | 7,799 | | | | 280,608 | |
Liberty TripAdvisor Holdings, Inc. - Series A (a) | | | 16,271 | | | | 361,216 | |
Office Depot, Inc. | | | 105,012 | | | | 330,788 | |
Other Consumer Discretionary (b) | | | | | | | 7,317,592 | |
| | | | | | | | 9,541,932 | |
Consumer Staples — 3.7% | | | | | | | | |
Darling Ingredients, Inc. (a) | | | 20,238 | | | | 275,237 | |
Other Consumer Staples (b) | | | | | | | 2,218,949 | |
| | | | | | | | 2,494,186 | |
Energy — 4.2% | | | | | | | | |
Other Energy (b) | | | | | | | 2,790,051 | |
| | | | | | | | | |
Financials — 14.9% | | | | | | | | |
CenterState Banks, Inc. | | | 16,011 | | | | 299,086 | |
CYS Investments, Inc. | | | 29,460 | | | | 253,945 | |
National General Holdings Corporation | | | 12,718 | | | | 261,355 | |
Navigators Group, Inc. (The) | | | 3,489 | | | | 325,175 | |
NMI Holdings, Inc. - Class A (a) | | | 36,754 | | | | 281,168 | |
OM Asset Management plc | | | 21,996 | | | | 309,483 | |
Safety Insurance Group, Inc. | | | 3,768 | | | | 255,094 | |
Selective Insurance Group, Inc. | | | 6,952 | | | | 256,876 | |
United Community Banks, Inc. | | | 12,840 | | | | 276,959 | |
Other Financials (b) | | | | | | | 7,411,354 | |
| | | | | | | | 9,930,495 | |
Health Care — 17.6% | | | | | | | | |
Cantel Medical Corporation | | | 3,737 | | | | 266,186 | |
Haemonetics Corporation (a) | | | 9,844 | | | | 328,888 | |
Heska Corporation (a) | | | 5,231 | | | | 258,411 | |
ICU Medical, Inc. (a) | | | 2,866 | | | | 399,234 | |
INC Research Holdings, Inc. - Class A (a) | | | 8,090 | | | | 369,713 | |
Masimo Corporation (a) | | | 6,735 | | | | 370,425 | |
Orthofix International N.V. (a) | | | 7,960 | | | | 291,734 | |
Phibro Animal Health Corporation - Class A | | | 12,458 | | | | 323,285 | |
Other Health Care (b) | | | | | | | 9,139,767 | |
| | | | | | | | 11,747,643 | |
45
TFS SMALL CAP FUND
SUMMARY SCHEDULE OF INVESTMENTS* (Continued) | |
COMMON STOCKS — 99.5% (Continued) | | Shares | | | Value | |
Industrials — 13.0% | | | | | | |
Essendant, Inc. | | | 19,383 | | | $ | 297,529 | |
On Assignment, Inc. (a) | | | 7,459 | | | | 256,664 | |
SkyWest, Inc. | | | 9,014 | | | | 271,772 | |
Viad Corporation | | | 8,200 | | | | 340,300 | |
Other Industrials (b) | | | | | | | 7,549,775 | |
| | | | | | | | 8,716,040 | |
Information Technology — 15.4% | | | | | | | | |
Amkor Technology, Inc. (a) | | | 37,888 | | | | 351,222 | |
Benchmark Electronics, Inc. (a) | | | 10,227 | | | | 257,209 | |
CommVault Systems, Inc. (a) | | | 4,989 | | | | 266,911 | |
Entegris, Inc. (a) | | | 16,819 | | | | 267,422 | |
Rudolph Technologies, Inc. (a) | | | 18,108 | | | | 327,755 | |
Other Information Technology (b) | | | | | | | 8,831,364 | |
| | | | | | | | 10,301,883 | |
Materials — 4.3% | | | | | | | | |
Stepan Company | | | 4,858 | | | | 345,064 | |
Other Materials (b) | | | | | | | 2,510,420 | |
| | | | | | | | 2,855,484 | |
Real Estate — 9.0% | | | | | | | | |
CBL & Associates Properties, Inc. | | | 42,658 | | | | 456,441 | |
CorEnergy Infrastructure Trust, Inc. | | | 15,461 | | | | 418,684 | |
Government Properties Income Trust | | | 21,589 | | | | 413,213 | |
Hudson Pacific Properties, Inc. | | | 16,152 | | | | 543,030 | |
Mack-Cali Realty Corporation | | | 15,575 | | | | 399,966 | |
National Health Investors, Inc. | | | 4,257 | | | | 322,510 | |
Pennsylvania Real Estate Investment Trust | | | 19,271 | | | | 375,977 | |
Ramco-Gershenson Properties Trust | | | 23,547 | | | | 408,305 | |
Sabra Health Care REIT, Inc. | | | 15,391 | | | | 358,610 | |
Silver Bay Realty Trust Corporation | | | 15,868 | | | | 265,789 | |
TIER REIT, Inc. | | | 33,079 | | | | 487,915 | |
Washington Prime Group, Inc. | | | 42,003 | | | | 440,612 | |
Washington Real Estate Investment Trust | | | 13,802 | | | | 406,055 | |
Other Real Estate (b) | | | | | | | 695,897 | |
| | | | | | | | 5,993,004 | |
Telecommunication Services — 1.0% | | | | | | | | |
Other Telecommunication Services (b) | | | | | | | 688,816 | |
46
TFS SMALL CAP FUND
SUMMARY SCHEDULE OF INVESTMENTS* (Continued) | |
COMMON STOCKS — 99.5% (Continued) | | Shares | | | Value | |
Utilities — 2.1% | | | | | | |
El Paso Electric Company | | | 5,937 | | | $ | 274,289 | |
Talen Energy Corporation (a) | | | 19,570 | | | | 272,610 | |
Other Utilities (b) | | | | | | | 843,359 | |
| | | | | | | | 1,390,258 | |
| | | | | | | | | |
Total Investments at Value — 99.5% (Cost $65,244,477) | | | | | | $ | 66,449,792 | |
| | | | | | | | | |
Other Assets in Excess of Liabilities — 0.5% | | | | | | | 362,134 | |
| | | | | | | | | |
Net Assets — 100.0% | | | | | | $ | 66,811,926 | |
| * | A complete Schedule of Investments is available without charge upon request by calling toll-free 1-888-534-2001 or on the SEC’s website at http://www.sec.gov. |
| (a) | Non-income producing security. |
| (b) | Represents issuers not identified as a top 50 holding in terms of market value and issues or issuers not exceeding 1% of net assets individually or in the aggregate, respectively, as of October 31, 2016. |
See accompanying notes to financial statements.
47
TFS HEDGED FUTURES FUND
SCHEDULE OF INVESTMENTS*
October 31, 2016 | |
U.S. TREASURY OBLIGATIONS — 19.9% | | Par Value | | | Value | |
U.S. Treasury Bills (a) | | | | | | |
0.320%, due 02/23/2017 | | $ | 677,000 | | | $ | 676,295 | |
0.370%, due 03/09/2017 | | | 677,000 | | | | 676,121 | |
0.380%, due 03/23/2017 | | | 947,000 | | | | 945,617 | |
0.410%, due 04/06/2017 | | | 947,000 | | | | 945,253 | |
Total U.S. Treasury Obligations (Cost $3,243,322) | | | | | | $ | 3,243,286 | |
| |
MONEY MARKET FUNDS — 50.8% | | Shares | | | Value | |
Federated U.S. Treasury Cash Reserve Fund - Institutional Shares, 0.18% (b) | | | 285,159 | | | $ | 285,159 | |
Fidelity Institutional Money Market Government Portfolio - Class I, 0.27% (b) | | | 2,873,072 | | | | 2,873,072 | |
Invesco Short-Term Investments Trust - Treasury Portfolio - Institutional Shares, 0.22% (b) | | | 1,605,132 | | | | 1,605,132 | |
PIMCO Government Money Market Fund, 0.29% (b) | | | 284,973 | | | | 284,973 | |
Premier U.S. Government Money Portfolio, 0.25% (b) | | | 1,605,132 | | | | 1,605,132 | |
Vanguard Federal Money Market Fund, 0.30% (b) | | | 1,605,132 | | | | 1,605,132 | |
Total Money Market Funds (Cost $8,258,600) | | | | | | $ | 8,258,600 | |
| | | | | | | | | |
Total Investments at Value — 70.7% (Cost $11,501,922) | | | | | | $ | 11,501,886 | |
| | | | | | | | | |
Other Assets in Excess of Liabilities — 29.3% (c) | | | | | | | 4,764,188 | |
| | | | | | | | | |
Net Assets — 100.0% | | | | | | $ | 16,266,074 | |
| (a) | Rate shown is the annualized yield at time of purchase, not a coupon rate. |
| (b) | The rate shown is the 7-day effective yield as of October 31, 2016. |
| (c) | Includes cash held as margin deposits for future contracts. |
| * | Consolidated financial statement (Note 1). |
See accompanying notes to financial statements.
48
TFS HEDGED FUTURES FUND
SCHEDULE OF FUTURES CONTRACTS*
October 31, 2016 | |
FUTURES CONTRACTS | Expiration Date | | Contracts | | | Aggregate Market Value of Contracts | | | Unrealized Appreciation (Depreciation) | |
COMMODITY FUTURES | | | | | | | | | | |
Cocoa Future | 12/14/2016 | | | 25 | | | $ | 683,750 | | | $ | (26,068 | ) |
Copper Future | 12/28/2016 | | | 2 | | | | 110,325 | | | | 3,155 | |
Cotton No.2 Future | 12/07/2016 | | | 2 | | | | 68,860 | | | | 1,261 | |
Ethanol Future | 12/05/2016 | | | 16 | | | | 728,480 | | | | 12,605 | |
Feeder Cattle Future | 11/17/2016 | | | 6 | | | | 365,550 | | | | 11,049 | |
Frozen Concentrate
Orange Juice Future | 01/10/2017 | | | 19 | | | | 608,902 | | | | 42,735 | |
Oats Future | 12/14/2016 | | | 26 | | | | 286,650 | | | | 2,727 | |
Palladium Future | 12/28/2016 | | | 3 | | | | 185,505 | | | | (17,931 | ) |
Platinum Future | 01/27/2017 | | | 4 | | | | 196,220 | | | | 4,825 | |
Red Spring Wheat Future | 12/14/2016 | | | 56 | | | | 1,474,900 | | | | 12,101 | |
Soybean Future | 01/13/2017 | | | 1 | | | | 50,588 | | | | 1,259 | |
Sugar No. 11 Future | 02/28/2017 | | | 24 | | | | 579,802 | | | | (39,426 | ) |
Total Commodity Futures | | | | | | | | 5,339,532 | | | | 8,292 | |
| | | | | | | | | | | | | | |
Total Futures Contracts | | | | | | | $ | 5,339,532 | | | $ | 8,292 | |
* | Consolidated financial statement (Note 1). |
See accompanying notes to financial statements.
49
TFS HEDGED FUTURES FUND
SCHEDULE OF FUTURES CONTRACTS SOLD SHORT*
October 31, 2016 | |
FUTURES CONTRACTS
SOLD SHORT | Expiration Date | | Contracts | | | Aggregate Market Value of Contracts | | | Unrealized Appreciation (Depreciation) | |
COMMODITY FUTURES | | | | | | | | | | |
Coffee Future | 12/19/2016 | | | 7 | | | $ | 430,894 | | | $ | (33,349 | ) |
Corn Future | 12/14/2016 | | | 32 | | | | 567,600 | | | | (30,086 | ) |
Crude Oil Future | 11/21/2016 | | | 9 | | | | 420,660 | | | | 40,546 | |
Hard Red Winter Wheat Future | 12/14/2016 | | | 31 | | | | 642,863 | | | | (3,408 | ) |
Lean Hogs Future | 12/14/2016 | | | 8 | | | | 153,440 | | | | (4,115 | ) |
Live Cattle Future | 12/30/2016 | | | 3 | | | | 123,990 | | | | (5,813 | ) |
Lumber Future | 01/13/2017 | | | 15 | | | | 507,870 | | | | 48,115 | |
Natural Gas Future | 11/28/2016 | | | 18 | | | | 542,880 | | | | 79,602 | |
Rough Rice Future | 01/13/2017 | | | 27 | | | | 548,100 | | | | 10,555 | |
Wheat Future | 12/14/2016 | | | 66 | | | | 1,373,625 | | | | (39,993 | ) |
Total Commodity Futures | | | | | | | | 5,311,922 | | | | 62,054 | |
| | | | | | | | | | | | | | |
FINANCIAL FUTURES | | | | | | | | | | | | | |
EURO STOXX 50 Future | 12/16/2016 | | | 42 | | | | 1,405,686 | | | | (29,212 | ) |
EURO VSTOXX Mini Future | 11/16/2016 | | | 93 | | | | 227,140 | | | | 17,076 | |
EURO VSTOXX Mini Future | 12/21/2016 | | | 138 | | | | 338,562 | | | | 9,254 | |
Total Financial Futures | | | | | | | | 1,971,388 | | | | (2,882 | ) |
| | | | | | | | | | | | | | |
Total Futures Contracts Sold Short | | | | | | | $ | 7,283,310 | | | $ | 59,172 | |
* | Consolidated financial statement (Note 1). |
See accompanying notes to financial statements. |
50
TFS CAPITAL INVESTMENT TRUST
STATEMENTS OF ASSETS AND LIABILITIES
October 31, 2016 | |
| | TFS
Market
Neutral Fund | | | TFS
Small
Cap Fund | | | TFS
Hedged
Futures Fund* | |
ASSETS | | | | | | | | | |
Investments in securities: | | | | | | | | | |
At acquisition cost | | $ | 305,802,321 | | | $ | 65,244,477 | | | $ | 11,501,922 | |
At value (Note 2) | | $ | 308,682,585 | | | $ | 66,449,792 | | | $ | 11,501,886 | |
Cash | | | — | | | | 625,546 | | | | 140,000 | |
Cash denominated in foreign currency | | | — | | | | — | | | | 40,867 | |
Deposits with brokers for short positions (Note 2) | | | 266,498,731 | | | | — | | | | — | |
Margin deposits for futures contracts (Note 2) | | | — | | | | — | | | | 4,539,003 | |
Variation margin receivable (Notes 2 and 5) | | | — | | | | — | | | | 296,953 | |
Dividends and interest receivable | | | 104,998 | | | | 20,843 | | | | 2,169 | |
Receivable for investment securities sold | | | 37,567,894 | | | | 4,867,055 | | | | — | |
Receivable for capital shares sold | | | 27,514 | | | | 1,183 | | | | 4,480 | |
Other assets | | | 35,614 | | | | 11,791 | | | | 9,894 | |
TOTAL ASSETS | | | 612,917,336 | | | | 71,976,210 | | | | 16,535,252 | |
| | | | | | | | | | | | | |
LIABILITIES | | | | | | | | | | | | |
Securities sold short, at value (Note 2) (proceeds $296,736,422) | | | 250,952,328 | | | | — | | | | — | |
Variation margin payable (Notes 2 and 5) | | | — | | | | — | | | | 229,481 | |
Dividends payable on securities sold short (Note 2) | | | 126,698 | | | | — | | | | — | |
Payable for investment securities purchased | | | 34,783,869 | | | | 5,059,242 | | | | — | |
Payable for capital shares redeemed | | | 17,215,478 | | | | 17,832 | | | | 18,800 | |
Payable to Adviser (Note 4) | | | 457,756 | | | | 61,906 | | | | 4,261 | |
Payable to administrator (Note 4) | | | 43,996 | | | | 10,559 | | | | 9,146 | |
Accrued brokerage expense on securities sold short (Note 2) | | | 871,603 | | | | — | | | | — | |
Other accrued expenses and liabilities | | | 42,631 | | | | 14,745 | | | | 7,490 | |
TOTAL LIABILITIES | | | 304,494,359 | | | | 5,164,284 | | | | 269,178 | |
| | | | | | | | | | | | | |
CONTINGENCIES AND COMMITMENTS (Note 7) | | | — | | | | — | | | | — | |
| | | | | | | | | | | | | |
NET ASSETS | | $ | 308,422,977 | | | $ | 66,811,926 | | | $ | 16,266,074 | |
| | | | | | | | | | | | | |
Net assets consist of: | | | | | | | | | | | | |
Paid-in capital | | $ | 319,370,734 | | | $ | 62,925,053 | | | $ | 17,293,840 | |
Accumulated net investment loss | | | (25,157,304 | ) | | | — | | | | (639,244 | ) |
Accumulated net realized gains (losses) from security transactions and other financial instruments | | | (34,454,810 | ) | | | 2,681,558 | | | | (455,955 | ) |
Net unrealized appreciation (depreciation) on: | | | | | | | | | | | | |
Investments | | | 2,880,264 | | | | 1,205,315 | | | | (36 | ) |
Short positions | | | 45,784,094 | | | | — | | | | — | |
Futures contracts | | | — | | | | — | | | | 67,464 | |
Translation of assets and liabilities in foreign currencies | | | (1 | ) | | | — | | | | 5 | |
Net assets | | $ | 308,422,977 | | | $ | 66,811,926 | | | $ | 16,266,074 | |
| | | | | | | | | | | | | |
Shares of beneficial interest outstanding (unlimited number of shares authorized, no par value) | | | 22,343,737 | | | | 5,242,907 | | | | 1,537,204 | |
| | | | | | | | | | | | | |
Net asset value, redemption price and offering price per share (Note 2) | | $ | 13.80 | | | $ | 12.74 | | | $ | 10.58 | |
* | Consolidated financial statement (Note 1). |
See accompanying notes to financial statements.
51
TFS CAPITAL INVESTMENT TRUST
STATEMENTS OF OPERATIONS
For the Year Ended October 31, 2016 | |
| | TFS
Market
Neutral Fund | | | TFS
Small
Cap Fund | | | TFS
Hedged Futures Fund* | |
INVESTMENT INCOME | | | | | | | | | |
Dividends | | $ | 6,321,423 | | | $ | 989,363 | | | $ | 40,654 | |
Foreign tax withholding | | | (7,140 | ) | | | (191 | ) | | | — | |
Interest | | | — | | | | — | | | | 11,838 | |
TOTAL INVESTMENT INCOME | | | 6,314,283 | | | | 989,172 | | | | 52,492 | |
| | | | | | | | | | | | | |
EXPENSES | | | | | | | | | | | | |
Brokerage expense on securities sold short (Note 2) | | | 26,935,767 | | | | — | | | | — | |
Investment advisory fees (Note 4) | | | 9,000,686 | | | | 926,548 | | | | 275,842 | |
Dividend expense on securities sold short (Note 2) | | | 4,018,060 | | | | — | | | | — | |
Accounting services fees (Note 4) | | | 454,651 | | | | 87,553 | | | | 38,744 | |
Administration fees (Note 4) | | | 387,569 | | | | 62,794 | | | | 60,000 | |
Custodian fees | | | 300,350 | | | | 111,621 | | | | 27,215 | |
Transfer agent fees (Note 4) | | | 186,604 | | | | 39,823 | | | | 18,000 | |
Professional fees | | | 122,338 | | | | 40,005 | | | | 39,118 | |
Registration and filing fees | | | 63,401 | | | | 31,964 | | | | 30,408 | |
Borrowing costs (Note 2) | | | 112,165 | | | | 3,166 | | | | — | |
Pricing fees | | | 84,932 | | | | 19,983 | | | | 4,042 | |
Trustees’ fees and expenses (Note 4) | | | 36,059 | | | | 36,059 | | | | 36,059 | |
Compliance service fees and expenses (Note 4) | | | 36,304 | | | | 14,245 | | | | 11,191 | |
Postage and supplies | | | 37,585 | | | | 10,328 | | | | 4,408 | |
Insurance expense | | | 42,236 | | | | 2,949 | | | | 2,581 | |
Printing of shareholder reports | | | 20,353 | | | | 5,345 | | | | 2,753 | |
Other expenses | | | 26,368 | | | | 18,971 | | | | 12,081 | |
TOTAL EXPENSES | | | 41,865,428 | | | | 1,411,354 | | | | 562,442 | |
Investment advisory fee reductions (Note 4) | | | (438,414 | ) | | | (199,648 | ) | | | (231,846 | ) |
NET EXPENSES | | | 41,427,014 | | | | 1,211,706 | | | | 330,596 | |
NET INVESTMENT LOSS | | | (35,112,731 | ) | | | (222,534 | ) | | | (278,104 | ) |
| | | | | | | | | | | | | |
REALIZED AND UNREALIZED GAINS (LOSSES) | | | | | | | | | | | | |
Net realized gains (losses) from: | | | | | | | | | | | | |
Investments | | | 3,273,816 | | | | 5,587,939 | | | | 2,894 | |
Securities sold short | | | 19,476,795 | | | | — | | | | — | |
Options contracts | | | 742,213 | | | | — | | | | — | |
Futures contracts (Note 5) | | | 3,498,756 | | | | — | | | | 283,342 | |
Foreign currency transactions (Note 5) | | | 571 | | | | — | | | | (3,118 | ) |
Net change in unrealized appreciation (depreciation) on: | | | | | | | | | | | | |
Investments | | | (16,280,807 | ) | | | (3,989,830 | ) | | | 749 | |
Securities sold short | | | (41,200,643 | ) | | | — | | | | — | |
Futures contracts (Note 5) | | | 1,021,348 | | | | — | | | | (26,230 | ) |
Foreign currency translation (Note 5) | | | (8 | ) | | | — | | | | 1,015 | |
NET REALIZED AND UNREALIZED GAINS (LOSSES) | | | (29,467,959 | ) | | | 1,598,109 | | | | 258,652 | |
NET INCREASE (DECREASE) IN NET ASSETS FROM OPERATIONS | | $ | (64,580,690 | ) | | $ | 1,375,575 | | | $ | (19,452 | ) |
* | Consolidated financial statement (Note 1). |
See accompanying notes to financial statements.
52
TFS MARKET NEUTRAL FUND
STATEMENTS OF CHANGES IN NET ASSETS | |
| | Year
Ended
October 31,
2016 | | | Year
Ended
October 31,
2015 | |
FROM OPERATIONS | | | | | | |
Net investment loss | | $ | (35,112,731 | ) | | $ | (48,587,484 | ) |
Net realized gains from: | | | | | | | | |
Investments | | | 3,273,816 | | | | 43,896,660 | |
Securities sold short | | | 19,476,795 | | | | 86,579,676 | |
Option contracts | | | 742,213 | | | | — | |
Futures contracts | | | 3,498,756 | | | | 11,548,157 | |
Foreign currency transactions | | | 571 | | | | 77 | |
Net change in unrealized appreciation (depreciation) on: | | | | | | | | |
Investments | | | (16,280,807 | ) | | | (54,251,526 | ) |
Securities sold short | | | (41,200,643 | ) | | | (4,731,243 | ) |
Futures contracts | | | 1,021,348 | | | | 1,256,252 | |
Foreign currency translation | | | (8 | ) | | | 7 | |
Net increase (decrease) in net assets from operations | | | (64,580,690 | ) | | | 35,710,576 | |
| | | | | | | | | |
FROM DISTRIBUTIONS (Note 2) | | | | | | | | |
Distributions from net realized gains from security transactions | | | (28,447,169 | ) | | | (28,360,770 | ) |
| | | | | | | | | |
FROM CAPITAL SHARE TRANSACTIONS | | | | | | | | |
Proceeds from shares sold | | | 134,742,713 | | | | 284,326,684 | |
Net asset value of shares issued in reinvestment of distributions to shareholders | | | 19,356,148 | | | | 19,177,908 | |
Payments for shares redeemed | | | (537,713,899 | ) | | | (294,970,033 | ) |
Net increase (decrease) in net assets from capital share transactions | | | (383,615,038 | ) | | | 8,534,559 | |
| | | | | | | | | |
TOTAL INCREASE (DECREASE) IN NET ASSETS | | | (476,642,897 | ) | | | 15,884,365 | |
| | | | | | | | | |
NET ASSETS | | | | | | | | |
Beginning of year | | | 785,065,874 | | | | 769,181,509 | |
End of year | | $ | 308,422,977 | | | $ | 785,065,874 | |
| | | | | | | | | |
ACCUMULATED NET INVESTMENT INCOME (LOSS) | | $ | (25,157,304 | ) | | $ | 1,730,051 | |
| | | | | | | | | |
CAPITAL SHARE ACTIVITY | | | | | | | | |
Shares sold | | | 9,498,421 | | | | 18,358,000 | |
Shares issued in reinvestment of distributions to shareholders | | | 1,368,893 | | | | 1,263,367 | |
Shares redeemed | | | (38,832,823 | ) | | | (19,086,260 | ) |
Net increase (decrease) in shares outstanding | | | (27,965,509 | ) | | | 535,107 | |
Shares outstanding, beginning of year | | | 50,309,246 | | | | 49,774,139 | |
Shares outstanding, end of year | | | 22,343,737 | | | | 50,309,246 | |
See accompanying notes to financial statements. |
53
TFS SMALL CAP FUND
STATEMENTS OF CHANGES IN NET ASSETS | |
| | Year
Ended
October 31,
2016 | | | Year
Ended
October 31,
2015 | |
FROM OPERATIONS | | | | | | |
Net investment loss | | $ | (222,534 | ) | | $ | (244,703 | ) |
Net realized gains from investments | | | 5,587,939 | | | | 3,696,746 | |
Net change in unrealized appreciation (depreciation) on investments | | | (3,989,830 | ) | | | (3,114,635 | ) |
Net increase in net assets from operations | | | 1,375,575 | | | | 337,408 | |
| | | | | | | | | |
FROM DISTRIBUTIONS (Note 2) | | | | | | | | |
Distributions from net realized gains from security transactions | | | (4,457,263 | ) | | | (6,562,462 | ) |
| | | | | | | | | |
FROM CAPITAL SHARE TRANSACTIONS | | | | | | | | |
Proceeds from shares sold | | | 20,317,282 | | | | 31,304,772 | |
Net asset value of shares issued in reinvestment of distributions to shareholders | | | 4,086,135 | | | | 6,162,314 | |
Payments for shares redeemed | | | (52,648,482 | ) | | | (30,879,354 | ) |
Net increase (decrease) in net assets from capital share transactions | | | (28,245,065 | ) | | | 6,587,732 | |
| | | | | | | | | |
TOTAL INCREASE (DECREASE) IN NET ASSETS | | | (31,326,753 | ) | | | 362,678 | |
| | | | | | | | | |
NET ASSETS | | | | | | | | |
Beginning of year | | | 98,138,679 | | | | 97,776,001 | |
End of year | | $ | 66,811,926 | | | $ | 98,138,679 | |
| | | | | | | | | |
ACCUMULATED NET INVESTMENT LOSS | | $ | — | | | $ | (4,944 | ) |
| | | | | | | | | |
CAPITAL SHARE ACTIVITY | | | | | | | | |
Shares sold | | | 1,728,901 | | | | 2,273,301 | |
Shares issued in reinvestment of distributions to shareholders | | | 335,756 | | | | 459,531 | |
Shares redeemed | | | (4,318,425 | ) | | | (2,253,891 | ) |
Net increase (decrease) in shares outstanding | | | (2,253,768 | ) | | | 478,941 | |
Shares outstanding, beginning of year | | | 7,496,675 | | | | 7,017,734 | |
Shares outstanding, end of year | | | 5,242,907 | | | | 7,496,675 | |
See accompanying notes to financial statements. |
54
TFS HEDGED FUTURES FUND
STATEMENTS OF CHANGES IN NET ASSETS* | |
| | Year
Ended
October 31,
2016 | | | Year
Ended
October 31,
2015 | |
FROM OPERATIONS | | | | | | |
Net investment loss | | $ | (278,104 | ) | | $ | (374,060 | ) |
Net realized gains (losses) from: | | | | | | | | |
Investments | | | 2,894 | | | | 1,613 | |
Futures contracts | | | 283,342 | | | | 946,092 | |
Foreign currency transactions | | | (3,118 | ) | | | (55,994 | ) |
Net change in unrealized appreciation (depreciation) on: | | | | | | | | |
Investments | | | 749 | | | | (264 | ) |
Futures contracts | | | (26,230 | ) | | | 248,862 | |
Foreign currency translation | | | 1,015 | | | | (55,498 | ) |
Net increase (decrease) in net assets from operations | | | (19,452 | ) | | | 710,751 | |
| | | | | | | | | |
FROM CAPITAL SHARE TRANSACTIONS | | | | | | | | |
Proceeds from shares sold | | | 11,296,813 | | | | 5,548,994 | |
Payments for shares redeemed | | | (11,641,932 | ) | | | (27,840,874 | ) |
Net decrease in net assets from capital share transactions | | | (345,119 | ) | | | (22,291,880 | ) |
| | | | | | | | | |
TOTAL DECREASE IN NET ASSETS | | | (364,571 | ) | | | (21,581,129 | ) |
| | | | | | | | | |
NET ASSETS | | | | | | | | |
Beginning of year | | | 16,630,645 | | | | 38,211,774 | |
End of year | | $ | 16,266,074 | | | $ | 16,630,645 | |
| | | | | | | | | |
ACCUMULATED NET INVESTMENT LOSS | | $ | (639,244 | ) | | $ | (410,464 | ) |
| | | | | | | | | |
CAPITAL SHARE ACTIVITY | | | | | | | | |
Shares sold | | | 1,067,335 | | | | 537,173 | |
Shares redeemed | | | (1,106,832 | ) | | | (2,828,785 | ) |
Net decrease in shares outstanding | | | (39,497 | ) | | | (2,291,612 | ) |
Shares outstanding, beginning of year | | | 1,576,701 | | | | 3,868,313 | |
Shares outstanding, end of year | | | 1,537,204 | | | | 1,576,701 | |
* | Consolidated financial statements (Note 1). |
See accompanying notes to financial statements.
55
TFS MARKET NEUTRAL FUND
FINANCIAL HIGHLIGHTS | |
Per share data for a share
outstanding throughout each year: | | Year
Ended
October 31, 2016 | | | Year
Ended
October 31, 2015 | | | Year
Ended
October 31,
2014 | | | Year
Ended
October 31,
2013 | | | Year
Ended
October 31,
2012 | |
Net asset value at beginning of year | | $ | 15.60 | | | $ | 15.45 | | | $ | 16.19 | | | $ | 15.23 | | | $ | 14.41 | |
| | | | | | | | | | | | | | | | | | | | | |
Income (loss) from investment operations: | | | | | | | | | | | | | | | | | | | | |
Net investment loss | | | (1.53 | ) | | | (0.95 | ) | | | (1.57 | ) | | | (1.25 | ) | | | (0.99 | ) |
Net realized and unrealized gains on investments | | | 0.33 | | | | 1.70 | | | | 1.49 | | | | 2.21 | | | | 2.05 | |
Total from investment operations | | | (1.20 | ) | | | 0.75 | | | | (0.08 | ) | | | 0.96 | | | | 1.06 | |
| | | | | | | | | | | | | | | | | | | | | |
Less distributions: | | | | | | | | | | | | | | | | | | | | |
Distributions from net realized gains from security transactions | | | (0.60 | ) | | | (0.60 | ) | | | (0.66 | ) | | | — | | | | (0.24 | ) |
| | | | | | | | | | | | | | | | | | | | | |
Proceeds from redemption fees collected (Note 2) | | | — | | | | — | | | | 0.00 | (a) | | | 0.00 | (a) | | | 0.00 | (a) |
| | | | | | | | | | | | | | | | | | | | | |
Net asset value at end of year | | $ | 13.80 | | | $ | 15.60 | | | $ | 15.45 | | | $ | 16.19 | | | $ | 15.23 | |
| | | | | | | | | | | | | | | | | | | | | |
Total return (b) | | | (7.79 | %) | | | 4.99 | % | | | (0.50 | %) | | | 6.30 | % | | | 7.48 | % |
| | | | | | | | | | | | | | | | | | | | | |
Ratios and supplemental data: | | | | | | | | | | | | | | | | | | | | |
Net assets at end of year (000’s) | | $ | 308,423 | | | $ | 785,066 | | | $ | 769,182 | | | $ | 1,582,797 | | | $ | 1,789,303 | |
| | | | | | | | | | | | | | | | | | | | | |
Ratio of total expenses to average net assets | | | 7.70 | % | | | 7.71 | % | | | 8.44 | % | | | 8.67 | % | | | 8.63 | % |
| | | | | | | | | | | | | | | | | | | | | |
Ratio of net expenses to average net assets | | | 7.62 | %(c) | | | 7.65 | %(c) | | | 8.43 | %(c) | | | 8.67 | % | | | 8.63 | % |
| | | | | | | | | | | | | | | | | | | | | |
Ratio of net expenses to average net assets excluding dividend expense (d) | | | 6.88 | %(c) | | | 6.92 | %(c) | | | 7.53 | %(c) | | | 7.59 | % | | | 7.75 | % |
| | | | | | | | | | | | | | | | | | | | | |
Ratio of net expenses to average net assets excluding dividend expense, borrowing costs and brokerage expense on securities sold short (d) | | | 1.90 | %(c) | | | 1.90 | %(c) | | | 2.02 | %(c)(e) | | | 2.41 | % | | | 2.42 | % |
| | | | | | | | | | | | | | | | | | | | | |
Ratio of net investment loss to
average net assets | | | (6.46 | %)(c) | | | (6.55 | %)(c) | | | (7.17 | %)(c) | | | (6.67 | %) | | | (6.73 | %) |
| | | | | | | | | | | | | | | | | | | | | |
Portfolio turnover rate | | | 778 | % | | | 795 | % | | | 669 | % | | | 552 | % | | | 607 | % |
| (a) | Amount rounds to less than $0.01 per share. |
| (b) | Total return is a measure of the change in value of an investment in the Fund over the period covered, which assumes any dividends or capital gains distributions are reinvested in shares of the Fund. The returns shown do not reflect the deduction of taxes a shareholder would pay on Fund distributions or the redemption of Fund shares. |
| (c) | Ratio was determined after advisory fee reductions (Note 4). |
(d) | Dividend expense, borrowing costs and brokerage expense on securities sold short totaled 5.72%, 5.75%, 6.41%, 6.26% and 6.21% of average net assets for the years ended October 31, 2016, 2015, 2014, 2013 and 2012, respectively. |
| (e) | Effective January 1, 2014, the Advisor reduced its advisory fee from 2.25% to 1.65% of average daily net assets and agreed to further reduce its advisory fees and to absorb the Fund’s operating expenses to the extent necessary to limit aggregate annual operating expenses (which do not include brokerage costs, taxes, borrowing costs such as interest and dividend expenses on securities sold short, and extraordinary expenses) to 1.90% of average daily net assets. |
See accompanying notes to financial statements.
56
TFS SMALL CAP FUND
FINANCIAL HIGHLIGHTS | |
Per share data for a share
outstanding throughout each year: | | Year
Ended
October 31, 2016 | | | Year
Ended
October 31, 2015 | | | Year
Ended
October 31,
2014 | | | Year
Ended
October 31,
2013 | | | Year
Ended
October 31,
2012 | |
Net asset value at beginning of year | | $ | 13.09 | | | $ | 13.93 | | | $ | 15.87 | | | $ | 13.56 | | | $ | 12.07 | |
| | | | | | | | | | | | | | | | | | | | | |
Income (loss) from investment operations: | | | | | | | | | | | | | | | | | | | | |
Net investment income (loss) | | | (0.04 | ) | | | (0.03 | ) | | | (0.04 | ) | | | 0.02 | | | | (0.00 | )(a) |
Net realized and unrealized gains on investments | | | 0.33 | | | | 0.12 | | | | 1.40 | | | | 4.92 | | | | 1.52 | |
Total from investment operations | | | 0.29 | | | | 0.09 | | | | 1.36 | | | | 4.94 | | | | 1.52 | |
| | | | | | | | | | | | | | | | | | | | | |
Less distributions: | | | | | | | | | | | | | | | | | | | | |
Distributions from net investment income | | | — | | | | — | | | | — | | | | (0.07 | ) | | | — | |
Distributions from net realized gains from security transactions | | | (0.64 | ) | | | (0.93 | ) | | | (3.30 | ) | | | (2.56 | ) | | | (0.03 | ) |
Total distributions | | | (0.64 | ) | | | (0.93 | ) | | | (3.30 | ) | | | (2.63 | ) | | | (0.03 | ) |
| | | | | | | | | | | | | | | | | | | | | |
Proceeds from redemption fees collected (Note 2) | | | — | | | | — | | | | 0.00 | (a) | | | 0.00 | (a) | | | 0.00 | (a) |
| | | | | | | | | | | | | | | | | | | | | |
Net asset value at end of year | | $ | 12.74 | | | $ | 13.09 | | | $ | 13.93 | | | $ | 15.87 | | | $ | 13.56 | |
| | | | | | | | | | | | | | | | | | | | | |
Total return (b) | | | 2.46 | % | | | 0.51 | % | | | 9.50 | % | | | 44.15 | % | | | 12.62 | % |
| | | | | | | | | | | | | | | | | | | | | |
Ratios and supplemental data: | | | | | | | | | | | | | | | | | | | | |
Net assets at end of year (000’s) | | $ | 66,812 | | | $ | 98,139 | | | $ | 97,776 | | | $ | 80,989 | | | $ | 50,073 | |
| | | | | | | | | | | | | | | | | | | | | |
Ratio of total expenses to average net assets | | | 1.75 | % | | | 1.68 | % | | | 1.61 | % | | | 1.80 | % | | | 1.95 | % |
| | | | | | | | | | | | | | | | | | | | | |
Ratio of net expenses to average net assets (c) | | | 1.51 | %(e) | | | 1.50 | % | | | 1.54 | %(d) | | | 1.75 | % | | | 1.75 | % |
| | | | | | | | | | | | | | | | | | | | | |
Ratio of net investment income (loss) to average net assets (c) | | | (0.28 | %) | | | (0.23 | %) | | | (0.36 | %) | | | 0.06 | % | | | (0.03 | %) |
| | | | | | | | | | | | | | | | | | | | | |
Portfolio turnover rate | | | 778 | % | | | 639 | % | | | 579 | % | | | 601 | % | | | 557 | % |
| (a) | Amount rounds to less than $0.01 per share. |
| (b) | Total return is a measure of the change in value of an investment in the Fund over the period covered, which assumes any dividends or capital gains distributions are reinvested in shares of the Fund. The returns shown do not reflect the deduction of taxes a shareholder would pay on Fund distributions or the redemption of Fund shares. |
| (c) | Ratio was determined after advisory fee reductions (Note 4). |
| (d) | Effective January 1, 2014, the Advisor reduced its advisory fee from 1.25% to 1.15% of average daily net assets and agreed to further reduce its advisory fees and to absorb the Fund’s operating expenses to the extent necessary to limit aggregate annual operating expenses (which do not include brokerage costs, taxes, borrowing costs such as interest and dividend expenses on securities sold short, and extraordinary expenses) to 1.50% of average daily net assets. |
| (e) | Includes borrowing costs of 0.01% of average net assets with respect to the year ended October 31, 2016. |
See accompanying notes to financial statements.
57
TFS HEDGED FUTURES FUND
FINANCIAL HIGHLIGHTS* | |
Per share data for a share
outstanding throughout each period: | | Year
Ended
October 31, 2016 | | | Year
Ended
October 31, 2015 | | | Year
Ended
October 31,
2014 | | | Year
Ended
October 31,
2013 | | | Period
Ended
October 31,
2012(a) | |
Net asset value at beginning of period | | $ | 10.55 | | | $ | 9.88 | | | $ | 9.93 | | | $ | 11.04 | | | $ | 10.00 | |
| | | | | | | | | | | | | | | | | | | | | |
Income (loss) from investment operations: | | | | | | | | | | | | | | | | | | | | |
Net investment loss | | | (0.19 | ) | | | (0.19 | )(b) | | | (0.49 | ) | | | (0.20 | ) | | | (0.09 | ) |
Net realized and unrealized gains (losses) on investments | | | 0.22 | | | | 0.86 | | | | 0.47 | | | | (0.68 | ) | | | 1.13 | |
Total from investment operations | | | 0.03 | | | | 0.67 | | | | (0.02 | ) | | | (0.88 | ) | | | 1.04 | |
| | | | | | | | | | | | | | | | | | | | | |
Less distributions: | | | | | | | | | | | | | | | | | | | | |
Distributions from net realized gains from security transactions | | | — | | | | — | | | | (0.03 | ) | | | (0.23 | ) | | | — | |
| | | | | | | | | | | | | | | | | | | | | |
Proceeds from redemption fees collected (Note 2) | | | — | | | | — | | | | 0.00 | (c) | | | 0.00 | (c) | | | 0.00 | (c) |
| | | | | | | | | | | | | | | | | | | | | |
Net asset value at end of period | | $ | 10.58 | | | $ | 10.55 | | | $ | 9.88 | | | $ | 9.93 | | | $ | 11.04 | |
| | | | | | | | | | | | | | | | | | | | | |
Total return (d) | | | 0.28 | % | | | 6.78 | % | | | (0.22 | %) | | | (8.14 | %) | | | 10.40 | %(e) |
| | | | | | | | | | | | | | | | | | | | | |
Ratios and supplemental data: | | | | | | | | | | | | | | | | | | | | |
Net assets at end of period (000’s) | | $ | 16,266 | | | $ | 16,631 | | | $ | 38,212 | | | $ | 68,250 | | | $ | 113,541 | |
| | | | | | | | | | | | | | | | | | | | | |
Ratio of total expenses to average net assets | | | 3.06 | % | | | 2.90 | % | | | 2.19 | % | | | 2.35 | % | | | 2.51 | %(f) |
| | | | | | | | | | | | | | | | | | | | | |
Ratio of net expenses to average net assets (g) | | | 1.80 | % | | | 1.81 | %(i) | | | 1.90 | %(h) | | | 2.30 | % | | | 2.30 | %(f) |
| | | | | | | | | | | | | | | | | | | | | |
Ratio of net investment loss to average net assets (g) | | | (1.51 | %) | | | (1.75 | %) | | | (1.87 | %) | | | (2.23 | %) | | | (2.19 | %)(f) |
| | | | | | | | | | | | | | | | | | | | | |
Portfolio turnover rate (j) | | | 0 | % | | | 0 | % | | | 0 | % | | | 0 | % | | | 0 | % |
| * | Consolidated financial statements (Note 1). |
| (a) | Represents the period from commencement of operations (December 29, 2011) through October 31, 2012. |
| (b) | Calculated using weighted average shares outstanding during the period. |
| (c) | Amount rounds to less than $0.01 per share. |
| (d) | Total return is a measure of the change in value of an investment in the Fund over the period covered, which assumes any dividends or capital gains distributions are reinvested in shares of the Fund. The returns shown do not reflect the deduction of taxes a shareholder would pay on Fund distributions or the redemption of Fund shares. |
| (g) | Ratio was determined after advisory fee reductions (Note 4). |
| (h) | Effective January 1, 2014, the Advisor reduced its advisory fee from 2.00% to 1.50% of average daily net assets and agreed to further reduce its advisory fees and to absorb the Fund’s operating expenses to the extent necessary to limit aggregate annual operating expenses (which do not include brokerage costs, taxes, borrowing costs such as interest and dividend expenses on securities sold short, and extraordinary expenses) to 1.80% of average daily net assets. |
| (i) | Includes borrowing costs of 0.01% of average net assets with respect to the year ended October 31, 2015. |
| (j) | All investments held are excluded from the calculation as they are considered to be short-term investments whose maturities or expiration dates at the time of acquisition were one year or less. |
See accompanying notes to financial statements.
58
TFS CAPITAL INVESTMENT TRUST
NOTES TO FINANCIAL STATEMENTS
October 31, 2016
1. Organization
TFS Market Neutral Fund, TFS Small Cap Fund and TFS Hedged Futures Fund (individually, a “Fund”, and collectively, the “Funds”) are each a series of TFS Capital Investment Trust (the “Trust”), an open-end management investment company established as an Ohio business trust under a Declaration of Trust dated January 30, 2004. TFS Market Neutral Fund commenced operations on September 7, 2004. TFS Small Cap Fund commenced operations on March 7, 2006. TFS Hedged Futures Fund commenced operations on December 29, 2011.
The consolidated financial statements of TFS Hedged Futures Fund include TFS Hedged Futures Strategy Offshore Fund Ltd. (the “Subsidiary”), a wholly-owned and controlled Cayman Islands subsidiary. TFS Hedged Futures Fund may invest up to 25% of its total assets in the Subsidiary. TFS Hedged Futures Fund purchases investments through the Subsidiary to provide exposure to the commodity futures market which otherwise may not be possible in a mutual fund structure. All inter-company accounts and transactions have been eliminated in consolidation for TFS Hedged Futures Fund.
TFS Market Neutral Fund seeks to produce capital appreciation while having a low correlation to the U.S. equity market, which TFS Capital LLC (the “Adviser”) defines as the S&P 500® Index. In addition, the Fund seeks to produce lower volatility than the movement of the U.S. equity market.
TFS Small Cap Fund seeks long-term capital appreciation. In addition, the Fund seeks to outperform the Russell 2000® Index.
TFS Hedged Futures Fund seeks to achieve long-term capital appreciation.
2. Significant Accounting Policies
The following is a summary of the Funds’ significant accounting policies. The policies are in conformity with accounting principles generally accepted in the United States of America (“GAAP”). As an investment company, as defined in Financial Accounting Standards Board (“FASB”) Accounting Standards Update 2013-08, the Funds follow accounting and reporting guidance under FASB Accounting Standards Codification Topic 946, “Financial Services – Investment Companies.”
In October 2016, the Securities and Exchange Commission (the “SEC”) released its Final Rule on Investment Company Reporting Modernization (the “Rule”). The Rule which introduces two new regulatory reporting forms for investment companies – Form N-PORT and Form N-CEN – also contains amendments to Regulation S-X which impact financial statement presentation, particularly the presentation of derivative investments. Although still evaluating the impact of the Rule, management believes that many of the Regulation S-X amendments are consistent with the Funds’ current financial statement presentation and expects that the Funds will be able to comply with the Rule’s Regulation S-X amendments by the August 1, 2017 compliance date.
Securities and futures valuation – The Funds’ portfolio securities are valued as of the close of regular trading on the New York Stock Exchange (“NYSE”) (generally 4:00 p.m., Eastern time) on each business day the NYSE is open. Securities listed on the NYSE or other exchanges are valued on the basis of their last sale prices on the exchanges on which they are primarily traded. If there are no sales on that day, the securities are valued at the mean between the closing bid and
59
TFS CAPITAL INVESTMENT TRUST
NOTES TO FINANCIAL STATEMENTS (Continued)
ask prices on the NYSE or other primary exchange for that day. Securities which are quoted by NASDAQ are valued at the NASDAQ Official Closing Price. If there are no sales on that day, the securities are valued at the mean between the closing bid and ask prices as reported by NASDAQ.
Fixed income securities are generally valued using prices provided by an independent pricing service approved by the Trust’s Board of Trustees (the “Board”). The independent pricing service will employ methodologies that they believe are appropriate, including actual market transactions, broker-dealer supplied valuations, matrix pricing, or other electronic data processing techniques. These techniques generally consider such factors as security prices, yields, maturities, call features, ratings, and developments relating to specific securities in arriving at valuations.
Futures contracts that trade on exchanges that close at 4:00 p.m. Eastern time are valued at their closing price as quoted on their primary exchange. Futures contracts that trade on exchanges that close before 4:00 p.m. Eastern time are valued at their last sale price as of the close of regular trading on their primary exchange. Futures contracts that trade on exchanges that close after 4:00 p.m. Eastern time are valued at their last sale price on their primary exchange as of the close of the NYSE. If no closing price is readily available at the time of valuation, the futures contract will be valued at the closing bid price for that day as reported by the primary exchange. Prices for these futures contracts are monitored daily by the Adviser until 4:00 p.m. Eastern time to determine if fair valuation is required.
Investments in securities and other financial instruments for which no quotations are readily available are valued at fair value as determined in good faith under the supervision of the Board and will be classified as Level 2 or 3 within the fair value hierarchy (see below), depending on the inputs used.
GAAP establishes a single authoritative definition of fair value, sets out a framework for measuring fair value and requires additional disclosures about fair value measurements.
The Funds’ investments and other financial instruments have been categorized based upon a fair value hierarchy in accordance with the FASB’s guidance on fair value measurement. The levels of the fair value hierarchy and their applicability to the Funds are described below:
● | Level 1 inputs utilize quoted prices (unadjusted) in active markets for identical assets or liabilities at the reporting date. Level 1 assets and liabilities may include most common stocks, investment company shares, warrants, futures contracts and money market funds. |
● | Level 2 inputs utilize inputs other than quoted prices included in Level 1 that are observable for the asset or liability, either directly or indirectly. Level 2 inputs may include quoted prices for similar assets and liabilities in active markets and quoted prices for identical or similar assets or liabilities that are not active. Assets and liabilities included in this category may include common stocks and other securities that are not actively traded on an exchange, and fixed income obligations with values that are based on prices provided by an independent pricing service that utilizes various “other significant observable inputs” including bid and ask quotations, prices of similar securities and interest rates, among other factors. |
● | Level 3 inputs are unobservable inputs for the asset or liability and include situations where there is little, if any, market activity for the asset or liability. Assets and liabilities included in this category may include common stocks and other securities that trade infrequently or their trading has been halted for an extended period of time. |
60
TFS CAPITAL INVESTMENT TRUST
NOTES TO FINANCIAL STATEMENTS (Continued)
The inputs or methodologies used for valuing securities are not necessarily an indication of the risks associated with investing in those securities. The inputs used to measure fair value may fall into different levels of the fair value hierarchy. In such cases, for disclosure purposes, the level in the fair value hierarchy within which the fair value measurement falls in its entirety is determined based on the lowest level input that is significant to the fair value measurement. The Funds’ assessment of the significance of a particular input to the fair value measurement in its entirety requires judgment and considers factors specific to the asset or liability.
The availability of observable inputs can vary from security to security and is affected by a wide variety of factors, including, for example, the type of security, whether the security is new and not yet established in the marketplace, and other characteristics particular to the transaction. To the extent that valuation is based on models or inputs that are less observable or unobservable in the market, the determination of fair value requires more judgment. Accordingly, the degree of judgment exercised by the Funds in determining fair value is greatest for investments and other financial instruments categorized as Level 3.
The following is a summary of the inputs used to value the Funds’ investments, securities sold short and other financial instruments as of October 31, 2016:
TFS Market Neutral Fund | | Level 1 | | | Level 2 | | | Level 3 | | | Total | |
Investments in Securities: | |
Common Stocks | | $ | 292,833,829 | | | $ | 61,156 | | | $ | — | | | $ | 292,894,985 | |
Investment Companies | | | 11,134,446 | | | | — | | | | — | | | | 11,134,446 | |
Warrants | | | — | | | | 0 | * | | | — | | | | 0 | |
Money Market Funds | | | 4,653,154 | | | | — | | | | — | | | | 4,653,154 | |
Total | | $ | 308,621,429 | | | $ | 61,156 | | | $ | — | | | $ | 308,682,585 | |
Other Financial Instruments: | |
Common Stocks – Sold Short | | $ | (250,308,276 | ) | | $ | (479,116 | ) | | $ | 0 | * | | $ | (250,787,392 | ) |
Rights – Sold Short | | | — | | | | (934 | ) | | | — | | | | (934 | ) |
Warrants – Sold Short | | | (120 | ) | | | (163,882 | ) | | | — | | | | (164,002 | ) |
Total | | $ | (250,308,396 | ) | | $ | (643,932 | ) | | $ | 0 | | | $ | (250,952,328 | ) |
TFS Small Cap Fund | | Level 1 | | | Level 2 | | | Level 3 | | | Total | |
Investments in Securities: | |
Common Stocks | | $ | 66,449,792 | | | $ | — | | | $ | — | | | $ | 66,449,792 | |
Total | | $ | 66,449,792 | | | $ | — | | | $ | — | | | $ | 66,449,792 | |
61
TFS CAPITAL INVESTMENT TRUST
NOTES TO FINANCIAL STATEMENTS (Continued)
TFS Hedged Futures Fund | | Level 1 | | | Level 2 | | | Level 3 | | | Total | |
Investments in Securities: | |
U.S. Treasury Obligations | | $ | — | | | $ | 3,243,286 | | | $ | — | | | $ | 3,243,286 | |
Money Market Funds | | | 8,258,600 | | | | — | | | | — | | | | 8,258,600 | |
Total | | $ | 8,258,600 | | | $ | 3,243,286 | | | $ | — | | | $ | 11,501,886 | |
Other Financial Instruments: | |
Futures Contracts | | $ | 8,292 | | | $ | — | | | $ | — | | | $ | 8,292 | |
Futures Contracts – Sold Short | | | 59,172 | | | | — | | | | — | | | | 59,172 | |
Total | | $ | 67,464 | | | $ | — | | | $ | — | | | $ | 67,464 | |
* | TFS Market Neutral Fund holds Warrants and Common Stocks - Sold Short which have been fair valued at $0. |
Refer to each Fund’s Summary Schedule of Investments, Schedule of Securities Sold Short, Schedule of Futures Contracts and Schedule of Futures Contracts Sold Short, as applicable, for a listing of the securities by security type and sector or industry type.
It is the Funds’ policy to recognize transfers into and out of any Level at the end of the reporting period.
Transfers that occurred between Levels 1 and 2 on October 31, 2016 for TFS Market Neutral Fund are as follows:
| | Common
Stocks - Sold Short | |
Transfers from Level 1 to Level 2 | | $ | (479,116 | ) |
As of October 31, 2016, TFS Small Cap Fund and TFS Hedged Futures Fund did not have any transfers between any Levels. There were no Level 3 securities held by TFS Small Cap Fund or TFS Hedged Futures Fund as of October 31, 2016.
The following is a reconciliation of Level 3 other financial instruments of TFS Market Neutral Fund for which significant unobservable inputs were used to determine fair value between October 31, 2015 and October 31, 2016.
| | Other Financial Instruments | |
Balance as of October 31, 2015 | | $ | 0 | * |
Change in unrealized appreciation | | | — | |
Balance as of October 31, 2016 | | $ | 0 | * |
* | TFS Market Neutral Fund held Common Stocks – Sold Short as of October 31, 2015 and October 31, 2016 which have been determined to be Level 3 other financial instruments. |
The total amount of unrealized appreciation on TFS Market Neutral Fund’s Level 3 other financial instruments was $5,536,684 as of October 31, 2016.
62
TFS CAPITAL INVESTMENT TRUST
NOTES TO FINANCIAL STATEMENTS (Continued)
The following table summarizes the valuation techniques used and unobservable inputs approved and monitored by the Board to determine the fair value of TFS Market Neutral Fund’s Level 3 other financial instruments as of October 31, 2016:
| | Fair Value at
October 31,
2016 | | Valuation Technique | Unobservable Input | | Range | | Impact to Valuation from an Increase in Input** |
Common Stocks - Sold Short | | $ | 0 | * | Discount from last sale price | Discount Percentage | | | 100 | % | Increase |
* | TFS Market Neutral Fund holds Common Stocks – Sold Short which have been determined to be Level 3 investments and have been fair valued at $0. |
** | This column represents the directional change in the fair value of the Level 3 investments that would result in an increase from the corresponding input. A decrease to the unobservable input would have the opposite effect. Significant increases and decreases in these inputs in isolation could result in significantly higher or lower fair value measurements. |
Share valuation – The net asset value per share of each Fund is calculated daily by dividing the total value of its assets, less liabilities, by the number of shares outstanding. The offering price and redemption price per share of each Fund is equal to the net asset value per share.
Investment income (expense) – Dividend income (expense) is recorded on the ex-dividend date. Interest income is accrued as earned. Discounts and premiums on fixed income securities are amortized using the effective interest method. Withholding taxes on foreign dividends have been recorded in accordance with the Funds’ understanding of the appropriate country’s tax rules and tax rates.
Borrowing costs – From time to time, a Fund may have an overdrawn cash balance at the custodian due to redemptions or market movements. When this occurs, the Fund will incur borrowing costs charged by the custodian.
Security transactions – Security transactions are accounted for on the trade date. Realized gains and losses on securities sold are determined on a specific identification basis.
Distributions to shareholders – Distributions to shareholders arising from net investment income and net realized capital gains, if any, are declared and paid at least once each year. The amount of distributions from net investment income and net realized capital gains are determined in accordance with federal income tax regulations, which may differ from GAAP. These “book/tax” differences are permanent in nature and are primarily due to differing treatments of net short-term gains. The tax character of distributions paid by the Funds during the years ended October 31, 2016 and 2015 was as follows:
| | Years
Ended | | Ordinary Income | | | Long-Term Capital Gains | | | Total Distributions | |
TFS Market Neutral Fund | 10/31/2016 | | $ | 1,589,812 | | | $ | 26,857,357 | | | $ | 28,447,169 | |
| 10/31/2015 | | $ | — | | | $ | 28,360,770 | | | $ | 28,360,770 | |
TFS Small Cap Fund | 10/31/2016 | | $ | 2,778,851 | | | $ | 1,678,412 | | | $ | 4,457,263 | |
| | 10/31/2015 | | $ | 4,947,085 | | | $ | 1,615,377 | | | $ | 6,562,462 | |
63
TFS CAPITAL INVESTMENT TRUST
NOTES TO FINANCIAL STATEMENTS (Continued)
There were no distributions paid to shareholders by TFS Hedged Futures Fund during the years ended October 31, 2016 and 2015.
Short positions – The Funds may sell securities short. For financial statement purposes, an amount equal to the settlement amount is included in the Statements of Assets and Liabilities as an asset and an equivalent liability is then subsequently marked-to-market daily to reflect the current value of the short position. Subsequent fluctuations in the market prices of securities sold, but not yet purchased, may require purchasing the securities at prices which may differ from the market value reflected on the Statements of Assets and Liabilities. The Funds are liable for any dividends payable on securities while those securities are in a short position and will also bear other costs, such as charges for the prime brokerage accounts, in connection with the short positions. These costs are reported as brokerage expense on securities sold short in the Statements of Operations. As collateral for its short positions, the Funds are required under the Investment Company Act of 1940 (“1940 Act”) to maintain assets consisting of cash, cash equivalents or liquid securities equal to the market value of the securities sold short. The deposits with brokers for securities sold short are reported on the Statements of Assets and Liabilities. The amount of the collateral is required to be adjusted daily to reflect changes in the value of the securities sold short. TFS Market Neutral Fund and TFS Hedged Futures Fund both engage in short selling as a principal investment strategy while TFS Small Cap Fund does not. TFS Small Cap Fund currently intends to limit its exposure to short positions, if any, to 5% of its net assets. Short selling subjects a Fund to the potential for unlimited losses.
Option contracts – The Funds may use option contracts in any manner consistent with their investment objectives and as long as their use is consistent with relevant provisions of the 1940 Act. The Funds may use options for speculative investment purposes as well as for the purpose of seeking to reduce the overall investment risk that would otherwise be associated with the securities in which a Fund invests. When a Fund writes an option, an amount equal to the net premium (the premium less the commission) received by the Fund is recorded as a liability in the Fund’s Statement of Assets and Liabilities and is subsequently marked-to-market daily. Premiums received from writing options which expire are treated as realized gains. Premiums received from writing call options which are exercised increase the proceeds used to calculate the realized gain or loss on the sale of the security. Premiums received from writing put options which are exercised increase the basis of the security purchased. If a closing purchase transaction is used to terminate a Fund’s obligation on an option, a gain or loss will be realized, depending upon whether the price of the closing purchase transaction is more or less than the premium previously received on the option written.
Futures contracts – TFS Market Neutral Fund and TFS Hedged Futures Fund are subject to equity price risk, interest rate risk, foreign currency exchange rate risk, and commodity risk in the normal course of pursuing their investment objectives. These Funds may use futures contracts to gain exposure to or to hedge against changes in the value of equities, interest rates, foreign currencies or commodities. A futures contract represents a commitment for the future purchase or sale of an asset at a specified price on a specified date. When a Fund purchases or sells a futures contract, no price is paid to or received by the Fund upon the purchase or sale of the futures contract. Instead, the Fund is required to deposit in a segregated asset account an amount of cash or qualifying securities currently ranging from 5% to 15% of the contract amount. This is called the “initial margin deposit.” Subsequent payments, known as “variation margin,” are accumulated in a receivable or payable account by the Fund each day, depending on the daily fluctuations in
64
TFS CAPITAL INVESTMENT TRUST
NOTES TO FINANCIAL STATEMENTS (Continued)
the fair value of the underlying asset. The total of this account is received or paid by the Fund when the position is closed. The Fund recognizes an unrealized gain or loss equal to the daily variation margin. If market conditions change unexpectedly, the Fund may not achieve the anticipated benefits of the futures contracts and may realize a loss. The margin deposits for futures contracts and the variation margin receivable and/or payable are reported on the Statements of Assets and Liabilities.
Estimates – The preparation of financial statements in conformity with GAAP requires management to make estimates and assumptions that affect the reported amounts of assets and liabilities and disclosures of contingent assets and liabilities as of the date of the financial statements and the reported amounts of income and expenses during the reporting period. Actual results could differ from those estimates.
Common expenses – Common expenses of the Trust are allocated among the Funds based on the relative net assets of each Fund or the nature of the services performed and the relative applicability to each Fund.
Foreign Currency Translation – Amounts denominated in or expected to settle in foreign currencies are translated into U.S. dollars based on exchange rates on the following basis:
| | A. | The value of investment securities and other assets and liabilities are translated at exchange rates as of the NYSE close each day. |
| | B. | Purchases and sales of investment securities and income and expenses are translated at the rate of exchange prevailing on the respective date of such transactions. |
| | C. | The Funds do not isolate that portion of the results of operations caused by changes in foreign exchange rates on investments from those caused by changes in market prices of securities held. Such fluctuations are included with the net realized and unrealized gains or losses on investments. |
Reported net realized foreign exchange gains or losses arise from 1) purchases and sales of foreign currencies, 2) currency gains or losses realized between the trade and settlement dates on securities transactions and 3) the difference between the amounts of dividends, interest and foreign withholding taxes recorded on a Fund’s books and the U.S. dollar equivalent of the amounts actually received or paid. Reported net unrealized foreign exchange gains and losses arise from changes in the value of assets and liabilities that result from changes in exchange rates.
Forward Foreign Currency Exchange Contracts – TFS Market Neutral Fund may use forward foreign currency exchange contracts to hedge exposure to foreign currency. TFS Hedged Futures Fund may invest in forward foreign currency exchange contracts for speculative purposes. When the Adviser believes that the currency of a particular country may produce positive returns against the currency of another country, each of those Funds may purchase or sell forward foreign currency exchange contracts to gain exposure to the differential in currency returns. All foreign currency exchange contracts are “marked-to-market” daily at the applicable translation rates resulting in unrealized gains or losses. Realized and unrealized gains or losses from transactions in foreign currency exchange contracts will be included in a Fund’s Statement of Assets and Liabilities and Statement of Operations. Risks associated with these contracts include the potential inability of counterparties to meet the terms of their contracts and unanticipated movements in the value of a foreign currency relative to the U.S. dollar.
65
TFS CAPITAL INVESTMENT TRUST
NOTES TO FINANCIAL STATEMENTS (Continued)
Federal income tax – Each Fund has qualified and intends to continue to qualify as a “regulated investment company” under Subchapter M of the Internal Revenue Code of 1986 (the “Code”). Qualification generally will relieve the Funds of liability for federal income taxes to the extent 100% of their net investment income and net realized capital gains are distributed in accordance with the Code. Accordingly, no provision for income taxes has been made.
In order to avoid imposition of the federal excise tax applicable to regulated investment companies, it is also each Fund’s intention to declare as dividends in each calendar year at least 98% of its ordinary income (net investment income and specified gains and losses) and 98.2% of its net realized capital gains plus undistributed amounts from prior years.
The following information is computed on a tax basis for each item as of October 31, 2016:
| | TFS Market Neutral Fund | | | TFS Small Cap Fund | | | TFS Hedged Futures Fund | |
Tax cost of portfolio investments | | $ | 318,014,752 | | | $ | 66,943,371 | | | $ | 15,441,670 | |
Gross unrealized appreciation | | $ | 10,956,686 | | | $ | 3,185,431 | | | $ | — | |
Gross unrealized depreciation | | | (20,288,853 | ) | | | (3,679,010 | ) | | | (340,147 | ) |
Net unrealized depreciation on investments | | | (9,332,167 | ) | | | (493,579 | ) | | | (340,147 | ) |
Net unrealized appreciation on securities sold short | | | 27,661,181 | | | | — | | | | — | |
Unrealized losses on foreign currency transactions | | | (1 | ) | | | — | | | | (3 | ) |
Undistributed ordinary income | | | — | | | | 3,525,014 | | | | — | |
Undistributed long term gains | | | — | | | | 855,438 | | | | — | |
Accumulated capital and other losses | | | (28,934,535 | ) | | | — | | | | (687,616 | ) |
Other temporary differences | | | (342,235 | ) | | | — | | | | — | |
Accumulated earnings (deficit) | | $ | (10,947,757 | ) | | $ | 3,886,873 | | | $ | (1,027,766 | ) |
As of October 31, 2016, the tax proceeds from securities sold short is $278,613,509 for TFS Market Neutral Fund.
The difference between the federal income tax cost of portfolio investments and securities sold short and the financial statement cost for TFS Market Neutral Fund and TFS Small Cap Fund is due to certain timing differences in the recognition of capital gains or losses under GAAP. These “book/tax” differences are temporary in nature and are primarily due to the tax deferral of losses on wash sales. The difference between the federal income tax cost of investments and the financial statement cost for TFS Hedged Futures Fund is due to the tax treatment of the Fund’s wholly owned subsidiary as a controlled foreign corporation (CFC).
During the year ended October 31, 2016, TFS Hedged Futures Fund utilized $192,738 and $285,376 of short-term and long-term capital loss carryforwards, respectively, to offset current year gains.
66
TFS CAPITAL INVESTMENT TRUST
NOTES TO FINANCIAL STATEMENTS (Continued)
For the year ended October 31, 2016, the following reclassifications were made as a result of permanent differences between financial statement and income tax reporting requirements:
| | TFS Market Neutral Fund | | | TFS Small Cap Fund | | | TFS Hedged Futures Fund | |
Paid-in capital | | $ | (7,038,963 | ) | | $ | — | | | $ | (155,015 | ) |
Accumulated net investment loss | | | 8,225,376 | | | | 227,478 | | | | 49,324 | |
Accumulated net realized gains (losses) from securities transactions and other financial instruments | | | (1,186,413 | ) | | | (227,478 | ) | | | 105,691 | |
As of October 31, 2016, TFS Market Neutral Fund and TFS Hedged Futures Fund had the following capital loss carryforwards:
| | TFS Market Neutral Fund | | | TFS Hedged Futures Fund | |
Capital loss carryforward – short-term | | $ | — | | | $ | 176,238 | |
Capital loss carryforward – long-term | | | 2,112,803 | | | | 282,599 | |
Total capital loss carryforwards | | $ | 2,112,803 | | | $ | 458,837 | |
These capital loss carryforwards, which do not expire, may be utilized in future years to offset net realized capital gains, if any, prior to distributing such gains to shareholders.
Net qualified late year ordinary losses represent ordinary losses incurred after December 31, 2015. These losses are deemed to arise on the first day of the Fund’s next taxable year. For the year ended October 31, 2016, TFS Market Neutral Fund and TFS Hedged Futures Fund intend to defer $26,821,732 and $228,779, respectively, of late year ordinary losses to November 1, 2016 for federal income tax purposes.
The Funds recognize tax benefits or expenses of uncertain tax positions only when the position is “more likely than not” to be sustained assuming examination by tax authorities. Management has reviewed the tax positions taken on federal income tax returns for the current and all open tax periods of each Fund (October 31, 2013 through October 31, 2016 for TFS Market Neutral Fund and TFS Small Cap Fund and December 31, 2013 through October 31, 2016 for TFS Hedged Futures Fund) and has concluded that no provision for unrecognized tax benefits or expenses is required in these financial statements and does not expect this to change over the next twelve months. Each Fund identifies its major tax jurisdiction as U.S. Federal.
3. Investment Transactions
During the year ended October 31, 2016, cost of purchases and proceeds from sales of portfolio securities, other than short-term investments, U.S. government securities and short positions, amounted to $4,150,222,427 and $4,596,763,973, respectively, for TFS Market Neutral Fund; $626,964,590 and $659,454,093, respectively, for TFS Small Cap Fund; and $0 and $0, respectively, for TFS Hedged Futures Fund.
67
TFS CAPITAL INVESTMENT TRUST
NOTES TO FINANCIAL STATEMENTS (Continued)
4. Transactions with Related Parties
INVESTMENT ADVISORY AGREEMENT
Each Fund’s investments are managed by the Adviser pursuant to the terms of an Investment Advisory Agreement. TFS Market Neutral Fund, TFS Small Cap Fund and TFS Hedged Futures Fund pay the Adviser an investment advisory fee, computed and accrued daily and paid monthly, at an annual rate of 1.65%, 1.15% and 1.50%, respectively, of average daily net assets.
The Adviser has contractually agreed to reduce its advisory fees and to absorb each Fund’s operating expenses (for the life of the Funds) to the extent necessary to limit aggregate annual ordinary operating expenses (which do not include brokerage costs, taxes, borrowing costs such as interest and dividend expenses on securities sold short and extraordinary expenses) to 1.90% of TFS Market Neutral Fund’s average daily net assets, 1.50% of TFS Small Cap Fund’s average daily net assets and 1.80% of TFS Hedged Futures Fund’s average daily net assets. During the year ended October 31, 2016, the Adviser reduced its investment advisory fees by $438,414 with respect to TFS Market Neutral Fund, $199,648 with respect to TFS Small Cap Fund and $231,846 with respect to TFS Hedged Futures Fund.
Advisory fee reductions and expense reimbursements by the Adviser are subject to repayment by the applicable Fund for a period of three years after such fees and expenses were incurred, provided that such repayments do not cause ordinary operating expenses to exceed the expense caps of 1.90%, 1.50% and 1.80% for TFS Market Neutral Fund, TFS Small Cap Fund and TFS Hedged Futures Fund, respectively. As of October 31, 2016, the Adviser may in the future recoup fee reductions and expense reimbursements totaling $1,070,208, $468,007 and $623,395 from TFS Market Neutral Fund, TFS Small Cap Fund and TFS Hedged Futures Fund, respectively. The Adviser may recapture these amounts no later than the dates as stated below:
| | October 31,
2017 | | | October 31,
2018 | | | October 31,
2019 | |
TFS Market Neutral Fund | | $ | 205,839 | | | $ | 425,955 | | | $ | 438,414 | |
TFS Small Cap Fund | | $ | 77,861 | | | $ | 190,498 | | | $ | 199,648 | |
TFS Hedged Futures Fund | | $ | 157,600 | | | $ | 233,949 | | | $ | 231,846 | |
Certain Trustees and officers of the Trust are also officers of the Adviser.
COMPLIANCE CONSULTING AGREEMENT
Under the terms of a Compliance Consulting Agreement, Drake Compliance, LLC (“Drake”) provides ongoing regulatory compliance consulting, monitoring and reporting services for the Trust. In addition, a principal of Drake serves as the Trust’s Chief Compliance Officer. Drake receives $5,000 per month from the Trust, of which each Fund pays its proportionate share. In addition, each Fund reimburses certain out-of-pocket expenses incurred by Drake, if any, including, but not limited to, postage and supplies and travel expenses.
OTHER SERVICE PROVIDERS
Ultimus Fund Solutions, LLC (“Ultimus”) provides administration, fund accounting, compliance and transfer agent services to the Funds. The Funds pay Ultimus fees in accordance with the agreements for such services. In addition, each Fund pays out-of-pocket expenses including, but not limited to, postage, supplies and costs of pricing portfolio securities. Certain officers of
68
TFS CAPITAL INVESTMENT TRUST
NOTES TO FINANCIAL STATEMENTS (Continued)
the Trust are also officers of Ultimus or of Ultimus Fund Distributors, LLC (the “Distributor”), the principal underwriter of each Fund’s shares and an affiliate of Ultimus. The Distributor is compensated by the Adviser (not the Funds) for acting as principal underwriter.
COMPENSATION OF TRUSTEES
Trustees and officers affiliated with the Adviser or Ultimus are not compensated by the Trust for their services. Each Trustee who is not an affiliated person of the Adviser or Ultimus receives from the Trust an annual retainer of $20,000, paid quarterly; a fee of $7,500 for attendance at each in-person meeting of the Board; a fee of $2,500 for attendance at each telephonic regular meeting of the Board; and a fee of $1,500 for attendance at each telephonic special meeting of the Board. The Chairman of the Audit Committee receives an additional fee of $1,000 for each Audit Committee meeting attended. The Funds reimburse each Trustee and officer for his or her travel and other expenses relating to attendance at Board or committee meetings.
Rule 17a-7 is an exemptive rule under the Investment Company Act that permits purchase and sale transactions among affiliated investment companies, or between an investment company and a person that is affiliated solely by reason of having a common (or affiliated) investment adviser, common directors, and/or common officers. The Funds have policies and procedures pursuant to Rule 17a-7 to permit transactions between a Fund and an affiliated fund, subject to certain requirements. During the year ended October 31, 2016, none of the Funds entered into any transactions with any other affiliated fund.
5. Derivatives Transactions
Transactions in put option contracts written by TFS Market Neutral Fund during the year ended October 31, 2016 were as follows:
| | Option Contracts | | | Option Premiums | |
Written put options outstanding at beginning of year | | | — | | | $ | — | |
Put options written | | | 2,400 | | | | 797,210 | |
Put options cancelled in a closing purchase transaction | | | (2,400 | ) | | | (797,210 | ) |
Put options outstanding at end of year | | | — | | | $ | — | |
The derivative positions of TFS Hedged Futures Fund as of October 31, 2016 are recorded in the following locations in the Statements of Assets and Liabilities:
Derivative Investment Type | Location |
Futures contracts | Variation margin receivable (payable) |
69
TFS CAPITAL INVESTMENT TRUST
NOTES TO FINANCIAL STATEMENTS (Continued)
The following tables set forth the values of derivative contracts of TFS Hedged Futures Fund as of October 31, 2016:
TFS Hedged Futures Fund
Futures Contracts | |
| | | Variation Margin | | | Total | |
| | Receivable | | | (Payable) | |
Asset Derivatives | | | | | | | | | |
Futures Contracts | | | | | | | | | |
Commodity | | $ | 91,717 | | | $ | (83,425 | ) | | $ | 8,292 | |
Total Asset Derivatives | | | 91,717 | | | | (83,425 | ) | | | 8,292 | |
| | | | | | | | | | | | | |
Liability Derivatives | | | | | | | | | | | | |
Futures Contracts | | | | | | | | | | | | |
Commodity | | | 178,818 | | | | (116,764 | ) | | | 62,054 | |
Financial | | | 26,418 | | | | (29,292 | ) | | | (2,874 | ) |
Total Liability Derivatives | | | 205,236 | | | | (146,056 | ) | | | 59,180 | |
Total | | $ | 296,953 | | | $ | (229,481 | ) | | $ | 67,472 | |
Certain risks may arise upon entering into futures contracts from the potential inability of counterparties to meet the terms of their contracts. The maximum counterparty credit risk to the Funds is measured by the unrealized gain on appreciated contracts. No credit-risk-related contingent features exist for the futures contracts outstanding at October 31, 2016.
Transactions in derivative instruments for TFS Market Neutral Fund and TFS Hedged Futures Fund during the year ended October 31, 2016 are recorded in the following locations in the Statements of Operations:
TFS Market Neutral Fund |
Derivative Investment Type | Location |
Futures contracts | Net realized gains (losses) from futures contracts |
| | Net change in unrealized appreciation (depreciation) on futures contracts |
Equity put options written | Net realized gains (losses) from option contracts |
TFS Hedged Futures Fund | |
Derivative Investment Type | Location |
Futures contracts | Net realized gains (losses) from futures contracts |
| | Net change in unrealized appreciation (depreciation) on futures contracts |
70
TFS CAPITAL INVESTMENT TRUST
NOTES TO FINANCIAL STATEMENTS (Continued)
The following is a summary of net realized gains (losses) and net change in unrealized appreciation (depreciation) on derivative instruments for TFS Market Neutral Fund and TFS Hedged Futures Fund recognized in the Statements of Operations during the year ended October 31, 2016:
Type of Derivative | | Net Realized Gains (Losses) | | | Net Change in Unrealized Appreciation (Depreciation) | |
TFS Market Neutral Fund | | | | | | |
Futures contracts | | | | | | |
Financial | | $ | 3,498,756 | | | $ | 1,021,348 | |
| | | | | | | | | |
Total | | $ | 3,498,756 | | | $ | 1,021,348 | |
TFS Hedged Futures Fund | | | | | | | | |
Futures contracts | | | | | | | | |
Commodity | | $ | 386,323 | | | $ | 89,305 | |
Financial | | | (102,981 | ) | | | (115,535 | ) |
Total | | $ | 283,342 | | | $ | (26,230 | ) |
TFS Small Cap Fund had no transactions in derivative instruments during the year ended October 31, 2016.
In the ordinary course of business, TFS Market Neutral Fund and TFS Hedged Futures Fund may enter into transactions subject to enforceable netting agreements or other similar arrangements (“netting agreements”). Generally, the right to offset in netting agreements allows the Funds to offset any exposure to a specific counterparty with any collateral received or delivered to that counterparty based on the terms of the agreements. Generally, the Funds manage their cash collateral securities and securities collateral on a counterparty basis.
As of October 31, 2016, the offsetting of financial assets and derivatives assets is as follows:
TFS Hedged Futures Fund | |
Description | | Gross Amounts of Recognized Assets | | | Gross Amounts Offset in Statements of Assets and Liabilities | | | Net Amounts of Assets Presented in Statements of Assets and Liabilities | | | Collateral Pledged | | | Net Amount | |
Variation margin receivable - futures contracts | | $ | 296,953 | | | $ | — | | | $ | 296,953 | | | $ | — | | | $ | 296,953 | |
Total subject to a master netting or similar arrangement | | $ | 296,953 | | | $ | — | | | $ | 296,953 | | | $ | — | | | $ | 296,953 | |
71
TFS CAPITAL INVESTMENT TRUST
NOTES TO FINANCIAL STATEMENTS (Continued)
Offsetting of financial liabilities and derivative liabilities as of October 31, 2016 is as follows:
TFS Hedged Futures Fund | |
Description | | Gross Amounts of Recognized Liabilities | | | Gross Amounts Offset in Statements of Assets and Liabilities | | | Net Amounts of Liabilities Presented in Statements of Assets and Liabilities | | | Collateral Pledged | | | Net Amount | |
Variation margin payable - futures contracts | | $ | (229,481 | ) | | $ | — | | | $ | (229,481 | ) | | $ | — | | | $ | (229,481 | ) |
Total subject to a master netting or similar arrangement | | $ | (229,481 | ) | | $ | — | | | $ | (229,481 | ) | | $ | — | | | $ | (229,481 | ) |
6. Certain Investments and Risks
The securities in which the Funds invest, as well as the risks associated with these securities and with the investment programs of the Funds, are described in the Funds’ Prospectuses. Among these risks are those associated with investments in derivative instruments and investments in shares of money market mutual funds.
Risks of Derivative Instruments – The use of derivative instruments, including futures contracts, requires special skills and knowledge of investment techniques that are different than those normally required for purchasing and selling common stock. If the Adviser uses a derivative instrument at the wrong time or incorrectly identifies market conditions, or if the derivative instrument does not perform as expected, these strategies may significantly reduce the Fund’s return. In addition, the Fund may be unable to close out a position because the market for a futures contract may become illiquid.
Investments in Money Market Funds – In order to maintain sufficient liquidity to implement investment strategies, or for temporary defensive purposes, each Fund may invest a significant portion of its assets in shares of one or more money market mutual funds. An investment in a money market mutual fund is not insured or guaranteed by the Federal Deposit Insurance Corporation or any other governmental agency, entity or person. While investor losses in money market mutual funds have been rare, they have occurred. In addition, indirect expenses will be incurred due to acquired fund fees and other costs to the extent of the investment in shares of money market mutual funds. As of October 31, 2016, TFS Hedged Futures Fund had 50.8% of the value of its net assets invested in shares of money market mutual funds registered under the 1940 Act. As of October 31, 2016, TFS Market Neutral Fund and TFS Small Cap Fund did not have a significant portion of their net assets invested in shares of money market mutual funds.
72
TFS CAPITAL INVESTMENT TRUST
NOTES TO FINANCIAL STATEMENTS (Continued)
7. Contingencies and Commitments
The Funds indemnify the Trust’s officers and Trustees for certain liabilities that might arise from their performance of their duties to the Funds. Additionally, in the normal course of business the Funds enter into contracts that contain a variety of representations and warranties and which provide general indemnifications. The Funds’ maximum exposure under these arrangements is unknown, as this would involve future claims that may be made against the Funds that have not yet occurred. However, based on experience, the Funds expect the risk of loss to be remote.
8. Subsequent Events
The Funds are required to recognize in the financial statements the effects of all subsequent events that provide additional evidence about conditions that existed as of the date of the Statements of Assets and Liabilities. For non-recognized subsequent events that must be disclosed to keep the financial statements from being misleading, the Funds are required to disclose the nature of the event as well as an estimate of its financial effect, or a statement that such an estimate cannot be made. Management has evaluated subsequent events through the issuance of these financial statements and has noted no such events.
73
TFS CAPITAL INVESTMENT TRUST
REPORT OF INDEPENDENT REGISTERED
PUBLIC ACCOUNTING FIRM
The Board of Trustees and Shareholders of
TFS Capital Investment Trust
We have audited the accompanying statements of assets and liabilities of TFS Market Neutral Fund and TFS Small Cap Fund and consolidated statement of assets and liabilities of the TFS Hedged Futures Fund (collectively the “Funds”) each a series of the TFS Capital Investment Trust (the “Trust”), including the summary schedule of investments and schedule of securities sold short for TFS Market Neutral Fund, the summary schedule of investments for TFS Small Cap Fund, and the consolidated schedule of investments, consolidated schedule of futures contracts, and consolidated schedule of futures contracts sold short for TFS Hedged Futures Fund, as of October 31, 2016, and the related statements of operations of TFS Market Neutral Fund and TFS Small Cap Fund for the year then ended, the consolidated statement of operations of TFS Hedged Futures Fund for the year then ended, the statements of changes in net assets of TFS Market Neutral Fund and TFS Small Cap Fund for each of the two years in the period then ended, the consolidated statements of changes in net assets of TFS Hedged Futures Fund for each of the two years in the period then ended, the financial highlights for TFS Market Neutral Fund and TFS Small Cap Fund for each of the four years in the period then ended and the consolidated financial highlights for TFS Hedged Futures Fund for each of the four years in the period then ended. These financial statements and financial highlights are the responsibility of the Funds’ management. Our responsibility is to express an opinion on these financial statements and financial highlights based on our audits. The financial highlights presented herein for the year ended October 31, 2012 and prior were audited by another registered public accounting firm whose report dated December 24, 2012 expressed an unqualified opinion on those financial statements.
We conducted our audits in accordance with the standards of the Public Company Accounting Oversight Board (United States). Those standards require that we plan and perform the audits to obtain reasonable assurance about whether the financial statements and financial highlights are free of material misstatement. We were not engaged to perform an audit of the Funds’ internal control over financial reporting. Our audits included consideration of internal control over financial reporting as a basis for designing audit procedures that are appropriate in the circumstances, but not for the purpose of expressing an opinion on the effectiveness of the Funds’ internal control over financial reporting. Accordingly, we express no such opinion. An audit also includes examining, on a test basis, evidence supporting the amounts and disclosures in the financial statements and financial highlights, assessing the accounting principles used and significant estimates made by management, and evaluating the overall financial statement presentation. Our procedures included confirmation of securities owned as of October 31, 2016, by correspondence with the custodian and brokers or by other appropriate auditing procedures where replies from brokers were not received. We believe that our audits provide a reasonable basis for our opinion.
In our opinion, the financial statements and financial highlights referred to above present fairly, in all material respects, the financial positions of TFS Market Neutral Fund and TFS Small Cap Fund and the consolidated financial position of TFS Hedged Futures Fund constituting TFS Capital Investment Trust at October 31, 2016, the results of their operations (consolidated results of its operations for TFS Hedged Futures Fund) for the year then ended, the changes in their net assets (consolidated changes in its net assets for TFS Hedged Futures Fund) for each of the two years in the period then ended and the financial highlights (consolidated financial highlights for TFS Hedged Futures Fund) for each of the four years in the period then ended, in conformity with U.S. generally accepted accounting principles.
Cincinnati, Ohio
December 29, 2016
74
TFS CAPITAL INVESTMENT TRUST
ABOUT YOUR FUNDS’ EXPENSES (Unaudited)
We believe it is important for you to understand the impact of costs on your investment. As a shareholder of the Funds, you incur two types of costs: (1) transaction costs and (2) ongoing costs, including management fees and other Fund expenses. The following examples are intended to help you understand your ongoing costs (in dollars) of investing in the Funds and to compare these costs with the ongoing costs of investing in other mutual funds.
A mutual fund’s ongoing costs are expressed as a percentage of its average net assets. This figure is known as the expense ratio. The ongoing costs reflected in the table are based on an investment of $1,000 made at the beginning of the most recent semi-annual period (May 1, 2016) and held until the end of the period (October 31, 2016).
The table below illustrates each Fund’s ongoing costs in two ways:
Actual fund return – This section helps you to estimate the actual expenses that you paid over the period. The “Ending Account Value” shown is derived from each Fund’s actual return, and the fourth column shows the dollar amount of operating expenses that would have been paid by an investor who started with $1,000 in the Funds. You may use the information here, together with the amount you invested, to estimate the expenses that you paid over the period.
To do so, simply divide your account value by $1,000 (for example, an $8,600 account value divided by $1,000 = 8.6), then multiply the result by the number given for the Funds under the heading “Expenses Paid During Period.”
Hypothetical 5% return – This section is intended to help you compare each Fund’s ongoing costs with those of other mutual funds. It assumes that each Fund had an annual return of 5% before expenses during the period shown, but that the expense ratio is unchanged. In this case, because the return used is not each Fund’s actual return, the results do not apply to your investment. The example is useful in making comparisons because the SEC requires all mutual funds to calculate expenses based on a 5% return. You can assess each Fund’s ongoing costs by comparing this hypothetical example with the hypothetical examples that appear in shareholder reports of other funds.
Note that expenses shown in the table are meant to highlight and help you compare ongoing costs only. The calculations below assume no shares were bought or sold during the period. Your actual costs may have been higher or lower, depending on the amount of your investment and the timing of any purchases or redemptions.
More information about each Fund’s expenses, including annual expense ratios, can be found in this report. For additional information on operating expenses and other shareholder costs, please refer to each Fund’s summary prospectus.
75
TFS CAPITAL INVESTMENT TRUST
ABOUT YOUR FUNDS’ EXPENSES (Unaudited) (Continued)
| Beginning
Account Value
May 1, 2016 | Ending
Account Value
October 31, 2016 | Net
Expense Ratio(a) | Expenses Paid During Period(b) |
TFS Market Neutral Fund | | | | |
Based on Actual Fund Return | $ 1,000.00 | $ 1,021.50 | 7.16% | $ 36.38 |
Based on Hypothetical 5% Return (before expenses) | $ 1,000.00 | $ 989.14 | 7.16% | $ 35.80 |
TFS Small Cap Fund | | | | |
Based on Actual Fund Return | $ 1,000.00 | $ 1,048.60 | 1.51% | $ 7.78 |
Based on Hypothetical 5% Return (before expenses) | $ 1,000.00 | $ 1,017.55 | 1.51% | $ 7.66 |
TFS Hedged Futures Fund | | | | |
Based on Actual Fund Return | $ 1,000.00 | $ 1,000.90 | 1.80% | $ 9.05 |
Based on Hypothetical 5% Return (before expenses) | $ 1,000.00 | $ 1,016.09 | 1.80% | $ 9.12 |
(a) | Annualized, based on the Fund’s most recent one-half year expenses. |
(b) | Expenses are equal to each Fund’s annualized expense ratio multiplied by the average account value over the period, multiplied by 184/366 (to reflect the one-half year period). |
76
TFS CAPITAL INVESTMENT TRUST
OTHER INFORMATION (Unaudited)
A description of the policies and procedures that the Funds use to determine how to vote proxies relating to portfolio securities is available without charge upon request by calling toll-free 1-888-534-2001, or on the SEC’s website at http://www.sec.gov. Information regarding how the Funds voted proxies relating to portfolio securities during the most recent 12-month period ended June 30 is also available without charge upon request by calling toll-free 1-888-534-2001, or on the SEC’s website at http://www.sec.gov.
The Funds file a complete listing of portfolio holdings with the SEC as of the end of the first and third quarters of each fiscal year on Form N-Q. The filings are available upon request, by calling 1-888-534-2001. Furthermore, you may obtain copies of the filings on the SEC’s website at http://www.sec.gov. The Funds’ Forms N-Q may also be reviewed and copied at the SEC’s Public Reference Room in Washington, DC, and information on the operation of the Public Reference Room may be obtained by calling 1-800-SEC-0330.
The net asset values for the Funds are published daily at the Funds’ website at http://www.tfscapital.com.
77
TFS CAPITAL INVESTMENT TRUST
BOARD OF TRUSTEES AND OFFICERS (Unaudited) |
Overall responsibility for management of the Trust rests with its Trustees. The Trustees serve for terms of indefinite duration until death, resignation, retirement or removal from office. The Trustees, in turn, elect the officers of the Trust to actively supervise the Trust’s day-to-day operations. The officers have been elected for an annual term. Certain officers of the Trust also may serve as Trustees. The Trust is managed by the Trustees in accordance with the laws of the State of Ohio governing business trusts. There are currently four Trustees, three of whom are not “interested persons” of the Trust within the meaning of that term under the 1940 Act. The Trustees and executive officers of the Trust, their addresses and their principal occupations during the past five (5) years are as follows:
Name,
Address
and Year of Birth | Length of Time Served | Position(s) Held with Trust | Principal Occupation(s)
During Past 5 Years
and Directorships of
Public Companies ** | Number of Portfolios in Fund Complex Overseen by Trustee |
Interested Trustees: | | | | |
*Eric S. Newman 10 N. High Street, Suite 500
West Chester, Pennsylvania 19380 Year of Birth: 1974 | Trustee Since May 2016; President Since January 2015 | Trustee/President | Owner, Co-Portfolio Manager and Chief Investment Officer of TFS Capital LLC | 3 |
Independent Trustees: | | | | |
Mark J. Malone 10 N. High Street, Suite 500 West Chester, Pennsylvania 19380 Year of Birth: 1966 | Since June 2004 | Trustee | Managing Director of Guggenheim Securities LLC since February 2015; Managing Director of Janney Capital Markets from December 2013 to February 2015; Managing Director of Lazard Capital Markets from March 2008 to December 2013 | 3 |
Brian O’Connell 10 N. High Street, Suite 500 West Chester, Pennsylvania 19380 Year of Birth: 1959 | Since June 2004 | Trustee | Independent writer/author | 3 |
Gregory R. Owens 10 N. High Street, Suite 500 West Chester, Pennsylvania 19380 Year of Birth: 1966 | Since October 2011 | Trustee | Managing Director with the Fahrenheit Group since April 2015; Finance Executive with Capital One Financial Corporation from 1996 to 2015; CPA and auditor with Arthur Andersen & Co. from 1998 to 1994 | 3 |
78
TFS CAPITAL INVESTMENT TRUST
BOARD OF TRUSTEES AND OFFICERS (Unaudited)
(Continued) |
Name,
Address
and Year of Birth | Length
of Time
Served | Position(s) Held with Trust | Principal Occupation(s)
During Past 5 Years |
Executive Officers: | | | |
Kevin Gates*** 10 N. High Street, Suite 500 West Chester, Pennsylvania 19380 Year of Birth: 1971 | Since October 2011 | Vice President | Owner and Co-Portfolio Manager of TFS Capital LLC |
Richard Gates*** 10 N. High Street, Suite 500 West Chester, Pennsylvania 19380 Year of Birth: 1971 | Since October 2011 | Vice President | Owner and Co-Portfolio Manager of TFS Capital LLC |
Robert G. Dorsey 225 Pictoria Drive, Suite 450 Cincinnati, Ohio 45246 Year of Birth: 1957 | Since June 2004 | Vice President | Managing Director of Ultimus Fund Solutions, LLC and Ultimus Fund Distributors, LLC |
Jennifer L. Leamer 225 Pictoria Drive, Suite 450 Cincinnati, Ohio 45246 Year of Birth: 1976 | Since June 2016 | Treasurer | V.P., Mutual Fund Controller of Ultimus Fund Solutions, LLC (2014 to present); Business Analyst of Ultimus Fund Solutions, LLC (2007 to 2014) |
Wade R. Bridge 225 Pictoria Drive, Suite 450 Cincinnati, Ohio 45246 Year of Birth: 1968 | Since June 2011 | Secretary | Director of Administration of Ultimus Fund Solutions, LLC and Vice President of Ultimus Fund Distributors, LLC |
David D. Jones 18630 Crosstimber
San Antonio, Texas 78258 Year of Birth: 1957 | Since December 2007 | Chief Compliance Officer | Managing Member of Drake Compliance, LLC |
* | Eric S. Newman is an affiliated person of TFS Capital LLC, the Trust’s investment adviser, and is considered an “interested person” of the Trust within the meaning of Section 2(a)(19) of the 1940 Act. |
** | None of the Trustees are directors of public companies. |
*** | Kevin Gates and Richard Gates are brothers. |
Additional information about members of the Board of Trustees and executive officers is available in the Statement of Additional Information (“SAI”). To obtain a free copy of the SAI, please call 1-888-534-2001.
79
TFS CAPITAL INVESTMENT TRUST
FEDERAL TAX INFORMATION (Unaudited) |
In accordance with federal tax requirements, the following provides shareholders with information concerning distributions made by the Funds during the fiscal year ended October 31, 2016. Certain dividends paid by the Funds may be subject to a maximum tax rate of 15%, as provided by the Jobs and Growth Tax Relief Reconciliation Act of 2003. TFS Market Neutral Fund and TFS Small Cap Fund intend to designate up to a maximum amount of $1,589,812 and $2,778,851, respectively, as taxed at a maximum rate of 15%. Additionally, TFS Market Neutral Fund and TFS Small Cap Fund intend to designate $26,857,357 and $1,678,412, respectively, as long-term capital gain distributions.
80
This page intentionally left blank.
As of the end of the period covered by this report, the registrant has adopted a code of ethics that applies to the registrant’s principal executive officer, principal financial officer, principal accounting officer or controller, or persons performing similar functions, regardless of whether these individuals are employed by the registrant or a third party. Pursuant to Item 12(a)(1), a copy of registrant’s code of ethics is filed as an exhibit to this Form N-CSR. During the period covered by this report, the code of ethics has not been amended, and the registrant has not granted any waivers, including implicit waivers, from the provisions of the code of ethics.
The registrant’s board of trustees has determined that the registrant has at least one audit committee financial expert serving on its audit committee. The name of the audit committee financial expert is Gregory R. Owens. Mr. Owens is “independent” for purposes of this Item.
The registrant has not adopted procedures by which shareholders may recommend nominees to the registrant’s board of trustees.
(a) Based on their evaluation of the registrant’s disclosure controls and procedures (as defined in Rule 30a-3(c) under the Investment Company Act of 1940) as of a date within 90 days of the filing date of this report, the registrant’s principal executive officer and principal financial officer have concluded that such disclosure controls and procedures are reasonably designed and are operating effectively to ensure that material information relating to the registrant, including its consolidated subsidiaries, is made known to them by others within those entities, particularly during the period in which this report is being prepared, and that the information required in filings on Form N-CSR is recorded, processed, summarized, and reported on a timely basis.
(b) There were no changes in the registrant’s internal control over financial reporting (as defined in Rule 30a-3(d) under the Investment Company Act of 1940) that occurred during the second fiscal quarter of the period covered by this report that have materially affected, or are reasonably likely to materially affect, the registrant’s internal control over financial reporting.
File the exhibits listed below as part of this Form. Letter or number the exhibits in the sequence indicated.
(a)(1) Any code of ethics, or amendment thereto, that is the subject of the disclosure required by Item 2, to the extent that the registrant intends to satisfy the Item 2 requirements through filing of an exhibit: Attached hereto
(a)(2) A separate certification for each principal executive officer and principal financial officer of the registrant as required by Rule 30a-2(a) under the Act (17 CFR 270.30a-2(a)): Attached hereto
(a)(3) Any written solicitation to purchase securities under Rule 23c-1 under the Act (17 CFR 270.23c-1) sent or given during the period covered by the report by or on behalf of the registrant to 10 or more persons: Not applicable
(b) Certifications required by Rule 30a-2(b) under the Act (17 CFR 270.30a-2(b)): Attached hereto
Pursuant to the requirements of the Securities Exchange Act of 1934 and the Investment Company Act of 1940, the registrant has duly caused this report to be signed on its behalf by the undersigned, thereunto duly authorized.