PORTFOLIO OVERVIEW
AS OF DECEMBER 31, 2004
Supplemental Analyst Package
Fourth Quarter 2004 Earnings Call
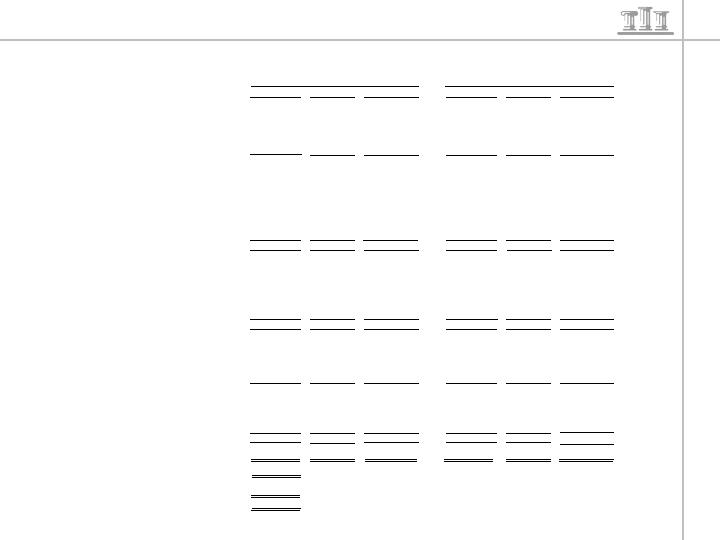
Property
Primary University Served
Units
Beds
Occupancy
Owned off-campus properties:
Commons On Apache
Arizona State University Main Campus
111
444
100.0%
(1)
The Village at Blacksburg
Virginia Polytechnic Institute and State University
288
1,056
98.6%
The Village on University
Arizona State University Main Campus
288
918
95.1%
River Club Apartments
The University of Georgia – Athens
266
794
93.3%
River Walk Townhomes
The University of Georgia – Athens
100
340
98.2%
The Callaway House
Texas A&M University
173
538
101.9%
The Village at Alafaya Club
The University of Central Florida
228
840
96.5%
The Village at Science Drive
The University of Central Florida
192
732
99.5%
University Village at Boulder Creek
The University of Colorado at Boulder
82
309
87.1%
University Village at Fresno
California State University – Fresno
105
406
99.5%
University Village at San Bernardino
(2)
California State University – San Bernardino
132
480
95.6%
University Village at TU
Temple University
220
749
99.7%
University Village at Sweet Home
(3)
State University of New York – Buffalo
269
828
n/a
Total owned off-campus properties
2,454
8,434
97.3%
On-campus participating properties:
University Village—PVAMU
Prairie View A&M University
612
1,920
99.2%
University College—PVAMU
Prairie View A&M University
756
1,470
98.6%
University Village—TAMIU
Texas A&M International University
84
252
66.3%
Cullen Oaks Phase I
The University of Houston
231
525
98.3%
Cullen Oaks Phase II
(3)
The University of Houston
180
354
n/a
Total on-campus participating properties
1,863
4,521
96.9%
Total – all properties
4,317
12,955
97.1%
(1) Commons on Apache is 100% leased for the 2004-2005 academic year by Arizona State University.
(2) In November 2004, California State University exercised its option to purchase this property for $28.3 million. This disposition was consummated in January 2005.
(3) Currently under development with a scheduled completion date of August 2005.
6