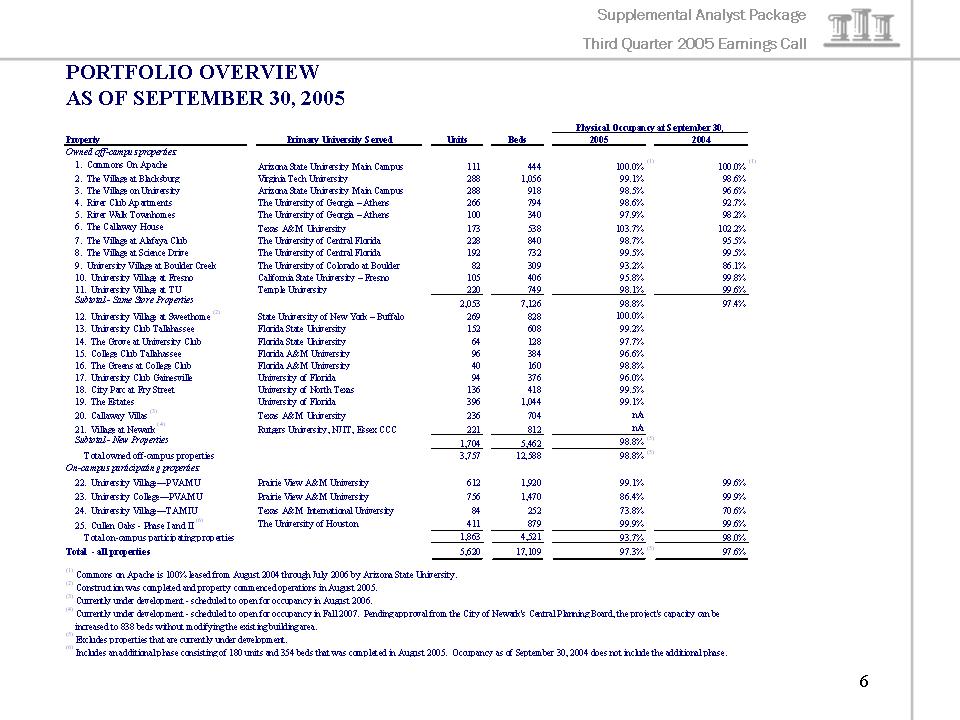
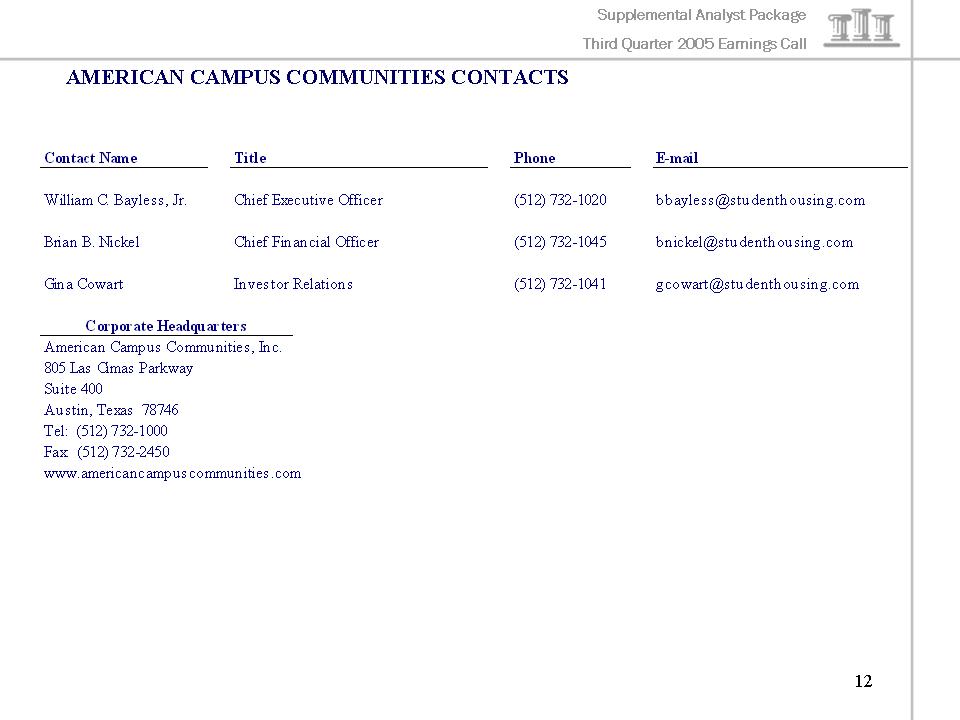
| | | | | | | | | Physical Occupancy at September 30, | | | |
Property | | Primary University Served | | Units | | Beds | | 2005 | | | | 2004 | | | |
Owned off-campus properties: | | | | | | | | | | | | | | | | | | | | | | |
| 1. Commons On Apache | | | Arizona State University Main Campus | | | 111 | | | 444 | | | 100.0 | % | | (1 | ) | | 100.0 | % | | (1 | ) |
| 2. The Village at Blacksburg | | | Virginia Tech University | | | 288 | | | 1,056 | | | 99.1 | % | | | | | 98.6 | % | | | |
| 3. The Village on University | | | Arizona State University Main Campus | | | 288 | | | 918 | | | 98.5 | % | | | | | 96.6 | % | | | |
| 4. River Club Apartments | | | The University of Georgia – Athens | | | 266 | | | 794 | | | 98.6 | % | | | | | 92.7 | % | | | |
| 5. River Walk Townhomes | | | The University of Georgia – Athens | | | 100 | | | 340 | | | 97.9 | % | | | | | 98.2 | % | | | |
| 6. The Callaway House | | | Texas A&M University | | | 173 | | | 538 | | | 103.7 | % | | | | | 102.2 | % | | | |
| 7. The Village at Alafaya Club | | | The University of Central Florida | | | 228 | | | 840 | | | 98.7 | % | | | | | 95.5 | % | | | |
| 8. The Village at Science Drive | | | The University of Central Florida | | | 192 | | | 732 | | | 99.5 | % | | | | | 99.5 | % | | | |
| 9. University Village at Boulder Creek | | | The University of Colorado at Boulder | | | 82 | | | 309 | | | 93.2 | % | | | | | 86.1 | % | | | |
| 10. University Village at Fresno | | | California State University – Fresno | | | 105 | | | 406 | | | 95.8 | % | | | | | 99.8 | % | | | |
| 11. University Village at TU | | | Temple University | | | 220 | | | 749 | | | 98.1 | % | | | | | 99.6 | % | | | |
Subtotal - Same Store Properties | | | | | | 2,053 | | | 7,126 | | | 98.8 | % | | | | | 97.4 | % | | | |
12. University Village at Sweethome (2) | | | State University of New York – Buffalo | | | 269 | | | 828 | | | 100.0 | % | | | | | | | | | |
| 13. University Club Tallahassee | | | Florida State University | | | 152 | | | 608 | | | 99.2 | % | | | | | | | | | |
| 14. The Grove at University Club | | | Florida State University | | | 64 | | | 128 | | | 97.7 | % | | | | | | | | | |
| 15. College Club Tallahassee | | | Florida A&M University | | | 96 | | | 384 | | | 96.6 | % | | | | | | | | | |
| 16. The Greens at College Club | | | Florida A&M University | | | 40 | | | 160 | | | 98.8 | % | | | | | | | | | |
| 17. University Club Gainesville | | | University of Florida | | | 94 | | | 376 | | | 96.0 | % | | | | | | | | | |
| 18. City Parc at Fry Street | | | University of North Texas | | | 136 | | | 418 | | | 99.5 | % | | | | | | | | | |
| 19. The Estates | | | University of Florida | | | 396 | | | 1,044 | | | 99.1 | % | | | | | | | | | |
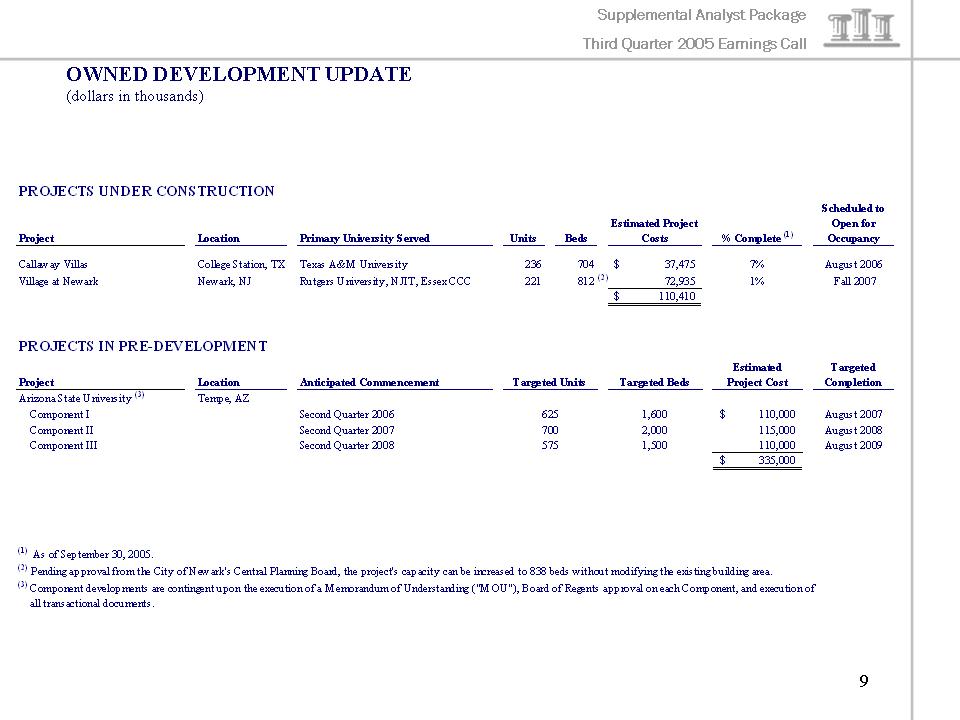
20. Callaway Villas (3) | | | Texas A&M University | | | 236 | | | 704 | | | n/a | | | | | | | | | | |
21. Village at Newark (4) | | | Rutgers University, NJIT, Essex CCC | | | 221 | | | 812 | | | n/a | | | | | | | | | | |
Subtotal - New Properties | | | | | | 1,704 | | | 5,462 | | | 98.8 | % | | (5 | ) | | | | | | |
| Total owned off-campus properties | | | | | | 3,757 | | | 12,588 | | | 98.8 | % | | (5 | ) | | | | | | |
On-campus participating properties: | | | | | | | | | | | | | | | | | | | | | | |
| 22. University Village—PVAMU | | | Prairie View A&M University | | | 612 | | | 1,920 | | | 99.1 | % | | | | | 99.6 | % | | | |
| 23. University College—PVAMU | | | Prairie View A&M University | | | 756 | | | 1,470 | | | 86.4 | % | | | | | 99.9 | % | | | |
| 24. University Village—TAMIU | | | Texas A&M International University | | | 84 | | | 252 | | | 73.8 | % | | | | | 70.6 | % | | | |
25. Cullen Oaks - Phase I and II (6) | | | The University of Houston | | | 411 | | | 879 | | | 99.9 | % | | | | | 99.6 | % | | | |
| Total on-campus participating properties | | | | | | 1,863 | | | 4,521 | | | 93.7 | % | | | | | 98.0 | % | | | |
Total - all properties | | | | | | 5,620 | | | 17,109 | | | 97.3 | % | | (5 | ) | | 97.6 | % | | | |
| | | | | | | | | | | | | | | | | | | | | | | |
(1) Commons on Apache is 100% leased from August 2004 through July 2006 by Arizona State University. | | | | | | | | | | | | | | | | | | | |
(2) Construction was completed and property commenced operations in August 2005. | | | | | | | | | | | | | | | | | | | | | | |
(3) Currently under development - scheduled to open for occupancy in August 2006. | | | | | | | | | | | | | | | | | | | | | | |
(4) Currently under development - scheduled to open for occupancy in Fall 2007. Pending approval from the City of Newark's Central Planning Board, the project's capacity can be | | | | | | | |
| increased to 838 beds without modifying the existing building area. | | | | | | | | | | | | | | | | | | | | | | |
(5) Excludes properties that are currently under development. | | | | | | | | | | | | | | | | | | | | | | |
(6) Includes an additional phase consisting of 180 units and 354 beds that was completed in August 2005. Occupancy as of September 30, 2004 does not include the additional phase. |
| | | | | | | | | | | | | | | | | | | | | | | |