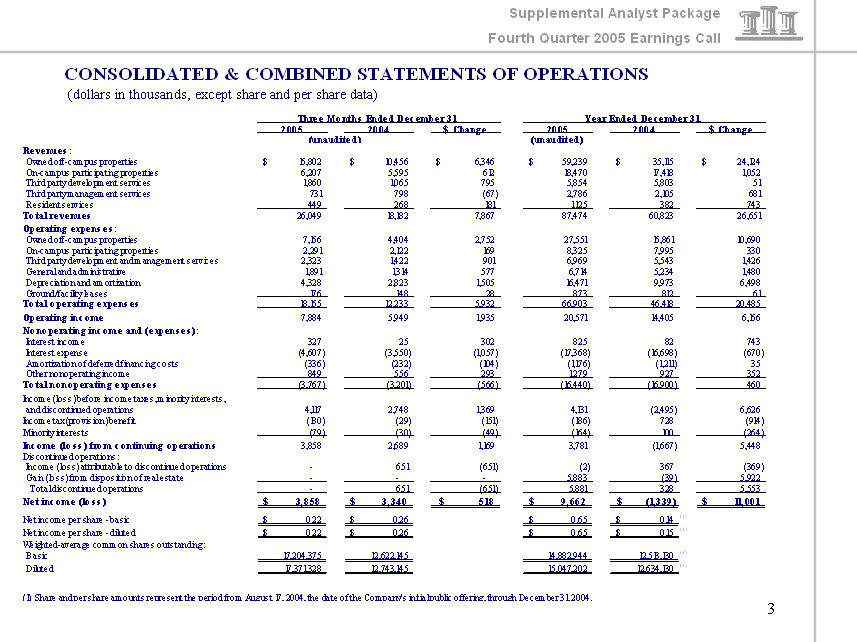
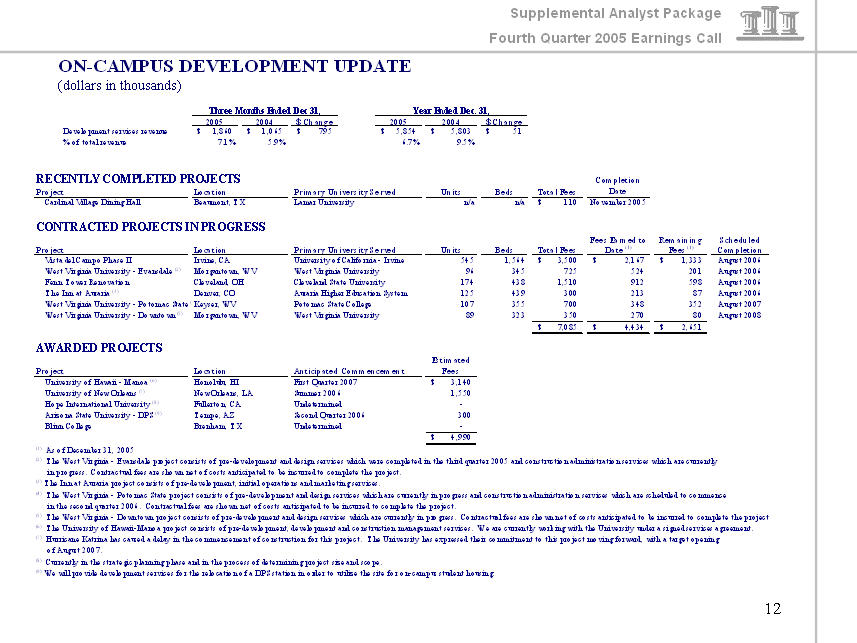
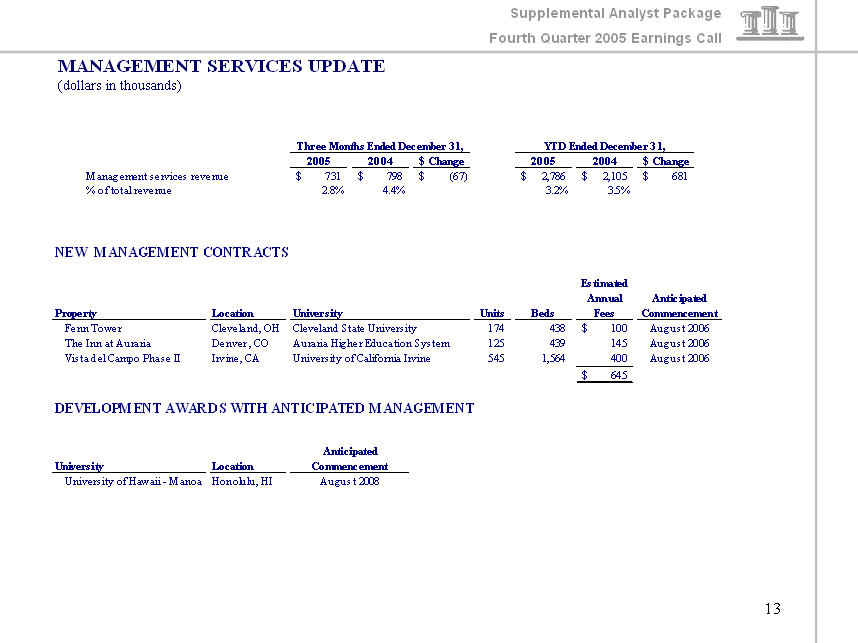
Supplemental Analyst Package Fourth Quarter 2005 Earnings Call CONSOLIDATED & COMBINED STATEMENTS OF OPERATIONS (dollars in thousands, except share and per share data) Three Months Ended December 31, Year Ended December 31, 2005 2004 $ Change 2005 2004 $ Change (unaudited) (unaudited) Revenues : Owned off-campus properties $ 16,802 $ 10,456 $ 6,346 $ 59,239 $ 35,115 $ 24,124 On-campus participating properties 6,207 5,595 612 18,470 17,418 1,052 Third party development services 1,860 1,065 795 5,854 5,803 51 Third party management services 731 798 (67) 2,786 2,105 681 Resident services 449 268 181 1,125 382 743 Total revenues 26,049 18,182 7,867 87,474 60,823 26,651 Operating expenses: Owned off-campus properties 7,156 4,404 2,752 27,551 16,861 10,690 On-campus participating properties 2,291 2,122 169 8,325 7,995 330 Third party development and management services 2,323 1,422 901 6,969 5,543 1,426 General and administrative 1,891 1,314 577 6,714 5,234 1,480 Depreciation and amortization 4,328 2,823 1,505 16,471 9,973 6,498 Ground/facility leases 176 148 28 873 812 61 Total operating expenses 18,165 12,233 5,932 66,903 46,418 20,485 Operating income 7,884 5,949 1,935 20,571 14,405 6,166 Nonoperating income and (expenses): Interest income 327 25 302 825 82 743 Interest expense (4,607) (3,550) (1,057) (17,368) (16,698) (670) Amortization of deferredfinancing costs (336) (232) (104) (1,176) (1,211) 35 Other nonoperatingincome 849 556 293 1,279 927 352 Total nonoperating expenses (3,767) (3,201) (566) (16,440) (16,900) 460 Income (loss) before income taxes, minority interests, and discontinued operations 4,117 2,748 1,369 4,131 (2,495) 6,626 Income tax (provision) benefit (180) (29) (151) (186) 728 (914) Minority interests (79) (30) (49) (164) 100 (264) Income (loss) from continuing operations 3,858 2,689 1,169 3,781 (1,667) 5,448 Discontinued operations: Income (loss) attributabletodiscontinued operations -651 (651) (2) 367 (369) Gain (loss) fromdisposition ofreal estate ---5,883 (39) 5,922 Total discontinued operations -651 (651) 5,881 328 5,553 Net income (loss) $ 3,858 $ 3,340 $ 518 $ 9,662 $ (1,339) $ 11,001 Net income per share- basic $ 0.22 $ 0.26 $ 0.65 $ 0.14 (1) Net income per share- diluted $ 0.22 $ 0.26 $ 0.65 $ 0.15 (1) Weighted-average common shares outstanding: Basic 17,204,375 12,622,145 14,882,944 12,513,130 (1) Diluted 17,371,328 12,743,145 15,047,202 12,634,130 (1) (1) Share and per share amounts represent the period from August 17, 2004, the date of the Company's initial public offering, through December 31,2004. |