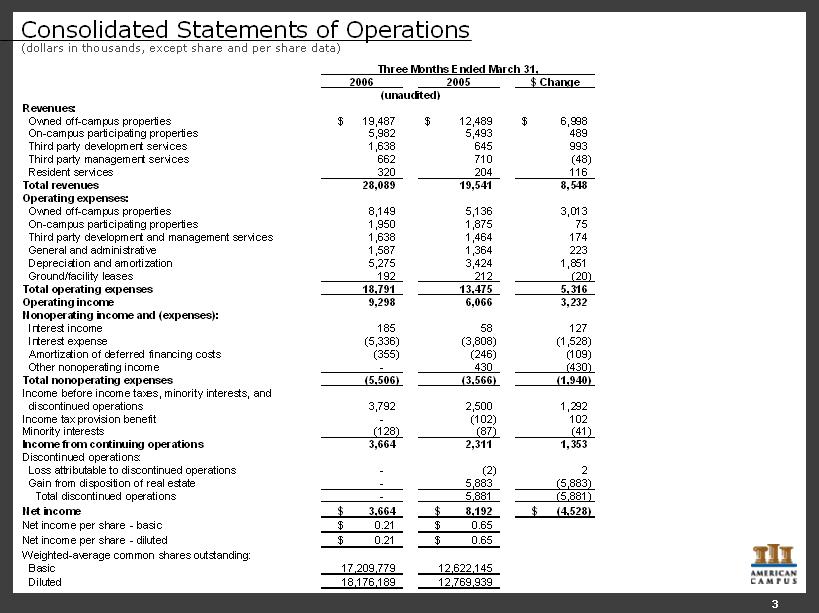
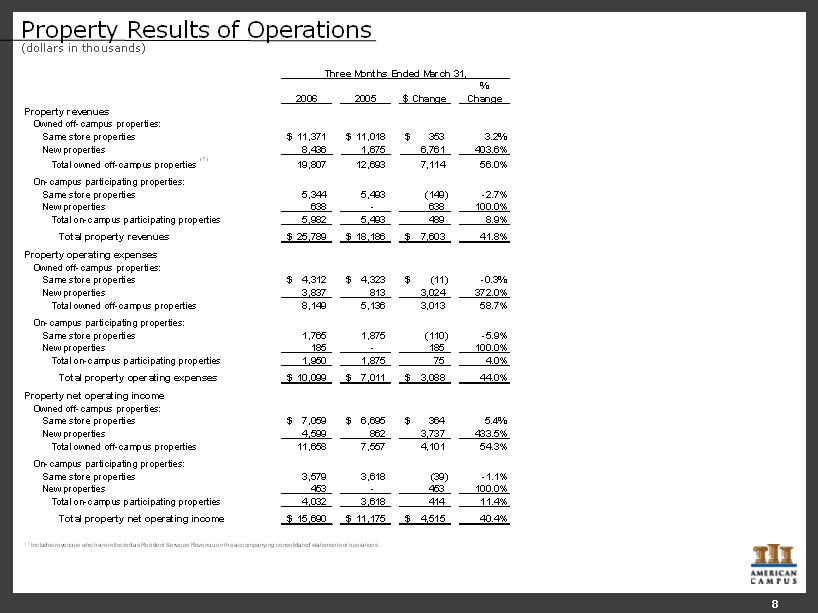
Consolidated Statements of Operations(dollars in thousands, except share and per share data) 2006 2005 $ Change Revenues: Owned off-campus properties 19,487 $ 12,489 $ 6,998 $ On-campus participating properties 5,982 5,493 489 Third party development services 1,638 645 993 Third party management services 662 710 (48) Resident services 320 204 116 Total revenues 28,089 19,541 8,548 Operating expenses: Owned off-campus properties 8,149 5,136 3,013 On-campus participating properties 1,950 1,875 75 Third party development and management services 1,638 1,464 174 General and administrative 1,587 1,364 223 Depreciation and amortization 5,275 3,424 1,851 Ground/facility leases 192 212 (20) Total operating expenses 18,791 13,475 5,316 Operating income 9,298 6,066 3,232 Nonoperating income and (expenses): Interest income 185 58 127 Interest expense (5,336) (3,808) (1,528) Amortization of deferred financing costs (355) (246) (109) Other nonoperating income -430 (430) Total nonoperating expenses (5,506) (3,566) (1,940) Income before income taxes, minority interests, and discontinued operations 3,792 2,500 1,292 Income tax provision benefit -(102) 102 Minority interests (128) (87) (41) Income from continuing operations 3,664 2,311 1,353 Discontinued operations: Loss attributable to discontinued operations -(2) 2 Gain from disposition of real estate -5,883 (5,883) Total discontinued operations -5,881 (5,881) Net income 3,664 $ 8,192 $ (4,528) $ Net income per share - basic 0.21 $ 0.65 $ Net income per share - diluted 0.21 $ 0.65 $ Weighted-average common shares outstanding: Basic 17,209,779 12,622,145 Diluted 18,176,189 12,769,939 Three Months Ended March 31, (unaudited) 3 |