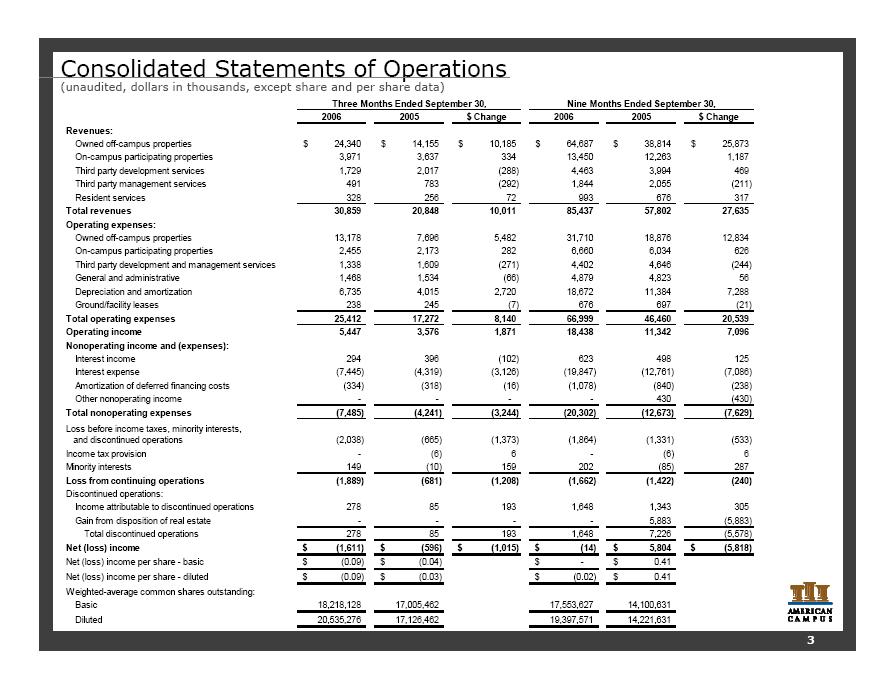
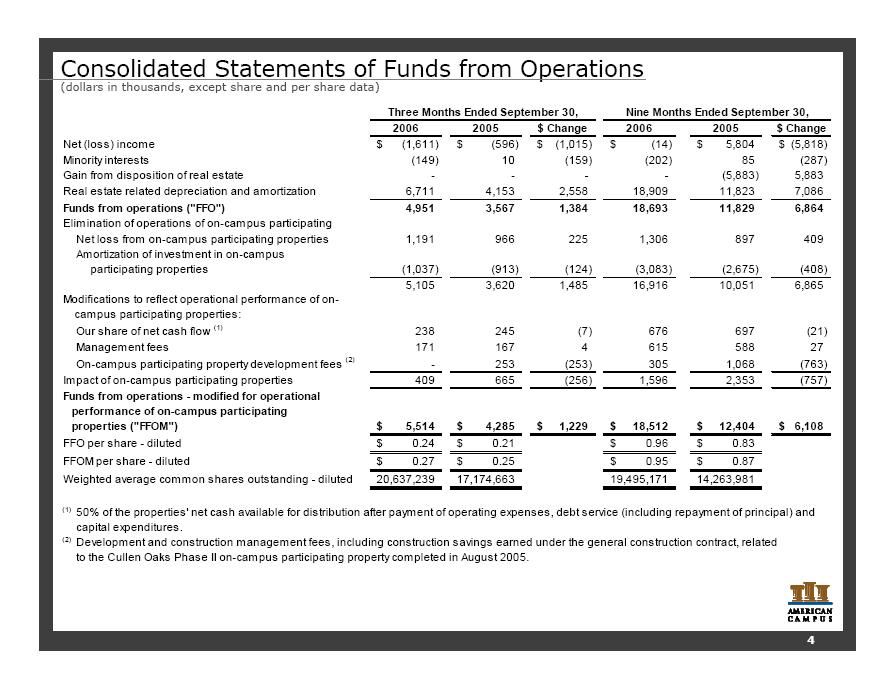
Consolidated Statements of Operations (unaudited, dollars in thousands, except share and per share data) Three Months Ended September 30, Nine Months Ended September 30, 2006 2005 $ Change 2006 2005 $ Change Revenues: Owned off-campus properties $ 24,340 $ 14,155 $ 10,185 $ 64,687 $ 38,814 $ 25,873 On-campus participating properties 3,971 3,637 334 13,450 12,263 1,187 Third party development services 1,729 2,017 (288) 4,463 3,994 469 Third party management services 491 783 (292) 1,844 2,055 (211) Resident services 328 256 72 993 676 317 Total revenues 30,859 20,848 10,011 85,437 57,802 27,635 Operating expenses: Owned off-campus properties 13,178 7,696 5,482 31,710 18,876 12,834 On-campus participating properties 2,455 2,173 282 6,660 6,034 626 Third party development and management services 1,338 1,609 (271) 4,402 4,646 (244) General and administrative 1,468 1,534 (66) 4,879 4,823 56 Depreciation and amortization 6,735 4,015 2,720 18,672 11,384 7,288 Ground/facility leases 238 245 (7) 676 697 (21) Total operating expenses 25,412 17,272 8,140 66,999 46,460 20,539 Operating income 5,447 3,576 1,871 18,438 11,342 7,096 Nonoperating income and (expenses): Interest income 294 396 (102) 623 498 125 Interest expense (7,445) (4,319) (3,126) (19,847) (12,761) (7,086) Amortization of deferred financing costs (334) (318) (16) (1,078) (840) (238) Other nonoperating income ----430 (430) Total nonoperating expenses (7,485) (4,241) (3,244) (20,302) (12,673) (7,629) Loss before income taxes, minority interests, and discontinued operations (2,038) (665) (1,373) (1,864) (1,331) (533) Income tax provision -(6) 6 -(6) 6 Minority interests 149 (10) 159 202 (85) 287 Loss from continuing operations (1,889) (681) (1,208) (1,662) (1,422) (240) Discontinued operations: Income attributable to discontinued operations 278 85 193 1,648 1,343 305 Gain from disposition of real estate ----5,883 (5,883) Total discontinued operations 278 85 193 1,648 7,226 (5,578) Net (loss) income $ (1,611) $ (596) $ (1,015) $ (14) $ 5,804 $ (5,818) Net (loss) income per share -basic $ (0.09) $ (0.04) $ -$ 0.41 Net (loss) income per share -diluted $ (0.09) $ (0.03) $ (0.02) $ 0.41 Weighted-average common shares outstanding: Basic 18,218,128 17,005,462 17,553,627 14,100,631 Diluted 20,535,276 17,126,462 19,397,571 14,221,631 |